Article

Assessment of Drought and Heat Tolerance of Durum Wheat Lines Derived from Interspecific Crosses Using Physiological Parameters and Stress Indices

1
International Center for Agricultural Research in the Dry Areas (ICARDA), Rabat 10000, Morocco
2
Plant and Microbial Biotechnology, Biodiversity and Environmental Research Center, Faculty of Sciences, Mohammed V University of Rabat, Rabat 10000, Morocco
3
Laboratory of Microbiology and Molecular Biology, Faculty of Sciences, Mohammed V University of Rabat, Rabat 10000, Morocco
4
Agricultural Research Corporation (ARC), P.O. Box 126, Wad Medani 21111, Sudan
*
Author to whom correspondence should be addressed.
Agronomy 2021, 11(4), 695; https://doi.org/10.3390/agronomy11040695
Submission received: 19 February 2021 / Revised: 29 March 2021 / Accepted: 1 April 2021 / Published: 6 April 2021
(This article belongs to the Special Issue Use of Wild Crop Relatives as Genetic Resources in Crop Breeding)

Abstract

:
Drought and high temperature are the major abiotic stresses for wheat production. The present study investigated the effect of drought and chronic heat stress on physiological parameters of durum wheat lines derived from interspecific crosses and their association with yield. Seventy-seven durum wheat lines were evaluated during two seasons (2016–2017 and 2017–2018) for drought tolerance at Tessaout (Morocco) using irrigated and rainfed treatments and for heat tolerance at Wad Medani (Sudan). Five drought screening indices (alone or combined) and physiological parameters were used to assess drought and heat tolerance. Among the physiological parameters used, canopy temperature (CT) had moderate heritability and was significantly affected by both severe and moderate drought stresses. CT at early heading showed a stronger correlation with grain yield (GY) and total biomass (BY) under heat stress. The use of maximum quantum yield of PSII (Fv/Fm) for drought/heat screening was limited by the low genetic variation despite its significant correlation with yield under drought (r2 = 0.22) and heat (r2 = 0.4). The normalized difference vegetation index (NDVI) at vegetative stage was highly correlated with GY and BY and it showed high genotypic variation that can allow for efficient selection. The grain filling rate (GFR) was found to be highly correlated with GY and BY under heat stress. The modified stress tolerance index (MsSTI) had the highest association with GY under drought (R2 = 0.82) while the mean productivity (MP) was adapted to both optimal conditions (R2 = 0.77) and drought stress (R2 = 0.73). The computation of a mean score index (MSI) improved the selection efficiency under drought (R2 = 0.92). The results showed good potential for lines derived from wide crosses to increase variability for heat and drought adaptive physiological traits.

1. Introduction

Drought and heat are the major abiotic stresses affecting wheat productivity in the world. The global wheat area exposed to drought doubled between 1979 and 2006 [1] and the future availability of water to meet crop requirements will be a major challenge in arid and semi-arid regions [2]. Global wheat production is expected to decrease by 4.1% to 6.4% for every 1 °C increase in temperature as warming is already slowing yield gains in the majority of wheat production areas [3,4].
These two abiotic stresses can occur at different wheat growth stages and affect several morphological, physiological, and molecular plant processes [5,6] resulting in significant yield losses [7,8,9,10]. These complex changes in addition to the high genotype by environment interaction limit the effectiveness of empirical selection for drought and heat tolerance [11,12], especially under the fluctuations of Mediterranean environments [11]. Therefore, the development of drought and heat tolerant wheat cultivars requires an integrated breeding strategy that includes screening techniques for physiological and morphological adaptive traits in addition to the molecular tools to harness diverse genetic resources [6,13,14,15,16].
For instance, canopy temperature (CT) was reported to be useful to select for water-stressed environments and high correlation with grain yield (GY) was found for CT measured at anthesis halfway and grain filling stages [17,18]. CT is an integrative measurement that is correlated with other physiological mechanisms. Cooler CT was associated with root spreading in bread wheat [19] and the its association with genetic gains in hot conditions was established [20,21]. CT is also influenced by the stomatal control of transpiration as stomatal closure under reduced water status results in an increase of CT [22]. The negative correlation between CT and grain yield, plant height, and heading time suggests that a cooler canopy provides yield benefits at both drought and heat stresses. These benefits are more pronounced under heat stress [23].
Drought and heat stresses affect the photosynthetic activity by reducing the chlorophyll content [24,25] and damaging the photosystem II reaction sites [26,27]. Chlorophyll content measurement provides information on the health status of the leaf [28] while chlorophyll fluorescence informs about the effectiveness in using the energy absorbed by the chlorophyll to diagnose the onset of photo-inhibition [29]. Both traits were reported to be valuable for wheat breeding. Chlorophyll fluorescence was found to be useful for evaluating yield performance under rainfed Mediterranean conditions when measured during grain filling period [7,30]. The maximum quantum yield of PSII (Fv/Fm) represents the most meaningful chlorophyll fluorescence reading [27], as it measures the efficiency of light harvesting and the conversion to chemical energy [31]. Fv/Fm was identified as a suitable trait to screen for tolerance to high temperatures [31] and several quantitative trait loci (QTLs) were identified for fluorescence parameters under heat stress [32]. Chlorophyll content showed a correlation with grain yield and thousand kernel weight under heat and drought stresses [33,34] and it was found negatively correlated with the heat susceptibility index [35].
Broadening the genetic base for these physiological adaptive traits requires access to novel diversity, which can be supplied by crop wild relatives [36]. Screening of wheat wild relatives identified several donors for useful traits in wheat breeding [37]. Triticum monococcum subsp. aegilopides showed more potential to improve relative water content for drought tolerance than tetraploid and hexaploid wheat species [5]. Aegilops geniculata and Triticum dicoccoides were identified as sources for chlorophyll and photosynthesis-related traits to improve drought and heat tolerance [38,39]. Screening under field conditions identified a higher level of heat tolerance during a vegetative stage in Aegilops speltoides and Aegilops tauschii [40]. Nachit and Elouafi [41] reported several durum wheat lines generated through interspecific hybridization combining adaptation to dry conditions with high yield potential. In addition to physiological and morphological mechanisms involved in drought tolerance, several indices were proposed to screen for drought adaptation. Fischer and Maurer [42] suggested the drought susceptibility index (DSI), Rosielle, and Hamblin [43] developed the mean productivity (MP) and tolerance (TOL) while the drought tolerance index (DTI) was suggested by Fernandez [44]. Farshadfar and Sutka [45] introduced a correction coefficient to DTI and proposed a modified stress tolerance index (MsSTI). All these indices consider the performance of the genotypes under optimal and stressed conditions to separate susceptible genotypes from tolerant genotypes.
These indices were used extensively to screen and select genotypes for drought tolerance [46,47,48,49]. Tolerance and susceptibility indices can select genotypes with specific adaptation to drought stressed or favorable environments, and also genotypes combining high yield under both types of environments. There is some variation in the ability of these indices to select effectively suitable genotypes for dry environments, which suggests that their combination can be useful to achieve higher selection efficiency [50]. The objectives of this study are: (i) assess the heritability of some physiological traits and their association with grain yield under drought and heat stresses, (ii) examine the ability of tolerance indices and their combination to select the best genotypes for drought stress, and (iii) select pre-breeding lines from a durum wheat population derived from interspecific crosses with high yield potential and good levels of drought and tolerance.

2. Materials and Methods

2.1. Plant Material and Field Conditions

The study was conducted with 77 lines of durum wheat (Triticum turgidum var. durum) including 67 lines derived from wide crosses, eight checks, and the two recurrent parents (Table S1). The durum derivatives are the result of interspecific crosses between two durum wheat cultivars (Cham 5 and Haurani) and Triticum turgidum subsp. dicoccoides (Syn Triticum dicoccoides), Triticum monococcum subsp. aegilopoides (Syn Triticum boeoticum), Triticum urartu, and Aegilops speltoides. Haurani is a locally adapted Syrian landrace with low yield potential but drought tolerant while Cham 5 is a high yielding variety released in Syria from ICARDA supplied germplasm. The wild parents were selected based on the ecology of their collecting sites and their disease resistance. Repeated backcrosses followed the initial hybridization to restore fertility and break the undesirable gene linkages. The derivative lines showed high variation for agro-morphological traits and resistance to yellow and leaf rust [51].

2.2. Field Conditions

The screening trials for drought and heat were conducted during the two seasons (2016–2017 and 2017–2018). For drought tolerance screening, the trials were conducted at the Tessaout experimental station (31°49′ N, 7°25′ W) in Morocco. Tessaout is characterized by frequent droughts with average annual precipitations of 266 mm. Two trials were established each season. The first trial is non-stressed under full irrigation (TSIR) and the second trial is under rainfed conditions (TSRF), representing the drought stressed. Both trials were irrigated at sowing to ensure homogeneous germination and emergence. TSIR received five additional irrigations at different growth stages. The heat tolerance screening was conducted at a heat research platform at wad Medani (WMD), Sudan (14°24′ N, 33°31′ E, Altitude 407 m). WMD is characterized by a hot season with a temperature ranging between 18 °C and 36 °C on average. The trials were irrigated at an interval of 7 to 10 days to avoid the confounding effect of drought and heat.
Each trial was randomized in an incomplete block design (alpha-lattice) with two replications. Each replicate consisted of 11 blocks with seven genotypes in each. The plots were laid out in 4 rows of 2 m long with a sowing density of 300 seeds per m2. The distance between rows was 0.30 m. The optimal agronomic practices in terms of fertilizers, weeding, and fungicides recommended for each location were applied.

2.3. Data Collection

At Tessaout, the collected traits were grain yield (GY) and biological yield (BY) estimated from the two internal rows in each plot avoiding the border and converted to Kg/ha. Number of days to the heading (DHE) recorded when 50% of each plot reached the heading and thousand kernel weight (TKW) was estimated by counting and weighing 500 seeds. When both trials (TSIR and TSRF) were at heading, the canopy temperature (CT) was recorded using a thermal camera (FLIR T460). The pictures were analyzed with FLIR tools (Version 5.5.16064.1001) to estimate the CT of each plot. Chlorophyll fluorescence was measured on the dark adapted flag leaf of three random plants from the internal rows in each plot using Fluorometer OS30p+. CT and chlorophyll fluorescence were measured at sunny days between 12.00 and 2.00 p.m.
At WMD, the normalized difference vegetation index (NDVI), chlorophyll content (CHL), and CT were measured at the heading time and grain filling period in 2017. During the second season (2017–2018), an additional third measurement was performed at the vegetative stage. The maximum air temperature was always higher than 35 °C at the day of measurements during both seasons (Table 1). CT was measured with a hand-held infrared thermometer (Center 325). Each measurement represents the average of three random readings in each plot. CHL was measured using a chlorophyll meter (Minolta SPAD-502). Each measurement represents the average of five readings performed on random plants. NDVI measurements were collected using a greenseeker following the manufacturers’ instructions. At WMD, the readings of all physiological traits were taken during clear days under sunny conditions between 1:00 p.m. and 3:00 p.m. GY and BY were estimated similarly to that at Tessaout and the grain filling rate (GFR) was calculated by Pinto et al. [52]
G F R =   g r a i n   y i e l d   K G .   h a 1 g r a i n   f i l l i n g   p e r i o d   d a y s

2.4. Statistical Analysis and Tolerance Indices

Data from Tessaout and WMD were analyzed separately with two stages analysis for each location. Linear mixed models were used for both first and second stage analysis, with replication and block effects nested in each trial as random effects. The first stage analysis was conducted using lme4 [53] and sommer [54] in R software [55].
At Tessaout, the water regime, year, and their interaction were used as fixed effects for the first stage, while the genotypes were considered as random effects. A diagonal structure variance across years and water regimes was used to compute the genotypic variance and heritability in each environment (combination of year and water regime). The broad sense heritability in each environment was computed by Falconer and Mackay [56].
H 2 = Var   ( G ) Var   G +   Var   ( e ) r
where Var (G) is the genotypic variance, Var (e) is the error variance, and r is the number of replications.
The second stage analysis was performed using meta-R software [57] to assess the genotype by environment interaction (G × E). Both genotypes and G × E were used as random effects for this analysis. Only environments with heritability above 0.10 were included in G × E analysis. Meta-R was also used to compute the best linear unbiased estimations (BLUEs) of all traits in each environment. The BLUEs across years at each water regime were computed for GY. They were used for computing drought tolerance/susceptibility indices.
Five tolerance and susceptibility indices were computed to assess the drought impact on the yield and select tolerant genotypes (Table 2). The methodology suggested by Thiry et al. [50] was then used to score the genotypes based on their ranking within the population for each index. The range of each index allowed us to define 10 groups with each representing 10% of the population. The genotypes were then scored from 1 to 10 with 10 representing the most desirable genotypes for that index. The scores’ attribution provides more flexibility to test a different combination and improve the selection efficiency. The scores were used to perform and plot a hierarchical clustering analysis using the packages maptree, dendextend, gclus, and cluster [58,59,60,61] in R software [55].
At WMD, the first stage analysis was performed considering the year as a fixed effect and genotypic variance was estimated for each year similarly to Tessaout. For all traits, the year with zero or low heritability (<0.10) was excluded from the G × E analysis of variance. The BLUEs in each year were computed for all traits using Meta-R [57].
The Hmisc Package [62] was used to compute the phenotypic Pearson correlation coefficients among traits at Tessaout and WMD. The linear regression analysis and scatterplots were performed with ggpubr package [63].

3. Results

3.1. Climatic Data

Climatic data showed the difference between the two seasons at Tessaout where the second season had more favorable growing conditions, especially during the reproductive stage. Despite the difference in heading time between TSIR and TSRF, the average maximum temperature during the reproductive stage was not different between TSIR and TSRF. In addition, the second season received more precipitations at both vegetative (167.4 mm) and reproductive (87.6 mm) stages. At WMD, the temperature was consistently high during all growth stages in both seasons. The first season was characterized by a higher maximum temperature during the vegetative stage (36.05 °C) in comparison to the second season (33.9 °C). This is also valid for the minimum temperature that averaged 18.24 °C in 2016–2017 and 16.3 °C in 2017–2018 during the vegetative stage. The opposite was observed during the reproductive stage as the average minimum and maximum temperatures were higher during 2017–2018 (Table 3). No rainfall was registered at WMD during both seasons.

3.2. Drought Screening

3.2.1. Analysis of Variance

The application of two water regimes at Tessaout (Irrigated/Rainfed) resulted in highly significant differences in GY and other measured traits. Only Fv/Fm was less affected by the water regime. However, the year effect on this trait was higher. The interaction between the year and water regime was significant for GY and other agronomic traits, while it was not significant for CT and Fv/Fm (Table 4). In terms of the genotypic effect, it was consistently significant over years and trials for DHE, TKW, and GY, which was associated with high heritabilities for these traits (Table 4). The effect of the genotypes was significant for Fv/Fm only at TSRF-17 (h2 = 0.56) and TSIR-18 (h2 = 0.48) while, at TSIR-17 and TSRF-18, no genetic contribution to the variance of this trait was observed. The genotypic effect of CT was significant during the two seasons under both irrigated and rainfed conditions. The highest CT heritability was observed at TSIR-17 (0.52). Higher heritability was expressed for BY under drought stress in comparison to optimally irrigated conditions during both seasons (Table 4).
The genotype by environment (G × E) analysis showed a significant G × E interaction for all the measured traits except for BY. The year-to-year fluctuations for all traits, especially under the rainfed conditions, are summarized in Table 5. At TSRF, the mean GY doubled in the second season as it went from 2253 kg/ha to 4561 kg/ha. Similarly, TKW and BY under rainfed conditions increased by 53% and 57%, respectively, in 2018. Days to heading in 2018 ranged between 97 and 113 days. This range was wider than the first season despite similar means for both seasons. At TSIR, the effect of year on GY and other agronomic traits was less important. Only TKW showed an increase during the second season under irrigated conditions (Table 5).
The comparison of the performance between TSRF and TSIR showed that drought stress was more severe in the first season with an average decrease of 62% in GY, compared to only 13% reduction in the second season. This observation is also valid for TKW, which was reduced by 33% due to drought stress in 2017. Similarly, the total biomass showed 41% and 17% reductions under drought stress in 2017 and 2018, respectively.
For the physiological parameters, the G × E interaction was significant for both CT and Fv/Fm. However, for Fv/Fm, only two environments (TSRF-2017 and TSIR-2018) were included in the G × E analysis because no genetic variation was observed in other environments. All the genotypes had higher CT under drought stress during both seasons.
The canopy temperature was more affected by the drought during both seasons and all the genotypes had higher CT under drought stress. On average, the lines at TSIR were 3.2 and 4.6 °C cooler than at TSRF in 2017 and 2018, respectively. The first season was characterized by a higher average CT at both TSIR (23.16 °C) and TSRF (26.4 °C) in comparison to the second season where CT ranged between 18.8 °C at TSIR and 23.4 °C at TSRF (Figure 1).
Wider ranges of Fv/Fm were registered in the environments where heritability was high. At TSRF (2017), Fv/Fm ranged from 0.60 to 0.74 with an average of 0.68. This range was similar to what was observed under irrigated conditions in the second season (0.62–0.75) where the average was 0.69. The low heritability did not allow us to assess the genotypic response of Fv/Fm to drought stress in each season (Table 5).

3.2.2. Correlation Results

The correlation results showed a cluster of GY, BY, and TKW. These traits were highly correlated to each other under both optimal and drought-stressed conditions. BY has a higher correlation with GY under rainfed conditions during both seasons while TKW was more correlated to GY under optimal conditions (Table 6). DHE was significantly correlated with GY only in the second season with higher correlation under drought stress (r2 = −0.39) in comparison to optimal conditions (r2 = −0.31). The correlation between GY and CT was not significant under any of the environments. However, it was consistently negative across years and water regimes and it was higher under drought stress. Considering only the environments where there was a genotypic effect, Fv/Fm was significantly correlated to GY at TSRF-17 (r2 = 0.22) and TSIR-18 (r2 = 0.24). The correlation between Fv/Fm and DHE was significantly negative at both TSIR-18 (r2 = −0.40) and TSRF-17 (r2 = 0.41). The correlation between BY and CT was consistently negative, but was significant only at TSIR-17 (r2 = −0.29). A significant positive correlation was found between the heading time and CT at TSRF in the second season (r2 = 0.35).

3.2.3. Drought Screening Indices

The drought tolerance indices had different associations to GY under optimal and drought stress conditions. Tolerance (TOL) showed no ability to select desirable genotypes for drought stress (R2 = 0.0038). In addition, it was not highly correlated to GY at TSIR (R2 = 0.39). In fact, some lines within the best ranking group (10), according to TOL, were among the lowest yielding lines under both conditions (Figure 2). DTI and MP were more effective in the identification of drought tolerant lines. However, MP was more suitable for yield potential selection (R2 = 0.77) than DTI (R2 = 0.58). The drought susceptibility index (DSI) failed to distinguish between the genotypes based on the performance at TSIR (R2 = 0.012) and it had a moderate ability to select superior genotypes under drought stress (R2 = 0.35). The highest association to GY under drought stress was observed with MsSTI (R2 = 0.89). The genotypes with scores 8, 9, and 10 were the highest yielding at TSRF. Simultaneously, the desirable lines according to MsSTI included high yielding lines under optimal conditions. This highlights the ability of this index to select for both environments.
In order to increase the selection efficiency for drought tolerance, a mean score index (MSI) [50] was computed based on the indices that were effective to select good genotypes at TSRF. Therefore, TOL was excluded when calculating MSI.
MSI =   S c o r e   M P + S c o r e   D T I + S c o r e   D S I + S c o r e   M s S T I 4
The coefficient of determination between MSI and GY at TSRF was 0.92. This association is higher than those for all indices taken individually (Figure 3). MSI allowed a clear distinction between the different groups of genotypes. Based on the MSI, 19 genotypes were selected as the most stable lines under drought (Table S2). Six lines of this subset were ranked among the highest yielding at TSIR (129080, 142013, 142074, 141997, 142026, and Louiza). The advantage of MSI over MsSTI is the inclusion of more lines with specific adaptation to drought stress.
The clustering based on the DSI, DTI, TOL, MP, and MsSTI resulted in the identification of five different groups of genotypes (Figure S1). The most desirable lines were grouped in the fourth group. They combine adaptation to drought with high yield potential (Figure 4). This group included four checks (Louiza, Faraj, Icarachaz, and Cham 1) and 10 lines derived from interspecific crosses. The derivative lines in this group originated from crosses between Cham 5 and Aegilops speltoides, Triticum dicoccoides, T. urartu, and T. aegilopoides. The clustering confirmed that MSI was highly effective in selecting most performant lines under drought stress. MSI combined the highest yielding lines at TSRF from the two groups (4 and 5) (Figure 4).

3.3. Heat Screening

3.3.1. Analysis of Variance

The results of the analysis of variance showed that the year and its interaction with the genotypes were highly significant for GY, BY, and GFR. Canopy temperature at early heading (CTh) and during grain filling (CTf) were significantly affected by the season, but their interactions with the genotypes were not significant. The year and G × E effects were not computed for NDVIv, CTv, CHLv, and Fv/Fm as data was available for only one season. The lowest genotypic variance was observed in 2017 for CHLh, CHLf, and NDVIh (Table 7).
The heritability of most of the traits was higher in the second year and reached 0.9, 0.82, and 0.81 for GY, BY, and GFR, respectively. For the physiological parameters, higher heritability was observed for NDVIv (0.79) measured at the vegetative stage and for CHLh (0.62) in 2018. In comparison to CTf measured at grain filling, CTh had higher heritability (0.43) associated with significant differences between the genotypes in 2018. Cooler CT was observed for lines derived from both recurrent parents to Ae. Speltoides, Triticum dicoccoides, and Triticum aegilopides in addition to the checks Faraj and Louiza.
The highest genetic variation for Chlorophyll content was observed in 2018 at the heading stage (CHLh) with a heritability of 0.62 and significant genotypic effect. The first season was characterized by zero heritability for both CHLh and CHLf. For NDVI, higher heritability was observed when measured at an early vegetative stage. NDVIv heritability reached 0.79 with a significant genotypic effect in 2018 while NDVIh had lower heritabilities during both seasons in comparison to other NDVI measurements. The lines derived from crosses with T. aegilopoides, T. urartu, and T. dicoccoides showed high variation for NDVI with high variability between the lines derived from the same cross.
Fv/Fm measured at heading stage ranged from 0.62 to 0.73 with a heritability of 0.22 in 2018. The second season was characterized by an increase in GY, BY, and GFR with their average increase by 58%, 20%, and 55%, respectively. Simultaneously, CTh and CTf had wider ranges with a decrease on average (Table 7).

3.3.2. Association of Physiological Traits to Grain Yield and Total Biomass

Canopy temperature measured at different stages did not show a significant association with GY during 2017. However, during the second season, a significant negative association was observed between GY and both CTv and CTf. The strongest correlation was observed with the first measurement (CTv, R = −0.35) and it decreased with the second (CTh, R = −0.26) and the third (CTf, R = −0.22) measurements (Figure 5). Cooler canopy was consistently associated with higher biomass during both seasons. The highest association to BY was observed with CTh in the second season (R = −0.62). The lines 142,072, 142,068, and the check Faraj maintained a cooler temperature during all the reproductive stages (CTh and CTf) combined with high biomass. In addition, the line 142,068 was among the highest yielding genotypes in 2018 with a GY of 3317 kg/ha.
NDVIv had the highest correlation with BY in 2018 (R = 0.75) and GY (R = 0.32). This association decreased during the cycle and was not significant during grain filling. In 2017, the correlation between BY and NDVI was not significant for all the three measurements (Figure 6). In 2017, NDVIh and NDVIf correlated negatively with GY. It is also important to mention that some winter/facultative genotypes headed very late and produced a very low yield.
Chlorophyll content did not correlate significantly with GY and BY. Despite the higher correlation value between CHL and BY in comparison to GY, it was not significant (Figure 7). No difference was observed with regard to the time of measurement under continuous heat stress for CHL. The highest association with grain yield was obtained with GFR in 2018 (R = 0.93) and this correlation decreased to 0.56 in 2017. Fv/Fm collected at heading showed a significant correlation with GY (R = 0.4) in 2018 (Figure 8).

4. Discussion

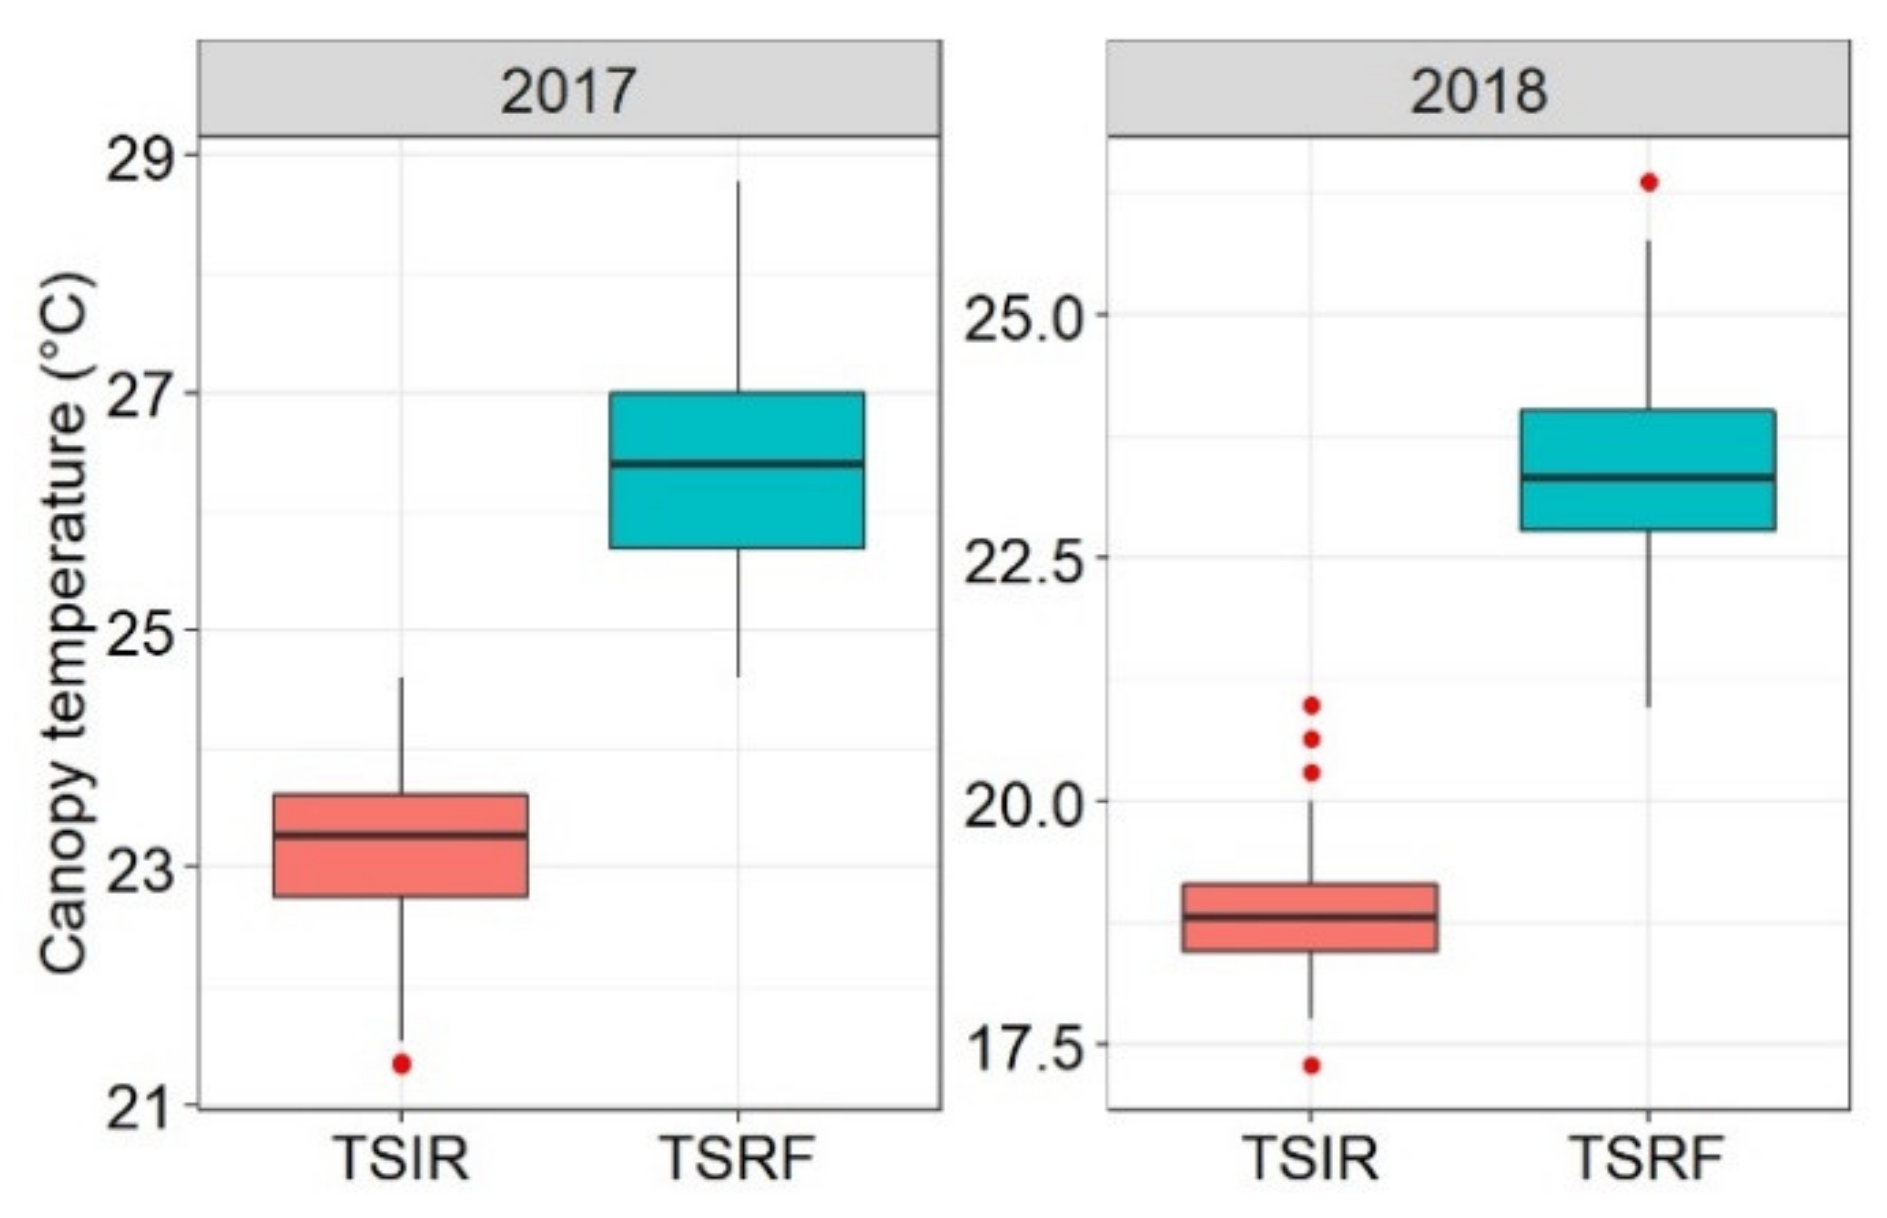
At Tessaout, the drought penalty on the yield varied with the season rainfall and was more severe in the first season, reflecting the unpredictable climate in which wheat is exposed to in the Mediterranean region. Under these conditions, varieties, which are drought tolerant and having high yield potential under more favorable conditions, are needed to ensure higher and more stable yields. The maximum temperature at WMD was consistently above 30 °C throughout the crop cycle, confirming the choice of this site as a research platform for heat tolerance breeding.
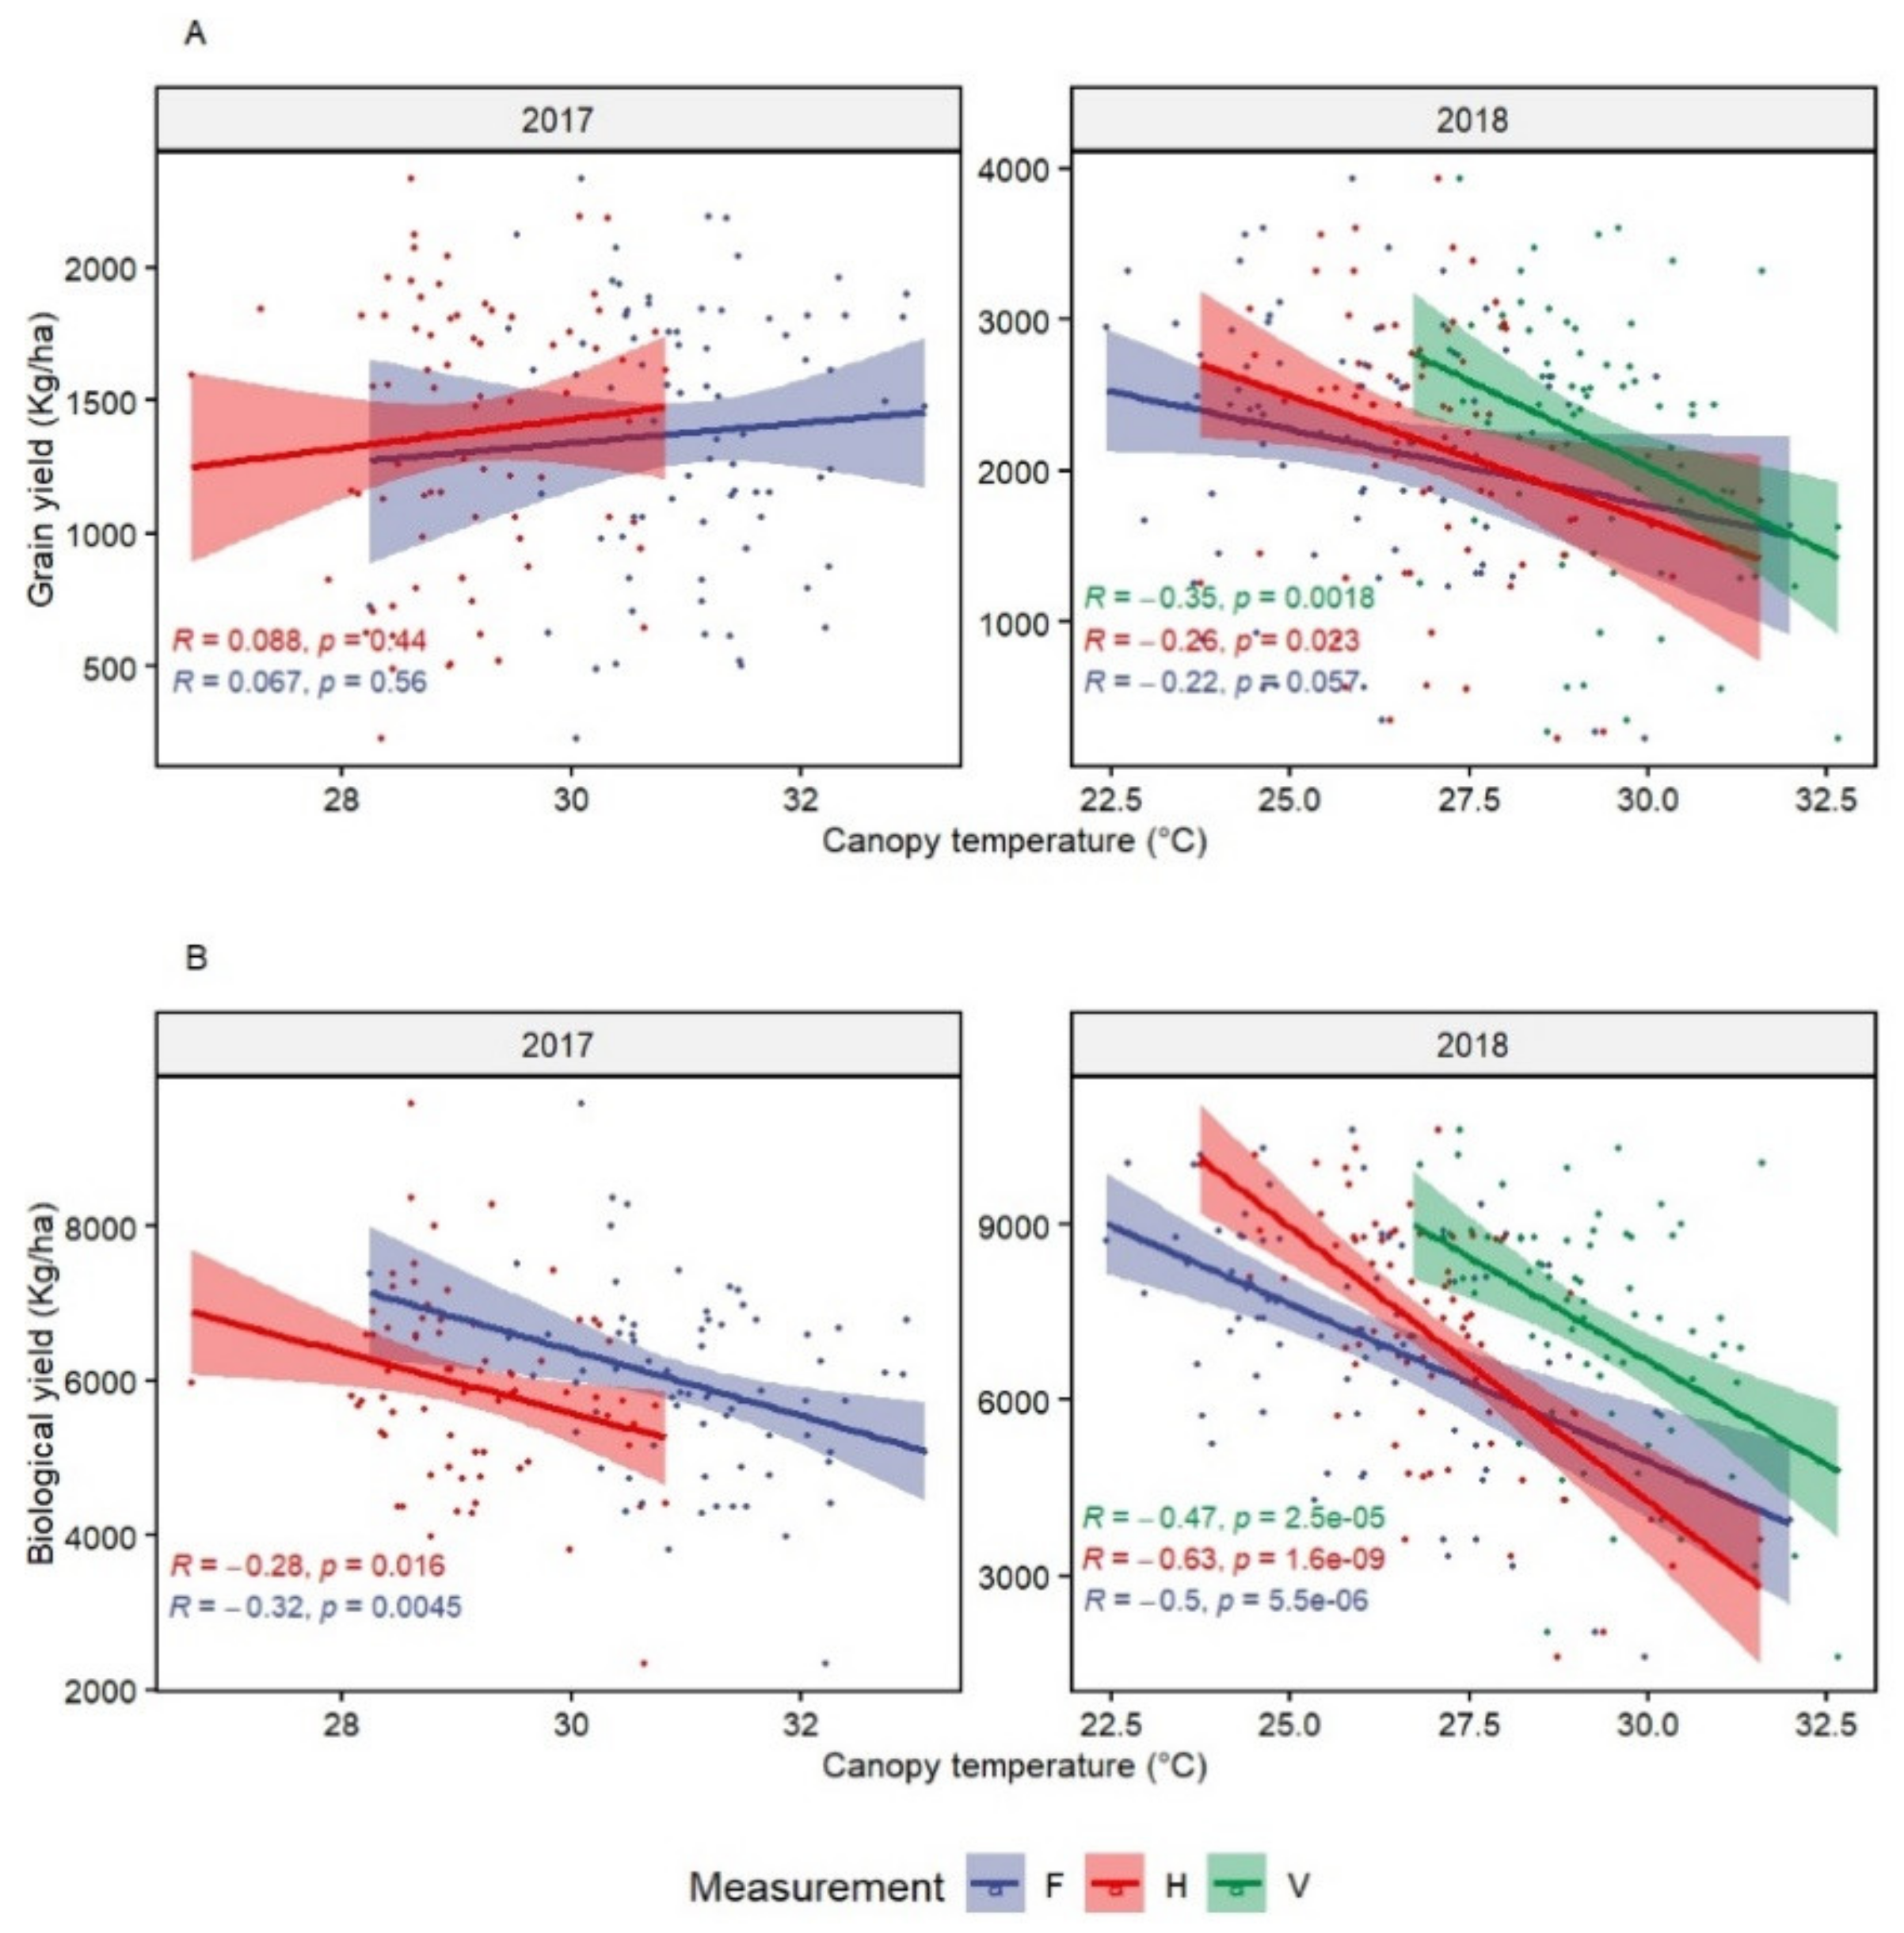
The results showed the potential to exploit the genotypic variation for CT to select for drought and heat tolerance. CT was more useful under heat than drought stress, as it is significantly correlated with both GY and BY and it had moderate heritability. The CT correlations with other traits under drought were not significant. However, it can be considered a secondary physiological trait to increase the probability of additive gene action for drought adaptation, as suggested by Reynolds et al. [64]. Previous studies have reported an advantage of the CT measurement during grain filling for both genetic variations and correlations to GY under drought [17,47]. In fact, grain filling is the most vulnerable stage to drought stress [65], which can allow to identify tolerant from susceptible genotypes.
Taking into consideration the balance between high genotypic variation and strong association to GY and BY, the present results suggest that early heading stage is suitable to use CT for heat tolerance screening. CTv can also be recommended because of its high association to GY and BY, which could be explained by the fact that, under continuous heat stress, heat damage increases through the cycle and genotypes that can avoid early thermal shock will accumulate less damage in later stages. Lines with higher biomass had cooler CT during all stages, which is important, as BY explained the highest variation in GY at WMD [10]. Cooler CT and higher BY are associated with deeper root systems and root spreading, contributing to avoidance of heat stress as reported by previous studies [19,20,66]. The importance of CT in heat tolerance was confirmed by many studies, which also identified several marker-trait associations and QTLs for canopy temperature under heat stress [18,67,68,69]. Some of these QTLs had pleiotropic effects on grain yield and other related traits.
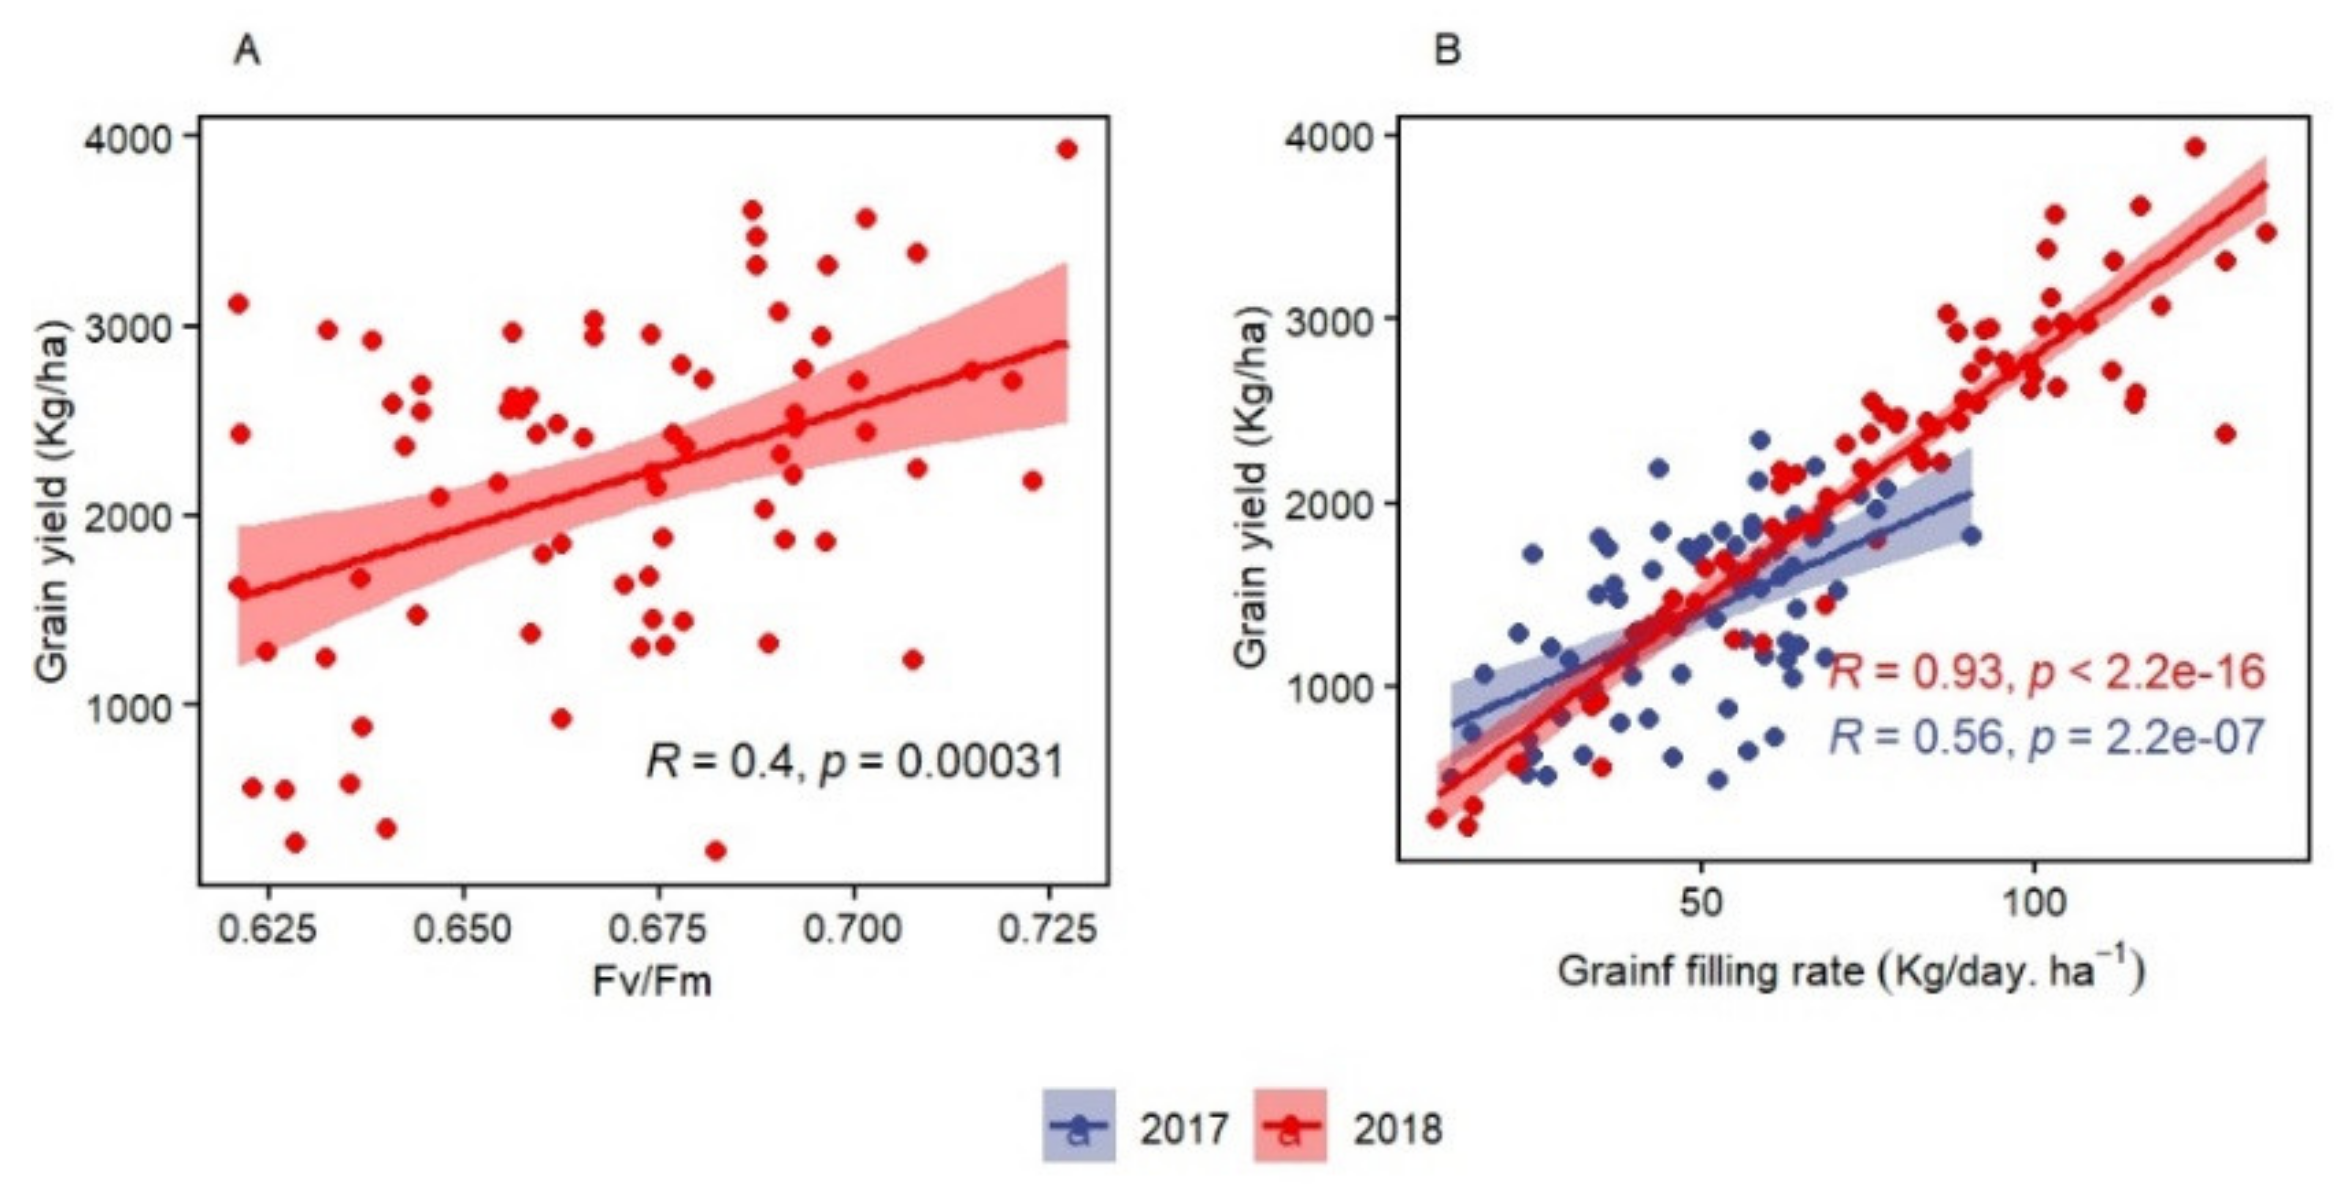
For chlorophyll fluorescence parameters, the correlation between Fv/Fm and GY under rainfed conditions at Tessaout and at WMD was significant, which suggests Fv/Fm as an effective selection criteria for both drought and heat tolerance. However, low and inconsistent heritability could be the major limitation for Fv/Fm to select in early generations. Low [30] to moderate [70] heritabilities were reported for Fv/Fm under drought stress with significant correlation to GY. However, high heritability was found at anthesis for terminal heat stress [32] and under controlled (heat stressed) conditions at seedling stage [71]. Drought was reported to damage the PSII and decrease Fv/Fm [26,72,73]. In the present study, the limited genetic variation for Fv/Fm did not allow us to compare TSIR and TSRF during the same season in order to assess this damage. Chlorophyll fluorescence showed more potential to be used for heat than drought screening as the correlation with GY was higher at WMD. In addition, the Fv/Fm range at WMD was lower than what is reported for healthy plants [74], confirming the effect of continuous heat stress on Fv/Fm [35].
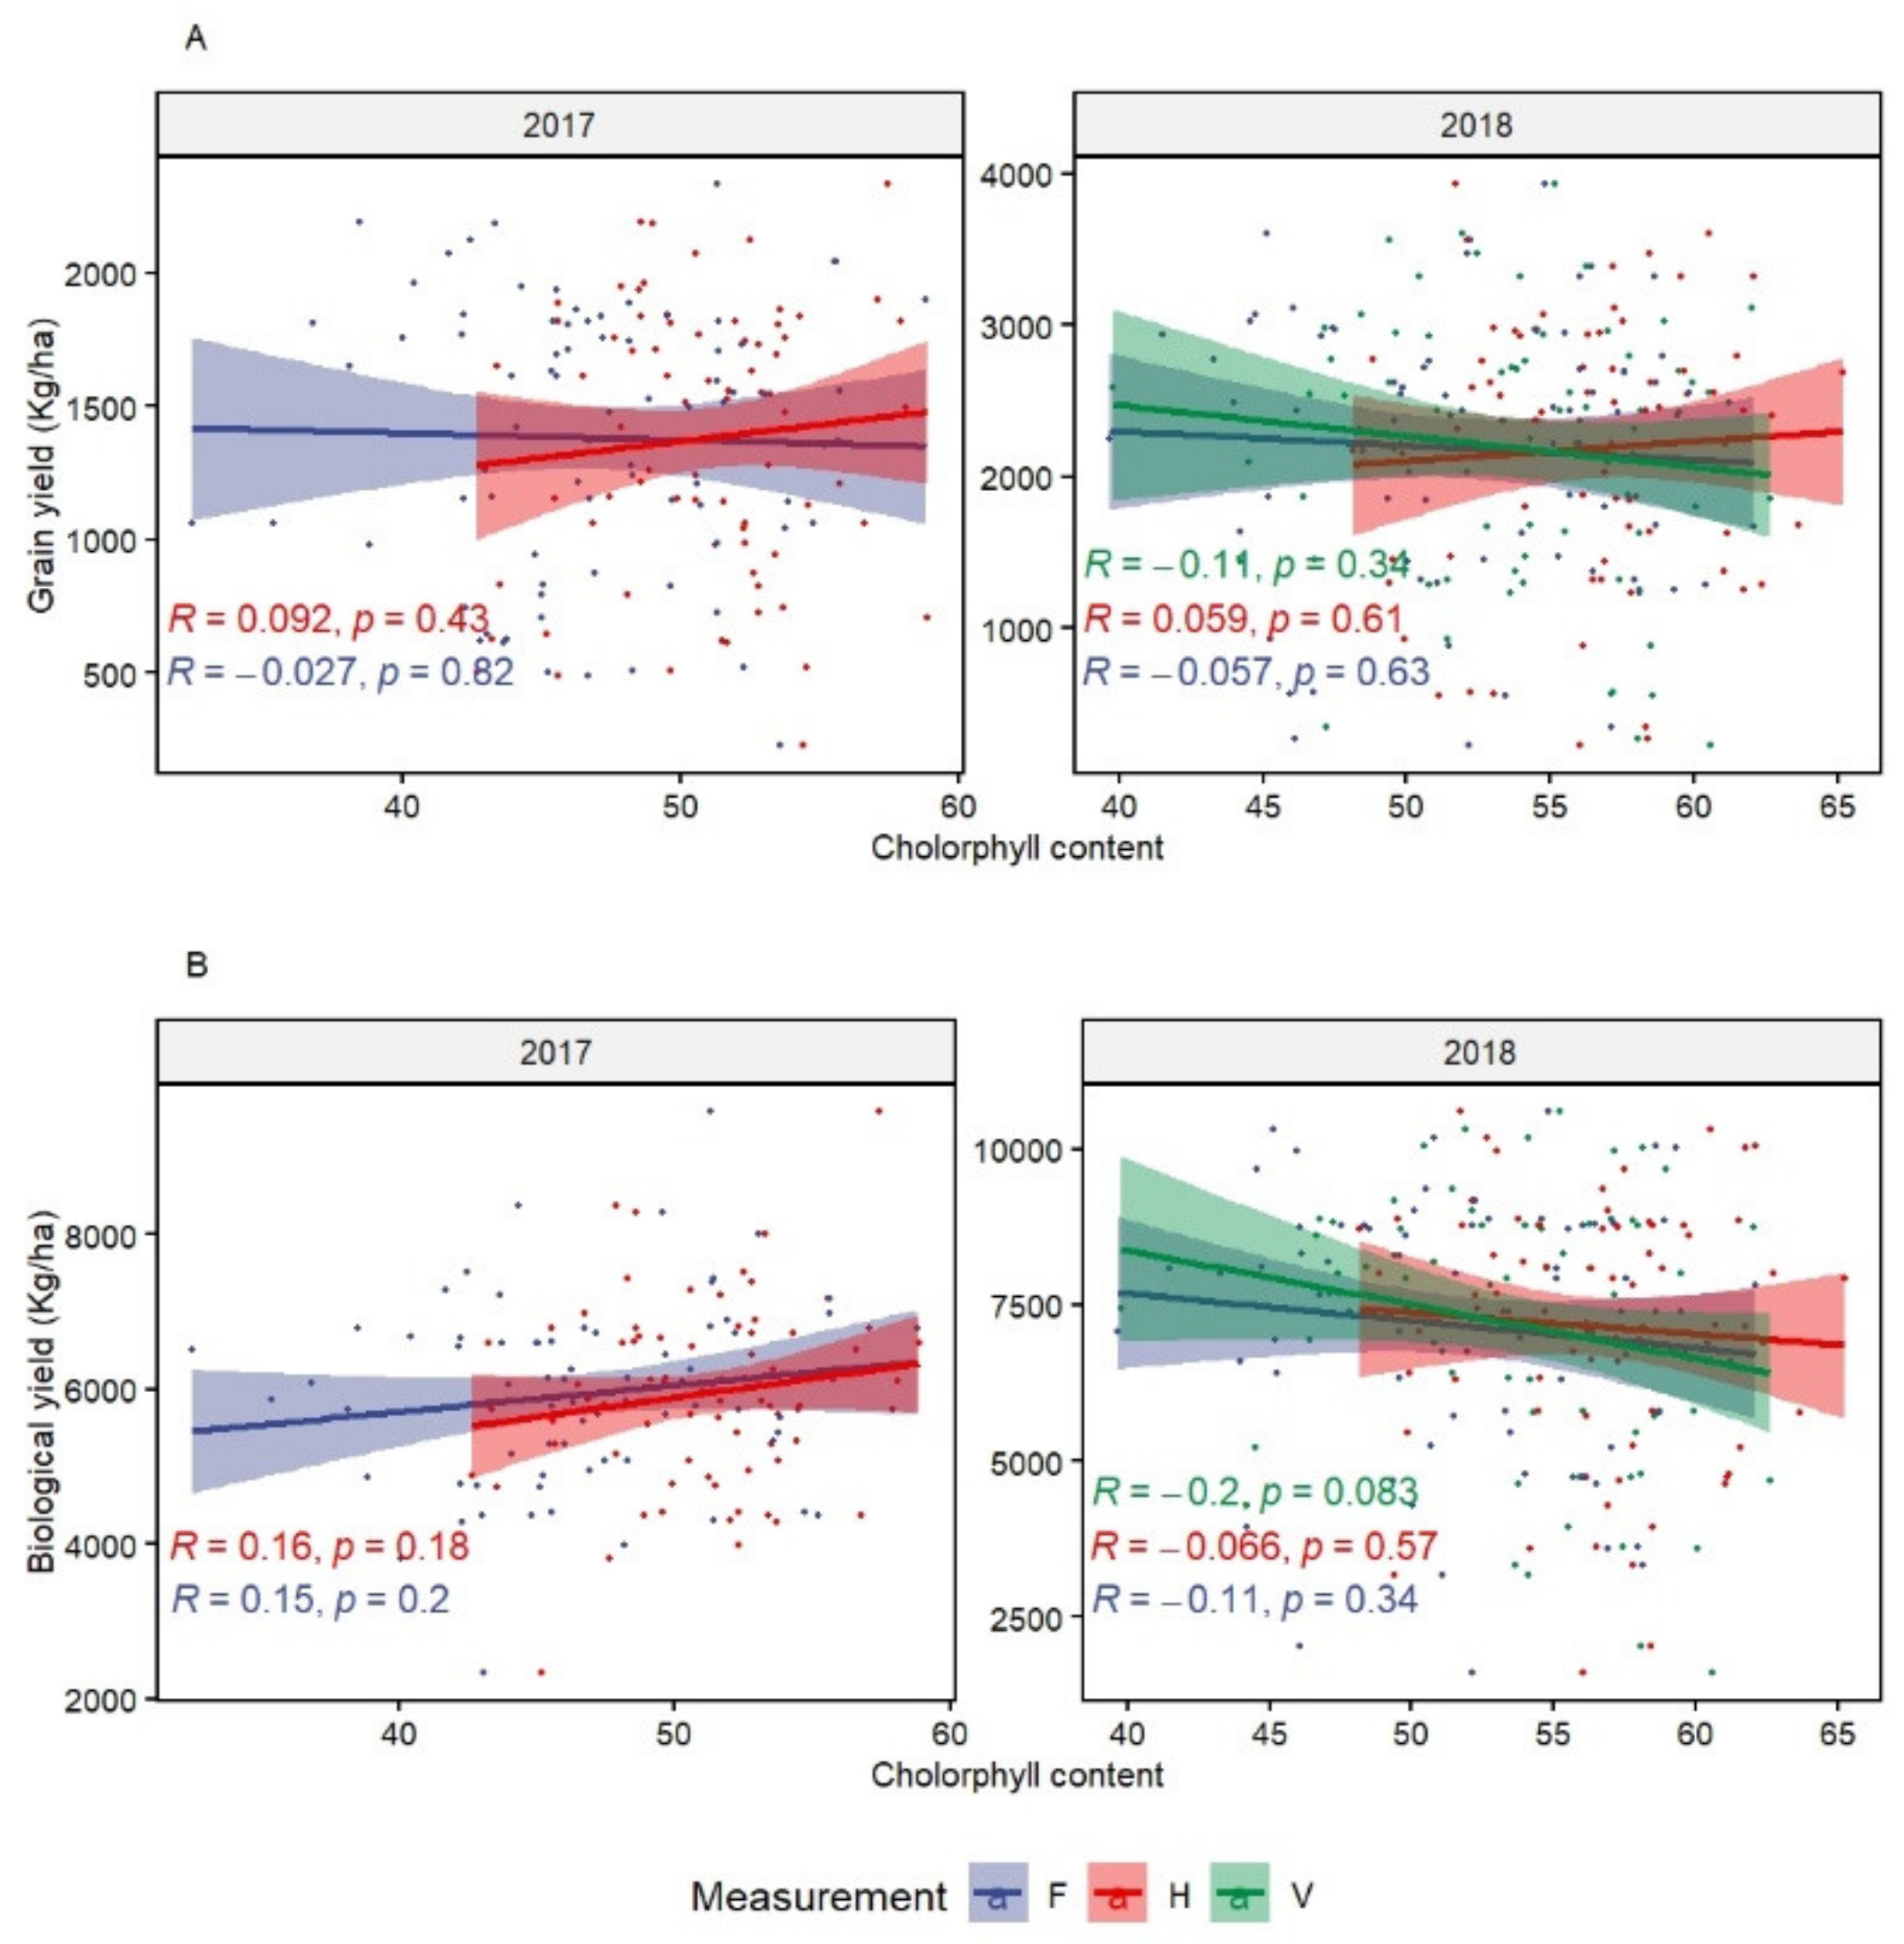
CHL showed high genetic variation at the heading stage. However, it did not correlate significantly with GY and the other traits. This could mean that chlorophyll content is not a determinant of the photosynthetic rate. In fact, Akter and Rafiqul Islam [75] reported that several processes are involved in the determination of photosynthetic rate under heat stress. Despite the confirmed heat effect in reducing CHL [34,76,77], selection using CHL under chronic heat stress should be used with caution. Its association with stay green [24,78], which could expose the plants to more stress during reproductive stage, leading to yield penalty.
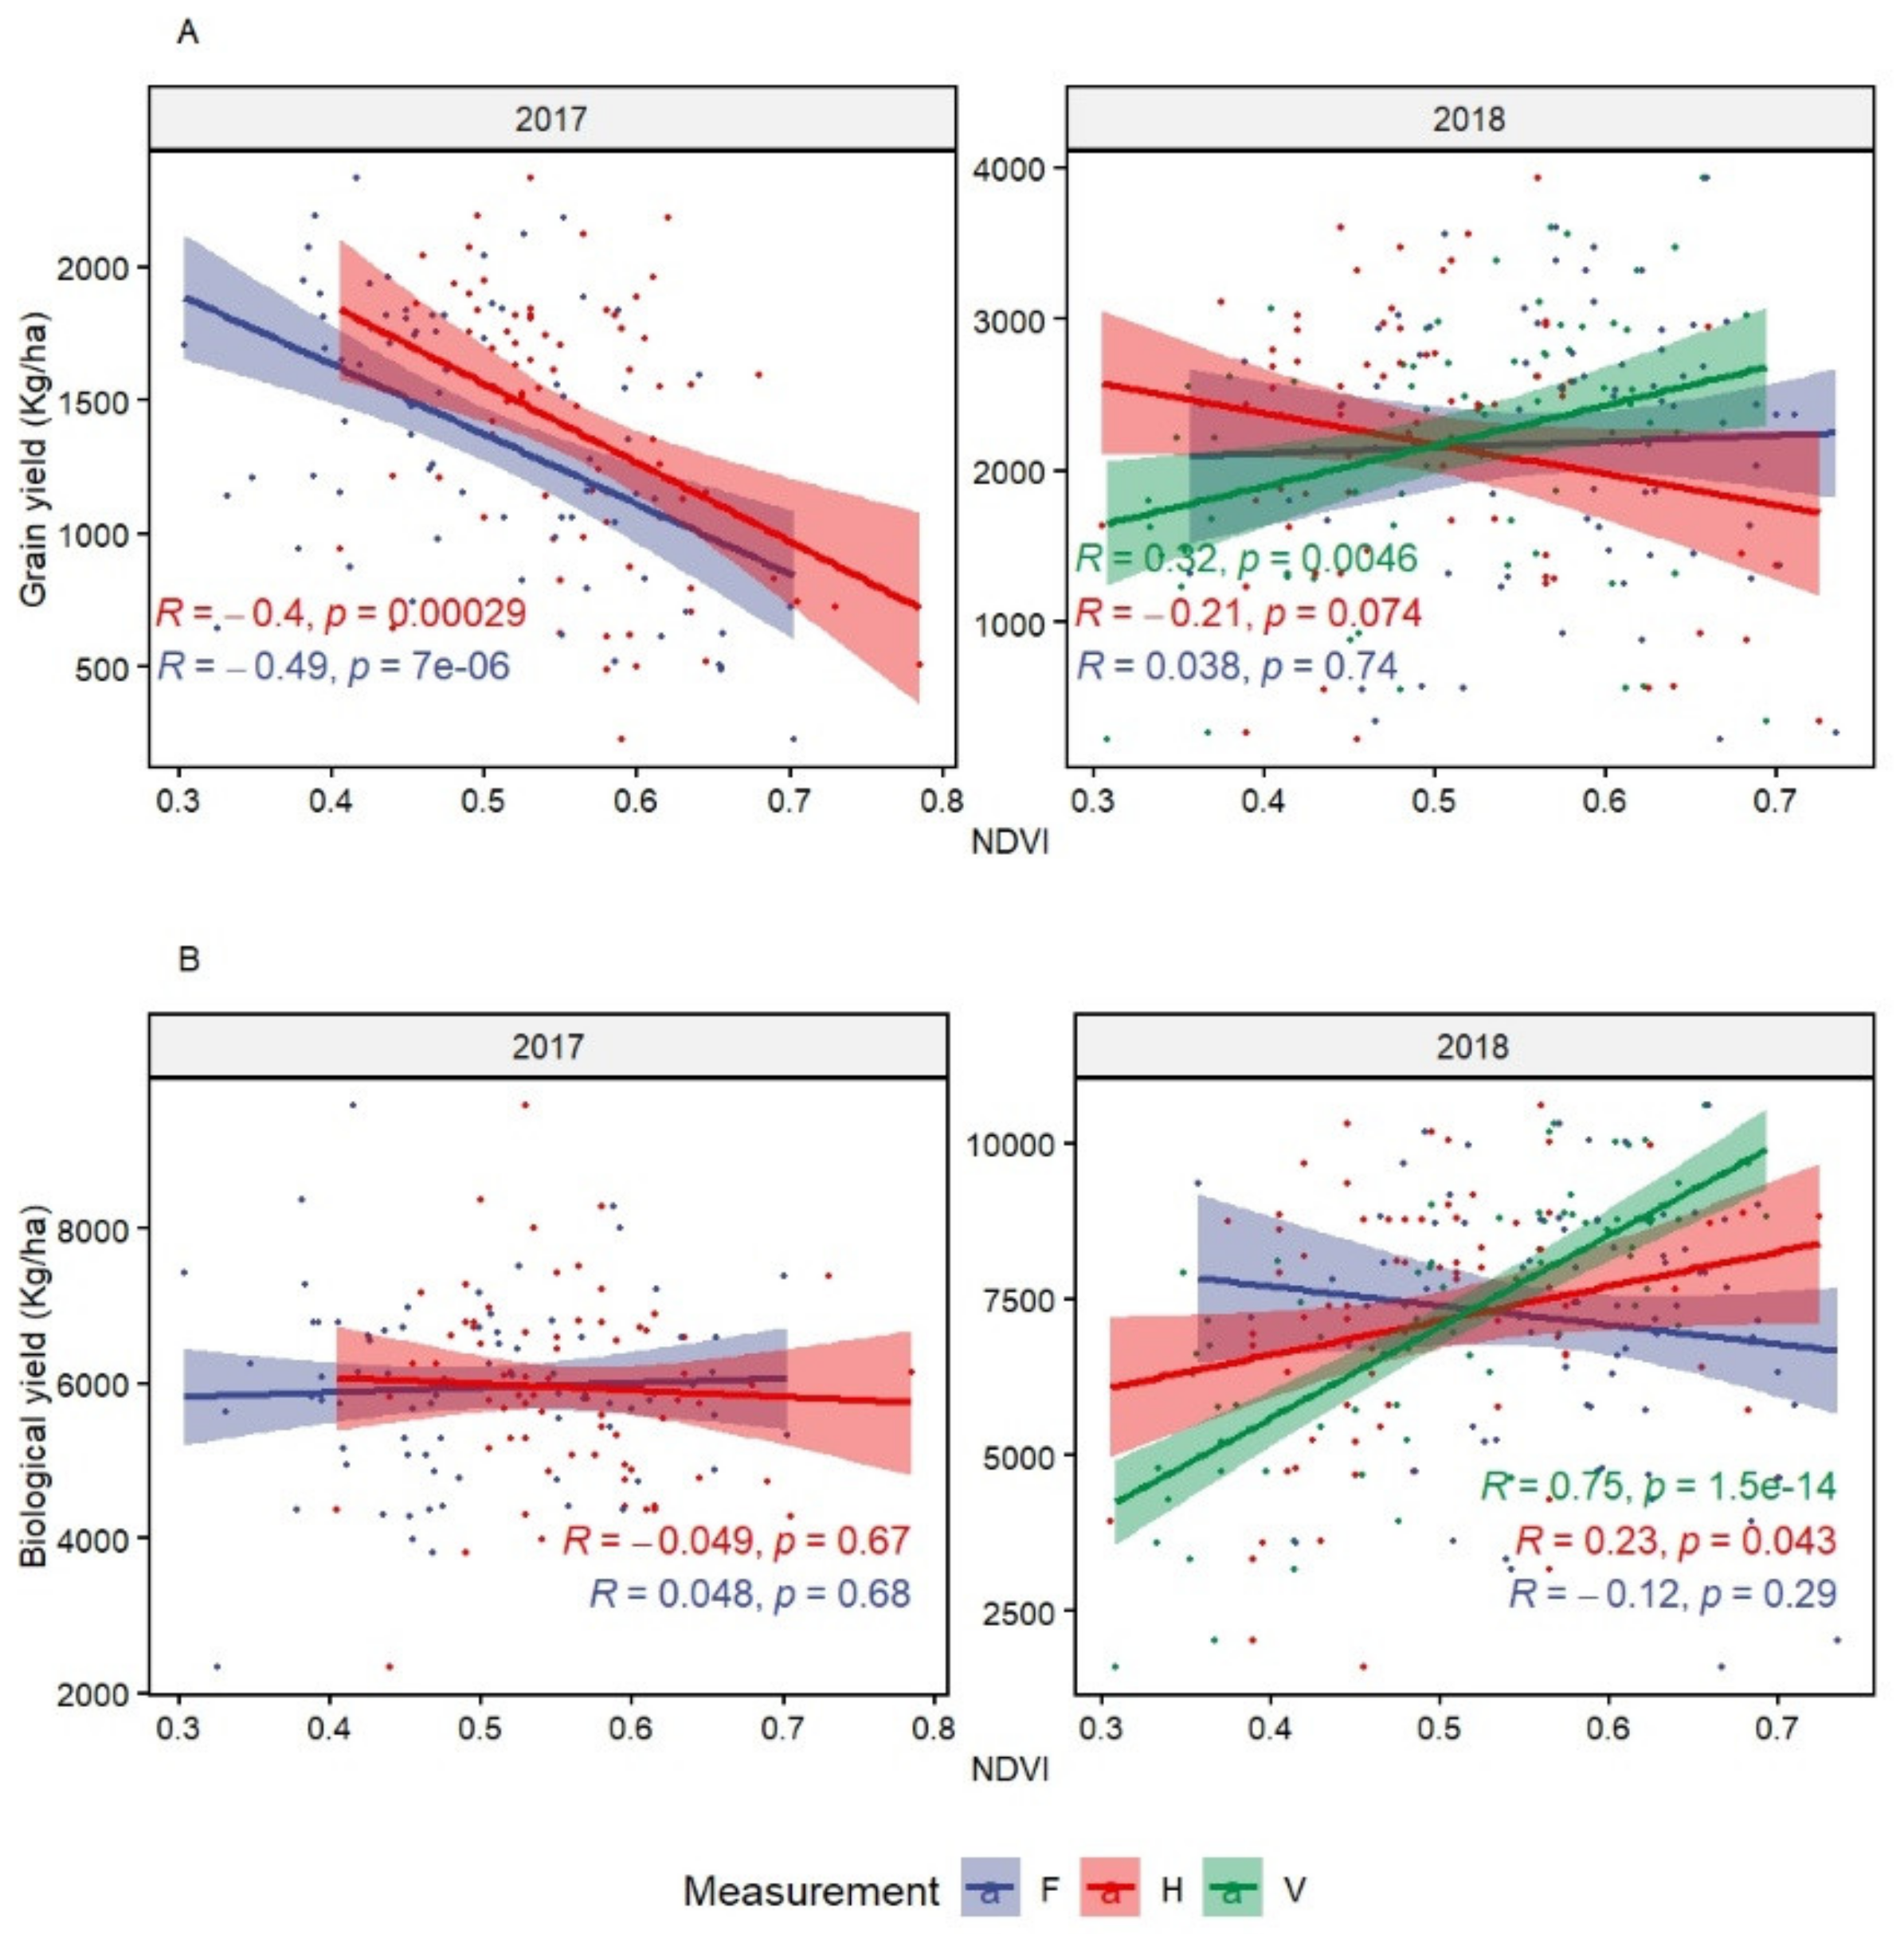
The measurement of NDVI during the vegetative stage showed the possibility to identify and select heat tolerant genotypes. Measurements performed at later stages (NDVIh and NDVIf) did not present any advantage and NDVIf was the least effective in terms of correlation with all other major traits. The significant correlation of NDVIv with CTv and BY suggests the possibility to select lines integrating multiple tolerance mechanisms in early growth stages. Similar findings were reported for NDVI at the vegetative stage by Pinto et al. [67] who identified several QTLs on A and B genomes. This supports the choice of using durum wheat direct progenitors (donors of A and B genome) from the primary gene pool to improve abiotic stress tolerance with polygenic inheritance, as suggested by Valkoun [51]. Pradhan et al. [18] also found a positive association between NDVI at heading and grain yield. They also identified several marker-trait associations (MTAs) under heat stress. It is, however, important to consider germplasm with similar phenology when collecting NDVI and avoid very late and winter/facultative genotypes in the analysis.
GFR can be recommended as efficient screening criteria for heat tolerance. It had the highest correlation to GY during both seasons. GFR can be easily computed for large breeding populations with accurate recording of anthesis and maturity time. The correlation of GFR and BY could be associated with the importance of assimilates availability to improve efficient translocation toward the grains. The usefulness of GFR is also derived from its ability to determine the final grain weight, which is a major yield component with high genetic plasticity [79,80,81]. Knowing that BY and thousand kernel weight explained together more than 40% of GY variation under the same conditions of the present study at WMD [10], GFR can increase the selection efficiency under chronic heat stress. A high filling rate can also compensate for the reduction of spike fertility and filling period, which are, in turn, reduced by heat stress [8,77,82]. In addition, the contribution of GFR to grain yield was reported to be more important than filling duration under terminal heat stress [83].
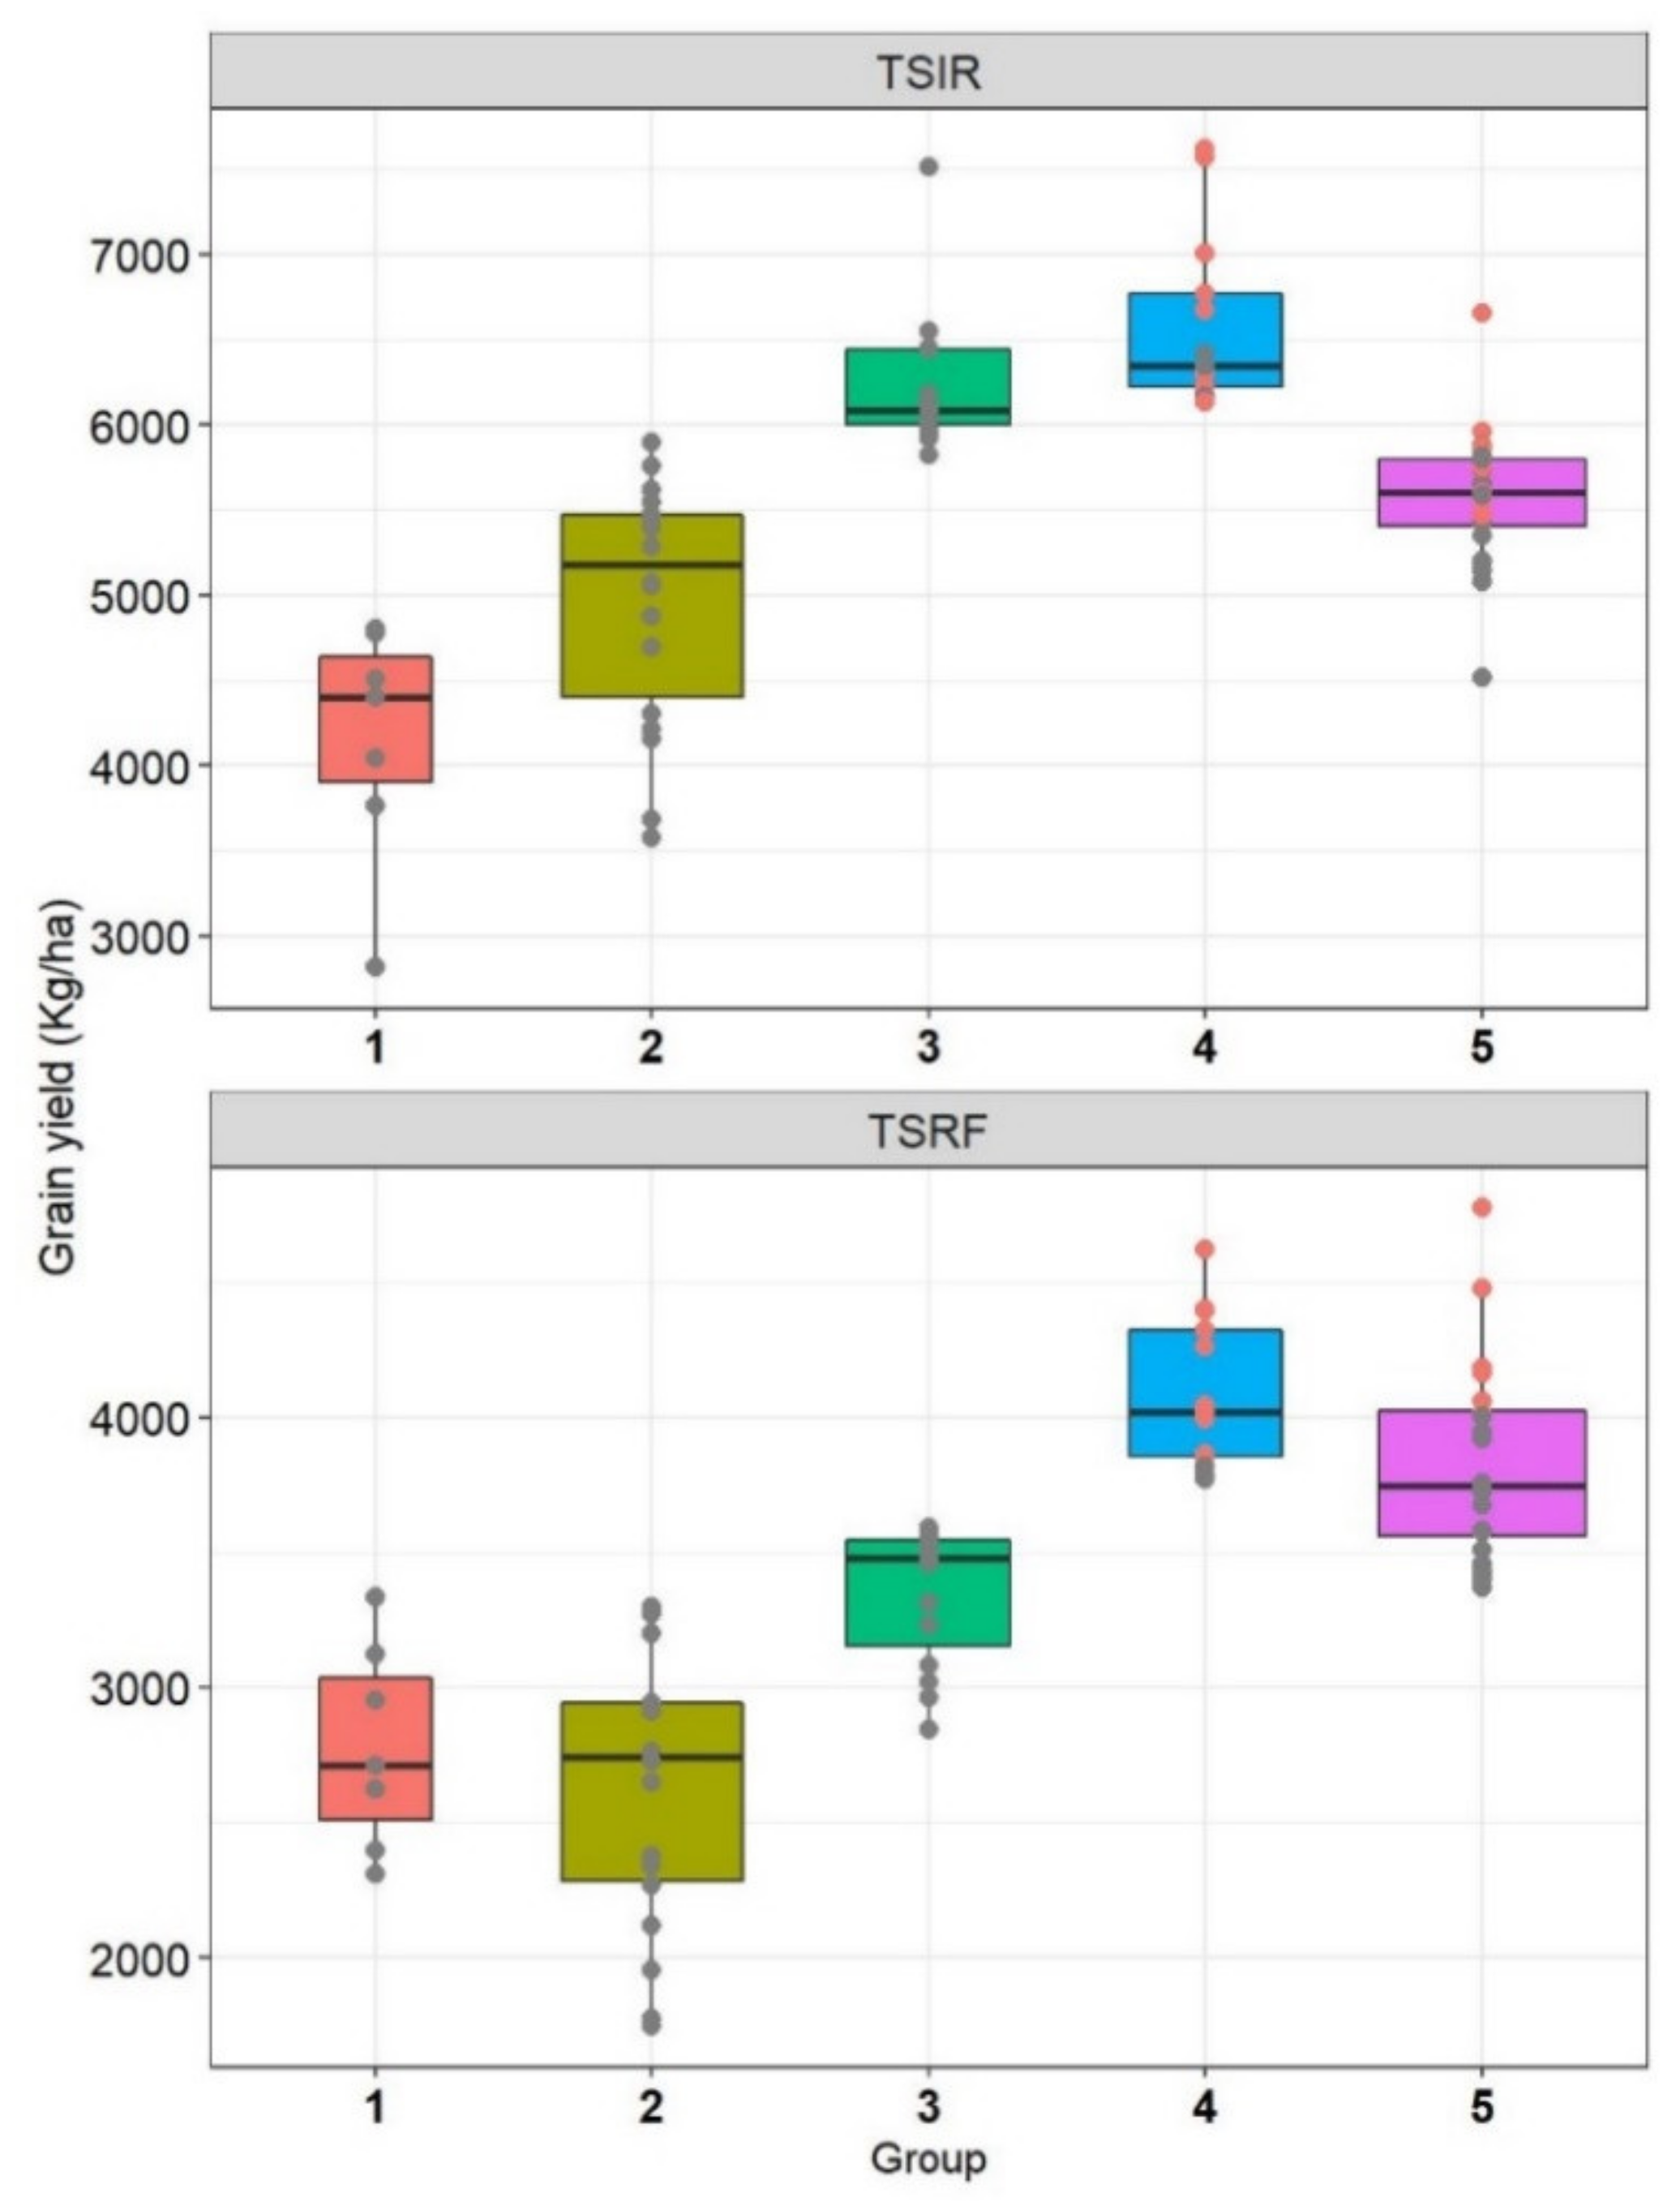
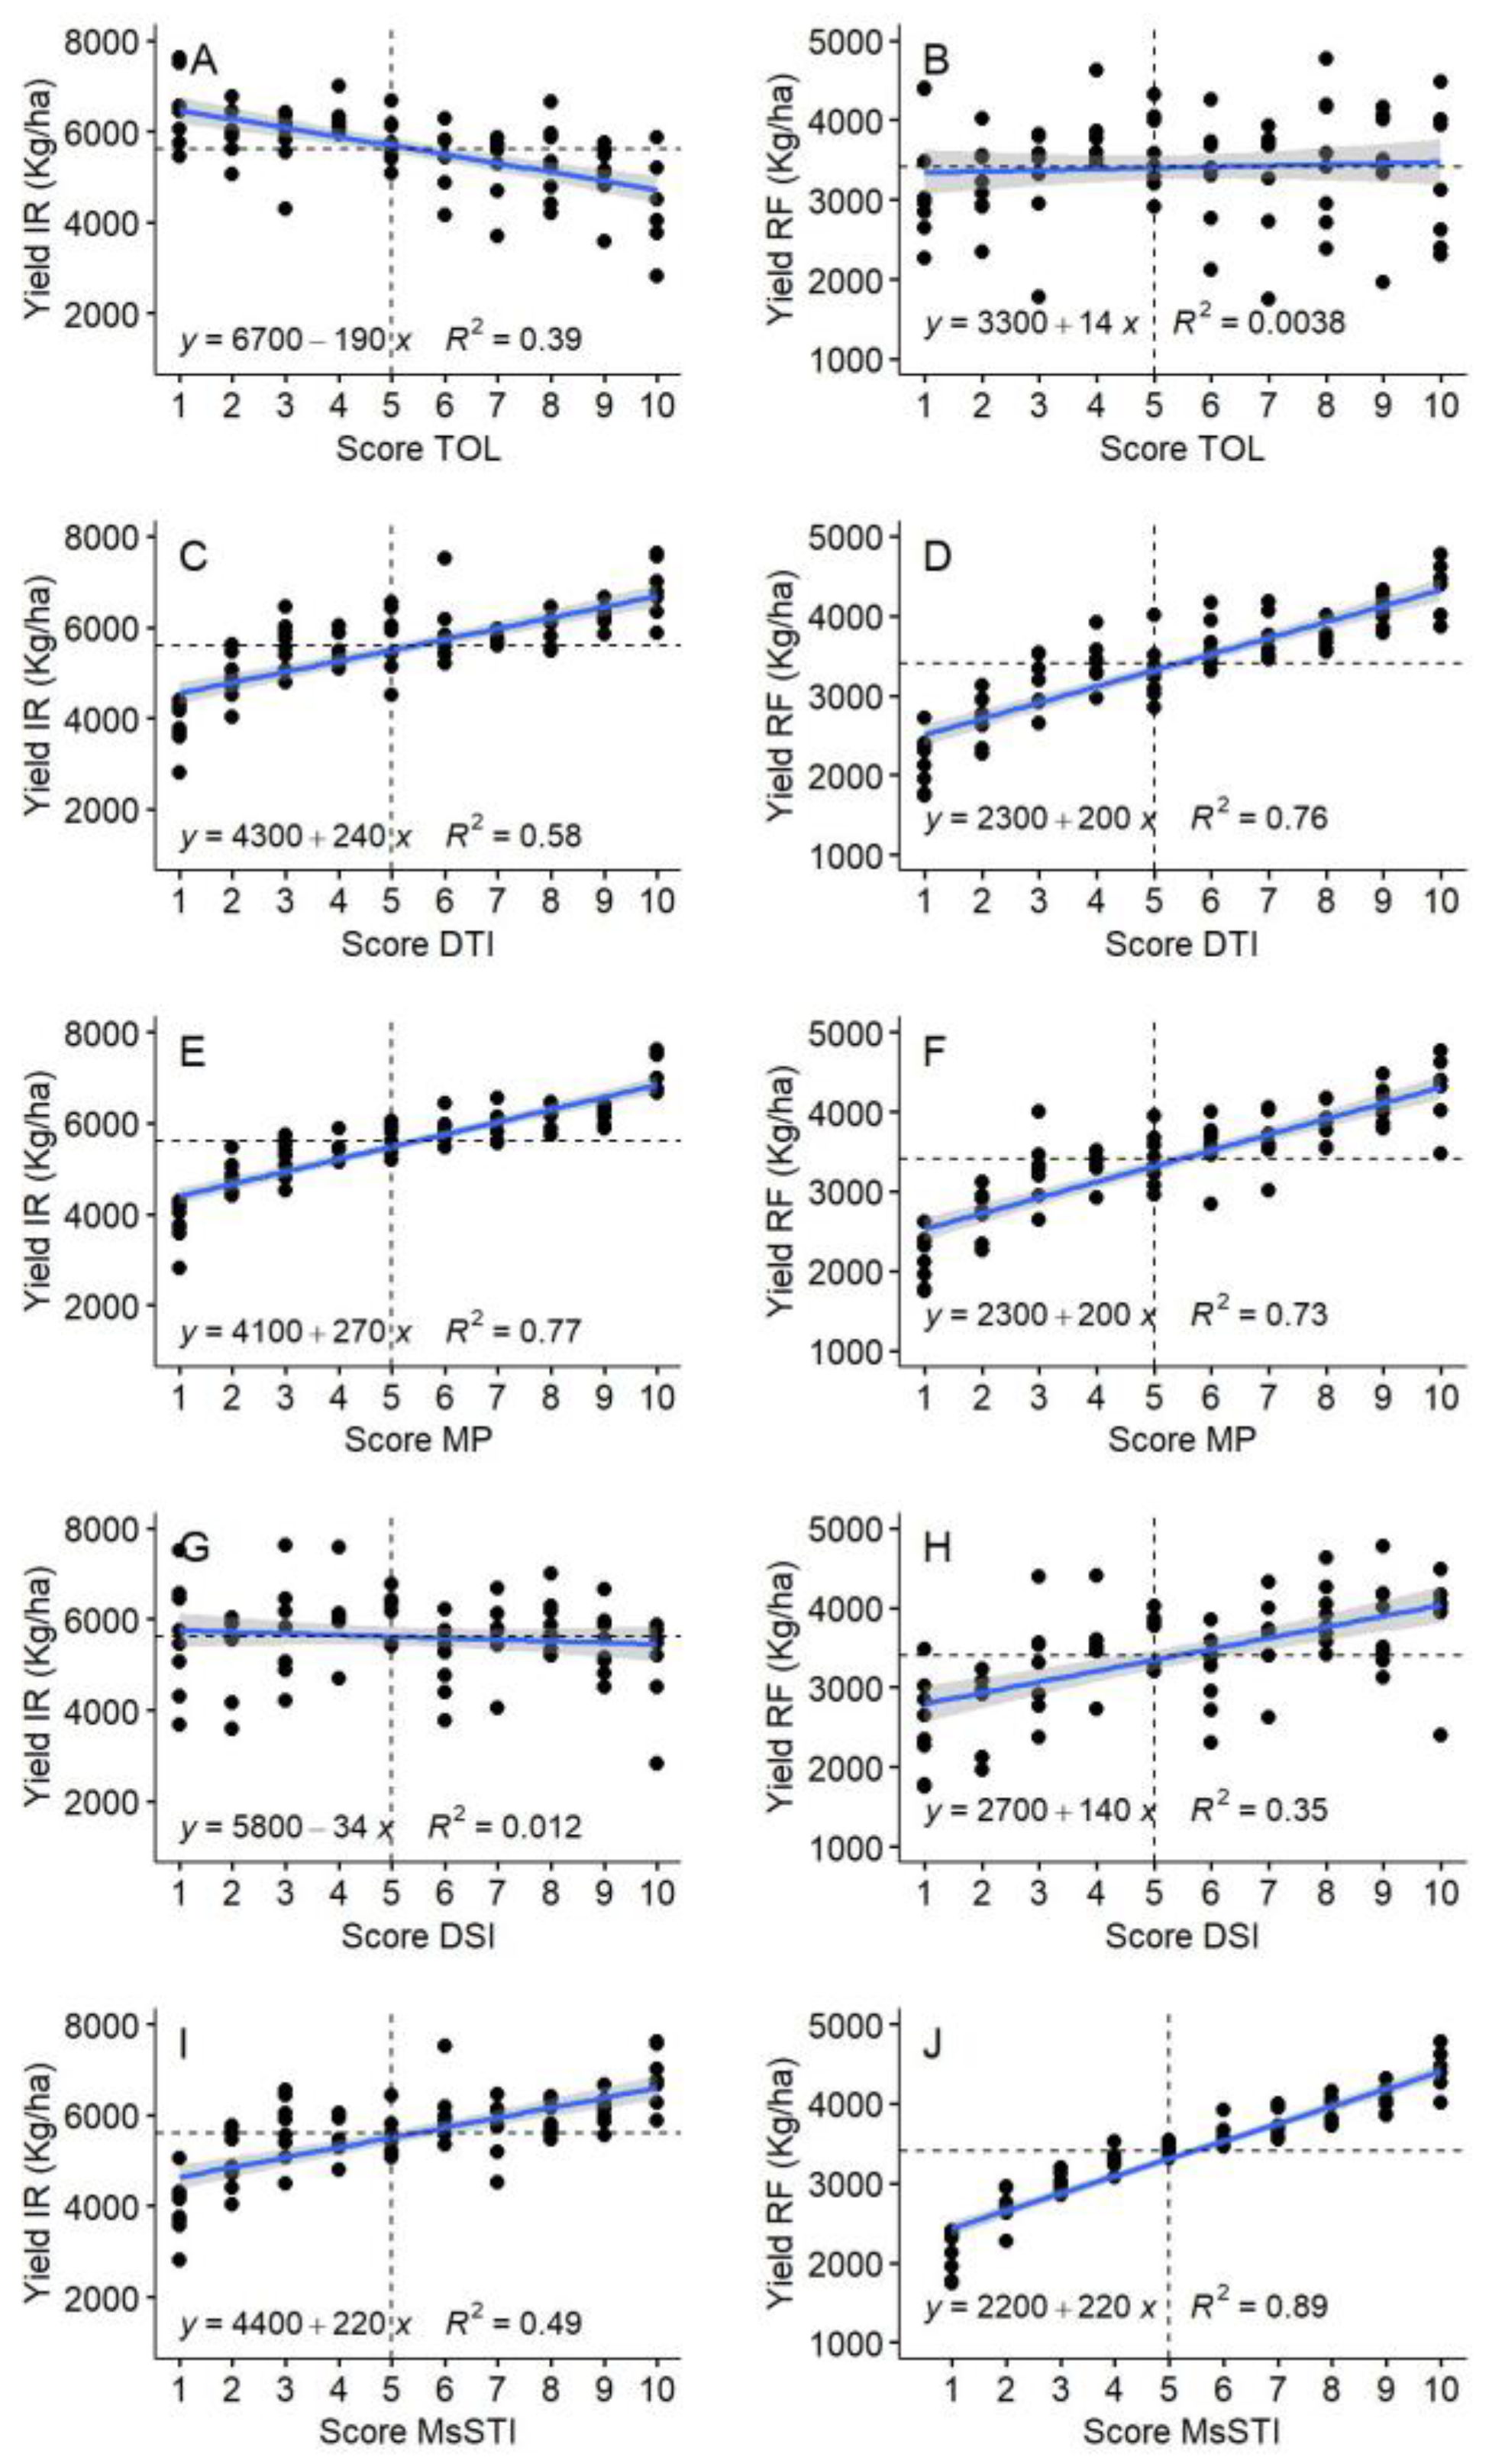
The drought tolerance and susceptibility indices showed different accuracies to select drought-adapted genotypes based on the groups identified by Fernandez [44]. The susceptibility indices (TOL and DSI) were less effective than tolerance indices (DTI, MP, and MsSTI) to select suitable lines for drought stress. According to Mohammadi et al. [46], MP and DTI can be used alternatively as they were correlated with each other and, therefore, selected the same genotypes. Using the scores, the present results showed that DTI is more efficient under drought stress while MP included some lines with moderate performance under drought stress. Selection based on MP is privileged in regions where drought stress occurs at equal frequencies as favorable conditions [43], which is the case in the Mediterranean region. The level and duration of drought stress could be responsible for various results of correlation among indices. This explains the identification of different best suitable indices in multiple studies. For example, Farshadfar et al. [84] suggested that DTI and TOL had the same selection ability while Gholinezhad et al. [49] identified MsSTI, MP, and DTI as the most efficient screening indices under moderate and severe drought stress. In another study by Farshadfar et al. [85], TOL and DTI were clustered in different groups and MsSTI was identified as an efficient selection index. These differences show that the ideal index to use could be environment-specific depending on the stage, duration, and severity of drought stress. Therefore, combining different indices provides breeders with the ability to increase the selection efficiency depending on the targeted environment. Thiry et al. [
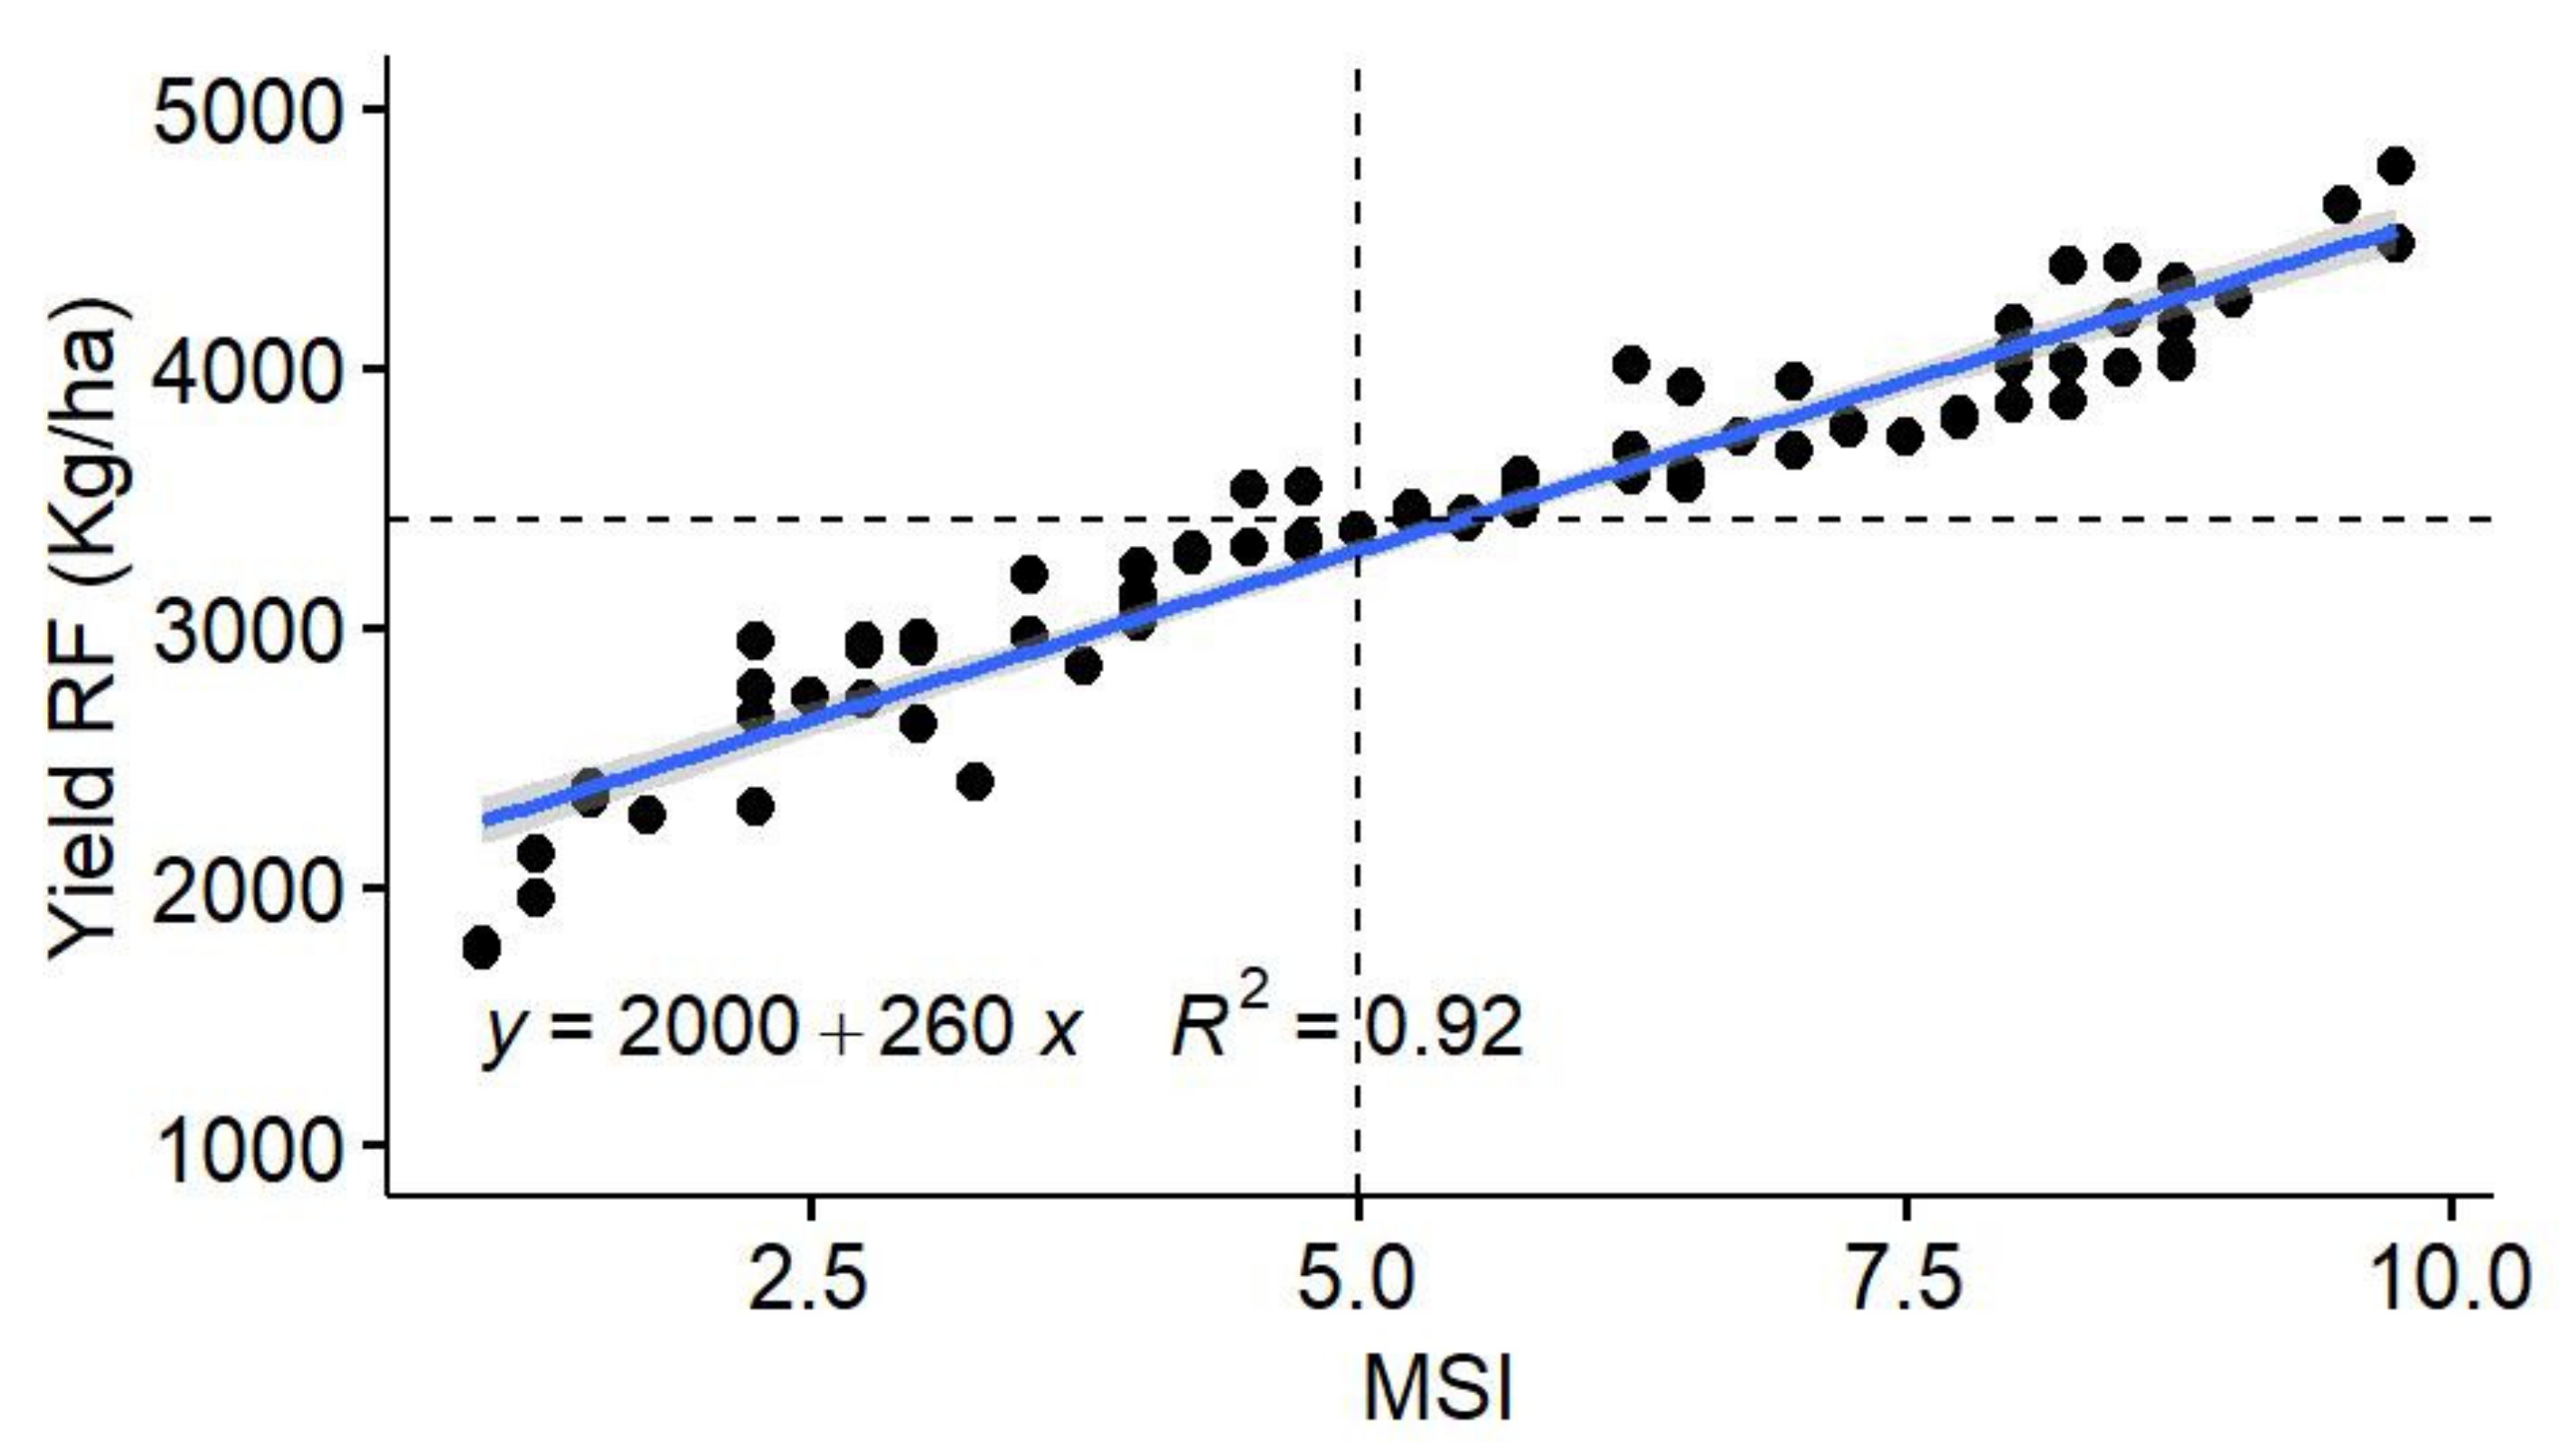
50] computed MSI based on the scores of five indices (DSI, TOL, MP, GMP, and STI), which resulted in a determination coefficient of 0.98 with GY under heat stress. In the present study, MSI was computed including only the effective indices at Tessaout (MP, DTI, DSI, and MsSTI). The efficiency of MSI is shown in the coefficient of determination with GY at TSRF (0.92). MSI selected efficiently the genotypes with a high yield under both optimal and stressed conditions. Therefore, the use of scores and adapted MSI can be recommended as a flexible tool to use the drought tolerance/susceptibility indices.
The results also showed the potential of crop wild relatives to increase genetic variation for the physiological traits involved in heat and drought tolerance. For instance, the line 142001 (Haurani*2/T. urartu) can be a source for cooler CT during the vegetative stage and higher CHL under heat. This line was previously recommended for its earliness at WMD [10], which means that it can combine both escaping and avoidance mechanisms to continuous heat stress. Under drought stress, several lines derived from T. urartu, T. aegilopides, and T. dicoccoides were characterized by cooler CT. An improvement in yield under terminal drought stress was also reported with lines derived from crosses with T. dicoccoides [41]. By selecting wild parents originating from heat and drought-prone environments, the expected derived lines can lead to drought and heat tolerant germplasm. Therefore, for further selection of wild parental germplasm, the aridity index can be an important factor. Peleg et al. [86] also reported the potential of Triticum dicoccoides collected from hot and/or dry environments to improve drought tolerance in durum wheat. This supports use of wild relatives, mainly from the primary gene pool, for drought and heat tolerance breeding.

5. Conclusions

High genetic variation was found for yield and physiological traits in the population derived from interspecific hybridization. This means that harnessing CWR from the primary and secondary gene pool can widen the genetic base for wheat breeders to cope with the adverse effects due to climate change. It can supply sources of physiological traits involved in continuous heat avoidance mechanisms, such as NDVI and CT. These traits can contribute to yield genetic gains through additive gene action. CWR, especially from the primary gene pool, can also contribute directly to yield improvement under drought stress without affecting the yield potential. The combination of different drought tolerance/susceptibility indices showed the potential to increase the selection efficiency of superior genotypes.

Supplementary Materials

The following are available online at https://www.mdpi.com/article/10.3390/agronomy11040695/s1. Figure S1: dendrogram of the groups identified based on the clusters using the drought tolerance/susceptibility indices. Table S1: List of durum wheat lines evaluated for heat and drought tolerance. Table S2: List of the durum wheat lines selected for drought tolerance based on the mean score index (MSI).

Author Contributions

Conceptualization and methodology, A.A. and H.A. Field trial establishment and data collecting, H.A., I.S.A.T., and S.M. Statistical analysis, H.A. and Z.K. Writing—original draft preparation, H.A. Writing—review and editing, H.A., A.A., B.B., Z.K., and A.F.-M. All authors have read and agreed to the published version of the manuscript.

Funding

This research is supported financially by the Wheat CRP and GIZ-funding attributed to ICARDA gene bank.

Acknowledgments

The authors would like to acknowledge the help provided by Athanasios Tsivelikas, gene bank manager at ICARDA and Hammadi, Head of INRA Tessaout experiment station for providing the germplasm and data collection.

Conflicts of Interest

The authors declare no conflict of interest.

References

  1. Li, Y.-F.; Wu, Y.; Hernandez-Espinosa, N.; Peña, R.J. Heat and Drought Stress on Durum Wheat: Responses of Genotypes, Yield, and Quality Parameters. J. Cereal Sci. 2013, 57, 398–404. [Google Scholar] [CrossRef]
  2. Food and Agriculture Organization of the United Nations. FAO Statistical Yearbook 2013: World Food and Agriculture; Food and Agriculture Organization of the United Nations: Rome, Italy, 2013; ISBN 978-92-5-107396-4. [Google Scholar]
  3. Asseng, S.; Ewert, F.; Martre, P.; Rötter, R.P.; Lobell, D.B.; Cammarano, D.; Kimball, B.A.; Ottman, M.J.; Wall, G.W.; White, J.W.; et al. Rising Temperatures Reduce Global Wheat Production. Nat. Clim. Chang. 2015, 5, 143–147. [Google Scholar] [CrossRef]
  4. Liu, B.; Asseng, S.; Müller, C.; Ewert, F.; Elliott, J.; Lobell, D.B.; Martre, P.; Ruane, A.C.; Wallach, D.; Jones, J.W.; et al. Similar Estimates of Temperature Impacts on Global Wheat Yield by Three Independent Methods. Nat. Clim. Chang. 2016, 6, 1130–1136. [Google Scholar] [CrossRef]
  5. Sultan, M.A.R.F.; Hui, L.; Yang, L.J.; Xian, Z.H. Assessment of Drought Tolerance of Some Triticum L. Species through Physiological Indices. Czech J. Genet. Plant Breed. 2012, 48, 178–184. [Google Scholar] [CrossRef]
  6. Jha, U.C.; Bohra, A.; Singh, N.P. Heat Stress in Crop Plants: Its Nature, Impacts and Integrated Breeding Strategies to Improve Heat Tolerance. Plant Breed. 2014, 133, 679–701. [Google Scholar] [CrossRef] [Green Version]
  7. Li, R.; Guo, P.; Michael, B.; Stefania, G.; Salvatore, C. Evaluation of Chlorophyll Content and Fluorescence Parameters as Indicators of Drought Tolerance in Barley. Agric. Sci. China 2006, 5, 751–757. [Google Scholar] [CrossRef]
  8. Sukumaran, S.; Reynolds, M.P.; Sansaloni, C. Genome-Wide Association Analyses Identify QTL Hotspots for Yield and Component Traits in Durum Wheat Grown under Yield Potential, Drought, and Heat Stress Environments. Front. Plant Sci. 2018, 9, 81. [Google Scholar] [CrossRef] [Green Version]
  9. El Hassouni, K.; Belkadi, B.; Filali-Maltouf, A.; Tidiane-Sall, A.; Al-Abdallat, A.; Nachit, M.; Bassi, F.M. Loci Controlling Adaptation to Heat Stress Occurring at the Reproductive Stage in Durum Wheat. Agronomy 2019, 9, 414. [Google Scholar] [CrossRef] [Green Version]
  10. Aberkane, H.; Amri, A.; Belkadi, B.; Filali-Maltouf, A.; Kehel, Z.; Tahir, I.S.A.; Meheesi, S.; Tsivelikas, A. Evaluation of Durum Wheat Lines Derived from Interspecific Crosses under Drought and Heat Stress. Crop Sci. 2020, 1–18. [Google Scholar] [CrossRef]
  11. Araus, J.L. Plant Breeding and Drought in C3 Cereals: What Should We Breed For? Ann. Bot. 2002, 89, 925–940. [Google Scholar] [CrossRef]
  12. Sallam, A.; Alqudah, A.M.; Dawood, M.F.A.; Baenziger, P.S.; Börner, A. Drought Stress Tolerance in Wheat and Barley: Advances in Physiology, Breeding and Genetics Research. Int. J. Mol. Sci. 2019, 20, 3137. [Google Scholar] [CrossRef] [Green Version]
  13. Reynolds, M.; Foulkes, J.; Furbank, R.; Griffiths, S.; King, J.; Murchie, E.; Parry, M.; Slafer, G. Achieving Yield Gains in Wheat: Achieving Yield Gains in Wheat. Plant Cell Environ. 2012, 35, 1799–1823. [Google Scholar] [CrossRef] [PubMed]
  14. Hu, H.; Xiong, L. Genetic Engineering and Breeding of Drought-Resistant Crops. Annu. Rev. Plant Biol. 2014, 65, 715–741. [Google Scholar] [CrossRef] [PubMed]
  15. Van Oosten, M.J.; Costa, A.; Punzo, P.; Landi, S.; Ruggiero, A.; Batelli, G.; Grillo, S. Genetics of Drought Stress Tolerance in Crop Plants. In Drought Stress Tolerance in Plants, Vol 2; Hossain, M.A., Wani, S.H., Bhattacharjee, S., Burritt, D.J., Tran, L.-S.P., Eds.; Springer International Publishing: Cham, Switzerland, 2016; pp. 39–70. ISBN 978-3-319-32421-0. [Google Scholar]
  16. Mwadzingeni, L.; Shimelis, H.; Dube, E.; Laing, M.D.; Tsilo, T.J. Breeding Wheat for Drought Tolerance: Progress and Technologies. J. Integr. Agric. 2016, 15, 935–943. [Google Scholar] [CrossRef] [Green Version]
  17. Abdipur, M.; Ramezani, H.R.; Bavei, V.; Talaee, S. Effectiveness of Canopy Temperature and Chlorophyll Content Measurements at Different Plant Growth Stages for Screening of Drought Tolerant Wheat Genotypes. Env. Sci. 2013, 13, 1325–1338. [Google Scholar] [CrossRef]
  18. Pradhan, S.; Babar, M.A.; Bai, G.; Khan, J.; Shahi, D.; Avci, M.; Guo, J.; McBreen, J.; Asseng, S.; Gezan, S.; et al. Genetic Dissection of Heat-Responsive Physiological Traits to Improve Adaptation and Increase Yield Potential in Soft Winter Wheat. BMC Genom. 2020, 21, 315. [Google Scholar] [CrossRef]
  19. Pinto, R.S.; Reynolds, M.P. Common Genetic Basis for Canopy Temperature Depression under Heat and Drought Stress Associated with Optimized Root Distribution in Bread Wheat. Appl. Genet. 2015, 128, 575–585. [Google Scholar] [CrossRef] [Green Version]
  20. Reynolds, M.P.; Singh, R.P.; Ibrahim, A.; Ageeb, O.A.A.; Larqué-Saavedra, A.; Quick, J.S. Evaluating Physiological Traits to Complement Empirical Selection for Wheat in Warm Environments. Euphytica 1998, 100, 85–94. [Google Scholar] [CrossRef]
  21. Reynolds, M.P.; Trethowan, R.M. Physiological Interventions in Breeding for Adaptation to Abiotic Stress. In Scale and Complexity in Plant Systems Research; Spiertz, J.H.J., Struik, P.C., Laar, H.H.V., Eds.; Wageningen UR Frontis Series; Springer: Dordrecht, The Netherlands, 2007; Volume 21, pp. 129–146. ISBN 978-1-4020-5904-9. [Google Scholar]
  22. Ludlow, M.M.; Muchow, R.C. A Critical Evaluation of Traits for Improving Crop Yields in Water-Limited Environments. Adv. Agron. 1990, 43, 107–153. [Google Scholar] [CrossRef]
  23. Mason, R.; Singh, R. Considerations When Deploying Canopy Temperature to Select High Yielding Wheat Breeding Lines under Drought and Heat Stress. Agronomy 2014, 4, 191. [Google Scholar] [CrossRef] [Green Version]
  24. Sangwan, S.; Ram, K.; Rani, P.; Munjal, R. Effect of Terminal High Temperature on Chlorophyll Content and Normalized Difference Vegetation Index in Recombinant Inbred Lines of Bread Wheat. Int. J. Curr. Microbiol. App. Sci. 2018, 7, 1174–1183. [Google Scholar] [CrossRef]
  25. Feng, B.; Liu, P.; Li, G.; Dong, S.T.; Wang, F.H.; Kong, L.A.; Zhang, J.W. Effect of Heat Stress on the Photosynthetic Characteristics in Flag Leaves at the Grain-Filling Stage of Different Heat-Resistant Winter Wheat Varieties. J. Agro. Crop Sci. 2014, 200, 143–155. [Google Scholar] [CrossRef]
  26. Zlatev, Z. Drought-Induced Changes in Chlorophyll Fluorescence of Young Wheat Plants. Biotechnol. Biotechnol. Equip. 2009, 23, 438–441. [Google Scholar] [CrossRef] [Green Version]
  27. Cowley, R.; Luckett, D. Chlorophyll Fluorescence as a Method to Detect Moisture- Limiting Stress in Canola. In Proceedings of the ARAB 2011 Conference, Wagga Wagga, NSW, Australia, 15–17 August 2011. [Google Scholar]
  28. Araus, J.L.; Slafer, G.A.; Royo, C.; Serret, M.D. Breeding for Yield Potential and Stress Adaptation in Cereals. Crit. Rev. Plant Sci. 2008, 27, 377–412. [Google Scholar] [CrossRef]
  29. Maxwell, K.; Johnson, G.N. Chlorophyll Fluorescence—A Practical Guide. J. Exp. Botany 2000, 51, 659–668. [Google Scholar] [CrossRef]
  30. Araus, J.L.; Amaro, T.; Voltas, J.; Nakkoul, H.; Nachit, M.M. Chlorophyll Fluorescence as a Selection Criterion for Grain Yield in Durum Wheat under Mediterranean Conditions. Field Crop. Res. 1998, 55, 209–223. [Google Scholar] [CrossRef]
  31. Baker, N.R. Applications of Chlorophyll Fluorescence Can Improve Crop Production Strategies: An Examination of Future Possibilities. J. Exp. Bot. 2004, 55, 1607–1621. [Google Scholar] [CrossRef] [Green Version]
  32. Bhusal, N.; Sharma, P.; Sareen, S.; Sarial, A.K. Mapping QTLs for Chlorophyll Content and Chlorophyll Fluorescence in Wheat under Heat Stress. Biol. Plant. 2018, 62, 721–731. [Google Scholar] [CrossRef]
  33. Mohammadi, M.; Karimizadeh, R.A.; Naghavi, M.R. Selection of Bread Wheat Genotypes against Heat and Drought Tolerance Based on Chlorophyll Content and Stem Reserves. J. Agric. Soc. Sci. 2009, 5, 119–122. [Google Scholar]
  34. Cao, X.; Mondal, S.; Cheng, D.; Wang, C.; Liu, A.; Song, J.; Li, H.; Zhao, Z.; Liu, J. Evaluation of Agronomic and Physiological Traits Associated with High Temperature Stress Tolerance in the Winter Wheat Cultivars. Acta Physiologiae Plantarum 2015, 37, 90. [Google Scholar] [CrossRef]
  35. Yang, J.; Sears, R.G.; Gill, B.S.; Paulsen, G.M. Growth and Senescence Characteristics Associated with Tolerance of Wheat-Alien Amphiploids to High Temperature under Controlled Conditions. Euphytica 2002, 126, 185–193. [Google Scholar] [CrossRef]
  36. Dempewolf, H.; Baute, G.; Anderson, J.; Kilian, B.; Smith, C.; Guarino, L. Past and Future Use of Wild Relatives in Crop Breeding. Crop Sci. 2017, 57, 1070–1082. [Google Scholar] [CrossRef]
  37. Monneveux, P.; Zaharieva, M.; Rekika, D. The Utilisation of Triticum and Aegilops Species for the Improvement of Durum Wheat. In Durum Wheat Improvement in the Mediterranean Region: New Challenges; CIHEAM Zaragoza, Mediterranean Agronomic Institute of Zaragoza: Zaragoza, Spain, 2000; pp. 71–81. [Google Scholar]
  38. Zaharieva, M.; Gaulin, E.; Havaux, M.; Acevedo, E.; Monneveux, P. Drought and Heat Responses in the Wild Wheat Relative Aegilops Geniculata Roth: Potential Interest for Wheat Improvement. Crop Sci. 2001, 41, 1321–1329. [Google Scholar] [CrossRef]
  39. Rekika, D.; Monneveux, P.; Havaux, M. The in Vivo Tolerance of Photosynthetic Membranes to High and Low Temperatures in Cultivated and Wild Wheats of the Triticum and Aegilops Genera. J. Plant Physiol. 1997, 150, 734–738. [Google Scholar] [CrossRef]
  40. Waines, J. High Temperature Stress in Wild Wheats and Spring Wheats. Funct. Plant Biol. 1994, 21, 705–715. [Google Scholar] [CrossRef]
  41. Nachit, M.M.; Elouafi, I. Durum Wheat Adaptation in the Mediterranean Dryland: Breeding, Stress Physiology, and Molecular Markers. In CSSA Special Publications; Rao, S.C., Ryan, J., Eds.; Crop Science Society of America and American Society of Agronomy: Madison, WI, USA, 2015; pp. 203–218. ISBN 978-0-89118-611-3. [Google Scholar]
  42. Fischer, R.; Maurer, R. Drought Resistance in Spring Wheat Cultivars. I. Grain Yield Responses. Aust. J. Agric. Res. 1978, 29, 897. [Google Scholar] [CrossRef]
  43. Rosielle, A.A.; Hamblin, J. Theoretical Aspects of Selection for Yield in Stress and Non-Stress Environment. Crop Sci. 1981, 21. [Google Scholar] [CrossRef]
  44. Fernandez, G. Effective Selection Criteria for Assessing Plant Stress Tolerance. In Proceedings of the International Symposium on Adaptation of Vegetables and Other Food Crops in Temperature and Water Stress, Tainan, Taiwan, 13–18 August 1992; pp. 257–270. [Google Scholar]
  45. Farshadfar, E.; Sutka, J. Screening Drought Tolerance Criteria in Maize. Acta Agronomica Hungarica 2002, 50, 411–416. [Google Scholar] [CrossRef]
  46. Mohammadi, R.; Armion, M.; Kahrizi, D.; Amri, A. Efficiency of Screening Techniques for Evaluating Durum Wheat Genotypes under Mild Drought Conditions. Int. J. Plant Prod. 2010, 4, 11–24. [Google Scholar]
  47. Karimizadeh, R.; Mohammadi, M. Association of Canopy Temperature Depression with Yield of Durum Wheat Genotypes under Supplementary Irrigated and Rainfed Conditions. AJCS 2011, 5, 138–146. [Google Scholar]
  48. Asfaw, A.; Blair, M.W. Quantification of Drought Tolerance in Ethiopian Common Bean Varieties. AS 2014, 05, 124–139. [Google Scholar] [CrossRef] [Green Version]
  49. Gholinezhad, E.; Darvishzadeh, R.; Bernousi, I. Evaluation of Drought Tolerance Indices for Selection of Confectionery Sunflower (Helianthus Anuus L.) Landraces under Various Environmental Conditions. Notulae Botanicae Horti Agrobotanici Cluj-Napoca 2014, 42, 187–201. [Google Scholar] [CrossRef] [Green Version]
  50. Thiry, A.A.; Chavez Dulanto, P.N.; Reynolds, M.P.; Davies, W.J. How Can We Improve Crop Genotypes to Increase Stress Resilience and Productivity in a Future Climate? A New Crop Screening Method Based on Productivity and Resistance to Abiotic Stress. EXBOT J. 2016, 67, 5593–5603. [Google Scholar] [CrossRef] [PubMed]
  51. Valkoun, J. Wheat Pre-Breeding Using Wild Progenitors. Euphytica 2001, 119, 17–23. [Google Scholar] [CrossRef]
  52. Pinto, R.S. Identification of Heat Tolerant Wheat Lines Showing Genetic Variation in Leaf Respiration and Other Physiological Traits. Euphytica 2017, 213, 76. [Google Scholar] [CrossRef]
  53. Bates, D.; Mächler, M.; Bolker, B.; Walker, S. Fitting Linear Mixed-Effects Models Using Lme4. J. Stat. Soft. 2015, 67. [Google Scholar] [CrossRef]
  54. Covarrubias-Pazaran, G. Genome-Assisted Prediction of Quantitative Traits Using the R Package Sommer. PLoS ONE 2016, 11, e0156744. [Google Scholar] [CrossRef] [Green Version]
  55. R Core Team. R: A Language and Environment for Statistical Computing; R Foundation for Statistical Computing: Vienna, Austria, 2020. [Google Scholar]
  56. Falconer, D.S.; Mackay, T.F.C. Introduction to Quantitative Genetics, 4th ed.; Longmans Green: Harlow, UK, 1996. [Google Scholar]
  57. Alvarado, G.; Rodríguez, F.M.; Pacheco, A.; Burgueño, J.; Crossa, J.; Vargas, M.; Pérez-Rodríguez, P.; Lopez-Cruz, M.A. META-R: A Software to Analyze Data from Multi-Environment Plant Breeding Trials. Crop J. 2020, 8, 745–756. [Google Scholar] [CrossRef]
  58. White, D.; Gramacy, R.B. Maptree: Mapping, Pruning, and Graphing Tree Models; R package version 1.4-7. 2012. Available online: https://CRAN.R-project.org/package=maptree (accessed on 27 March 2021).
  59. Galili, T. Dendextend: An R Package for Visualizing, Adjusting, and Comparing Trees of Hierarchical Clustering. Bioinformatics 2015, 31, 3718–3720. [Google Scholar] [CrossRef] [Green Version]
  60. Hurley, C. Gclus: Clustering Graphics R package version 1.3.2. 2019. Available online: https://CRAN.R-project.org/package=gclus (accessed on 27 March 2021).
  61. Maechler, M.; Rousseeuw, P.; Struyf, A.; Hubert, M.; Hornik, K. Cluster: Cluster Analysis Basics and Extensions. R Package Vers. 2.1.1 2012, 1, 56. [Google Scholar]
  62. Harrell, F.; Dupont, C. Hmisc: Harrell Miscellaneous R package version 4.4-2. 2020. Available online: https://CRAN.R-project.org/package=Hmisc (accessed on 27 March 2021).
  63. Kassambara, A. Ggpubr: “ggplot2” Based Publication Ready Plot R package version 0.4.0.s. 2020. Available online: https://CRAN.R-project.org/package=ggpubr (accessed on 27 March 2021).
  64. Reynolds, M.; Dreccer, F.; Trethowan, R. Drought-Adaptive Traits Derived from Wheat Wild Relatives and Landraces. J. Exp. Bot. 2006, 58, 177–186. [Google Scholar] [CrossRef] [PubMed] [Green Version]
  65. Sehgal, A.; Sita, K.; Siddique, K.H.M.; Kumar, R.; Bhogireddy, S.; Varshney, R.K.; HanumanthaRao, B.; Nair, R.M.; Prasad, P.V.V.; Nayyar, H. Drought or/and Heat-Stress Effects on Seed Filling in Food Crops: Impacts on Functional Biochemistry, Seed Yields, and Nutritional Quality. Front. Plant Sci. 2018, 9, 1705. [Google Scholar] [CrossRef] [PubMed] [Green Version]
  66. Mullan, D.J.; Reynolds, M.P. Quantifying Genetic Effects of Ground Cover on Soil Water Evaporation Using Digital Imaging. Funct. Plant Biol. 2010, 37, 703–712. [Google Scholar] [CrossRef]
  67. Pinto, R.S.; Reynolds, M.P.; Mathews, K.L.; McIntyre, C.L.; Olivares-Villegas, J.-J.; Chapman, S.C. Heat and Drought Adaptive QTL in a Wheat Population Designed to Minimize Confounding Agronomic Effects. Appl. Genet. 2010, 121, 1001–1021. [Google Scholar] [CrossRef] [Green Version]
  68. Bennett, D.; Reynolds, M.; Mullan, D.; Izanloo, A.; Kuchel, H.; Langridge, P.; Schnurbusch, T. Detection of Two Major Grain Yield QTL in Bread Wheat (Triticum Aestivum L.) under Heat, Drought and High Yield Potential Environments. Appl. Genet. 2012, 125, 1473–1485. [Google Scholar] [CrossRef] [PubMed]
  69. Mondal, S.; Mason, R.E.; Huggins, T.; Hays, D.B. QTL on Wheat (Triticum Aestivum L.) Chromosomes 1B, 3D and 5A Are Associated with Constitutive Production of Leaf Cuticular Wax and May Contribute to Lower Leaf Temperatures under Heat Stress. Euphytica 2015, 201, 123–130. [Google Scholar] [CrossRef]
  70. Kumar, S.; Sehgal, S.K.; Kumar, U.; Prasad, P.V.V.; Joshi, A.K.; Gill, B.S. Genomic Characterization of Drought Tolerance-Related Traits in Spring Wheat. Euphytica 2012, 186, 265–276. [Google Scholar] [CrossRef]
  71. I Azam, F.; Chang, X.; Jing, R. Mapping QTL for Chlorophyll Fluorescence Kinetics Parameters at Seedling Stage as Indicators of Heat Tolerance in Wheat. Euphytica 2015, 202, 245–258. [Google Scholar] [CrossRef] [Green Version]
  72. Sayar, R.; Khemira, H.; Kameli, A.; Mosbahi, M. Physiological Tests as Predictive Appreciation for Drought Tolerance in Durum Wheat (Triticum Durum Desf.). Agron. Res. 2008, 6, 79–90. [Google Scholar]
  73. Abid, M.; Tian, Z.; Ata-Ul-Karim, S.T.; Liu, Y.; Cui, Y.; Zahoor, R.; Jiang, D.; Dai, T. Improved Tolerance to Post-Anthesis Drought Stress by Pre-Drought Priming at Vegetative Stages in Drought-Tolerant and -Sensitive Wheat Cultivars. Plant Physiol. Biochem. 2016, 106, 218–227. [Google Scholar] [CrossRef]
  74. Narayan, A.; Misra, M.; Singh, R. Chlorophyll Fluorescence in Plant Biology. In Biophysics; Misra, A.N., Ed.; InTech: London, UK, 2012; ISBN 978-953-51-0376-9. [Google Scholar]
  75. Akter, N.; Islam, M.R. Heat Stress Effects and Management in Wheat. A Review. Agron. Sustain. Dev. 2017, 37, 1–17. [Google Scholar] [CrossRef]
  76. Ristic, Z.; Bukovnik, U.; Prasad, P.V.V. Correlation between Heat Stability of Thylakoid Membranes and Loss of Chlorophyll in Winter Wheat under Heat Stress. Crop Sci. 2007, 47, 2067–2073. [Google Scholar] [CrossRef]
  77. Pradhan, G.P.; Prasad, P.V.V.; Fritz, A.K.; Kirkham, M.B.; Gill, B.S. Effects of Drought and High Temperature Stress on Synthetic Hexaploid Wheat. Funct. Plant Biol. 2012, 39, 190. [Google Scholar] [CrossRef] [PubMed]
  78. Vijayalakshmi, K.; Fritz, A.K.; Paulsen, G.M.; Bai, G.; Pandravada, S.; Gill, B.S. Modeling and Mapping QTL for Senescence-Related Traits in Winter Wheat under High Temperature. Mol. Breed. 2010, 26, 163–175. [Google Scholar] [CrossRef]
  79. Calderini, D.F.; Reynolds, M.P. Changes in Grain Weight as a Consequence of De-Graining Treatments at Pre- and Post-Anthesis in Synthetic Hexaploid Lines of Wheat (Triticum Durum x T. Tauschii). Funct. Plant Biol. 2000, 27, 183. [Google Scholar] [CrossRef]
  80. Wu, X.; Tang, Y.; Li, C.; Wu, C. Characterization of the Rate and Duration of Grain Filling in Wheat in Southwestern China. Plant Prod. Sci. 2018, 21, 358–369. [Google Scholar] [CrossRef] [Green Version]
  81. Baillot, N.; Girousse, C.; Allard, V.; Piquet-Pissaloux, A.; Le Gouis, J. Different Grain-Filling Rates Explain Grain-Weight Differences along the Wheat Ear. PLoS ONE 2018, 13, e0209597. [Google Scholar] [CrossRef]
  82. Farooq, M.; Bramley, H.; Palta, J.A.; Siddique, K.H.M. Heat Stress in Wheat during Reproductive and Grain-Filling Phases. Crit. Rev. Plant Sci. 2011, 30, 491–507. [Google Scholar] [CrossRef]
  83. Dias, A.S.; Lidon, F.C. Evaluation of Grain Filling Rate and Duration in Bread and Durum Wheat, under Heat Stress after Anthesis. J. Agron. Crop Sci. 2009, 195, 137–147. [Google Scholar] [CrossRef]
  84. Farshadfar, E.; Poursiahbidi, M.M.; Pour-Aboughadareh, A. Repeatability of Drought Tolerance Indices in Bread Wheat Genotypes. Int. J. Agric. Crop Sci. 2012, 4, 891–903. [Google Scholar]
  85. Farshadfar, E.; Poursiahbidi, M.M.; Safavi, S.M. Assessment of Drought Tolerance in Land Races of Bread Wheat Based on Resistance/ Tolerance Indices. Int. J. Adv. Biol. Biomed. Res. 2013, 1, 143–158. [Google Scholar]
  86. Peleg, Z.; Fahima, T.; Abbo, S.; Krugman, T.; Nevo, E.; Yakir, D.; Saranga, Y. Genetic Diversity for Drought Resistance in Wild Emmer Wheat and Its Ecogeographical Associations. Plant Cell Env. 2005, 28, 176–191. [Google Scholar] [CrossRef]
Figure 1. Boxplot of the canopy temperature (°C) measured at heading stage at Tessaout under irrigated (TSIR) and rainfed (TSRF) conditions during two consecutive seasons of 2016–2017 and 2017–2018.
Agronomy 11 00695 g001
Figure 2. Linear regression and coefficient of determination of grain yield under irrigation (IR) and rainfed (RF) conditions at Tessaout versus the scores’ indices. TOL, tolerance (A,B): DTI, drought tolerance index (C,D), MP, mean productivity (E,F), DSI, drought susceptibility index (G,H), and MsSTI, modified stress tolerance index (I,J).
Agronomy 11 00695 g002
Figure 3. Linear regression and coefficient of determination of the mean score index (MSI) versus grain yield (kg/ha) under drought stressed conditions at Tessaout over two seasons (2016–2017 and 2017–2018).
Agronomy 11 00695 g003
Figure 4. Boxplot of grain yield (kg/ha) at Tessaout under optimal conditions (TSIR) and rainfed conditions (TSRF) by cluster groups identified based on drought susceptibility/tolerance indices. A red color represents the lines selected by the mean score index (MSI).
Agronomy 11 00695 g004
Figure 5. Linear regression and the Pearson correlation coefficient of canopy temperature measured at vegetative stage (V), heading (H), and grain filling (F) versus grain yield (A) and biological yield (B) under continuous heat stress at wad Medani for two seasons (2016–2017 and 2017–2018).
Agronomy 11 00695 g005
Figure 6. Linear regression and the Pearson correlation coefficient of normalized difference vegetation index (NDVI) measured at vegetative stage (V), heading (H), and grain filling (F) versus grain yield (A) and biological yield (B) under continuous heat stress during two seasons (2016–2017 and 2017–2018).
Agronomy 11 00695 g006
Figure 7. Linear regression and the Pearson correlation coefficient of chlorophyll content measured at vegetative stage (V), heading (H), and grain filling (F) versus grain yield (A) and biological yield (B) under continuous heat stress for two seasons (2016–2017 and 2017–2018).
Agronomy 11 00695 g007
Figure 8. Linear regression and the Pearson correlation coefficient of maximum quantum yield of PSII (Fv/Fm) (A) and grain filling rate (B) versus grain yield under continuous heat stress for two seasons (2016–2017 and 2017–2018).
Agronomy 11 00695 g008
Table 1. Maximum and minimum temperatures during physiological trait records at wad Medani for the two seasons 2016–2017 and 2017–2018.
2016–20172017–2018
Sowing Date18 December 20167 December 2017
TraitStageT minT maxT minT max
NDVIvVegetative--18.838.5
NDVIhHeading (ZGS 5)16.538.52139.2
NDVIfGrain filling (ZGS 7)22.541.722.540.5
CHLvVegetative--17.538.5
CHLhHeading (ZGS 5)16.538.52139.2
CHLfGrain filling (ZGS 7)22.541.722.540.5
CTvVegetative--18.838.5
CThHeading (ZGS 5)16.538.517.538.5
CTfGrain filling (ZGS 7)22.541.718.537
NDVIv, Normalized difference vegetation index at vegetative stage. NDVIh, NDVI at heading. NDVIf, NDVI during grain filling. CHLv, Chlorophyll content at vegetative stage. CHLh, Chlorophyll content at heading. CHLf, chlorophyll content during grain filling. CTv, canopy temperature at vegetative stage. CTh, canopy temperature at heading. CTf, canopy temperature during grain filling. T min, minimum temperature (°C). T max, maximum temperature (°C). ZGS 5, Zadoks growth scale 5. ZGS 7, Zadoks growth scale 7.
Table 2. Equations and references of the drought tolerance and susceptibility indices used for drought tolerance evaluation.
IndexEquationReference
Drought tolerance index (DTI)DTI = Y p Y s Y p ¯ 2 [44]
Drought susceptibility index (DSI)DSI = 1 Y s Y p 1 Y s ¯ Y p ¯ [42]
Mean productivity (MP)MP =   Y p + Y s 2 [43]
Tolerance (TOL)TOL = Y p Y s [43]
Modifies stress tolerance index (MsSTI)MsSTI = Y s 2 Y s ¯ 2 × D T I [45]
Yp, yield under optimal conditions. Ys, yield under drought stress. Y p ¯ , Average yield under optimal conditions. Y s ¯ , average yield under drought stress.
Table 3. Average minimum and maximum temperatures (°C) and precipitations (mm) at vegetative and reproductive stages during two cropping seasons (2016–2017 and 2017–2018) at Tessaout (TST) and wad Medani (WMD).
SeasonLocationVegetative StageReproductive Stage
Min T (°C)Max T (°C)Prec. (mm)Min T (°C)Max T (°C)Prec. (mm)
2016–2017TST4.41911811.9629.7560
WMD18.2436.05017.4236.890
2017–2018TST4.5518.041679.924.0487.6
WMD16.333.902039.80
Table 4. F-statistics for the fixed effects (year and water regime (WR)) and heritabilities of traits of durum wheat lines across years and WR at Tessaout during the seasons 2016–2017 and 2017–2018.
F Statistics for Fixed Effects
CTFv/FmDHEBYTKWGY
WR28.75 ***4.55 ·39.37 ***48.6 ***37.57 ***31.56 ***
Year25.75 ***8.34 *5.5 *19.94 *54.98 ***4.12 ns
WR: Year0.80 ns0.0016 ns36.44 ***6.89 *13.92 *14.33 *
Heritability
TSIR-170.52 **0 ns0.57 **0.10 ns0.54 **0.53 ***
TSRF-170.16 **0.56 **0.63 **0.39 **0.59 ***0.44 ***
TSIR-180.31 **0.48 *0.82 **0.19 ns0.47 ***0.48 ***
TSRF-180.28 **0 ns0.91 **0.26 *0.74 ***0.66 ***
CT, canopy temperature. GY, grain yield. BY, total biomass. TKW, thousand kernel weight (g). DHE, days to heading. Fv/Fm, maximum quantum yield of PSII. WR, water regime. · p < 0.1, * p < 0.05, ** p < 0.01, *** p < 0.001. ns, non-significant.
Table 5. Descriptive statistics and significance of the G × E of traits collected at Tessaout during the two seasons of 2016–2017 and 2017–2018 under rainfed (TSRF) and irrigated conditions (TSIR).
TraitLocationYearMinMaxMeanSDG × E Significance
GYTSIR20172393861459551248*
20182572756252511087
TSRF201772841572253706
2018249063304561950
BYTSIR201710,56421,54615,1332315ns
201811,68519,79816,3751953
TSRF2017531914,03688101694
2018944317,20013,5101654
TKWTSIR201725.448.437.24.8*
201831.051.241.94.1
TSRF201718.532.624.83.2
201828.045.038.93.6
DHETSIR20171001091052***
2018971111033
TSRF2017971061022
2018971131034
Fv/FmTSIR2017----***
20180.620.750.690.03
TSRF20170.600.740.680.03
2018----
GY, grain yield. BY, total biomass. TKW, thousand kernel weight (g). DHE, days to heading. Fv/Fm, maximum quantum yield of PSII. * p < 0.05. *** p < 0.001. ns, non-significant.
Table 6. Pearson correlation coefficients of grain yield (GY) to days to heading (DHE), thousand kernel weight (TKW), total biomass (BY), canopy temperature (CT), and Fv/Fm at Tessaout under irrigated (TSIR) and rainfed (TSRF) conditions during two consecutive seasons of 2016–2017 and 2017–2018.
DHETKWBYCTFV/FM
2017TSIR0.060.36 ***0.67 ***−0.03-
TSRF−0.210.30 ***0.82 ***−0.120.22 *
2018TSIR−0.31 ***0.56 ***0.67 ***−0.120.24 *
TSRF−0.39 ***0.50 ***0.74 ***−0.18-
DHE, days to heading. TKW, thousand kernel weight (g). BY, total biomass. CT, canopy temperature. Fv/Fm, maximum quantum yield of PSII. * p < 0.05. *** p < 0.001.
Table 7. Heritability and significance of genotypes, year, and their interaction on agronomic and physiological traits collected under continuous heat stress at wad Medani during two seasons: 2016–2017 and 2017–2018.
TraitYearRangeAverageh2Year SignificanceGx Year Significance
GY2017230–233413810.31 ·******
2018230–393021840.90 **
BY20172334–958959390.53 *******
20181602–10,60671560.82 *
GFR201712.5–90.749.40.11 ns******
201810.5–134.976.80.81 ***
CTv2017-----
201826.7–32.729.30.29 ns
CTh201726.7–30.829.10.14 ns***ns
201823.7–31.626.90.43 *
CTf201728.2–33.131.10.27 ****ns
201822.4–3225.90.32 ns
CHLv2017---ns-
201839.8–62.654.10.29
CHLh201742.7–58.950.90ns-
201848.2–65.256.30.62 **
CHLf201732.5–58.846.90ns-
201839.7–62.952.20.43 *
NDVIv2017-----
20180.31–0.690.500.79 *
NDVIh20170.41–0.790.560ns-
20180.31–0.730.500.07
NDVIf20170.30–0.700.500.35 nsns*
20180.36–0.740.580.34 ns
Fv/Fm2017-----
20180.62–0.730.670.22 ns
GY, grain yield. BY, total biomass. GFR, grain filling rate. CTv, canopy temperature at vegetative stage. CTh, canopy temperature at heading. CTf, canopy temperature during grain filling. CHLv, Chlorophyll content at vegetative stage. CHLh, Chlorophyll content at heading. CHLf, chlorophyll content during grain filling. NDVIv, Normalized difference vegetation index at vegetative stage. NDVIh, NDVI at heading. NDVIf, NDVI during grain filling. Fv/Fm, maximum quantum yield of PSII collected at heading. · p < 0.1, * p < 0.05, ** p < 0.01, *** p < 0.001. ns, non-significant.
Publisher’s Note: MDPI stays neutral with regard to jurisdictional claims in published maps and institutional affiliations.

