Article

Assessing the Impact of Rice Cultivation and Off-Season Period on Dynamics of Soil Enzyme Activities and Bacterial Communities in Two Agro-Ecological Regions of Mozambique

by
Obinna T. Ezeokoli
1,2,3,
Valter N. A. Nuaila
4,†,
Chinedu C. Obieze
5,†,
Belo A. Muetanene
6,
Irene Fraga
7,
Maria Natalia Tesinde
8,
Alexis Ndayiragije
9,
João Coutinho
10,
Ana M. P. Melo
11,
Rasheed A. Adeleke
2,3,
Ana I. Ribeiro-Barros
12,* and
David Fangueiro
13,*
1
Department of Microbial, Biochemical and Food Biotechnology, University of the Free State, Bloemfontein 9300, South Africa
2
Unit for Environmental Sciences and Management, North-West University, Private Bag X6000, Potchefstroom 2520, South Africa
3
Agricultural Research Council-Soil, Climate and Water (ARC-SCW), Arcadia, Private Bag X79, Pretoria 0001, South Africa
4
Centro de Biotecnologia, Universidade Eduardo Mondlane, Maputo 3453, Mozambique
5
Africa Centre of Excellence in Oilfield Chemicals Research, University of Port Harcourt, Choba, Port Harcourt 500102, Nigeria
6
Rural Engineering Department, Faculty of Agronomic Sciences, Lúrio University, Marrere 4250, Mozambique
7
Centre for the Research and Technology of Agro-Environmental and Biological Sciences (CITAB), Universidade de Trás-os-Montes e Alto Douro, Quinta de Prados, 5000-801 Vila Real, Portugal
8
Instituto de Investigação Agraria de Moçambique, Maputo 3658, Mozambique
9
International Rice Research Institute-Eastern and Southern Africa Hub, Maputo 2100, Mozambique
10
Centro de Química, Universidade de Trás-os-Montes e Alto Douro, Quinta de Prados, 5000-801 Vila Real, Portugal
11
BioData.pt, Instituto Gulbenkian de Ciência, 2780-156 Lisbon, Portugal
12
Forest Research Center (CEF), Instituto Superior de Agronomia, Universidade de Lisboa, 1649-004 Lisbon, Portugal
13
Linking Landscape, Environment, Agriculture and Food Research Unit (LEAF), Instituto Superior de Agronomia, Universidade de Lisboa, 1649-004 Lisbon, Portugal
*
Authors to whom correspondence should be addressed.
Authors contributed equally to this work.
Agronomy 2021, 11(4), 694; https://doi.org/10.3390/agronomy11040694
Submission received: 19 March 2021 / Revised: 1 April 2021 / Accepted: 2 April 2021 / Published: 6 April 2021
(This article belongs to the Special Issue Soil-Plant Interaction: Focus on Plant Growth and Soil Biodiversity)

Abstract

:
Soil ecosystem perturbation due to agronomic practices can negatively impact soil productivity by altering the diversity and function of soil health determinants. Currently, the influence of rice cultivation and off-season periods on the dynamics of soil health determinants is unclear. Therefore, soil enzyme activities (EAs) and bacterial community compositions in rice-cultivated fields at postharvest (PH) and after a 5-month off-season period (5mR), and fallow-fields (5-years-fallow, 5YF; 10-years-fallow, 10YF and/or one-year-fallow, 1YF) were assessed in two agroecological regions of Mozambique. EAs were mostly higher in fallow fields than in PH, with significant (p < 0.05) differences detected for β-glucosidase and acid phosphatase activities. Only β-glucosidase activity was significantly (p < 0.05) different between PH and 5mR, suggesting that β-glucosidase is responsive in the short-term. Bacterial diversity was highest in rice-cultivated soil and correlated with NO3, NH4+ and electrical conductivity. Differentially abundant genera, such as Agromyces, Bacillus, Desulfuromonas, Gaiella, Lysobacter, Micromonospora, Norcadiodes, Rubrobacter, Solirubrobacter and Sphingomonas were mostly associated with fallow and 5mR fields, suggesting either negative effects of rice cultivation or the fallow period aided their recovery. Overall, rice cultivation and chemical parameters influenced certain EAs and shaped bacterial communities. Furthermore, the 5-month off-season period facilitates nutrient recovery and proliferation of plant-growth-promoting bacteria.

1. Introduction

Rice (Oryza sativa) is one of the most cultivated cereal grains globally, only behind maize (Zea mays) and wheat (Triticum spp.) [1]. It is a staple food in several developed and developing nations and constitutes a strategic trade commodity globally [2,3]. It is estimated that by the year 2027, the global rice market will be a 274 billion dollars venture [4]. Such market projections are based on continued government support, technological advancements, and a sustained global expansion of land areas cultivated with rice. However, the likelihood of expanding rice-cultivated land areas is threatened by a scarcity of water resources, competition from other land-use demands given rapid urbanization and industrialization, as well as the exorbitant cost of establishing new cropping fields suited for rice production, especially in Sub-Saharan Africa and Latin America [5,6,7]. Furthermore, factors such as climate, poor agricultural practices, soil health and quality, seed quality, water availability and limited scientific knowledge constitute a major constraint to global rice production [6,8,9,10,11].
Among such factors, soil health, which is a vital component for crop productivity and proper soil functioning, is often neglected during local rice cultivation [6,12]. Soil health embodies the interaction and balance between soil’s physical, chemical, and biological components [13,14]. The soil biological component comprises microflora and fauna, which synergistically sustain proper soil ecosystem functioning by driving organic matter decomposition, soil carbon sequestration and nutrient mobilization, and supporting soil food webs [15,16,17,18,19]. In particular, soil microbial communities and their interactions in the plant rhizosphere are responsible for the massive global nutrient transfer, including carbon and nitrogen mineralization [16,19,20], soil stabilization through bio-binding (aggregation) [21,22], suppression of pathogens through competitive exclusion [23,24,25] and modulation of plant immunity to pathogens [26]. Such functions of soil microbial communities make them important components for improving crop yield. Unfortunately, studies have shown that soil microbial communities and, consequently, their vital roles in promoting soil health and crop productivity, can be negatively influenced by agricultural practices, such as continuous cropping [27,28,29], long-term fertilization [30], organic amendments [31,32], irrigation and other soil management practices (e.g., no-to and conservation agriculture) [33,34,35,36,37].
In Mozambique, smallholder farmers commonly cultivate rice without rotation under rainfed farming systems in predominantly clayey and hydromorphic soils. Such rainfed rice farming systems represent a suitable model to study fundamental aspects of microbial ecology, such as diversity, structure, and dynamics of microbial communities and relationships between microbial groups [38,39,40]. However, there is a paucity of in-depth studies investigating differences in rice field soil microbial communities between geographical locations, seasonal time points (e.g., harvest vs. pre-planting) and cultivation status (e.g., uncultivated, fallow and actively cultivated). Such studies are important for understanding soil health in rice-cultivated lands, gaining insights into how land management and cultivation practices affect soil microbial communities and improving rice productivity through biofertilization.
Therefore, the present study investigated soil enzyme activities and bacterial communities in selected rice fields in two agro-ecological regions of southern Mozambique, namely Chokwe and Umbeluzi [41]. We hypothesized that: (1) soil chemical properties, enzymes and bacterial communities are affected by rice cultivation (i.e., fallow or active cultivation), and (2) that a five-month off-season period between harvest and planting aids the recovery of soil health determinants. The study aimed to understand the effect of rice cultivation on soil bacterial communities, determine possible temporal changes in soil bacterial communities, and elucidate the relationships between soil physicochemical properties and bacterial communities.

2. Materials and Methods

2.1. Study Area Description

Rice-growing fields in two Experimental Stations of Mozambique’s Agronomic Research Institute located in Umbeluzi, Maputo (26°03′ S 32°23′ E) and Chokwe, Gaza (24°32′ S 33°00′ E) were selected for the study. The study areas area is a shrub savannah located at an altitude of approximately 200 m above sea level. Daily temperature for the study areas ranges between 23 and 26 °C in the rainy/hot season (October to March) and between 17 and 23 °C in the dry/cold season (April to September). The climate of Umbeluzi is characterized as semi-arid, with an average annual precipitation of 679 mm and irregular rainfall patterns during the rainy season [41]. Chokwe has a semi-arid climate with an average yearly precipitation of about 620 mm and an enormous precipitation variation along the year (precipitation occurs essentially from November to March) [41]. The soils in Umbeluzi are of alluvial and basalt origin, while the soil textural class is clay loam with moderate drainage [42]. In contrast, soils in Chokwe are predominantly clayey soils [43].
The rice fields in both locations were cultivated with Makassane rice variety and regularly irrigated. During the land preparation period, fertilization with NPK 12–24–12 at a rate of 30–50 kg/ha was applied, while during the rice-growing period, urea (46% of nitrogen) was applied at a rate of 90 kg/ha. For weed control, chemical pesticides were used. Each rice planting season begins in October and ends in May of the following year, with a five-month period between harvest and planting for the next rice-growing season.

2.2. Soil Sampling

Soil sampling was conducted in the 2015/2016 season (Table 1) on sites with different rice cultivation statuses or time points (RCST) in the two study locations. Soil samples were collected from rice-grown fields at postharvest (PH) and from adjacent (to the rice-cultivated field) areas that had been fallow for at least five years in Chokwe (herein referred to as “5YF”) and for at least ten years in Umbeluzi (referred to as “10YF”). In Umbeluzi, a one-year fallow field (herein referred to as “1YF”) was also sampled (additional fallow sites were unavailable in Chokwe). The fallow fields were approximately 300 m and 100 m to the north of the rice-cultivated fields in Umbeluzi and Chokwe, respectively. In both locations, the predominant vegetation type in the fallow fields were shrubs (up to 40%), and the rest comprised grasses and broad leaves. For an investigation into the possible recovery of soil health during the five months between harvest and planting of the following (2016/2017) season, additional soil samples were collected from the rice grown fields shortly before planting in October 2016 (designated as “5mR”) (Table 1).
Bulk soil samples were randomly collected from a depth of 10 cm using a sterile auger. Three rice-cultivated plots were sampled in each location. Three representative composite samples comprising three simple random soil cores were obtained from each of the three plots. A total of nine bulk samples were collected per field. Soil subsamples for bacterial community analysis were stored in sterile 50 mL polypropylene (falcon) tubes, immediately placed on ice and frozen (−20 °C) before DNA extractions. Soil subsamples for physicochemical analyses were air-dried, ground and passed through a 2 mm sieve before analyses.

2.3. Chemical and Enzyme Activities in Bulk Soil

Chemical properties, including pH (H2O), electric conductivity (EC), soil organic carbon (SOC), moisture, Olsen available phosphorus (P-Olsen), extractable potassium (Egner Rhiem K), nitrate (NO3), ammonium (NH4+) and total nitrogen were determined using standard protocols [44,45,46].
Soil enzyme activities, including β-glucosidase, acid- and alkaline -phosphatases, as well as urease activities, were assessed from moist soils using standard methods. Briefly, β-glucosidase, acid phosphatase and alkaline phosphatase (phosphomonoesterases) activities were determined according to the protocol described by Tabatabai [47] using p-nitrophenyl-β-D-glucopyranoside (pNG) as the substrate for β-glucosidase and p-nitrophenyl phosphate (pNP) as the substrate for both phosphomonoesterases. The urease activity was determined according to the method described by Kandeler [48], using the unbuffered option. For all the enzyme activities, absorbance values of the extracts were determined in a segmented flow analyzer system with a dialysis pre-step to remove interferences of color and microparticles. The activities of β-glucosidase, acid- and alkaline -phosphatases were expressed in µg p-nitrophenol h−1 g−1 dry soil, while urease activity was expressed in mg N–NH4+ 2 h−1 kg−1 dry soil.

2.4. Bacterial Community Analyses of Rice-Field Soils

2.4.1. DNA Extraction and Partial 16S rRNA Gene Sequencing

Total community DNA was extracted from 0.25 g soil samples using the power soil DNA isolation kit (Qiagen, Hilden, Germany) according to the manufacturer’s instructions. DNA integrity and concentrations were determined by electrophoresis on 0.5% agarose gel and fluorometric quantification using a fluorometer (Qubit 2.0, Invitrogen, CA, USA), respectively. Following DNA extraction, amplicon libraries of the hypervariable V4 region of the 16S rRNA gene were prepared according to the Illumina MiSeq protocol using the primer pair 515 F (5′-GTGYCAGCMGCCGCGGTAA-3′) and 806R (5′-GGACTACNVGGGTWTCTAAT-3′) [49]. Each forward and reverse primer contained Illumina forward and reverse overhang adapters, respectively (Illumina Inc., Foster City, CA, USA). Briefly, the library preparation protocol entailed a first “amplicon PCR” step involving 12.5 ng DNA, 0.2 µM of each forward and reverse primers, 12.5 µL of double-strength KAPA HiFi HotStart ready Mix [0.5 U DNA polymerase, 0.3 mM dNTPs, 2.5 mM MgCl2] (Kapa Biosystems, Wilmington, MA, USA) and nuclease-free water (Thermo Fisher Scientific, Waltham, MA, USA) in a final reaction volume of 25 µL. PCR was performed in a thermal cycler (SimpliAmp, Applied Biosystems, Foster City, CA, USA). The PCR condition was an initial step of 95 °C for 3 min, followed by 25 cycles of 98 °C for 20 s, 55 °C for 10 s and 72 °C for 10 s, as well as a final extension of 72 °C for 1 min. PCR amplicons were purified with AMPure XP magnetic beads (Beckman Coulter, Brea, CA, USA) and indexed using Nextera XT primers (Illumina Inc., Foster City, CA, USA). Indexed amplicons were purified, quantified, normalized, pooled in equimolar concentrations and denatured in 0.2 N NaOH. Denatured libraries, along with PhiX sequencing control, were then loaded onto the MiSeq flow cell using the MiSeq v3 reagent kit for a paired-end (2 × 300 bp) sequencing run. Sequencing was performed at the Biotechnology Platform of the Agricultural Research Council, Pretoria, South Africa.

2.4.2. Bioinformatic and Diversity Analyses

Paired-end sequence reads were demultiplexed using the MiSeq reporter software (Illumina Inc., CA, USA) and checked for quality using FastQC v.0.11.9 (Babraham Institute, Cambridge, UK). Paired-reads were trimmed at both 5′ and 3′ends to eliminate poor quality nucleotides, denoised, merged, depleted of chimeric sequences and clustered into amplicon sequence variants (ASV) (operational definition for a species) by using the DADA2 denoiser [50] incorporated into QIIME 2 [51]. The resulting ASV count table was depleted of singletons, and representative sequences taxonomically classified using a trained classifier (V4 region of the 16S rRNA) of the SILVA reference (Release 132) [52]. After this, contaminant sequences (e.g., archaea, mitochondria and chloroplast) were removed, and the resulting ASV table normalized to 11,000 sequences per sample before computing diversity analyses in QIIME 2 and visualizations using ggplot2 v.3.2.1 [53], vegan v.2.5-5 [54] and labdsv v.1.8-0 [55] packages of R software v.4.0.2 [56].

2.5. Statistical Analyses

Except otherwise indicated, all statistical analyses were performed using R software v.4.0.2 [56]. Comparisons between RCST were performed only within locations. Comparisons between locations were not performed due to differences in the number of sampled plots, soil type, differing fallow periods between locations and underlying variations in agronomic practices, among others. To test the first hypothesis, data (physicochemical properties, enzyme activities and alpha diversity metrics) were compared between 10YF, 1YF and PH in Umbeluzi and between 5YF and PH in Chokwe using the Kruskal–Wallis rank-sum test and the Mann–Whitney U test, respectively. To test the second hypothesis, the Wilcoxon rank-sum test was used to compare values between PH and 5mR in both locations. Spearman’s rank-order correlation was also performed to test the relationship among soil properties, enzyme activities and alpha diversity.
For beta diversity analyses of microbiome data, relative ASV counts were first log10-transformed (log10 (x) +1, where x > 0) [57] using the “decostand” function in the vegan R package. Thereafter, differentiation among RCST in multivariate space was determined based on Bray–Curtis dissimilarities and visualized by both principal coordinates analysis (PCoA) and dendrograms using ape v5.4.1 [58] and dendextend v1.12.0 [59] R packages, respectively. Determination of significant differences in multivariate space was based on permutational multivariate analysis of variance (PERMANOVA) using the vegan package. Further permutational test for homogeneity of multivariate dispersion (PERMDISP) was performed to test the significance of within-group differences. A post hoc test on significant PERMANOVA (FDR-adjusted p ≤ 0.05) was also performed using the function “pair-wise.adonis” in the vegan package.
To determine differentially abundant phylotypes (false discovery rate (FDR)-adjusted p < 0.05, least discriminant analysis (LDA) score > 4.0) among RCST at the phylum and genus taxonomic ranks, the least discriminant analysis (LDA) effect size (LEfSe) [60] was performed using MicrobiomeAnlayst [61]. To determine the physicochemical properties that influence bacterial communities of these soils, a constrained redundancy analysis (RDA) was performed on Hellinger-transformed environmental and bacterial data using ampvis2 and vegan R packages. The significance of the constrained RDA axis was determined based on a permutation test using the function “anova.cca ()” in the vegan package.
Furthermore, we constructed a co-occurrence network using FlashWeave [62]. Prediction of direct associations was based on a graphical model inference (local-to-global learning approach) [63] using a modified semi-interleaved HITON-PC algorithm [62]. False discovery rate (FDR) adjustment, compositionality correction of the dataset using the centered log-ratio (clr) approach (genus level phylotypes and environmental variables) and data filtering to remove phylotypes occurring in less than 30% of the samples, and with relative abundance <1% were performed before network generation. Thereafter, the generated networks were visualized using Gephi (https://gephi.org/; accessed on 2 March 2021), while the topological properties of the networks were determined using igraph [64]. The network nodes (phylotypes and chemical properties) were clustered into modules (communities) using a multilevel modularity optimization algorithm [65]. The nodes with the highest alpha and betweenness centrality scores (top 10 nodes present in both centrality metrics) were considered network and/or module hubs (keystone species). Furthermore, to determine if the relative abundance of a phylotype (network nodes) significantly affects their importance in the ecological network, the centrality metrics were z-score transformed and subjected to permutational multivariate analysis of variance using the “adonis()” function in the vegan package [54].

2.6. Deposition of Sequences

Sequence data generated for this study are available in the Sequence Read Archives (SRA) of the National Centre for Biotechnological Information (NCBI) under the accession number PRJNA511657.

3. Results

3.1. Chemical Characteristics of Bulk Soil in Relation to Rice Cultivation and Fallow Periods

The pH of rice-cultivated field soils was higher than those of fallow field soils in Umbeluzi and Chokwe (Table 2). In Umbeluzi, significant (p < 0.05) differences in pH, electrical conductivity (EC), ammonium nitrogen (NH4+–N) and nitrate (NO3–N) were observed between fields with different cultivation statuses (Table 2). NO3–N and NH4+–N were significantly (p < 0.05) higher in the ten years fallow field (10YF) than in both one-year fallow (1YF) and rice cultivated field at postharvest (PH). However, trends in pH, total N and P-Olsen indicated higher values in the rice-cultivated field (PH) than in 10YF and 1YF; values of pH, total N and P-Olsen in 1YF were intermediate between 10YF and PH (Table 2). In Chokwe, significantly (p < 0.05) higher SOC and NH4+–N were observed in 5YF than in PH, whereas NO3–N was significantly (p < 0.05) higher in PH compared to 5YF (Table 2).
Between PH and 5-months off-season recovery (5mR) time points in Umbeluzi, a significant (p < 0.05) increase was observed in only EC, NO3–N and K, whereas a significant (p < 0.05) reduction was observed in the only NH4+–N and P-Olsen. In Chokwe, EC, C, NO3–N, and total N increased significantly (p < 0.05) between PH and 5mR sampling time points, whereas pH and moisture content reduced significantly (p < 0.05) during the five months (Table 2).

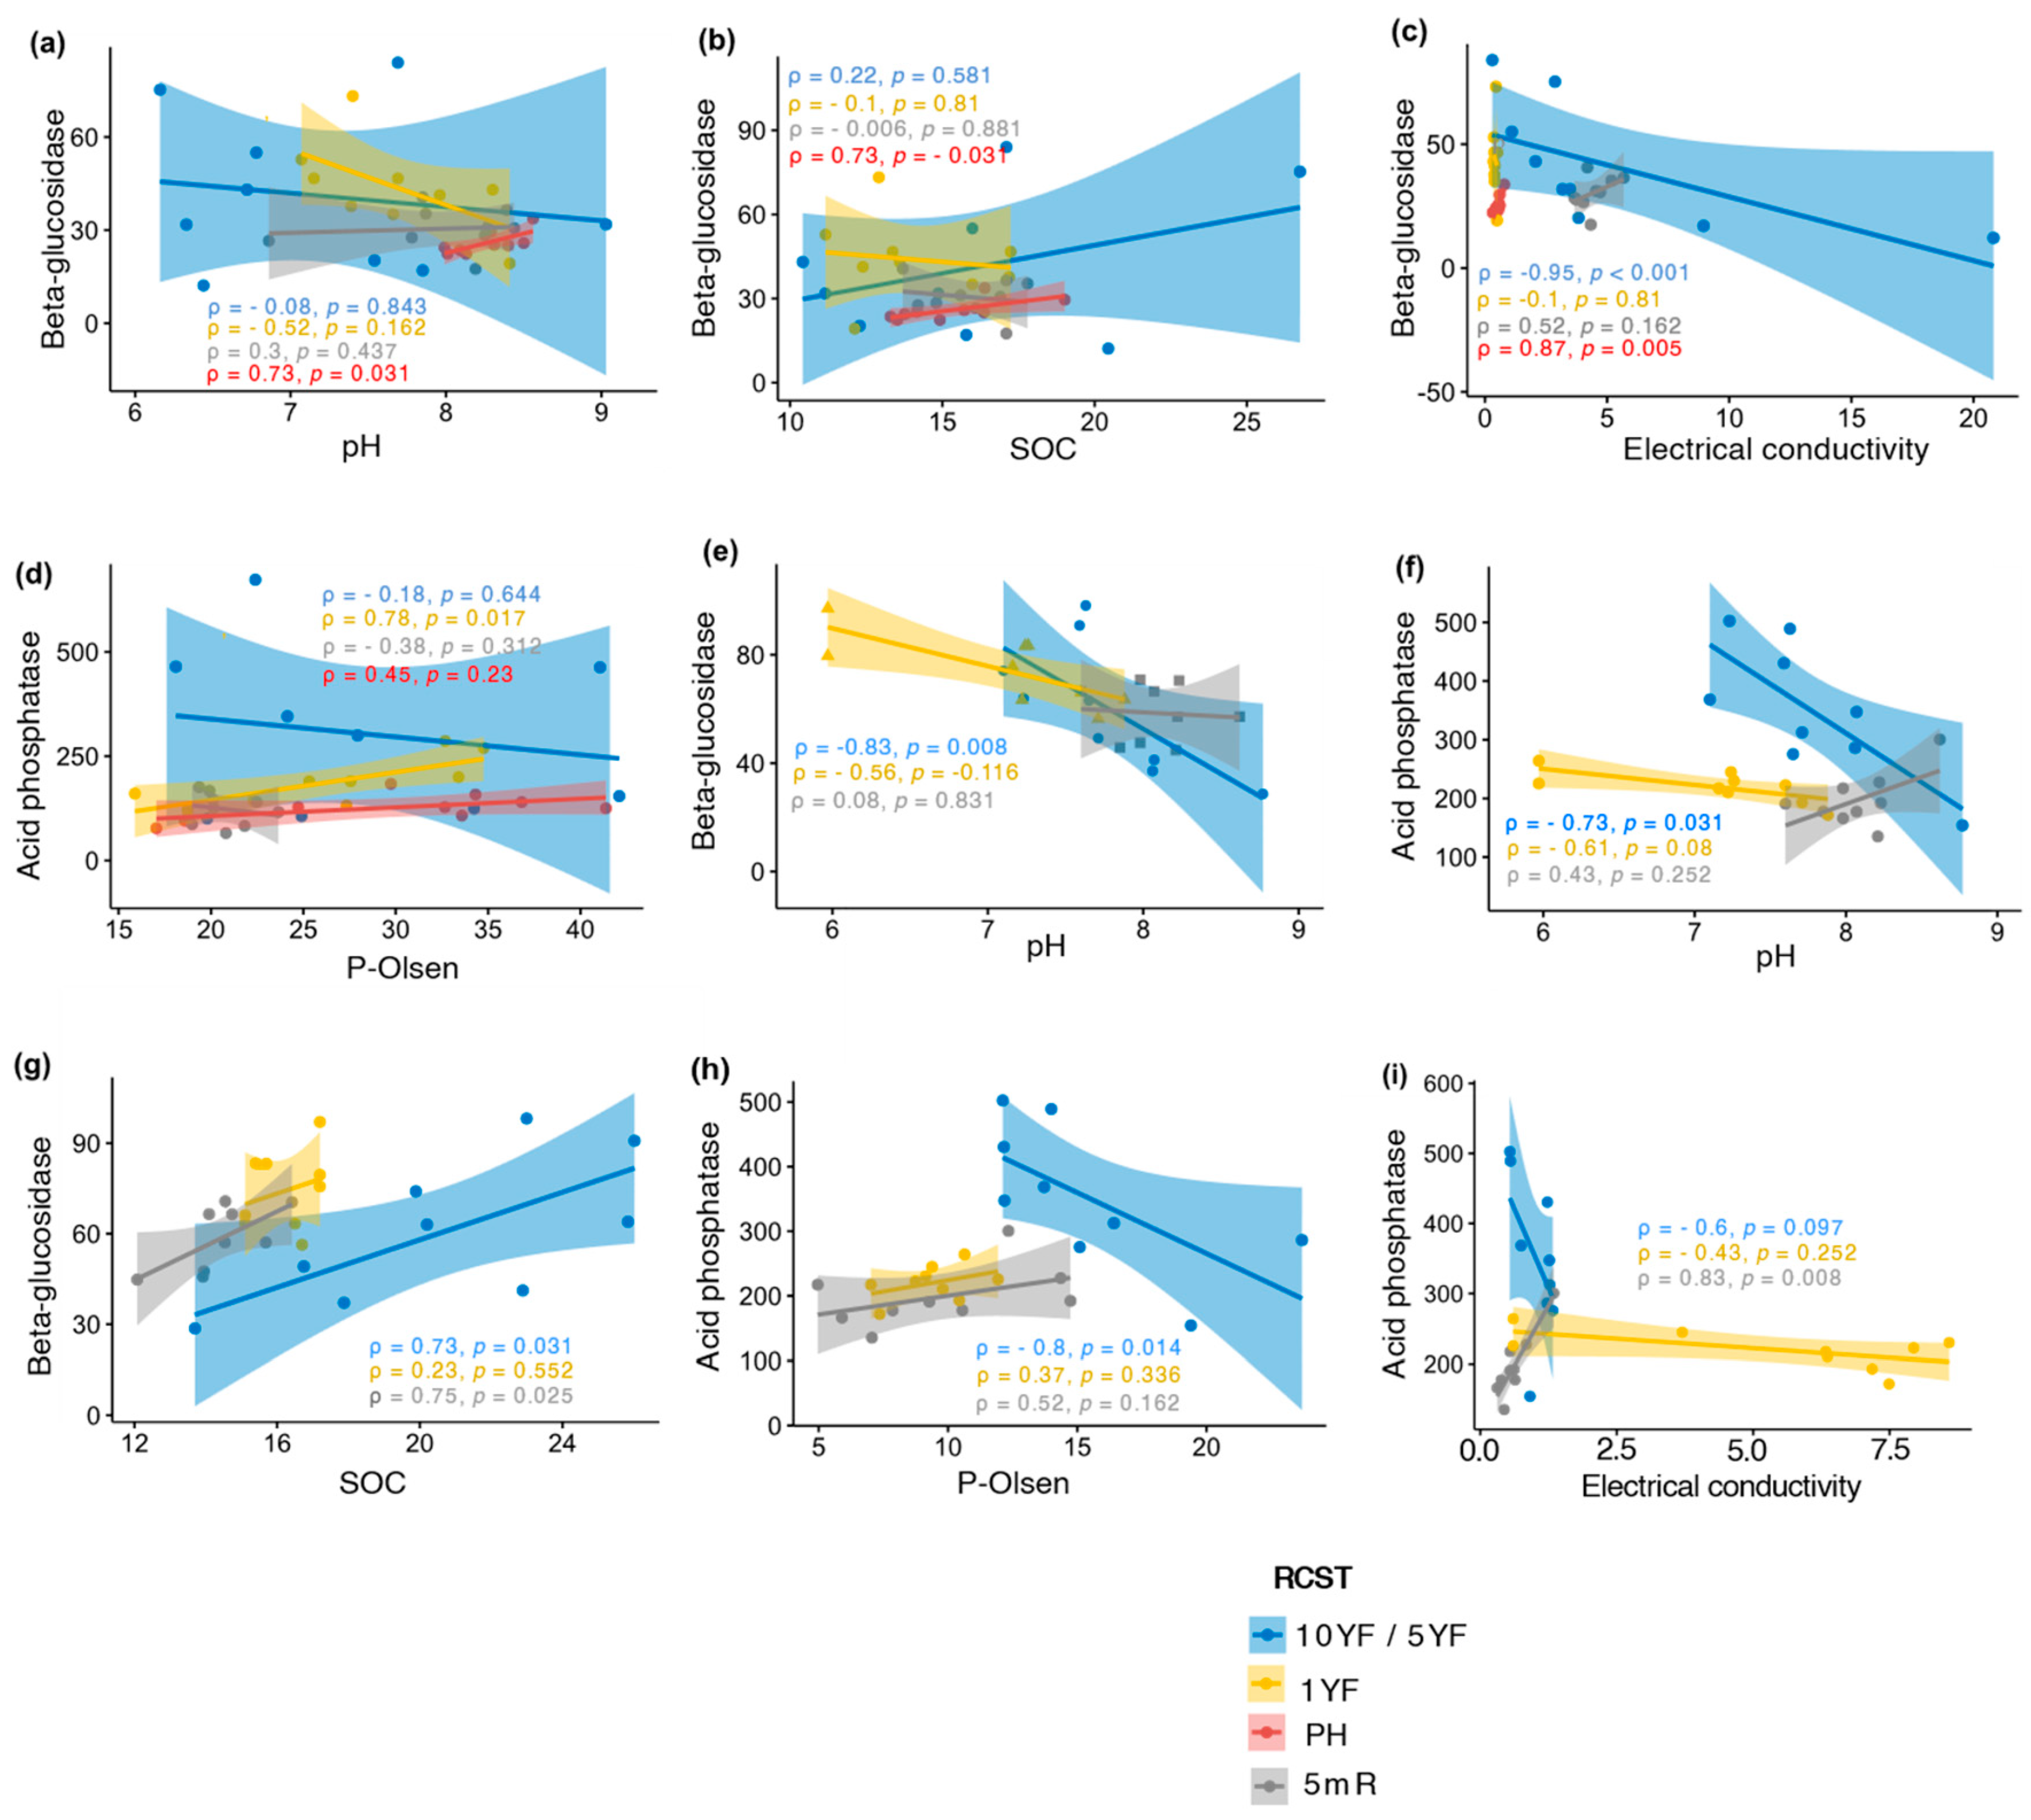
3.2. Enzyme Activities and Relationship with Sol Properties

With the exception of urease activity in Chokwe, enzyme activities were mostly higher in the 10-year fallow soils compared to the rice-cultivated (PH) soil in Umbeluzi and Chokwe (Table 3). However, significant (p < 0.05) differences were detected in only β-glucosidase and acid phosphatase activities among RCST in Umbeluzi and Chokwe, respectively (Table 3). The β-glucosidase activity was significantly (p < 0.05) higher in 1YF than in PH in Umbeluzi, while acid phosphatase activity was significantly (p < 0.05) higher in 5YF compared to PH in Chokwe. Only β-glucosidase activities were significantly different between PH and 5mR in both Umbeluzi and Chokwe, suggesting that of all enzymes assayed in this study, β-glucosidase is the most responsive (dynamic) following the five months off-season period (Table 3).
For the identification of soil chemical properties that drive the significant differences in β-glucosidase and acid phosphatase activities observed in both study locations, a Spearman rank-order correlation was performed. In Chokwe, a positive significant (p < 0.05) correlation was observed between pH and β-glucosidase activity in the PH site (rho = 0.73, p = 0.031), whereas a negative association was observed between pH and β-glucosidase activity in the corresponding 5YF site (rho = −0.83, p = 0.008) (Figure 1a,e). In addition, significant (p < 0.05) positive associations between β-glucosidase activities and SOC were observed for PH in Umbeluzi and 5YF in Chokwe (Figure 1b,g). Interestingly, in the 10YF field in Umbeluzi, β-glucosidase activity correlated negatively with EC (rho = −0.95, p < 0.001), but correlated positively with EC in PH (rho = 0.87, p = 0.005) (Figure 1c). Similarly, acid phosphatase activity was positively correlated with P-Olsen in 1YF soils in Umbeluzi (rho = 0.78, p = 0.017) (Figure 1d), but negatively correlated with P-Olsen for 5mR in Chokwe (rho = −0.80, p = 0.014) (Figure 1h). In Chokwe, a negative correlation was observed between acid phosphatase activities and pH in soils from 5YF (rho = −0.73, p = 0.031) (Figure 1f), while a positive correlation was observed between acid phosphatase activity and soil electrical conductivity in soils from 5mR (rho = 0.83, p = 0.008) (Figure 1i).

3.3. Bacterial Diversity and Community Structure in Fallow and Rice-Field Soils

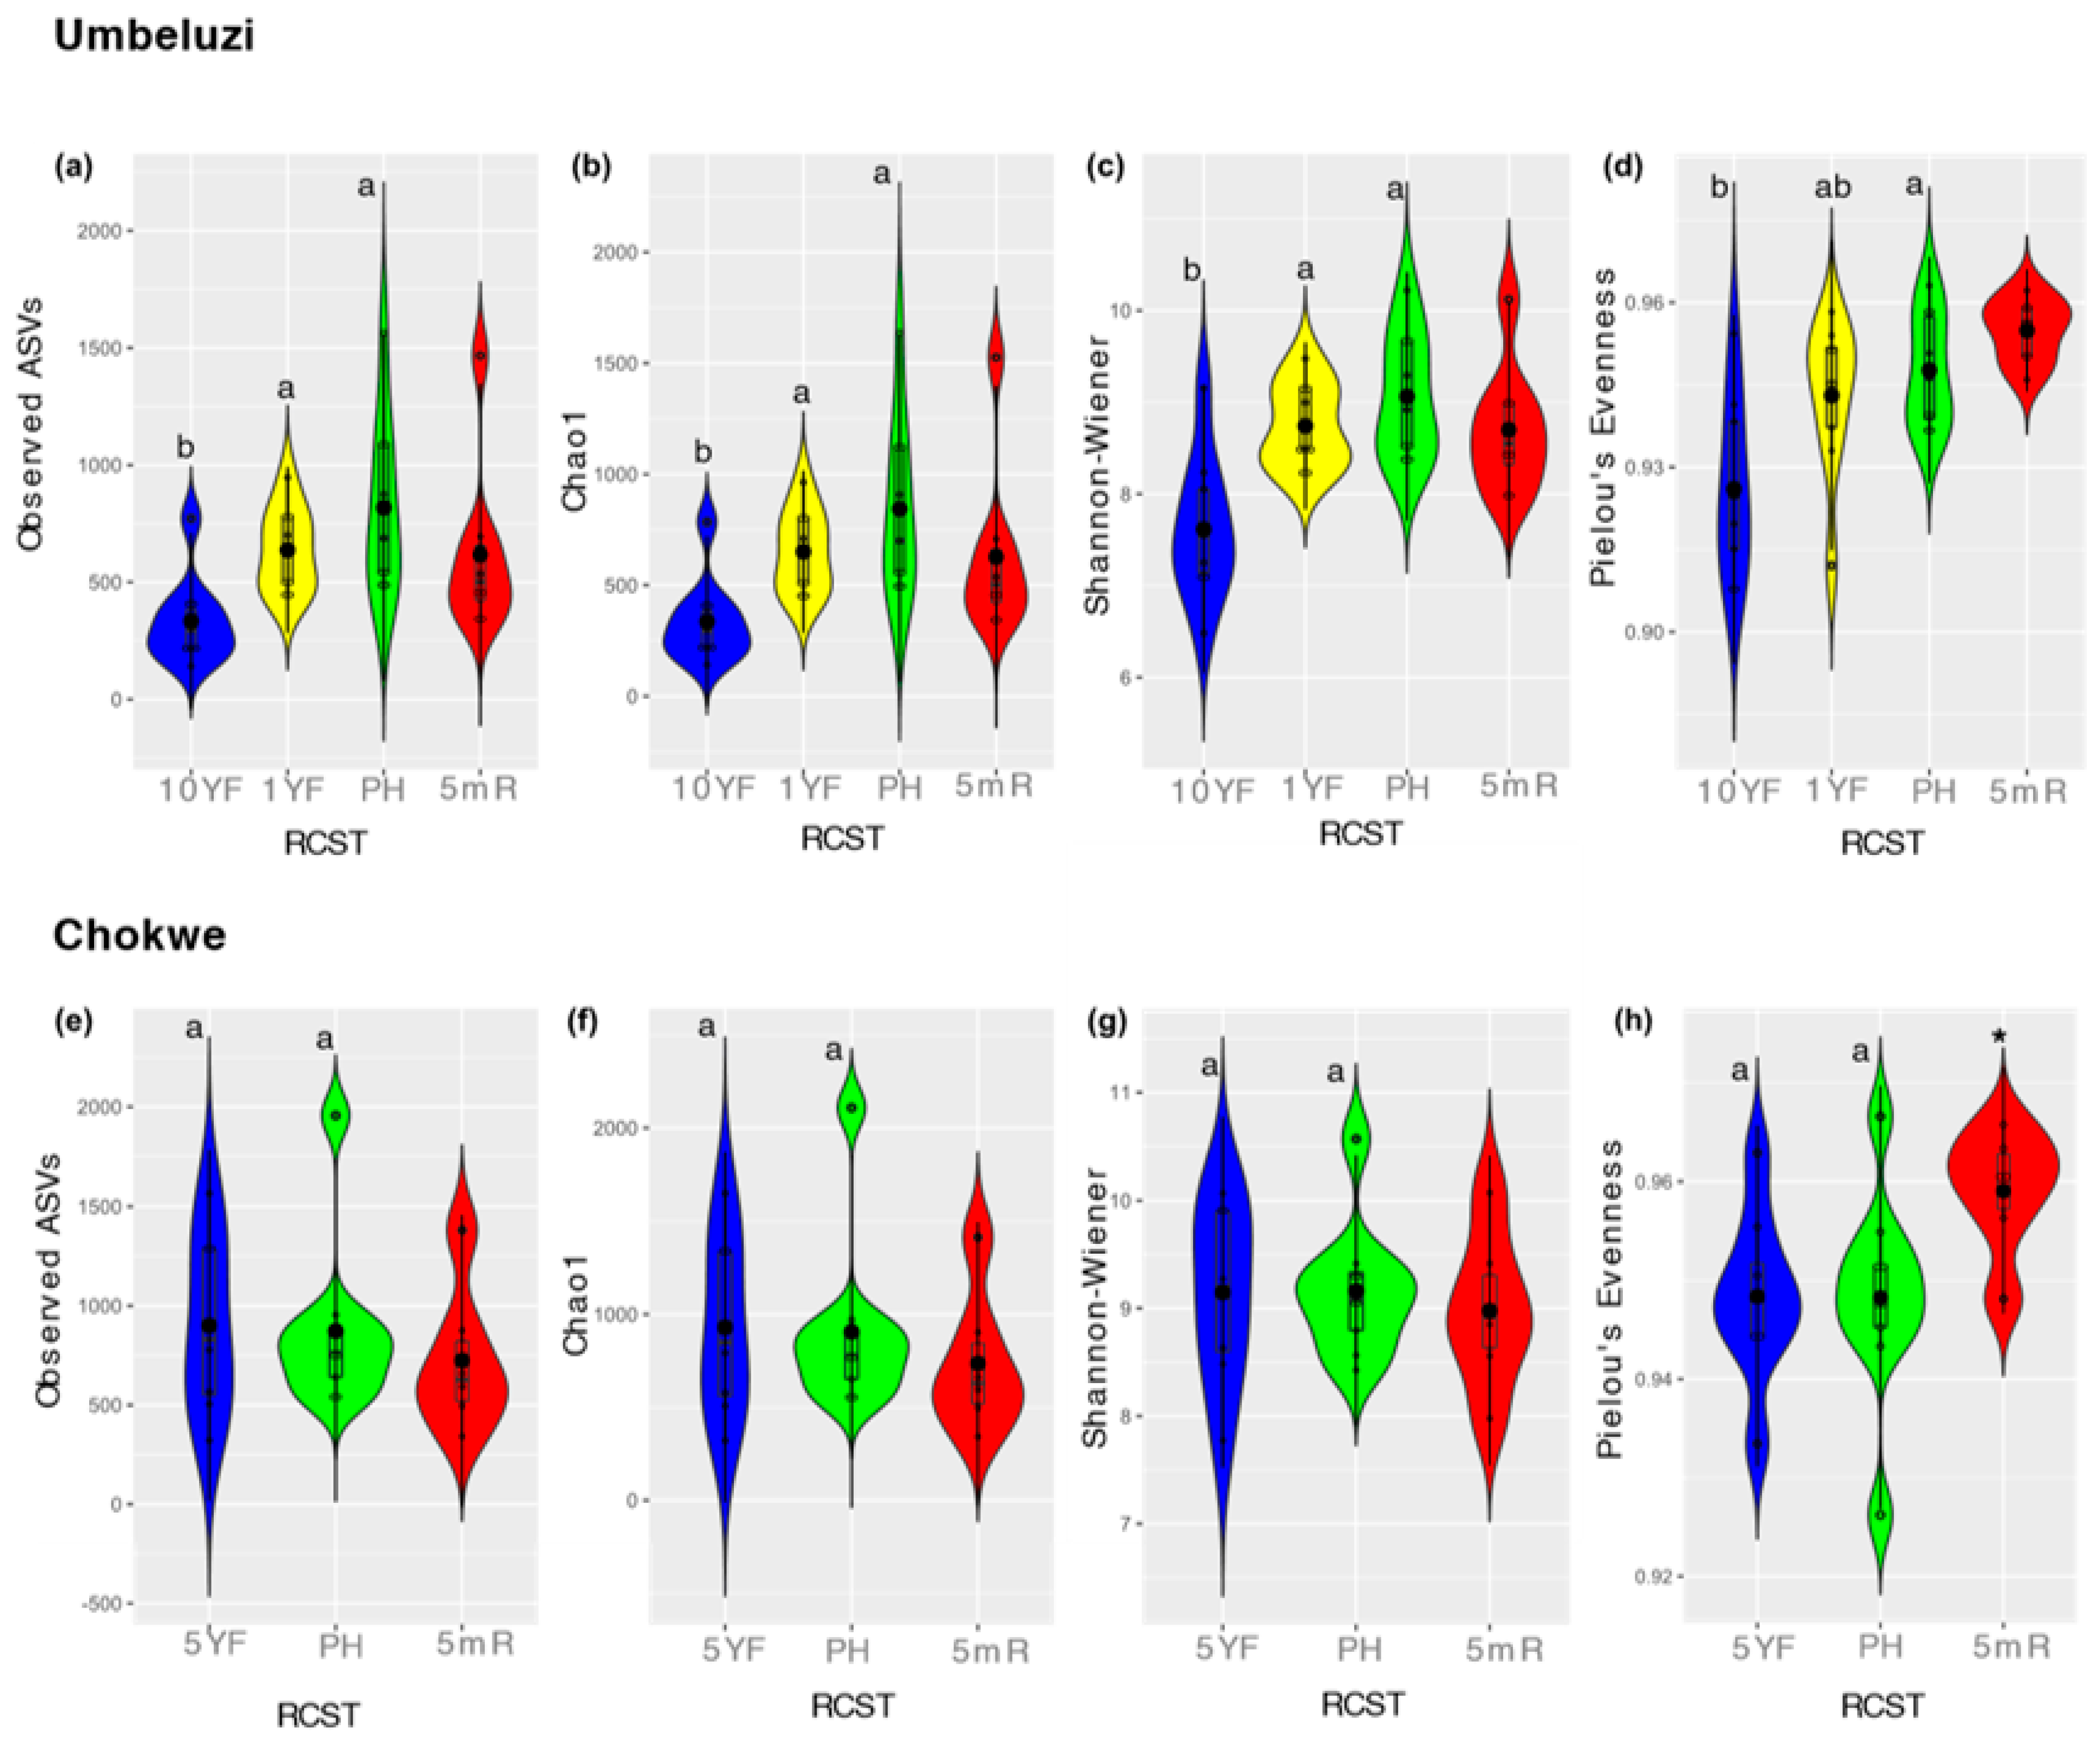
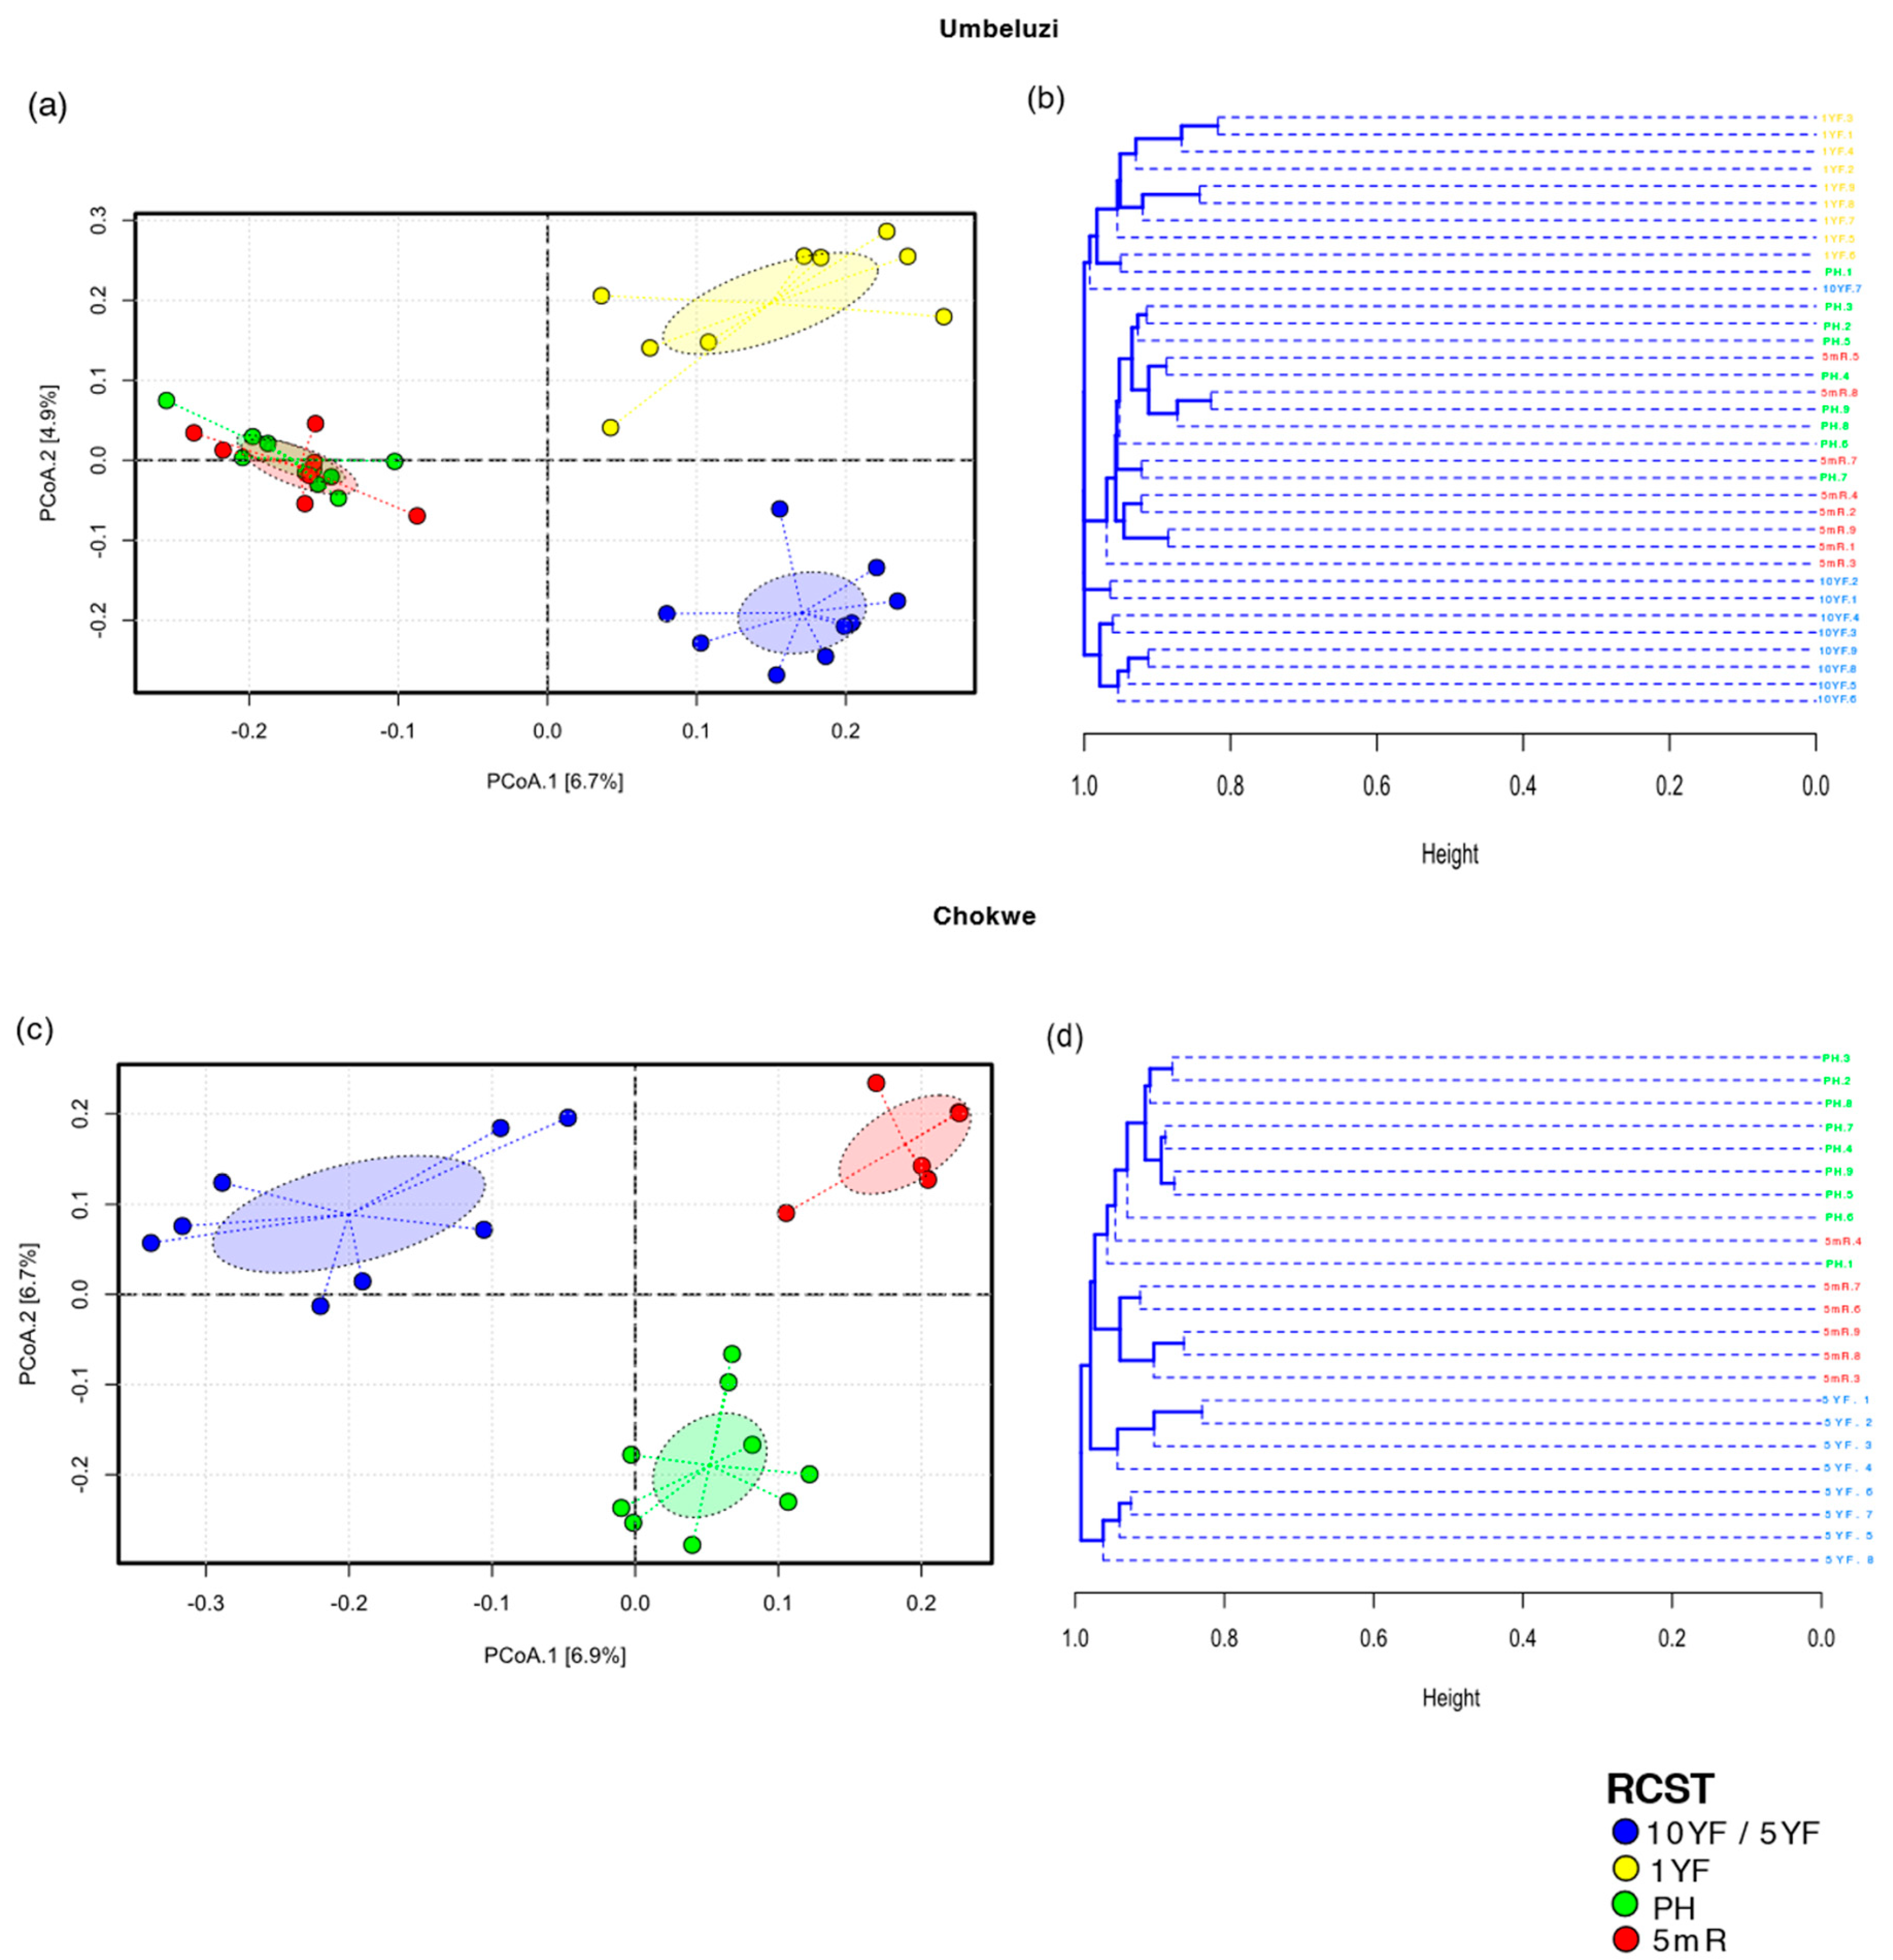
3.3.1. Bacterial Diversity and Community Differentiation of ASVs

Following quality control (i.e., read trimming, low-quality filtering, denoising and chimeric sequences removal), a total of 3,606,164 high-quality sequence reads were clustered into ASVs (data not shown). After taxonomic classification of ASVs and elimination of non-bacterial phylotypes, rarefaction of sequence reads to 11,000 reads per sample was sufficient to describe the bacterial diversity in all soil samples (Supplementary Figure S1). In both Umbeluzi and Chokwe, the number of ASVs unique to the rice-cultivated soil (i.e., PH) was higher than in fallow fields (10YF and 5YF) (Figure S2a,b). In Umbeluzi, the number of ASVs in the sampled soils increased in the order of 10YF < 1YF < PH (Figure S2a). Interestingly, a reduction in total ASVs and unique ASVs was observed between PH and 5mR time points in both locations (Figure S2c,d).
The observed ASVs and Chao1 revealed higher species richness in PH compared to fallow fields in both locations, with significant (Bonferroni-adjusted p < 0.05) differences only between PH and 10YF in Umbeluzi (Figure 2a,b,e,f). Similarly, in Umbeluzi, ASV diversity (based on Shannon–Wiener index) was significantly higher in PH than in 10YF with no significant differences (p > 0.05) observed for PH and 5YF in Chokwe (Figure 2c,g). In addition, in Umbeluzi, the proportionality of species (evenness) in the soil bacterial community of PH was significantly higher than in 10YF, with species evenness in 1YF intermediate, but not significantly (p > 0.05) different from 10YF and PH (Figure 2d). This observation suggests that rice cultivation does not exert selective pressure on bacterial species compared to sites that have been fallow for more than one year. Except for significant (Wilcoxon, p < 0.05) differences in species evenness between PH and 5mR in Chokwe, no significant (p > 0.05) differences in species richness, diversity and proportionality were observed between postharvest and pre-planting time points (5 months period) in both locations (Figure 2).
Due to the significant difference observed in species richness and diversity metrics between RCST in Umbeluzi, we performed a Spearman’s rank correlation to obtain insight into the relationship between soil properties and species diversity in Umbeluzi. Correlation analysis revealed that species diversity and richness are directly related with selected soil properties, including NO3–N (r =0.48, p = 0.0115), NH4+–N (r = 0.68, p = 0.0001) and electrical conductivity (r = 0.49, p = 0.012).
Bray–Curtis dissimilarity between soil bacterial community structure of RCST in Chokwe and Umbeluzi revealed differentiation between fallow fields (10YF, 5YF or 1YF) and rice-cultivated fields (PH or 5mR) in ordination space (Figure 3). While differentiation between different sampling timepoints (PH and 5mR) did not show distinct differentiation in multivariate space in Umbeluzi (Figure 2a,b), differentiation was observed between RCST in Chokwe (Figure 3c); this was also largely supported by the UPGMA cluster dendrogram in Figure 3d. The observed differences in multivariate space were significant in both Umbeluzi (PERMANOVA R2 =14.21%, p = 0.001; PERMDISP p = 0.106) and Chokwe (PERMANOVA R2 = 12.97%, p = 0.001; PERMDISP, p = 0.223). Pair-wise comparisons (post hoc PERMANOVA) revealed that the bacterial community structures are significantly different (FDR-adjusted p < 0.05) between RCST in both geographical locations (Table S1). Interestingly, the observed significant differences were not only between rice-cultivated (PH) and fallow soils (10YF, 5YF or 1YF) but also between postharvest (PH) and pre-planting (5mR) time points (Table S1).

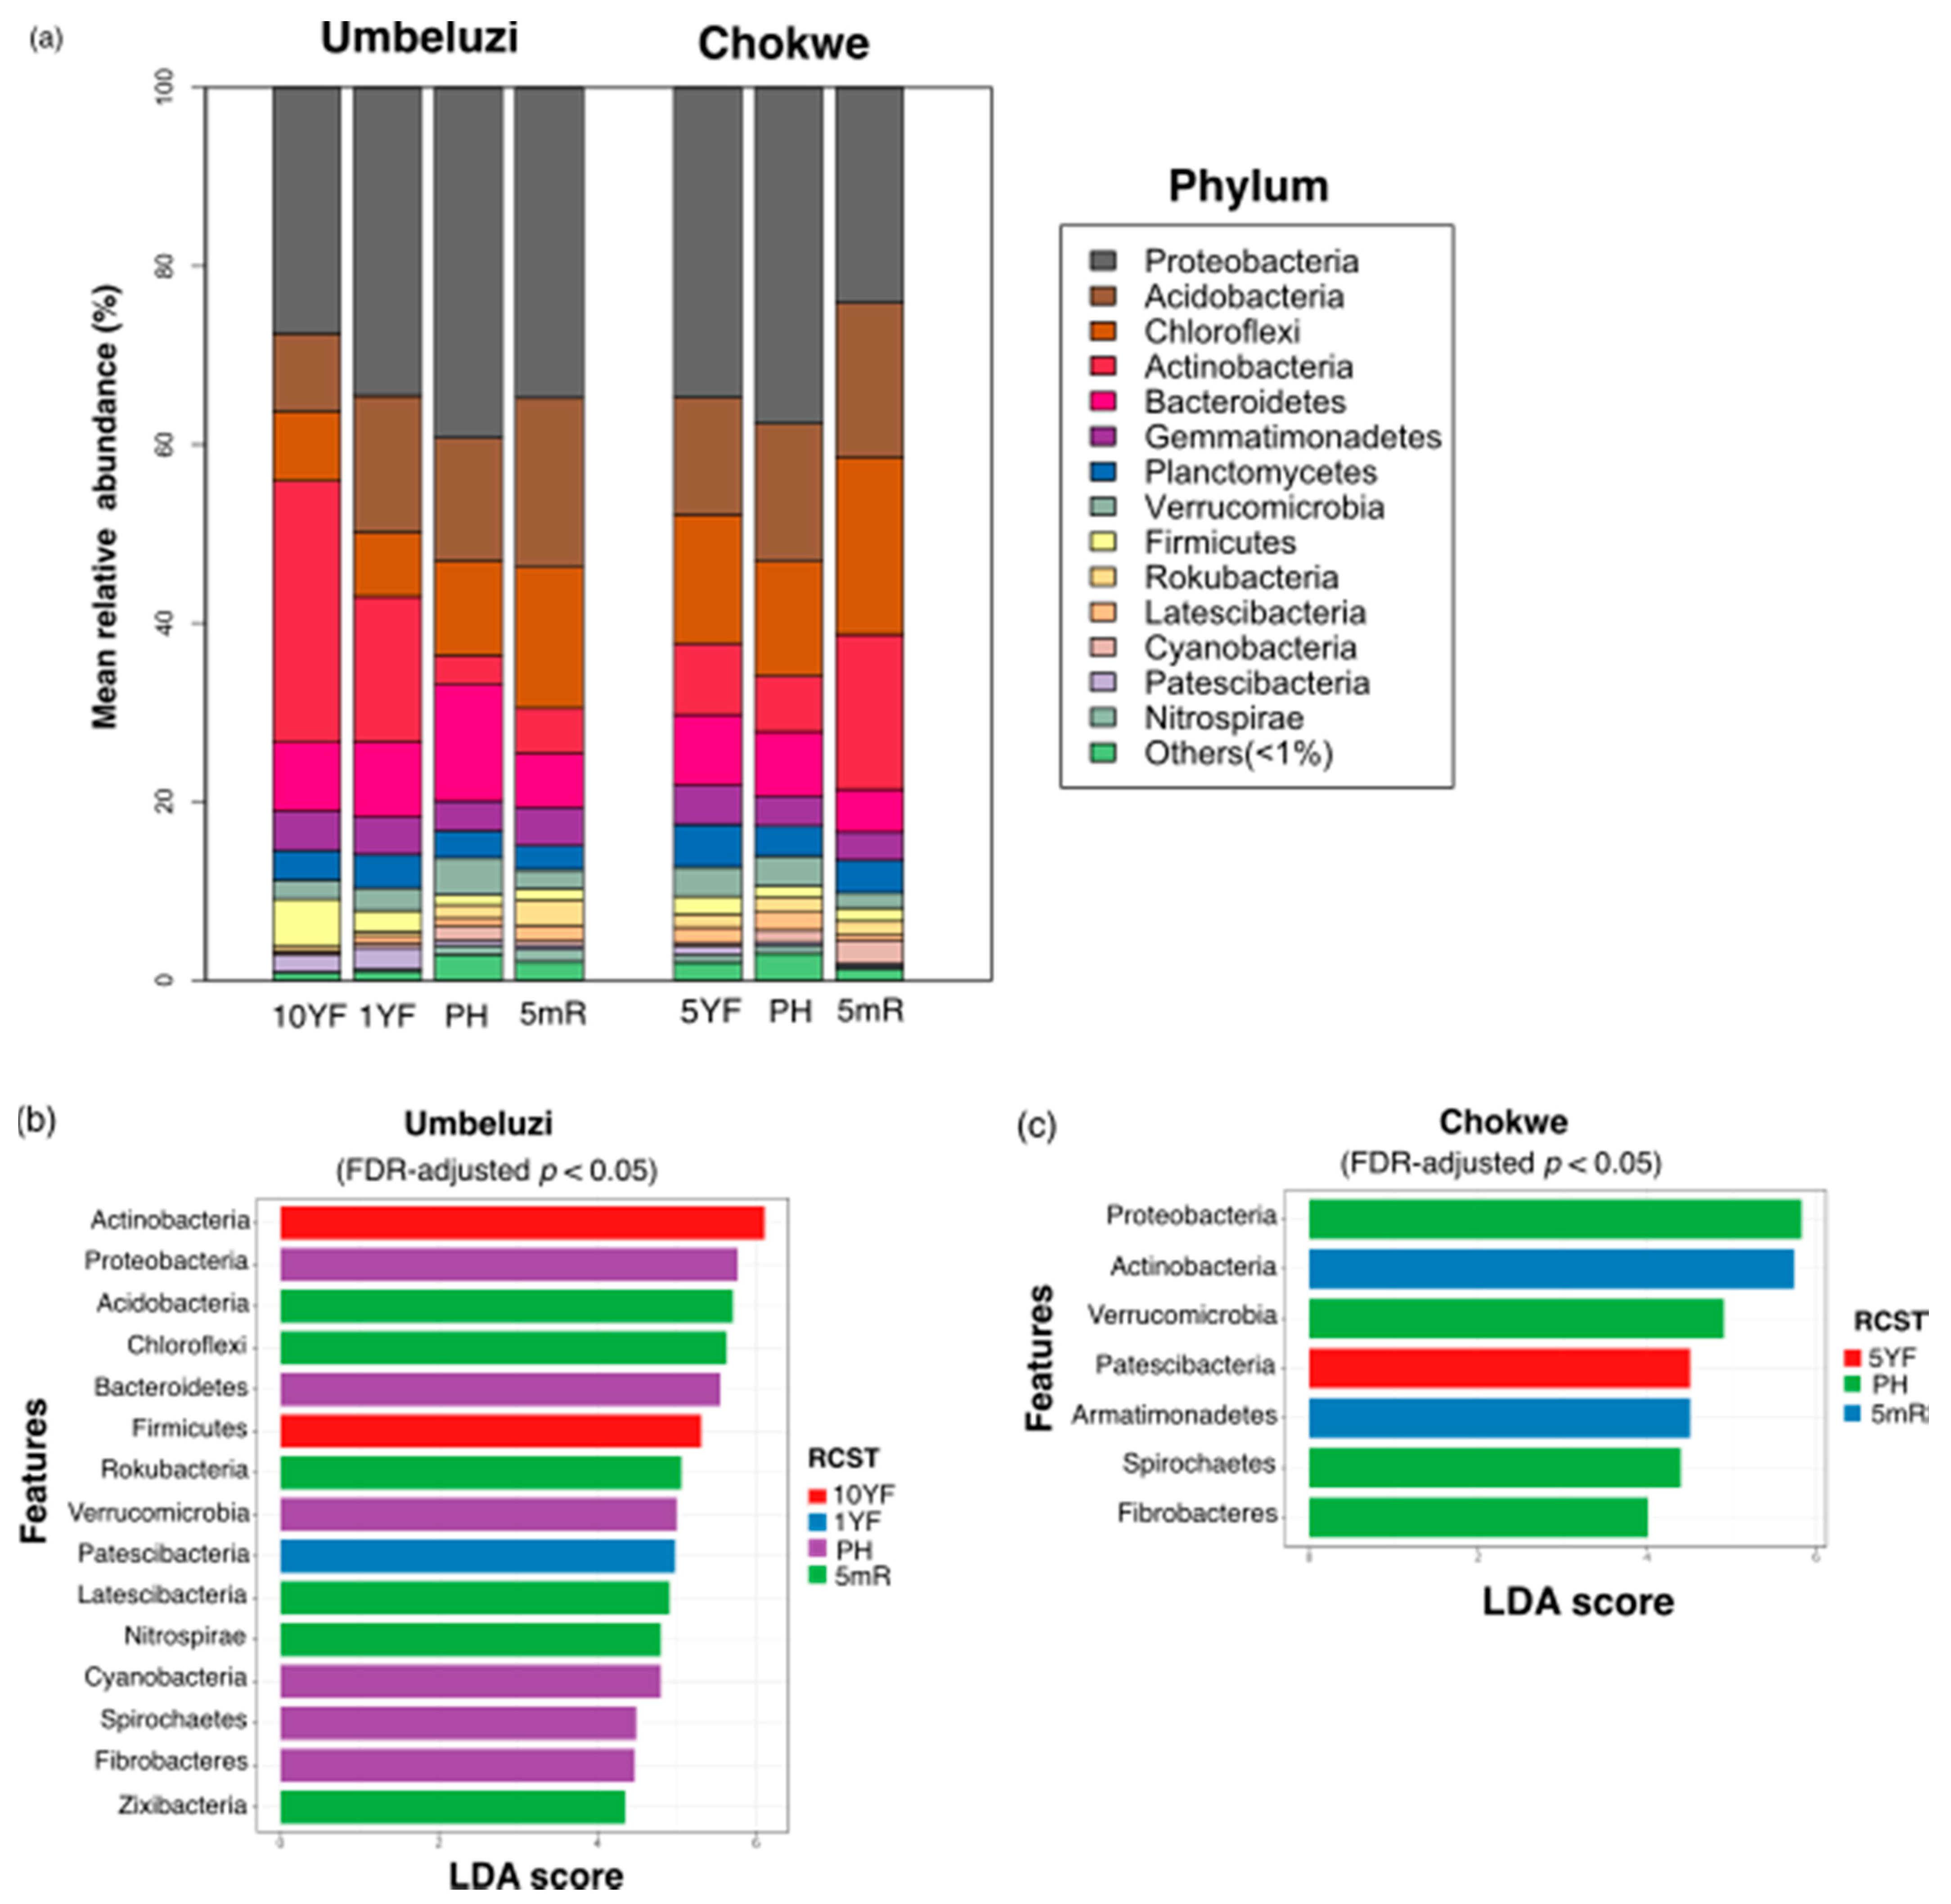
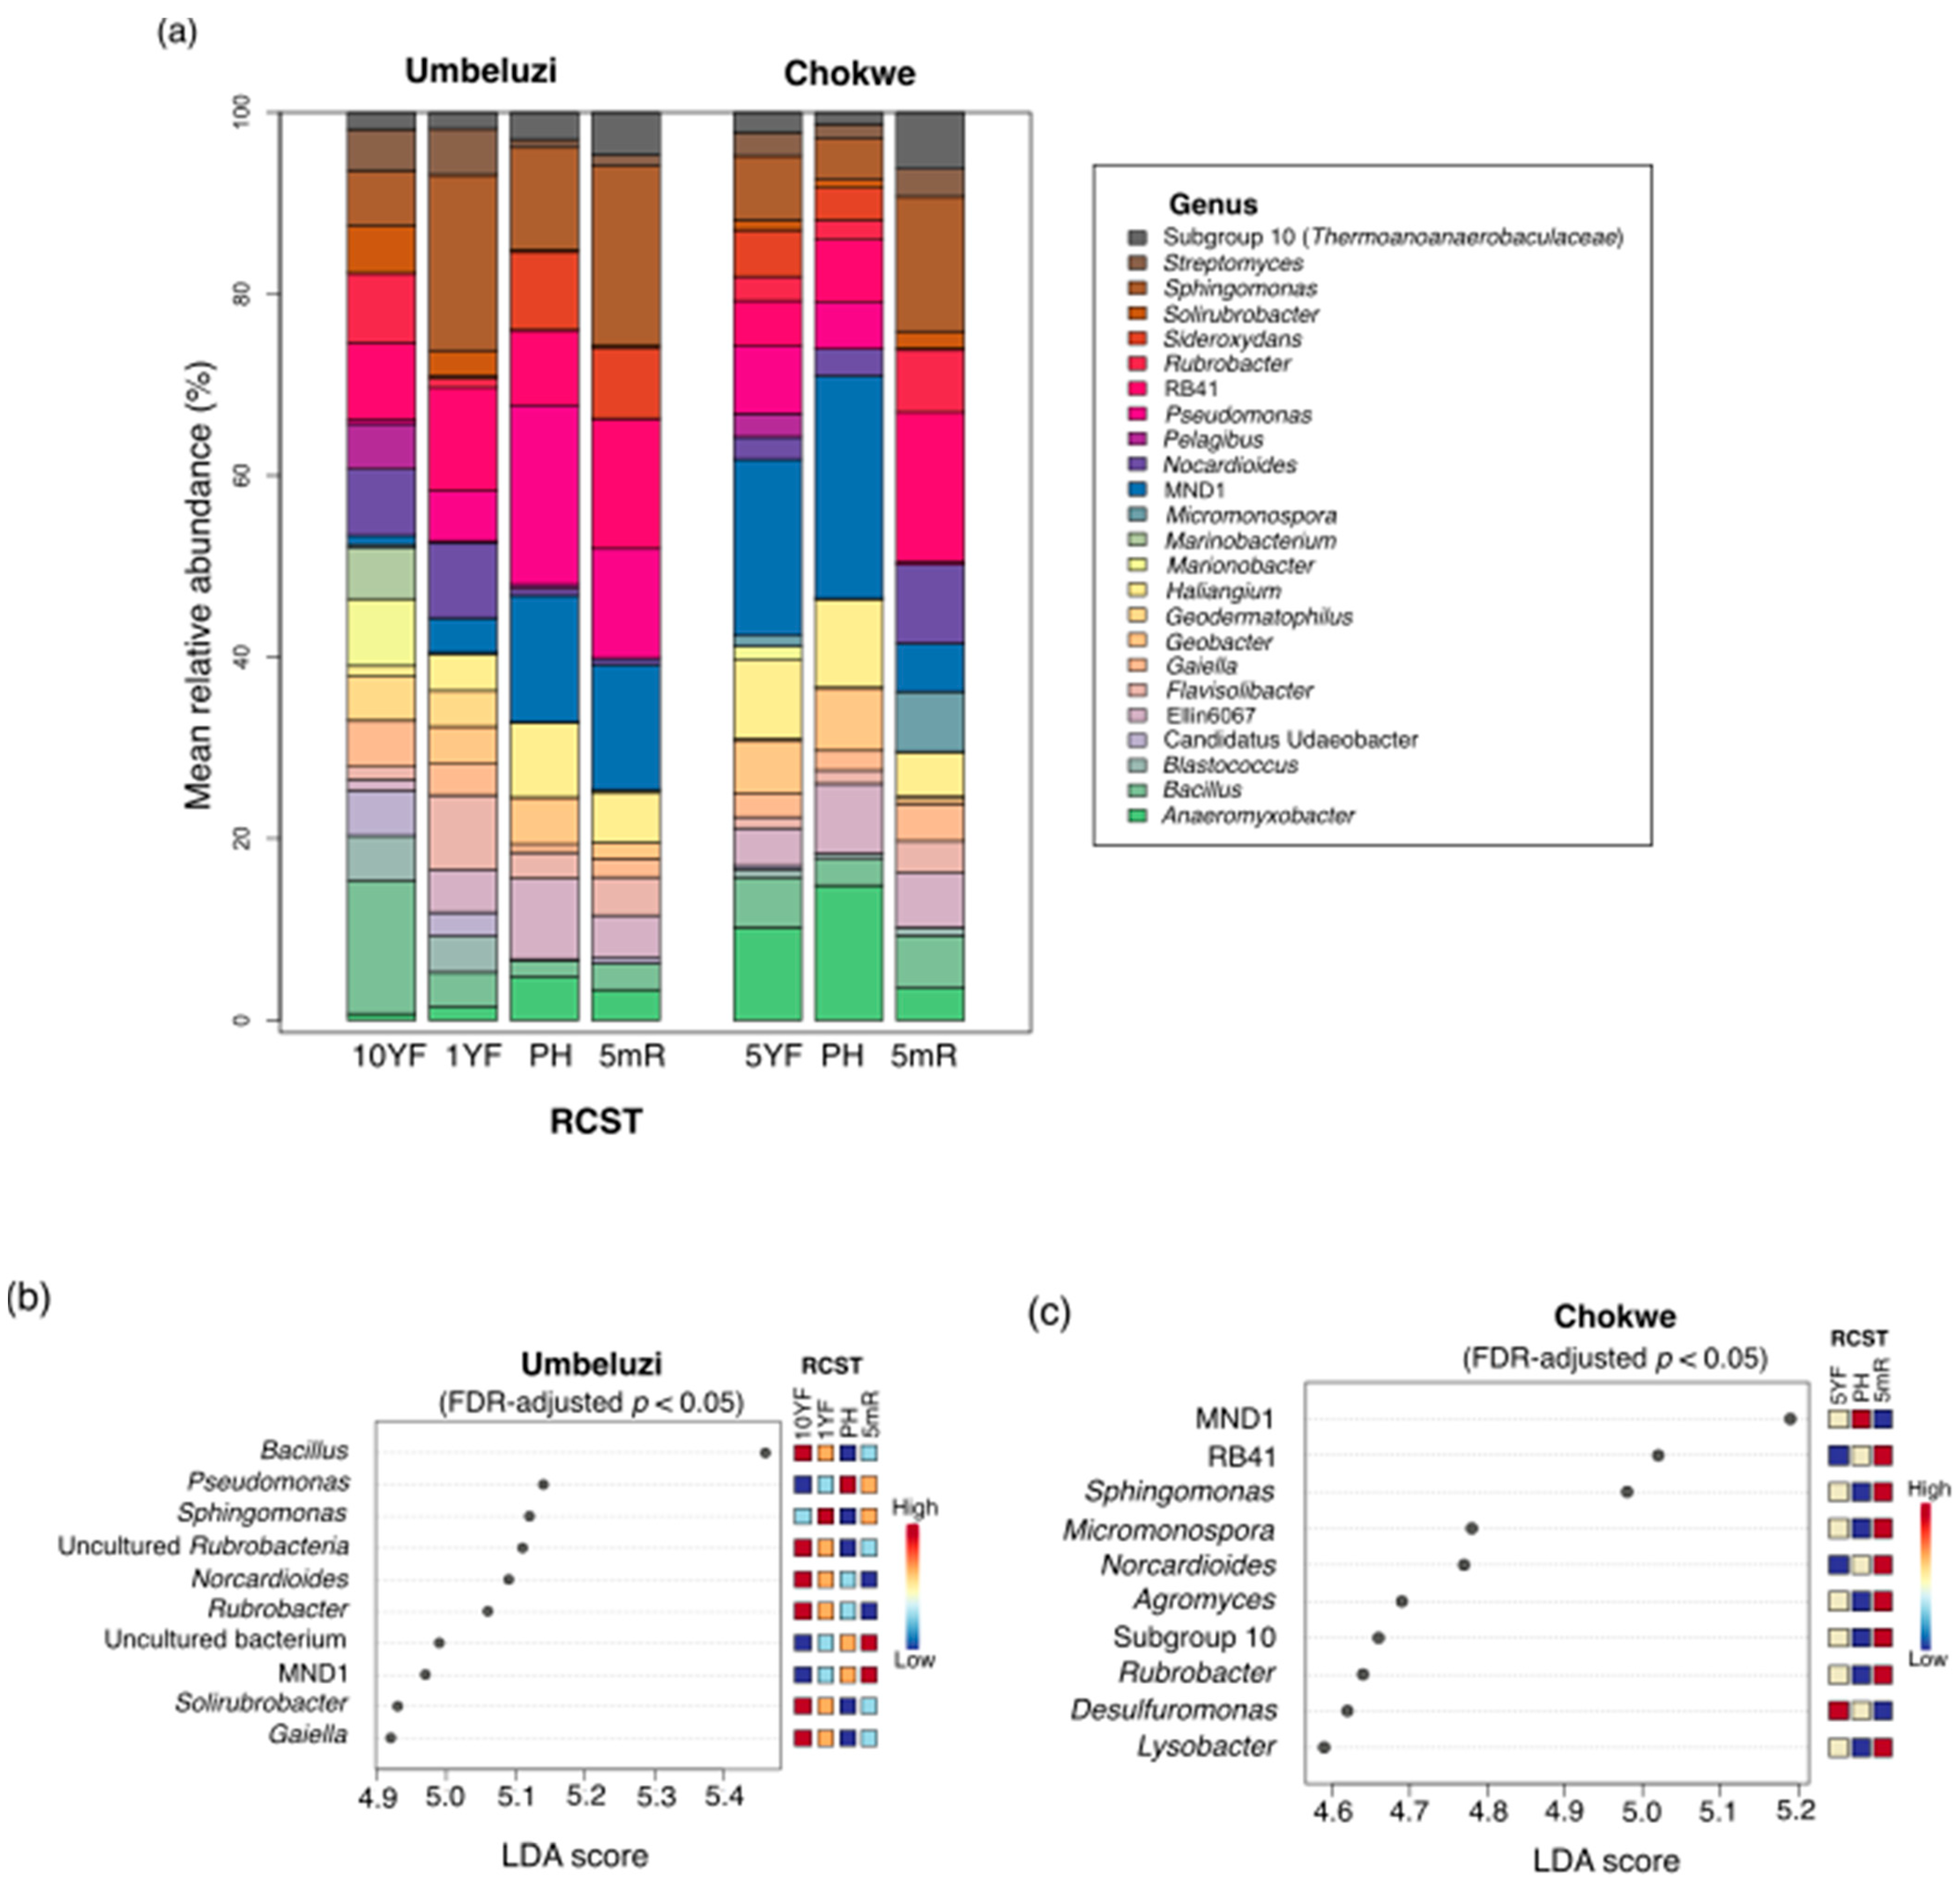
3.3.2. Taxonomic Diversity and Differentially Abundant Phylotypes

The ASVs detected in all RCST spanned 47 phyla (Umbeluzi = 46 phyla; Chokwe = 43 phyla). Proteobacteria was relatively more abundant in all, but the ten-year fallow (10YF) site in Umbeluzi, where Actinobacteria was the most abundant phylum (Figure 4). Other relatively abundant (>10%) phyla in at least one RCST across both Umbeluzi and Chokwe include Acidobacteria, Bacteroidetes and Chloroflexi. Notably, in Umbeluzi, Actinobacteria was relatively more abundant in 10YF than in 1YF and the cultivated field (PH or 5mR). In contrast, Bacteroidetes were notably higher in the cultivated field (PH) in Umbeluzi than in the corresponding 10YF (Figure 4a). During the 5-month off-season period in Umbeluzi, the relative abundance of Actinobacteria, Chloroflexi, Germatiomonadetes, and Rokubacteria phyla increased, whereas those of Bacteroidetes, Verrucomicrobia markedly reduced in the same period (Figure 4a). In Chokwe, higher relative abundances of Proteobacteria and Acidobacteria were observed in the cultivated PH soil compared to 5YF, whereas markedly higher relative abundances of Actinobacteria and Chloroflexi were observed in 5YF compared to the cultivated site (PH). During the 5-month off-season period in Chokwe, increased relative abundances of Chloroflexi and Actinobacteria were observed, whereas the relative abundances of Bacteroidetes and Proteobacteria reduced in the same period (Figure 4a).
Sixteen and seven phylum-level features were differentially (FDR-adjusted p < 0.05, LDA > 4.0) abundant among RCST in Umbeluzi and Chokwe, respectively (Figure 4b,c). In Umbeluzi, Actinobacteria and Firmicutes were differentially most abundant in 10YF (Figure 4b). In contrast, Proteobacteria, Bacteroidetes, Verrucomicrobia, Cyanobacteria, Spirochetes and Fibrobacteres were differentially abundant in rice-cultivate soils at the PH time point, while Acidobacteria, Chloroflexi, Rokubacteria, Latescibacteria, Nitrospirae and Zixibacteria were differentially more abundant in the rice-cultivated field at the 5mR time point compared to other RCST (Figure 4b). In Chokwe, only Patescibacteria was differentially more abundant in the fallow field (5YF) compared to other RCST (Figure 4c), while 57% (4/7) of the differentially abundant phyla were most abundant in the rice-cultivated field at the postharvest (PH) time point (Figure 4c). In contrast, Actinobacteria and Armatimonadetes were differentially most abundant in 5mR (Figure 4c).
At the genus taxonomic rank, 24 classifiable phylotypes were relatively abundant (≥1%) in soils from at least one RCST (Figure 5a). Of these, Anaeromyxobacter, Bacillus, Haliangium, Marinobacter, MND1 (family: Nitrosomonadaceae), Nocardioides, Pseudomonas, RB41 (family: Pyrinomonadaceae), Rubrobacter and Sphingomonas were among the relatively more abundant phylotypes across RCST in both locations. In Umbeluzi, the genera Bacillus, Sphingomonas and Pseudomonas were more abundant in 10YF, 1YF and PH, respectively, whereas, in Chokwe, MND1 (family: Nitrosomonadaceae) was the most dominant in both 5YF and PH (Figure 5a). Between the PH and 5mR sampling time points (5-months postharvest fallow period), increased abundance of Marinobacter (+0.27% and +4.97%) and RB41 (+6.15% and +6.6%) was observed in both Umbeluzi and Chokwe locations, while an increase in Sphingomonas (+8.51%) and Geodermatophilus (+4.76%) was observed only in Umbeluzi and Chokwe, respectively. In contrast, a reduction in the relative abundance of MND1 (Nitrosomonadaceae) (−0.08% and −19.24%), Pseudomonas (−7.72% and −11.29%), Haliangium (−2.8% to 6.4%), Ellin6067 (family: Nitrosomonadaceae) (−4.23% and −4.98%), Sideroxydans (−0.82% and −4.77%), Rubrobacter (−0.07% and −3.4%) and Geobacter (−1.7 and −3.3%) was observed over the 5-month off-season period for both Umbeluzi and Chokwe locations (Figure 5a).
Following differential abundance testing, a total of 103 and 33 differentially abundant (Kruskal–Wallis FDR-adjusted p < 0.05, LDA > 4.0) genera were observed between all RCST in Umbeluzi and Chokwe, respectively (Tables S2 and S3). The first 10 (based on LDA score) differentially abundant genera in Umbeluzi and Chokwe are shown in Figure 5b,c, respectively. Notably, most of these top differentially abundant genera, such as Agromyces, Bacillus, Desulfuromonas, Gaiella, Lysobacter, Micromonospora, Norcadiodes RB41, Rubrobacter, Solirubrobacter and Sphingomonas, were more associated with the fallow (10YF, 5YF and 1YF) and 5mR soils. In contrast, only Pseudomonas and MND1 were differentially abundant in PH for Umbeluzi and Chokwe, respectively.

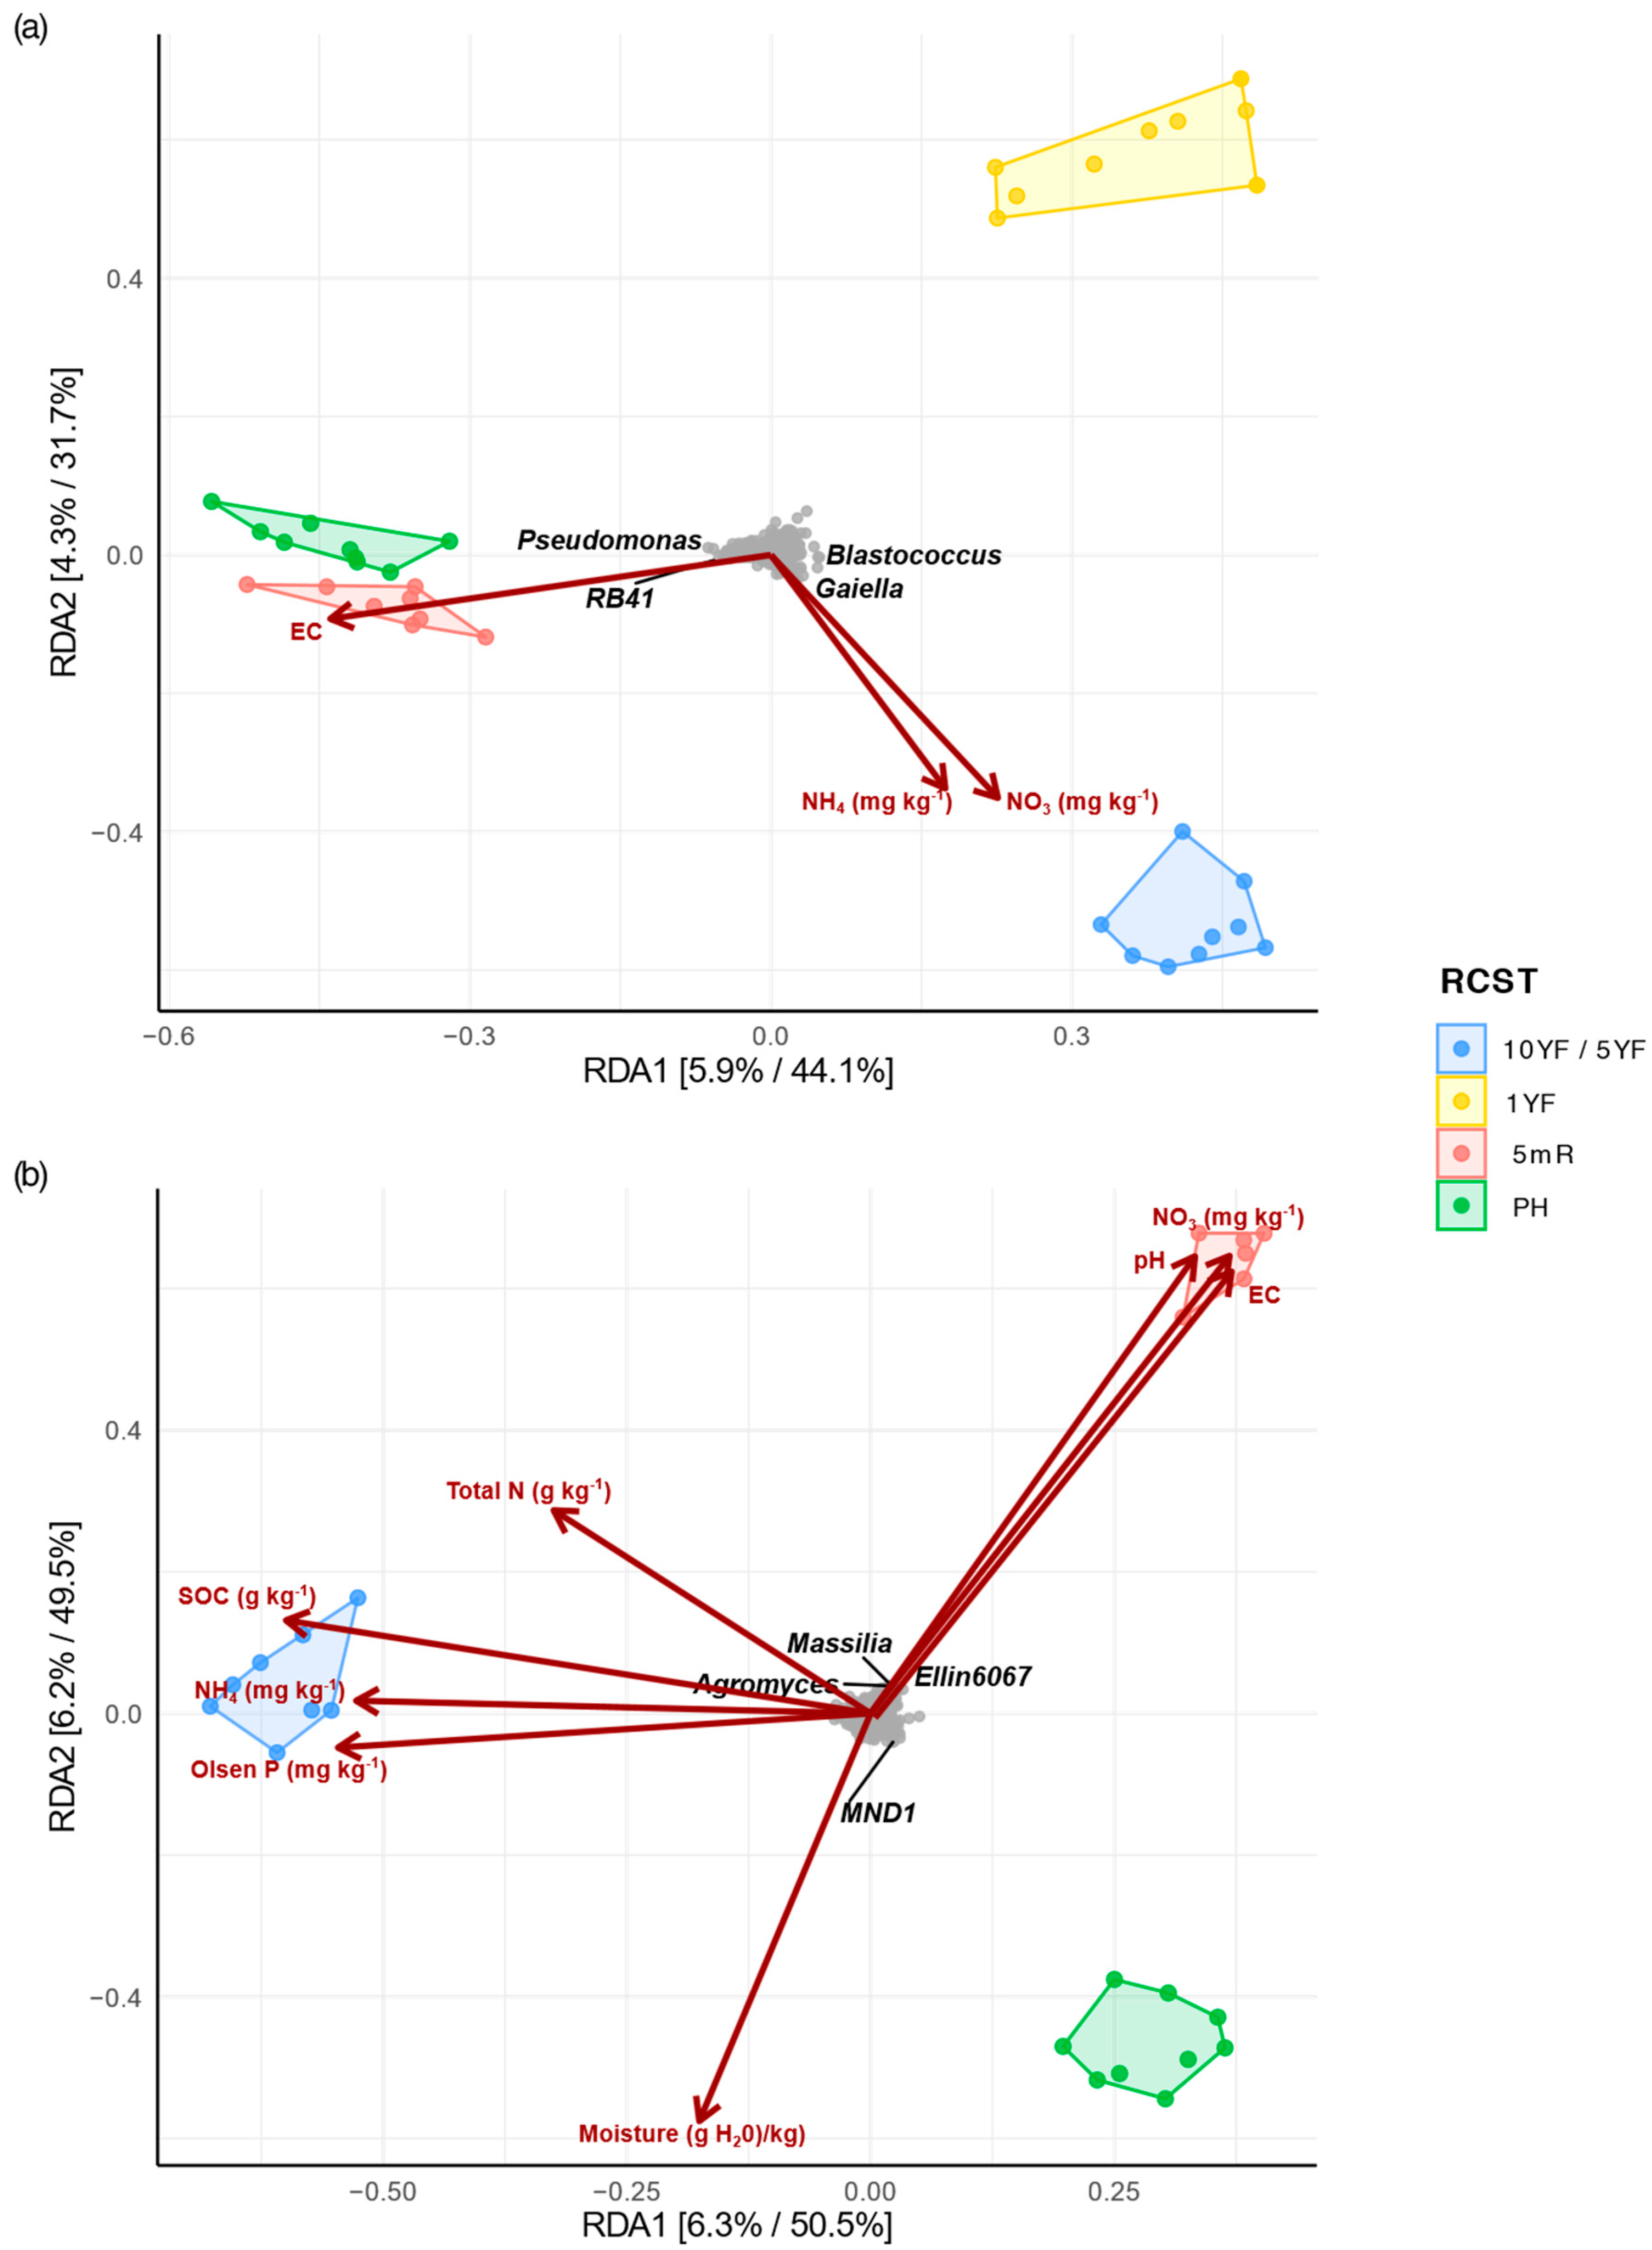
3.4. Relationship between Soil Properties and Bacterial Communities of RCST

The redundancy analysis (RDA) model for the association between bacterial species and chemical properties (environmental cues) in both Umbeluzi and Chokwe was significant (p = 0.001). The constrained variables explained only 12.72% and 11.21% of the bacterial community variations in Umbeluzi (Figure 6a) and Chokwe (Figure 6b), respectively. Permutational test of the significance of the environmental parameters in the RDA model revealed that ammonium nitrate (NH4+–N), nitrate (NO3–N), pH and EC significantly (p < 0.05) influenced the RCST bacterial communities in Umbeluzi (Table S4). Whereas in Chokwe, nitrate (NO3–N), total nitrogen, P-Olsen, moisture content, SOC, pH and electrical conductivity (EC) significantly (p < 0.05) influenced the RCST bacterial communities (Table S4). In Umbeluzi, ammonium (NH4+–N) and nitrate (NO3–N) strongly correlated with the centroid of the 10YF soil samples, whereas in Chokwe, nitrate (NO3–N) and EC were strongly correlated to the centroid of the 5mR soil samples. Furthermore, EC appeared to be the environmental variable differentiating the bacterial community of PH and 5mR soil from other RCST in Umbeluzi (Figure 6a). In contrast, SOC, NH4+–N and P-Olsen mostly shaped the bacterial community of 5YF in Chokwe (Figure 6b). Notably, most individual bacterial phylotypes (genus taxonomic rank) in RCST were largely uninfluenced by the measured soil chemical parameters (Figure 6a,b). However, in Umbeluzi, Pseudomonas and RB41 correlated with EC, while Gaiella correlated with NH4+–N and NO3–N. In Chokwe, Ellin6067, Masillia and Agromyces correlated with EC, pH and NO3–N (Figure 6b).

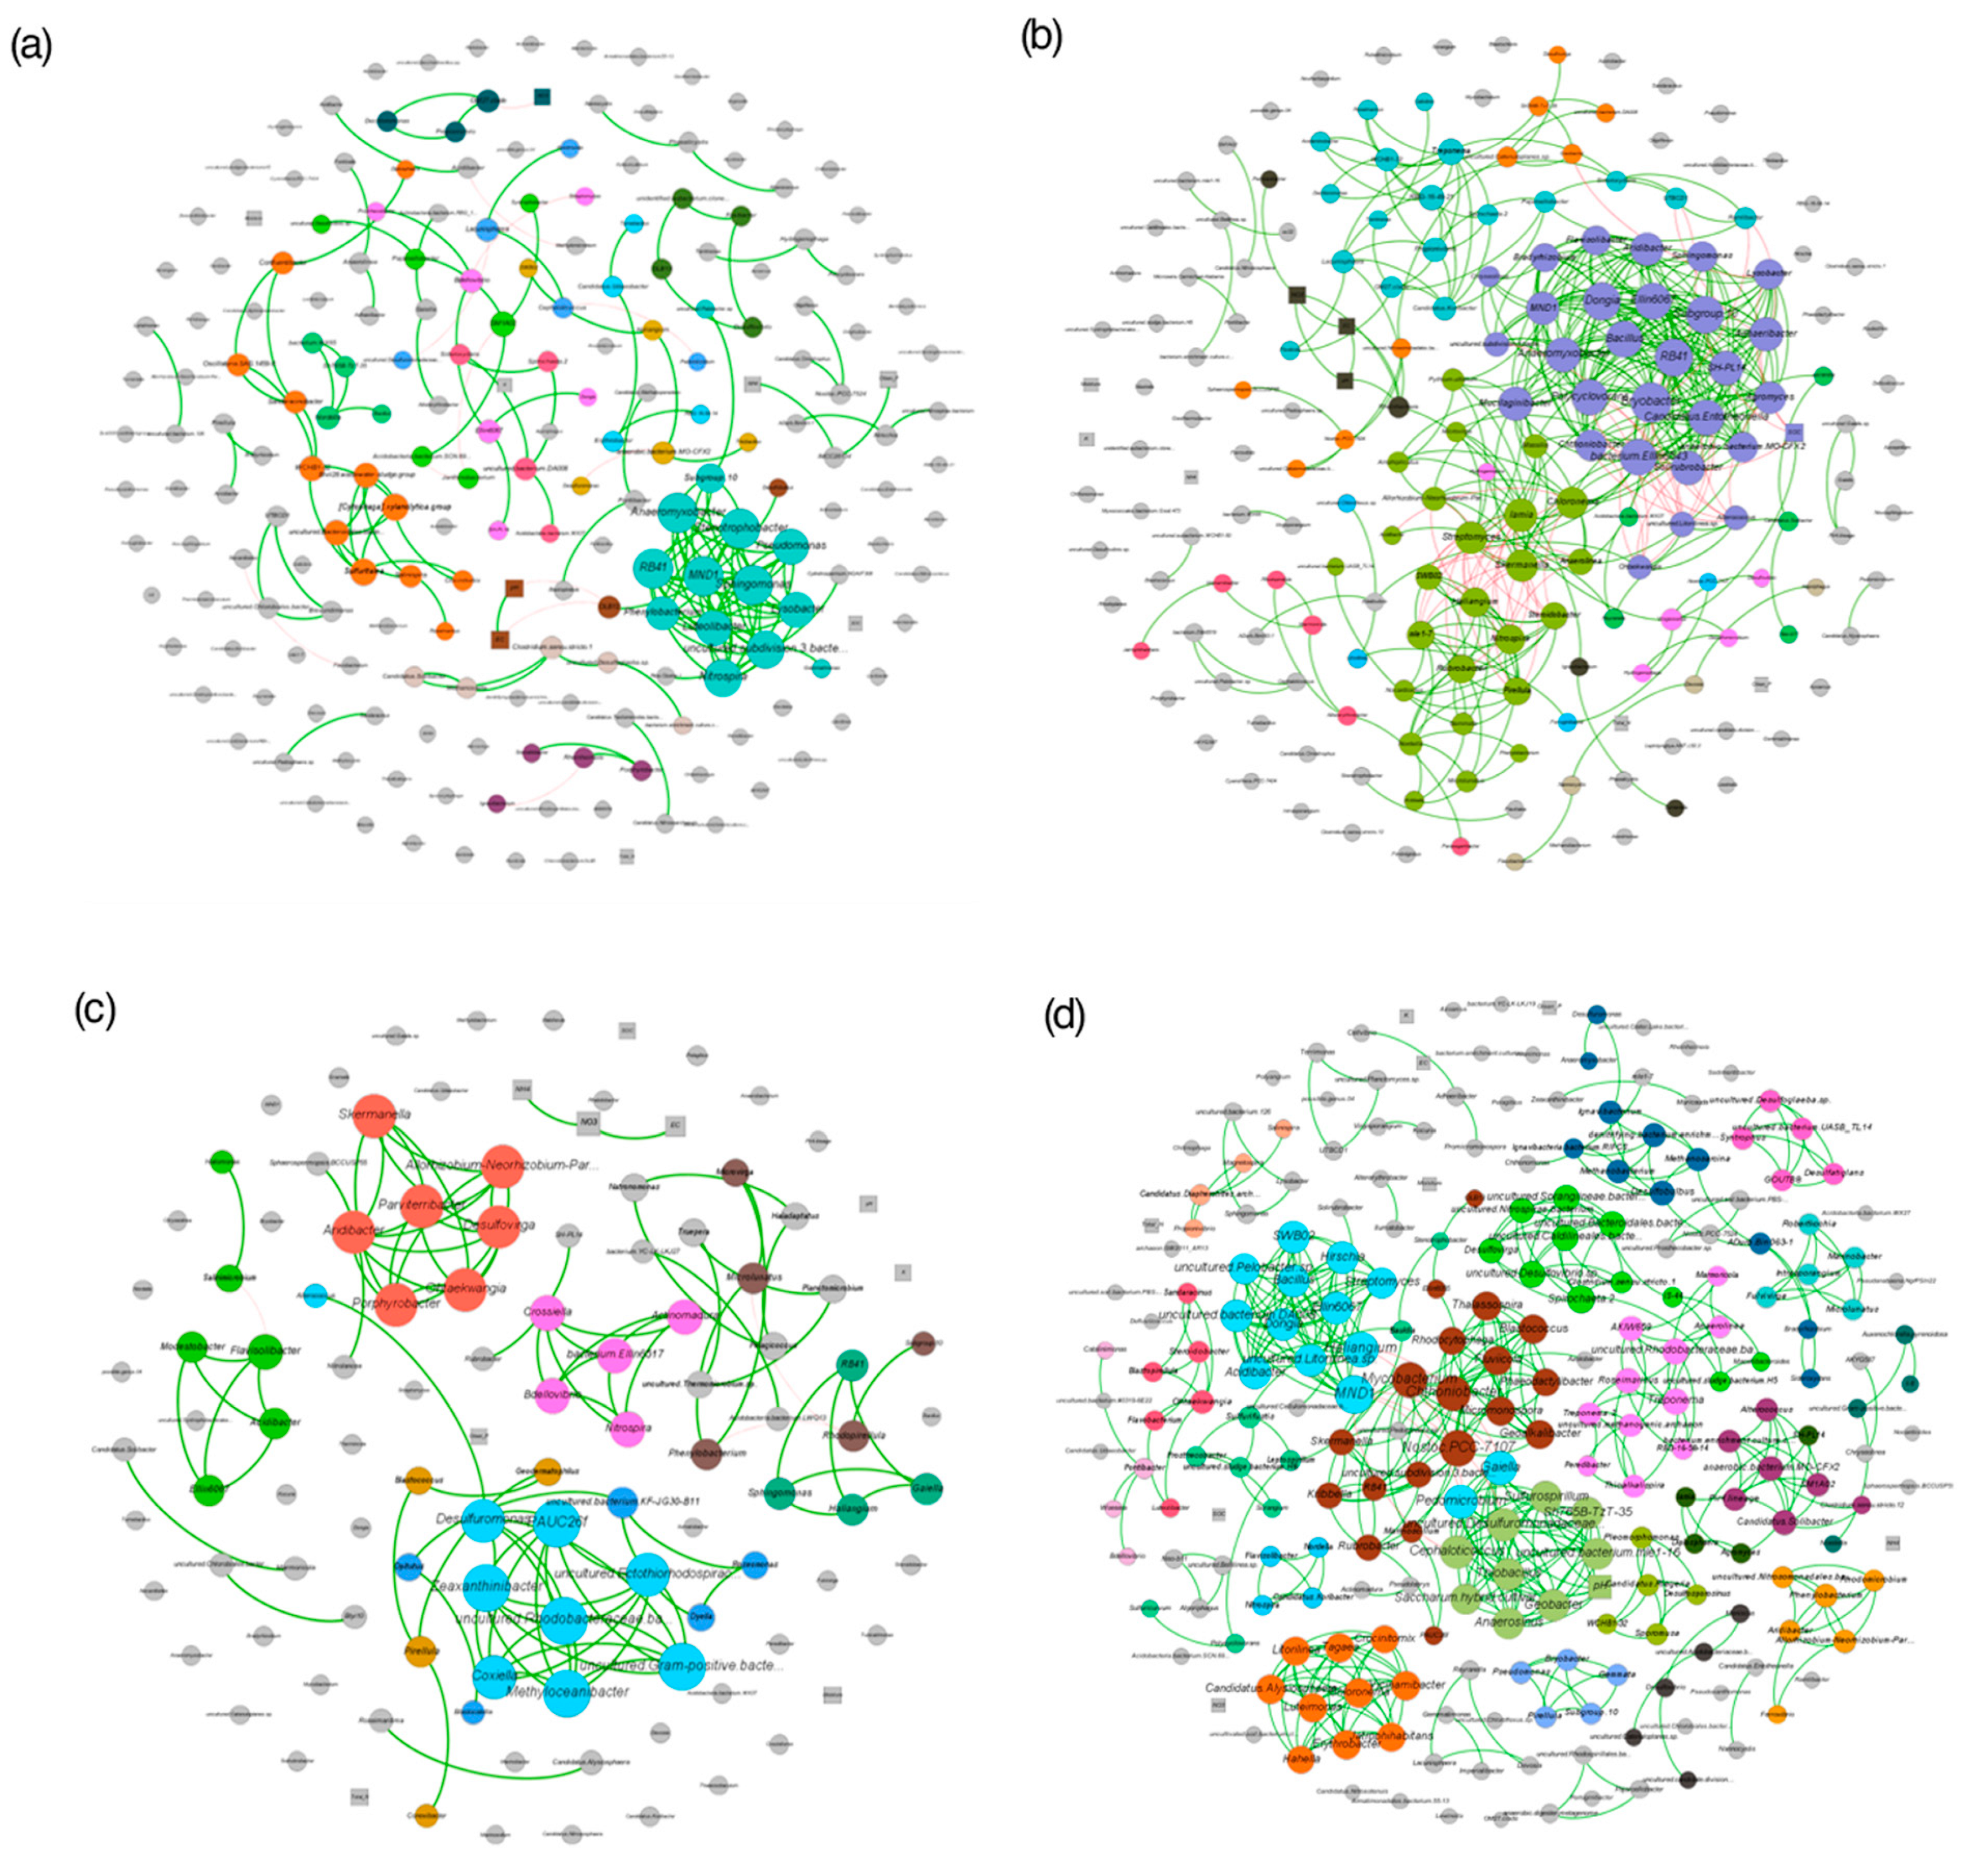
3.5. Co-Occurrence Networks of Microbes and Environmental Variables Interaction in Fallow and Rice-Cultivated Soils

Ecological networks depicting interactions among microbes and environmental variables for rice-cultivated and fallow fields in Umbeluzi and Chokwe followed a power-law distribution (Kolmogorov–Smirnov p < 0.05) (Figure 7 and Table S5). A total of 150, 414, 104 and 462 significant (FDR-adjusted Fisher’s z-transformation p < 0.05) direct associations (synergistic and competitive) were observed for rice-cultivated fields in Umbeluzi (RCU), rice-cultivated fields in Chokwe (RCC), fallow fields in Umbeluzi (FU) and fallow field in Chokwe (FU), respectively (Table S5). Furthermore, the centrality metrics were independent of the relative bacterial abundance in all the ecological networks (RCU: p = 0.07, RCC: p = 0.45, FU: p = 0.12, FC: p = 0.06) (Figure 7).
Multiple network topological properties indicate that the bacterial co-occurrence pattern in the rice-cultivated fields differed profoundly from those of the fallow fields and that differences in sites also influenced the topological properties of the networks (Table S4). This is particularly true for some features used to infer network complexity (average path length, network diameter, number of edges, average degree). For instance, the network average path length and diameter were higher in the rice-cultivated fields than in the fallow fields (10YF and 5YF) for both Umbeluzi and Chokwe (meaning rice cultivation reduced the network complexity). In contrast, the number of interactions (edges) and average degree was higher in Chokwe than Umbeluzi irrespective of cultivation status (network complexity is not entirely independent of site differences) (Table S4).
Notably, environmental variables did not significantly (p < 0.05) influence all but the RCU and RCC co-occurrence networks. In the RCU network, high centrality metrics were observed for Pseudomonas, Lysobacter, Stenotrophobacter, Nitrospira, Sphingomonas and RB41, suggesting that these phylotypes constitute potential keystone taxa. On the other hand, NO3–N, EC and pH were the soil chemical parameters that were significantly associated with some bacterial phylotypes (Figure 7a). In the RCC co-occurrence network (Figure 7b), potential keystone (with high centrality metrics) taxa included Geothermobacter, Dechloromonas, Desulfomicrobium, Hydrogenophaga, Haliangium, Chthonomonas, RB41, Bacillus, Bryobacter, Candidatus Koribacter and Nitrospira. Interestingly, iron-oxidizing and reducing bacteria, such as Sideroxydans, Geobacter and Anaeromyxobacter, were among the hubs in three different modules of the RCC network. Apart from SOC, other soil chemical parameters, such as NO3–N, EC, and pH, were consistent in their influence on the bacterial communities of the rice cultivated fields in both Umbeluzi and Chokwe.
Overall, the bacterial community of RCC seemed to partition into interconnected niches for iron-, nitrogen-, carbon- and sulfur-cycling as SOC, total N and P-Olsen associated significantly with several bacterial species (Figure 7b). Network hubs in FU included Methyloceanibacter, Zeaxanthinibacter, Ohtaekwangia, Skermanella, Desulfovirga and Aridibacter (Figure 7c), while the network and module hubs in FC included MND1, Chthoniobacter, Mycobacterium, Pedomicrobium and Haliangium (Figure 7d).

4. Discussion

Soil management practices in agroecosystems impact the balance between soil physicochemical properties, soil biota diversity and function, and soil health [66,67]. In this study, we investigated the impact of rice cultivation on some soil health indicators by comparing rice-cultivated soils (PH) to fallow fields (10YF, 5YF or 1YF) in two agroecologically distinct regions of Mozambique. Furthermore, the impact of the short 5-month off-season duration between harvest and pre-planting on these soil health indicators was explored.
The soil ecosystem supports several nutrient geochemical cycles, which are important for plant productivity. Of all chemical properties analyzed in this study, only ammonium nitrogen was significantly (p < 0.05) higher in fallow soils than in rice-cultivated fields. This observation suggests that nitrogen cycling is a key feature during rice cultivation and partly supports well-established findings that nitrogen is the most limiting factor for rice production in paddy soils [68,69,70,71]. Specifically, the higher NH4+ contents in fallow soils are probably a consequence of crop absence, with N-uptake by the natural vegetation very reduced. In such situations, N demand is lower, and NH4+ mineralized from organic matter tends to accumulate until its oxidation to NO3. Differing trends observed for Umbeluzi (e.g., differences in electrical conductivity and NO3–N were significant) and Chokwe (e.g., differences in SOC was significant) on comparisons of nutrient levels in their respective fallow and rice-cultivated fields are most likely due to wide variation in soil fertility status, soil physical properties and/or soil management practices, such as irrigation, tillage, fertilization types and application rate between the two regions. Studies have shown that different soil management practices and soil fertility status account for variations in nutrient availability in the soil and rice productivity across rice-growing regions [72,73,74,75,76,77,78,79,80]. Thus, the transfer of technological initiatives to farmers across rice-growing regions of Mozambique is crucial for minimizing inherent soil-based productivity restrictions in lower rice productivity areas and for the improvement of technical efficiency among farmers. Importantly, knowledge regarding how tillage practices influence the dynamics and intricacies of the interactions among the physical, chemical and biological components of rice field soils are crucial to achieving soil health and increased rice yields [79,81,82,83,84].
In agreement with the study of Li et al. [85] in paddy rice soil, it was observed that pH increased in the rice-cultivated soil compared to the fallow soils, with differences in pH between cultivated (PH) and fallow fields significant (p < 0.05) only in Umbeluzi (Table 2). This observation, taken together with the observed non-significant (p > 0.05) difference in total N and significantly (p < 0.05) higher nitrate and ammonium levels in fallow fields (10YF and 5YF) compared to PH, suggests high N-mineralization and nitrification (oxidation of ammonium to nitrates) in fallow fields with a concomitant increase in acidity [70,86]. In a study by Yu [87], it was observed that soil pH increased in rice-cultivated paddy soils and that the magnitude of increase was related to the amount of organic matter. However, in the present study, relative to the fallow field, although an increase in pH was observed in the rice-cultivated soils in both Chokwe and Umbeluzi, pH increased, while SOC (from which organic matter is often derived) reduced in the cultivated soil in both locations (Table 2). The disparity in observations between this study and that of Yu [87] mirrors the constant biochemical flux of soil properties in relation to location-specific differences in SOC (or organic matter) availability and initial soil pH, among other factors [87,88]. Importantly, the pH of the rice-cultivated fields at both postharvest and pre-planting time points in both locations are above the optimum (5.5–7.0) for rice cultivation [80,87]; therefore, nutrient availability and crop productivity may be hampered. Thus, pre-planting addition of appropriate soil ameliorant or fertilizer to lower soil pH before rice planting is required [68,69,70].
Indeed, fertilization and irrigation control are crucial factors that influence the mobility and utilization efficiency of nutrients, such as nitrogen and phosphorus, in paddy soils [68,89]. Given that fertilizer was applied in the rice-cultivated fields during the prior planting season and that the fallow fields were not fertilized and irrigated for at least 5–10 years, the comparable levels of total N, P and K across both fallow and cultivated soils at the postharvest time of sampling suggests loss of nutrients in the rice-cultivated soils. Such loss of nutrients may be due to biochemical processes, such as denitrification, ammonia volatilization and clay fixation, as well as nutrient losses in water runoff, deep percolation and uptake by the rice cultivars [90,91,92]. Moreover, the observed significant reduction in ammonium (NH4+–N), nitrate (NH4+–N), and K between postharvest (PH) and pre-planting (5mR) in both Umbeluzi and Chokwe also suggest further leaching, nutrient adsorption (e.g., insoluble phosphates due to binding on clay particles, Al and Fe hydroxides/oxides) and/or oxidation of nutrients during the off-season. These observations agree with previous studies in which significant reduction in the availability of nutrients, such as nitrogen, phosphorus and potassium in paddy soil, were attributed to water runoff, biological activity, leaching, binding and nutrient uptake by plants, among other factors [68,90,93,94].
Enzymatic activities in soils are important for the decomposition of organic matter and mineralization of nutrients; they are useful indicators of soil biological activity in arable soils and deductively soil health [17,95,96]. In general, the enzyme activity values obtained in rice-cultivated soils are comparable to values obtained in rice paddy soils elsewhere [97]. The observed higher enzyme activities in mostly short-term (1YF) and long-term fallow (5YF and 10YF) soil samples compared to the rice-cultivated PH, and 5mR in both study locations suggests higher biological (metabolic) activity in the fallow soils compared to the rice-cultivated soils. This observation is in agreement with an earlier study by Dinesh et al. [98], who reported a decline in microbial activity, enzyme synthesis and accumulation as a result of reduced C turnover and nutrient availability in long-term cultivated and deforested wet tropical forest soils. In contrast, Raiesi and Beheshti [99] observed that the activities of enzymes, such as urease, alkaline phosphatase and acid phosphatase, were not affected by paddy rice cultivation or land-use changes in Northern Iran. However, when expressed in relation to microbial biomass carbon or soil organic carbon (i.e., specific enzyme activity), the authors observed an increase due to rice cultivation [99]. Thus, the lower activities of beta-glucosidase and phosphatase in rice-cultivated soils in both Umbeluzi and Chokwe suggest that rice cultivation, along with the associated reductive effect on nutrient availability, contribute to a reduction in the stoichiometry of these enzyme activities involved in the mineralization of carbon and phosphorus [95,97,98,100,101]. In the case of urease, we observed higher mean activity in the rice-cultivated field in Chokwe compared to the corresponding fallow field (5YF), but the opposite was true for Umbeluzi. Urease catalysis the hydrolysis of urea into ammonia and CO2; therefore, the higher mean urease activity in the rice cultivated field (at postharvest and pre-planting time point) compared to the fallow-site in Chokwe may be due to high residual urea following its (urea) application during the growing season. Taking the contrasting observation in Umbeluzi into consideration, altogether, the pattern in urease activity and associated soil chemical properties suggest a complex interaction between soil components and the influence of other factors not accounted for in the current study.
Nevertheless, the pattern of changes (i.e., from long-term fallow fields to cultivated fields) in the respective SOC and P-Olsen contents in Umbeluzi and Chokwe, respectively, explains the significant (p < 0.05) differences detected in β-glucosidase and acid phosphatase activities among RCST in Umbeluzi and Chokwe, respectively. Indeed, the suitability of enzyme activities as soil fertility indicators lies in their sensitivity to soil management effects and the often direct relationship with vital soil-quality parameters, such as organic matter, soil physicochemical properties, soil microbial activity and biomass [102,103,104,105,106]. Thus, the observed significant (p < 0.05) changes in only β-glucosidase activities between PH and 5mR soils in both study locations suggest that β-glucosidase is the most responsive (dynamic) of all other enzymes assayed in this study. A similar sensitivity of β-glucosidase was observed in anthropogenically disturbed topsoil in South Africa [107]. Such sensitivity of β-glucosidase is probably due to the need for soil microbes to scavenge for C through the secretion of extracellular β-glucosidase as carbon is an important element for all life forms, including soil biota. As a note, we observed high standard deviation values for enzymatic activities in the study sites. A similar observation has also been reported for undisturbed soils in South Africa [17]. Such an observation is most likely due to spatial heterogeneity consequent on dispersal limitations of nutrients and biomolecules in soil ecosystems [108,109]. Essentially, this observation emphasizes the need for extensive and representative soil sampling in soil-related research.
In this study, next-generation sequencing of the bacterial 16S rRNA gene was used to explore the bacterial diversity and community composition in fallow and rice-cultivated soils. A higher number of unique ASVs were present in the rice-cultivated field than in the fallow fields, and a reduction in the number of unique ASVs was observed between PH and 5mR time points. Altogether, these observations suggest that rice cultivation and associated treatments, such as fertilization, encourage the proliferation of certain species, which are uniquely adapted and functionally relevant in mineralizing nutrients in the rice-cultivated soil environment compared to the fallow soils and to the 5mR soils, which were not actively managed for the short five months off-season duration. Our observations of fluctuating bacterial species richness and diversity in fields with different rice cultivation status or time points is similar to findings from studies investigating bacterial communities in rice agroecosystem during rice plant developmental stages [110,111], under different farming conditions [112] and for wild and cultivated rice cultivars [113].
The observed significantly higher species richness, diversity and proportionality in the rice cultivated field compared to the fallow fields in Umbeluzi (Figure 2a–d) may be due to soil properties and factors mentioned earlier. Similarly, Huang et al. [114] reported that a 19-year continuous application of inorganic fertilizer improved bacterial richness and diversity in rice-cultivated paddy soil. In a related study, Kumar et al. [115] also reported that bacterial diversity (Simpson index) increased with rice cultivation in soils amended with nitrogen fertilizer. According to Jiao et al. [116], the dry-wet conditions during rice cultivation promote the growth of aerobic and anaerobic bacteria, thus improving overall alpha diversity. On the contrary, observed non-significant differences in species richness, diversity and evenness between cultivated and fallow fields in Chokwe (Figure 2e–h) suggest a deviation from observations in Umbeluzi and the aforementioned studies. Such deviations may be due to soil properties and management factors unique to the sampled areas in Chokwe.
The significant differences among bacterial communities of RCST in multivariate space (Figure 3 and Figure 6) indicate that bacterial community functions in the fallow soils differed significantly from those of the rice-cultivated soils. The likely factors that must have resulted in the observed bacterial community compositional changes between the rice-cultivated and fallow soil are the differences in fertilizer management and agronomic practices. Studies have shown that soil bacterial community composition in agroecosystems is influenced by land use and management practices [27,30,31,117]. For example, Wang et al. [30] observed that the stages of rice cultivation (tillering, booting and ripening stages) have a significant impact on bacterial community structure. Though the influence of rice cultivation time points on bacterial community structure has been demonstrated, it is important not to neglect the role of site differences on bacterial communities. For instance, the importance of spatial differentiation is particularly highlighted in the pattern of clustering of the PH and 5mR time points in Umbeluzi (PH and 5mR clustered together) and in Chokwe (PH and 5mR clustered separately). This observation suggests that beyond the influence of cultivation status, differences in soil-type and soil chemical properties between the two study sites are important factors that determine how bacterial species assemble into highly diverse communities. Investigation of bacterial species-environment relationship revealed that ammonium (NH4+), nitrate (NO3), total nitrogen, P-Olsen, moisture, SOC, pH and electrical conductivity (EC) significantly (p < 0.05) influenced the bacterial communities (Table S4). Changes in physicochemical parameters have been severally reported to have a strong influence on bacterial community structure in diverse environments [17,84,115,118]. The impact of some of these physicochemical terms and the microbial community changes they drive in rice-cultivated soils have been extensively reviewed [94].
Proteobacteria was the most abundant phyla across most RCST, while others with a relatively high abundance were Bacteroidetes, Acidobacteria and Actinobacteria. This finding is consistent with previous studies that profiled the abundant bacterial phyla in rice-cultivated mudflats [118,119]. An important observation in the distribution of bacteria across all RCST was the dominance of Proteobacteria and Acidobacteria in the rice cultivated PH soil in Chokwe and also the dominance of Bacteroidetes in the rice cultivated soil in Umbeluzi. Proteobacteria comprises several species that are considered to be fast-growing copiotrophs and thus proliferate in nutrient-rich soils [120]. They are also known to be rice-straw degraders [121], and this explains their relatively high abundance in the rice-grown fields in both Umbeluzi and Chokwe. Meanwhile, Bacteroidetes and Acidobacteria are among the predominant phyla that have been reported in the rice agroecosystems [120,122,123]. They are reportedly involved in the degradation of complex polysaccharides, including cellulose, hemicellulose, starch, pectin and xylans [124,125,126]. Their potential role in the rice-cultivated soil is to mobilize nutrients necessary for plant growth through active participation in the degradation of complex organic matter. In contrast to the rice cultivated fields, Actinobacteria and Chloroflexi dominated the fallow (10YF and 1YF) fields in both locations and increased significantly in the 5mR time point. This observation suggests that both phyla play important roles in recovering rice cultivated fields. Bacterial species of the phylum Actinobacteria contribute directly to plant growth and yield through phosphate solubilization, nitrogen fixation and iron acquisition [127]. They also contribute to plant resistance to biotic and abiotic perturbations through the release of biocidal or inhibitory chemical substances [127].
Bacterial composition at the genus taxonomic rank revealed that distinct taxa dominated at different time points. Interestingly, Pseudomonas and MND1 (Nitrosomonadaceae) were biomarkers in the rice-cultivated fields in Umbeluzi and Chokwe, respectively, while Agromyces, Bacillus, Lysobacter, Micromonospora, Norcadiodes, Rubrobacter, Solirubrobacter and Sphingomonas were differentially abundant in the 5mR and fallow (10YF, 5YF and 1YF) fields. This observation suggests that rice cultivation inhibits the growth and potential contribution of these organisms to soil health or that the allowance of a fallow period supports their growth and proliferation. Sphingomonas are rhizosphere-associated bacteria and have been reported to improve plant yield through siderophore production [128,129] and herbicide metabolism in the agroecosystems [130]. Both Bacillus and Lysobacter comprise several species that are established biocontrol agents, supporting plant growth through the release of exopolysaccharides that prevents the growth of plant pathogenic microorganisms [131,132]. Siderophores and polyamines producing Micromonospora have been demonstrated to significantly improve the length of roots, shoots and dry weight of Salicornia bigelovii plants [133]. Furthermore, Micromonospora, Norcadiodes, Rubrobacter and Solirubrobacter are within the phylum actinobacteria. In the agroecosystems, Actinobacteria contribute to nutrient cycling and the degradation of organic compounds, including pesticides and herbicides [127,134,135]. This panoply of established plant growth-promoting bacterial species demonstrates that the 5-months postharvest fallow period is important for both soil nutrient recovery and plant pathogen suppression before the next planting cycle. Overall, our findings indicate that rice cultivation significantly impacts the compositional structure and potential function of microbial communities.
The co-occurrence network enabled the detection of ecological rearrangement that occurs as a result of rice cultivation. Co-occurrence networks have been demonstrated to be an important tool for underpinning microbial community assembly patterns in their natural environments and also in response to environmental stressors or disturbances [136,137,138,139,140]. Similar to real-world networks like human social relationships [141] and the world wide web [142], the networks for both the rice-cultivated and fallow fields followed a power-law distribution. This implies that few bacterial genera and chemical properties have many interactions, while others either have very few or no associations.
The high modularity in all RCST is a direct indication of niche partitioning potential by the co-occurring microbes [143]. The formation of broad ecological niches is reportedly tied to the high diversity of bacterial species involved in several metabolic processes, including the cycling of key nutrients [116]. Also, niche separation reduces competition while promoting the co-evolution of specific bacterial phylotypes within the microbiome [144]. The topological properties used to infer network complexity revealed that the fallow fields had a more complex and stable bacterial community than rice-cultivated fields. This finding is similar to a previous study by Niu et al. [145], where they reported that the complexity of microbial networks decreased with tobacco cultivation while the fallow fields maintained a complex microbial interaction. Microbial community co-occurrence networks with reduced complexity are considered more susceptible to environmental disturbances [146]. Factors such as intensified cropping and frequent fertilizer and herbicide application have been shown to reduce microbial community co-occurrence network complexity [147]. Summarily, the overall network complexity (i.e., the microbial communities’ efficiency) is a function of both rice-cultivation status and site differences. In contrast, the high modularity value (ranging from 0.8–0.9) in all networks (Figure 7a–d) indicates the presence of distinct bacterial ecological niches in both the rice-cultivated (PH) and fallow (5YF and 10YF) fields in Umbeluzi and Chokwe.
Keystone species in the rice-cultivated field in Umbeluzi included Pseudomonas, Lysobacter, Stenotrophobacter, Nitrospira, Sphingomonas and RB41. In the rice-cultivated field in Chokwe, Nitrospira and RB41, among other genera, were also found to be keystone species, while Geobacter, Stenotrophobacter, Sideroxydans, Anaeromyxobacter and Candidatus Nitrososphaera were among module hubs. Network hubs are important because they control the flow of information across the entire network and, therefore, determine the community structure [148]. In this study, most network hubs in the rice-cultivated fields are known to be involved in energy-cycling processes and suppressing plant pathogens. Lysobacter preys on pathogenic microorganisms by releasing a vast array of lytic enzymes and antibiotics, making them good biocontrol agents [149]. They are also known to be in symbiotic relationships with rhizosphere-associated microbial groups [150], where they contribute to plant productivity by suppressing the activity of pathogenic fungi, bacteria, and algae [151]. The genus Stenotrophobacter grows optimally at neutral, slightly acidic, or slightly basic pH conditions and is known to secrete exoenzymes (e.g., alkaline and acid phosphatases) involved in the metabolism of phosphate-containing compounds [152]. Nitrospira is an important nitrogen-fixing bacteria, and some strains have been reported to exhibit complete nitrification [153], while another keystone species, Sphingomonas, produces siderophores and contributes to nitrogen fixation [154]. The detection of these potential plant beneficial microorganisms as network hubs in the rice-cultivated fields supports our hypothesis that the PH and 5mR time points are important soil recovery periods, particularly considering nitrates, total nitrogen, P, and K increased significantly between PH and 5mR time points in Chokwe. In addition, the detection of iron-oxidizing and reducing bacteria in association with carbon and several established sulfur and nitrogen metabolizers suggests the existence of a coupled metabolism of iron, carbon, nitrogen and sulfur in the rice-cultivated field in Chokwe. Already, there is documented evidence about the syntrophic relationships between iron-oxidizing bacteria and iron-reducing bacteria and between iron-oxidizing bacteria and sulfate-reducing bacteria, and how their overall interaction affects biogeochemical cycles in freshwater and marine environments [155,156,157,158,159]. Furthermore, important is the fact that iron-oxidizing bacteria have been previously identified as keystone species that determine the structure of microbial communities [148] irrespective of their abundance in the environment.

5. Conclusions

This study revealed that rice cultivation and differences in soil physicochemical parameters were the most important factors that influence alpha diversity and bacterial assemblages into diverse ecological niches. The compositional assessment revealed that the relative abundance of Actinobacteria significantly increased between the postharvest and 5-months off-season fallow period in both study locations, while the abundance of Bacteroidetes reduced significantly. The 5-month off-season fallow period is also important for soil recovery, considering the panoply of established plant growth-promoting bacterial species that were biomarkers at this time point. The positive change in soil health indicators between the postharvest and 5-months off-season fallow period further established this fact. The bacterial co-occurrence network revealed that the ecological rearrangement of the soil microbiome due to rice cultivation led to a reduction in the efficiency of the bacterial communities. Overall, this study demonstrates that rice cultivation and differences in physicochemical parameters are important factors that determine bacterial alpha diversity, structure and the diversity of their environmental functions.

Supplementary Materials

The following are available online at https://www.mdpi.com/article/10.3390/agronomy11040694/s1, Figure S1: Rarefaction curve of Amplicon sequence variants sampled to a depth of 11,000 sequences per sample, Figure S2: Shared and unique ASVs of RCST in Umbeluzi and Chokwe. Venn diagram was computed using the DeepVenn online tool (http://www.deepvenn.com/; accessed on 10 January 2021), Table S1: Post hoc-adonis (PERMANOVA) for soil bacterial community structure for RCST, Table S2: Differentially abundant phylotypes in Umbeluzi, Table S3. Differentially abundant phylotypes in Chokwe, Table S4: Goodness of fit of the environmental variable with significant influence on bacterial communities in Chokwe, Table S5: Topological properties for the ecological networks in Figure 6.

Author Contributions

Conceptualization, A.M.P.M., A.I.R.-B. and D.F.; methodology, O.T.E., B.A.M., I.F., M.N.T., A.N. and J.C.; validation, J.C. and R.A.A.; formal analysis, O.T.E., C.C.O. and I.F.; investigation, B.A.M., A.M.P.M., A.I.R.-B. and D.F.; resources, D.F., A.I.R.-B., R.A.A., A.N. and A.M.P.M.; data curation, O.T.E., D.F. and J.C.; writing—original draft preparation, O.T.E., C.C.O., V.N.A.N. and B.A.M.; writing—review and editing, A.M.P.M., A.I.R.-B., R.A.A., A.N., J.C., I.F. and D.F.; visualization, O.T.E. and C.C.O.; supervision, A.M.P.M., A.I.R.-B., R.A.A., A.N., J.C. and D.F.; funding acquisition, A.M.P.M., A.I.R.-B. and D.F. All authors have read and agreed to the published version of the manuscript.

Funding

This research was funded by the Portuguese Foundation for Science and Technology (UID/AGR/04,129/2020 (LEAF); UIDB/00239/2020 (CEF); UIDB/00616/2020 (CQ-VR) and UIDB/04033/2020 (CITAB)), the Camões, Instituto da Cooperação e da Língua and Fundação para a Ciancia e a Tecnologia and the International Rice Research Institute (A-2014-98). Ana M. P. Melo received funds from BioData.pt (LISBOA-01-0145-FEDER-022231) and ELIXIR-CONVERGE (INFRADEV-03-2019/Ref: 871075), funded by Horizon 2020.

Data Availability Statement

Sequence data generated for this study are available in the Sequence Read Archives of the National Centre for Biotechnological Information under the accession number PRJNA511657.

Acknowledgments

The Centre for High-Performance Computing (CHPC), South Africa, is hereby acknowledged for providing computational resources to this research (Project CBBI1183).

Conflicts of Interest

The authors declare no conflict of interest. The funders had no role in the design of the study; in the collection, analyses, or interpretation of data; in the writing of the manuscript, or in the decision to publish the results.

References

  1. Shabandeh, M. Worldwide production of grain in 2018/19, by type. Available online: https://www.statista.com/statistics/263977/world-grain-production-by-type/ (accessed on 25 October 2020).
  2. Calpe, C. Rice International Commodity Profile; Food and Agriculture Organiization: Rome, Italy; United Nations: New York, NY, USA, 2006; pp. 1–23. [Google Scholar]
  3. Gulati, A.; Narayanan, S. Rice trade libertization and poverty. Econ. Political Wkly. 2003, 38, 45–51. [Google Scholar]
  4. Research and Markets. Global Rice Market & Volume by Consumption, Production, Imports, Exports, Company Analysis & Forecast. 2021. Available online: https://www.researchandmarkets.com/reports/5237719/global-rice-market-and-volume-by-consumption?utm_source=BW&utm_medium=PressRelease&utm_code=jm9wt6&utm_campaign=1492948+-+Global+Rice+Market+Report+2021%3a+Market+%26+Volume+Analysis+by+Consumption%2c+Production%2c+Imports%2c+Exports%2c+Company+Analysis+%26+Forecast&utm_exec=chdo54prd (accessed on 10 February 2021).
  5. Van Nguyen, N.; Ferrero, A. Meeting the challenges of global rice production. Paddy Water Environ. 2006, 4, 1–9. [Google Scholar] [CrossRef]
  6. Fahad, S.; Adnan, M.; Noor, M.; Arif, M.; Alam, M.; Khan, I.A.; Ullah, H.; Wahid, F.; Mian, I.A.; Jamal, Y.; et al. Major constraints for global rice production. In Advances in Rice Research for Abiotic Stress Tolerance; Hasanuzzaman, M., Fujita, M., Nahar, K., Biswas, J.K., Eds.; Elsevier Science: London, UK, 2018; pp. 1–22. ISBN 9780128143322. [Google Scholar]
  7. Prasad, R.; Shivay, Y.S.; Kumar, D. Current status, challenges, and opportunities in rice production. In Rice Production Worldwide; Chauhan, B., Jabran, K., Mahajan, G., Eds.; Springer International Publishing: Cham, Switzerland, 2017; pp. 1–32. ISBN 9783319475165. [Google Scholar]
  8. deGraft-Johnson, M.; Suzuki, A.; Sakurai, T.; Otsuka, K. On the transferability of the Asian rice green revolution to rainfed areas in sub-Saharan Africa: An assessment of technology intervention in Northern Ghana. Agric. Econ. 2014, 45, 555–570. [Google Scholar] [CrossRef] [Green Version]
  9. Nin-Pratt, A.; McBride, L. Agricultural intensification in Ghana: Evaluating the optimist’s case for a Green Revolution. Food Policy 2014, 48, 153–167. [Google Scholar] [CrossRef] [Green Version]
  10. Amanor, K.S.; Chichava, S. South-South Cooperation, Agribusiness, and African Agricultural Development: Brazil and China in Ghana and Mozambique. World Dev. 2016, 81, 13–23. [Google Scholar] [CrossRef] [Green Version]
  11. Van Oort, P.A.J.; Saito, K.; Tanaka, A.; Amovin-Assagba, E.; Van Bussel, L.G.J.; van Wart, J.; de Groot, H.; van Ittersum, M.K.; Cassman, K.G.; Wopereis, M.C.S. Assessment of rice self-sufficiency in 2025 in eight African countries. Glob. Food Sec. 2014, 5, 39–49. [Google Scholar] [CrossRef] [Green Version]
  12. Haefele, S.M.; Nelson, A.; Hijmans, R.J. Soil quality and constraints in global rice production. Geoderma 2014, 235–236, 250–259. [Google Scholar] [CrossRef] [Green Version]
  13. Burns, R.G.; Deforest, J.L.; Marxsen, J.; Sinsabaugh, R.L.; Stromberger, M.E.; Wallenstein, M.D.; Weintraub, M.N.; Zoppini, A. Soil Biology & Biochemistry Soil enzymes in a changing environment: Current knowledge and future directions. Soil Biol. Biochem. 2013, 58, 216–234. [Google Scholar] [CrossRef]
  14. Yang, L.; Li, T.; Li, F.; Lemcoff, J.H.; Cohen, S. Fertilization regulates soil enzymatic activity and fertility dynamics in a cucumber field. Sci. Hortic. 2008, 116, 21–26. [Google Scholar] [CrossRef]
  15. Adeleke, R.; Nwangburuka, C.; Oboirien, B. Origins, roles and fate of organic acids in soils: A review. S. Afr. J. Bot. 2017, 108, 393–406. [Google Scholar] [CrossRef]
  16. Mooshammer, M.; Wanek, W.; Hämmerle, I.; Fuchslueger, L.; Hofhansl, F.; Knoltsch, A.; Schnecker, J.; Takriti, M.; Watzka, M.; Wild, B.; et al. Adjustment of microbial nitrogen use efficiency to carbon:Nitrogen imbalances regulates soil nitrogen cycling. Nat. Commun. 2014, 5, 1–7. [Google Scholar] [CrossRef]
  17. Ezeokoli, O.T.; Bezuidenhout, C.C.; Maboeta, M.S.; Khasa, D.P.; Adeleke, R.A. Structural and functional differentiation of bacterial communities in post-coal mining reclamation soils of South Africa: Bioindicators of soil ecosystem restoration. Sci. Rep. 2020, 10, 1759. [Google Scholar] [CrossRef] [Green Version]
  18. Ezeokoli, O.T.; Oladipo, O.G.; Bezuidenhout, C.C.; Adeleke, R.A.; Maboeta, M.S. Assessing the ecosystem support function of South African coal mining soil environments using earthworm (Eisenia andrei) bioassays. Appl. Soil Ecol. 2021, 157, 103771. [Google Scholar] [CrossRef]
  19. Ezeokoli, O.T.; Mashigo, S.K.; Maboeta, M.S.; Bezuidenhout, C.C.; Khasa, D.P.; Adeleke, R.A. Arbuscular mycorrhizal fungal community differentiation along a post-coal mining reclamation chronosequence in South Africa: A potential indicator of ecosystem recovery. Appl. Soil Ecol. 2020, 147, 103429. [Google Scholar] [CrossRef]
  20. Ashraf, M.N.; Hu, C.; Wu, L.; Duan, Y.; Zhang, W.; Aziz, T.; Cai, A.; Abrar, M.M.; Xu, M. Soil and microbial biomass stoichiometry regulate soil organic carbon and nitrogen mineralization in rice-wheat rotation subjected to long-term fertilization. J. Soils Sediments 2020, 20, 3103–3113. [Google Scholar] [CrossRef]
  21. Aspiras, R.B.; Allen, O.N.; Harris, R.F.; Chesters, G. The role of microorganisms in the stabilization of soil aggregates. Soil Biol. Biochem. 1971, 3, 347–353. [Google Scholar] [CrossRef]
  22. Parniske, M. Arbuscular mycorrhiza: The mother of plant root endosymbioses. Nat. Rev. Microbiol. 2008, 6, 763–775. [Google Scholar] [CrossRef] [PubMed]
  23. Lareen, A.; Burton, F.; Schäfer, P. Plant root-microbe communication in shaping root microbiomes. Plant Mol. Biol. 2016, 90, 575–587. [Google Scholar] [CrossRef] [Green Version]
  24. Lugtenberg, B.; Kamilova, F. Plant-growth-promoting rhizobacteria. Annu. Rev. Microbiol. 2009, 63, 541–556. [Google Scholar] [CrossRef] [Green Version]
  25. Tan, S.; Gu, Y.; Yang, C.; Dong, Y.; Mei, X.; Shen, Q.; Xu, Y. Bacillus amyloliquefaciens T-5 may prevent Ralstonia solanacearum infection through competitive exclusion. Biol. Fertil. Soils 2015, 52, 341–351. [Google Scholar] [CrossRef]
  26. Van Der Ent, S.; Van Hulten, M.; Pozo, M.J.; Czechowski, T.; Udvardi, M.K.; Pieterse, C.M.J.; Ton, J. Priming of plant innate immunity by rhizobacteria and β-aminobutyric acid: Differences and similarities in regulation. New Phytol. 2009, 183, 419–431. [Google Scholar] [CrossRef] [Green Version]
  27. Zhao, J.; Zhang, D.; Yang, Y.; Pan, Y.; Zhao, D.; Zhu, J.; Zhang, L.; Yang, Z. Dissecting the effect of continuous cropping of potato on soil bacterial communities as revealed by high-throughput sequencing. PLoS ONE 2020, 15, e0233356. [Google Scholar] [CrossRef]
  28. Sun, J.; Zou, L.; Li, W.; Wang, Y.; Xia, Q.; Peng, M. Soil microbial and chemical properties influenced by continuous cropping of banana. Sci. Agric. 2018, 75, 420–425. [Google Scholar] [CrossRef] [Green Version]
  29. Ng, J.P.; Hollister, E.B.; González-Chávez, M.; del Carmen, A.; Hons, F.M.; Zuberer, D.A.; Aitkenhead-Peterson, J.A.; Loeppert, R.; Gentry, T.J.. Impacts of Cropping Systems and Long-Term Tillage on Soil Microbial Population Levels and Community Composition in Dryland Agricultural Setting. ISRN Ecol. 2012, 2012, 1–11. [Google Scholar] [CrossRef] [Green Version]
  30. Wang, W.; Luo, X.; Chen, Y.; Ye, X.; Wang, H.; Cao, Z.; Ran, W.; Cui, Z. Succession of composition and function of soil bacterial communities during key rice growth stages. Front. Microbiol. 2019, 10. [Google Scholar] [CrossRef] [Green Version]
  31. Luan, H.; Gao, W.; Huang, S.; Tang, J.; Li, M.; Zhang, H.; Chen, X.; Masiliūnas, D. Substitution of manure for chemical fertilizer affects soil microbial community diversity, structure and function in greenhouse vegetable production systems. PLoS ONE 2020, 15, e0214041. [Google Scholar] [CrossRef] [Green Version]
  32. Dumontet, S.; Cavoski, I.; Ricciuti, P.; Mondelli, D.; Jarrar, M.; Pasquale, V.; Crecchio, C. Metabolic and genetic patterns of soil microbial communities in response to different amendments under organic farming system. Geoderma 2017, 296, 79–85. [Google Scholar] [CrossRef]
  33. Ashworth, A.J.; DeBruyn, J.M.; Allen, F.L.; Radosevich, M.; Owens, P.R. Microbial community structure is affected by cropping sequences and poultry litter under long-term no-tillage. Soil Biol. Biochem. 2017, 114, 210–219. [Google Scholar] [CrossRef]
  34. Choudhary, M.; Sharma, P.C.; Jat, H.S.; Dash, A.; Rajashekar, B.; McDonald, A.J.; Jat, M.L. Soil bacterial diversity under conservation agriculture-based cereal systems in Indo-Gangetic Plains. 3 Biotech 2018, 8, 1–11. [Google Scholar] [CrossRef]
  35. Habig, J.; Swanepoel, C. Effects of conservation agriculture and fertilization on soil microbial diversity and activity. Environments 2015, 2, 358–384. [Google Scholar] [CrossRef]
  36. Li, Y.; Chang, S.X.; Tian, L.; Zhang, Q. Conservation agriculture practices increase soil microbial biomass carbon and nitrogen in agricultural soils: A global meta-analysis. Soil Biol. Biochem. 2018, 121, 50–58. [Google Scholar] [CrossRef]
  37. Lopes, L.D.; Fernandes, M.F. Changes in microbial community structure and physiological profile in a kaolinitic tropical soil under different conservation agricultural practices. Appl. Soil Ecol. 2020, 152, 103545. [Google Scholar] [CrossRef]
  38. Edwards, J.; Johnson, C.; Santos-Medellín, C.; Lurie, E.; Podishetty, N.K.; Bhatnagar, S.; Eisen, J.A.; Sundaresan, V. Structure, variation, and assembly of the root-associated microbiomes of rice. Proc. Natl. Acad. Sci. USA 2015, 112, E911–E920. [Google Scholar] [CrossRef] [PubMed] [Green Version]
  39. Liesack, W.; Schnell, S.; Revsbech, N.P. Microbiology of flooded rice paddies. FEMS Microbiol. Rev. 2000, 24, 625–645. [Google Scholar] [CrossRef]
  40. Sun, W.; Xiao, E.; Pu, Z.; Krumins, V.; Dong, Y.; Li, B.; Hu, M. Paddy soil microbial communities driven by environment- and microbe-microbe interactions: A case study of elevation-resolved microbial communities in a rice terrace. Sci. Total Environ. 2018, 612, 884–893. [Google Scholar] [CrossRef]
  41. MAF (Ministry of Agriculture and Fisheries of Mozambique). ROAGRI Formulation Process. Agro-ecological zones and production systems. In Investment Program with Agricultural Extension; MAF: Maputo, Mozambique, 1996. [Google Scholar]
  42. INIA (Instituto Nacional de Investigação; Agronómica). Carta dos solos de Moçambique-Maputo; Ministério da Agricultura: Maputo, Moçambique, 1995. [Google Scholar]
  43. FAEF (Faculty of Agronomy and Forestry Engineering). Programa Competir: Região Agrícola do Chókwè Diagnóstico da Fileira Agrícola; FAEF: Maputo, Moçambique, 2001. [Google Scholar]
  44. Olsen, S.R.; Cole, C.V.; Sterling, R.; Watanabe, F.F.; Dean, L.A. Estimation of Available Phosphorus in Soils by Extraction with Sodium Bicarbonate; USDA Circular 939; US Government Printing Office: Washington, DC, USA, 1954. [Google Scholar]
  45. Claessen, M.E.C. Manual for Methods of Soil Analysis, 2nd ed.; Embrapa Solos: Rio de Janeiro, Brazil, 1997. [Google Scholar]
  46. Egnér, H.; Riehm, H.; Domingo, W.R. Untersuchungen über die chemische Bodenanalyse als Grundlage für die Beurteilung des Nährstoffzustandes der Böden. II. Chem. Extraktionsmethoden zur Phosphor- und Kaliumbestimmung K. Lantbr. Ann. 1960, 26, 199–215. [Google Scholar]
  47. Tabatabai, M.A. Soil Enzymes. In Methods of Soil Analysis, Part 2: Microbiological and Biochemical Properties; Weaver, R.W., Angle, J.S., Bottomley, P.S., Eds.; Book Series 5; Soil Science Society of America: Madison, WI, USA, 1994; pp. 775–833. [Google Scholar]
  48. Kandeler, E. Urease activity by colorimetric technique. In Methods in Soil Biology; Schinner, F., Kandeler, E., Öhlinger, R., Margesin, R., Eds.; Springer: Berlin, Germany, 1995; pp. 171–174. [Google Scholar]
  49. Caporaso, J.G.; Lauber, C.L.; Walters, W.A.; Berg-Lyons, D.; Huntley, J.; Fierer, N.; Owens, S.M.; Betley, J.; Fraser, L.; Bauer, M.; et al. Ultra-high-throughput microbial community analysis on the Illumina HiSeq and MiSeq platforms. ISME J. 2012, 6, 1621–1624. [Google Scholar] [CrossRef] [PubMed] [Green Version]
  50. Callahan, B.J.; McMurdie, P.J.; Rosen, M.J.; Han, A.W.; Johnson, A.J.A.; Holmes, S.P. DADA2: High-resolution sample inference from Illumina amplicon data. Nat. Methods 2016, 13, 581–583. [Google Scholar] [CrossRef] [Green Version]
  51. Bolyen, E.; Rideout, J.R.; Dillon, M.R.; Bokulich, N.A.; Abnet, C.C.; Al-Ghalith, G.A. Reproducible, interactive, scalable and extensible microbiome data science using QIIME 2 contributed to the design of analytical methods HHS Public Access Author manuscript. Nat Biotechnol 2019, 37, 852–857. [Google Scholar] [CrossRef]
  52. Quast, C.; Pruesse, E.; Yilmaz, P.; Gerken, J.; Schweer, T.; Yarza, P.; Peplies, J.; Glöckner, F.O.; Glo, F.O.; Yarza, P.; et al. The SILVA ribosomal RNA gene database project: Improved data processing and web-based tools. Nucleic Acids Res. 2013, 41, D590–D596. [Google Scholar] [CrossRef]
  53. Wickham, H. ggplot2. Wiley Interdiscip. Rev. Comput. Stat. 2011, 3, 180–185. [Google Scholar] [CrossRef]
  54. Oksanen, J.; Blanchet, F.G.; Kindt, R.; Legendre, P.; Minchin, P.R.; O’hara, R.B.; Simpson, G.L.; Solymos, P.; Stevens, M.H.H.; Wagner, H.; et al. vegan: Community Ecology Package. Available online: https://cran.r-project.org/package=vegan (accessed on 2 February 2020).
  55. Roberts, D.W. Labdsv: Ordination and Multivariate Analysis for Ecology. R Package Version 2.0-1. 2010. Available online: https://cran.rproject.org/web/packages/labdsv/index.html#:~:text=labdsv%3A%20Ordination%20and%20Multivariate%20Analysis,well%20as%20several%20novel%20analyses (accessed on 10 February 2021).
  56. R Core Team. R: A Language and Environment for Statistical Computing; Version 4.0.2; R Core Team: Vienna, Austria, 2017. [Google Scholar]
  57. Anderson, M.J.; Ellingsen, K.E.; McArdle, B.H. Multivariate dispersion as a measure of beta diversity. Ecol. Lett. 2006, 9, 683–693. [Google Scholar] [CrossRef]
  58. Paradis, E.; Schliep, K. ape 5.0: An environment for modern phylogenetics and evolutionary analyses in R. Bioinformatics 2019, 35, 526–528. [Google Scholar] [CrossRef]
  59. Galili, T. dendextend: An R package for visualizing, adjusting and comparing trees of hierarchical clustering. Bioinformatics 2015, 31, 3718–3720. [Google Scholar] [CrossRef] [Green Version]
  60. Segata, N.; Izard, J.; Waldron, L.; Gevers, D.; Miropolsky, L.; Garrett, W.S.; Huttenhower, C. Metagenomic biomarker discovery and explanation. Genome Biol. 2011, 12, R60. [Google Scholar] [CrossRef] [Green Version]
  61. Chong, J.; Liu, P.; Zhou, G.; Xia, J. Using MicrobiomeAnalyst for comprehensive statistical, functional, and meta-analysis of microbiome data. Nat. Protoc. 2020, 15, 799–821. [Google Scholar] [CrossRef]
  62. Tackmann, J.; Matias Rodrigues, J.F.; von Mering, C. Rapid Inference of Direct Interactions in Large-Scale Ecological Networks from Heterogeneous Microbial Sequencing Data. Cell Syst. 2019, 9, 286–296.e8. [Google Scholar] [CrossRef] [Green Version]
  63. Aliferis, C.F.; Statnikov, A.; Tsamardinos, I.; Mani, S.; Koutsoukos, X.D. Local causal and markov blanket induction for causal discovery and feature selection for classification part I: Algorithms and empirical evaluation. J. Mach. Learn. Res. 2010, 11, 171–234. [Google Scholar]
  64. Csardi, G.; Nepusz, T. The igraph software package for complex network research. InterJournal Complex Syst. 2006, 1965, 1–9. [Google Scholar]
  65. Blondel, V.D.; Guillaume, J.L.; Lambiotte, R.; Lefebvre, E. Fast unfolding of communities in large networks. J. Stat. Mech. Theory Exp. 2008, 2008, P10008. [Google Scholar] [CrossRef] [Green Version]
  66. Dornbush, M.E.; von Haden, A.C. Intensified Agroecosystems and Their Effects on Soil Biodiversity and Soil Functions. In Soil Health and Intensification of Agroecosystems; Elsevier Inc.: Amsterdam, The Netherlands, 2017; pp. 173–193. ISBN 9780128054017. [Google Scholar]
  67. Kepler, R.M.; Epp Schmidt, D.J.; Yarwood, S.A.; Cavigelli, M.A.; Reddy, K.N.; Duke, S.O.; Bradley, C.A.; Williams, M.M.; Maula, J.E. Soil microbial communities in diverse agroecosystems exposed to the herbicide glyphosate. Appl. Environ. Microbiol. 2020, 86, 1–16. [Google Scholar] [CrossRef] [PubMed]
  68. Qi, D.; Wu, Q.; Zhu, J. Nitrogen and phosphorus losses from paddy fields and the yield of rice with different water and nitrogen management practices. Sci. Rep. 2020, 10, 1–12. [Google Scholar] [CrossRef]
  69. Spiertz, J.H.J. Nitrogen, sustainable agriculture and food security. A review. Agron. Sustain. Dev. 2010, 30, 43–55. [Google Scholar] [CrossRef] [Green Version]
  70. Ishii, S.; Ikeda, S.; Minamisawa, K.; Senoo, K. Nitrogen cycling in rice paddy environments: Past achievements and future challenges. Microbes Environ. 2011, 26, 282–292. [Google Scholar] [CrossRef] [Green Version]
  71. Li, Y.; Kronzucker, H.J.; Shi, W. Microprofiling of nitrogen patches in paddy soil: Analysis of spatiotemporal nutrient heterogeneity at the microscale. Sci. Rep. 2016, 6, 1–12. [Google Scholar] [CrossRef]
  72. Ahmed, W.; Qaswar, M.; Jing, H.; Wenjun, D.; Geng, S.; Kailou, L.; Ying, M.; Ao, T.; Mei, S.; Chao, L.; et al. Tillage practices improve rice yield and soil phosphorus fractions in two typical paddy soils. J. Soils Sediments 2020, 20, 850–861. [Google Scholar] [CrossRef]
  73. Rahman, S. Impact of soil fertility on rice productivity and efficiency: A case study from Bangladesh. In Soil Fertility; Lucero, D.P., Boggs, J., Eds.; Nova Science Publishers Inc.: New York, NY, USA, 2009; pp. 35–50. ISBN 9781607414667. [Google Scholar]
  74. Brady, N.C. Soil factors that influence rice production. In Proceedings of Symposium on Paddy Soils; Springer: Berlin/Heidelberg, Germany, 1981; pp. 1–19. [Google Scholar]
  75. Nguyen, T.T.; Sasaki, Y.; Kakuda, K.I.; Fujii, H. Comparison of paddy soil fertility under conventional rice straw application versus cow dung compost application in mixed crop–livestock systems in a cold temperate region of Japan. Soil Sci. Plant Nutr. 2020, 66, 106–115. [Google Scholar] [CrossRef]
  76. Li, Y.; Li, J.; Gao, L.; Tian, Y. Irrigation has more influence than fertilization on leaching water quality and the potential environmental risk in excessively fertilized vegetable soils. PLoS ONE 2018, 13. [Google Scholar] [CrossRef] [PubMed]
  77. Shakoor, M.B.; Riaz, M.; Niazi, N.K.; Ali, S.; Rizwan, M.; Arif, M.S.; Arif, M. Recent advances in arsenic accumulation in rice. In Advances in Rice Research for Abiotic Stress Tolerance; Elsevier: Amsterdam, The Netherlands, 2018; pp. 385–398. ISBN 9780128143322. [Google Scholar]
  78. Annisa, W.; Sosiawan, H. Dynamics of nitrogen nutrients in lowland soils with some irrigation conditions to increase rice crop productivity. In Proceedings of the IOP Conference Series: Earth and Environmental Science, Bandung, Indonesia, 5–7 August 2019; Volume 393, p. 012058. [Google Scholar]
  79. Biswas, J.C.; Naher, U.A. Soil nutrient stress and rice production in Bangladesh. In Advances in Rice Research for Abiotic Stress Tolerance; Elsevier: Amsterdam, The Netherlands, 2018; pp. 431–445. ISBN 9780128143322. [Google Scholar]
  80. Ilagan, L.A.; Tablizo, R.P.; Barba, R.B.; Marquez, N.A. Soil Fertility Evaluation for Rice Production in Catanduanes Province, Philippines. Int. J. Sci. Technol. Res. 2014, 3, 81–87. [Google Scholar]
  81. Zhang, Q.C.; Wang, G.H. Studies on nutrient uptake of rice and characteristics of soil microorganisms in a long-term fertilization experiments for irrigated rice. J. Zhejiang Univ. Sci. 2005, 6 B, 147–154. [Google Scholar] [CrossRef] [Green Version]
  82. Melman, D.A.; Kelly, C.; Schneekloth, J.; Calderón, F.; Fonte, S.J. Tillage and residue management drive rapid changes in soil macrofauna communities and soil properties in a semiarid cropping system of Eastern Colorado. Appl. Soil Ecol. 2019, 143, 98–106. [Google Scholar] [CrossRef]
  83. Williams, H.; Colombi, T.; Keller, T. The influence of soil management on soil health: An on-farm study in southern Sweden. Geoderma 2020, 360, 114010. [Google Scholar] [CrossRef]
  84. Hubanks, H.L.; Deenik, J.L.; Crow, S.E. Getting the Dirt on Soil Health and Management. In Reference Module in Earth Systems and Environmental Sciences; Elsevier: Amsterdam, The Netherlands, 2018. [Google Scholar]
  85. Li, W.; Liu, M.; Wu, M.; Jiang, C.; Kuzyakov, Y. Bacterial community succession in paddy soil depending on rice fertilization. Appl. Soil Ecol. 2019, 144, 92–97. [Google Scholar] [CrossRef]
  86. Bolan, N.S.; Hedley, M.J.; White, R.E. Processes of soil acidification during nitrogen cycling with emphasis on legume based pastures. Plant Soil 1991, 134, 53–63. [Google Scholar] [CrossRef]
  87. Yu, T.R. Characteristics of soil acidity of paddy soils in relation to rice growth. In Plant-Soil Interactions at Low pH; Springer: Dordrecht, The Netherlands, 1991; pp. 107–112. [Google Scholar]
  88. Wang, Y.; Tang, C.; Wu, J.; Liu, X.; Xu, J. Impact of organic matter addition on pH change of paddy soils. J. Soils Sediments 2013, 13, 12–23. [Google Scholar] [CrossRef]
  89. Peng, S.Z.; Yang, S.H.; Xu, J.Z.; Luo, Y.F.; Hou, H.J. Nitrogen and phosphorus leaching losses from paddy fields with different water and nitrogen managements. Paddy Water Environ. 2011, 9, 333–342. [Google Scholar] [CrossRef]
  90. Patrick, W.H.; Mikkelsen, D.S.; Wells, B.R. Plant nutrient behavior in flooded soil. In Fertilizer Technology and Use; Soil Science Society of America: Madison, WI, USA, 2015; pp. 197–228. [Google Scholar]
  91. Nishikawa, T.; Li, K.; Inamura, T.; Nishikawa, T.; Li, K.; Nishikawa, T. Nitrogen uptake by the rice plant and changes in the soil chemical properties in the paddy rice field during yearly application of anaerobically-digested manure for seven years. Plant Prod. Sci. 2014, 17, 237–244. [Google Scholar] [CrossRef]
  92. Ahmad, N.; Abid, M.; Hussain, K.; Akram, M.; Yousaf, M. Evaluation of Nutrient Status in the Rice Growing Areas of the Punjab. Asian J. Plant Sci. 2003, 2, 449–453. [Google Scholar] [CrossRef]
  93. Richardson, A.E.; Simpson, R.J. Soil microorganisms mediating phosphorus availability update on microbial phosphorus. Plant Physiol. 2011, 156, 989–996. [Google Scholar] [CrossRef] [Green Version]
  94. Wei, X.; Zhu, Z.; Wei, L.; Wu, J.; Ge, T. Rhizosphere Biogeochemical cycles of key elements in the paddy-rice rhizosphere: Microbial mechanisms and coupling processes. Rhizosphere 2019, 10, 100145. [Google Scholar] [CrossRef]
  95. Adetunji, A.T.; Lewu, F.B.; Mulidzi, R.; Ncube, B. The biological activities of β-glucosidase, phosphatase and urease as soil quality indicators: A review. J. Soil Sci. Plant Nutr. 2017, 17, 794–807. [Google Scholar] [CrossRef] [Green Version]
  96. Stenberg, B. Monitoring soil quality of arable Land: Microbiological indicators. Acta Agric. Scand. Sect. B-Soil Plant Sci. 1999, 49, 1–24. [Google Scholar] [CrossRef]
  97. Kunito, T.; Shiroma, T.; Moro, H.; Sumi, H. Annual variation in soil enzyme activity in a paddy field: Soil temperature and nutrient availability are important for controlling enzyme activities. Appl. Environ. Soil Sci. 2018, 2018. [Google Scholar] [CrossRef]
  98. Dinesh, R.; Ghoshal Chaudhuri, S.; Sheeja, T.E. Soil biochemical and microbial indices in wet tropical forests: Effects of deforestation and cultivation. J. Plant Nutr. Soil Sci. 2004, 167, 24–32. [Google Scholar] [CrossRef]
  99. Raiesi, F.; Beheshti, A. Soil specific enzyme activity shows more clearly soil responses to paddy rice cultivation than absolute enzyme activity in primary forests of northwest Iran. Appl. Soil Ecol. 2014, 75, 63–70. [Google Scholar] [CrossRef]
  100. An, S.; Zheng, F.; Zhang, F.; Van Pelt, S.; Hamer, U.; Makeschin, F. Soil quality degradation processes along a deforestation chronosequence in the Ziwuling area, China. Catena 2008, 75, 248–256. [Google Scholar] [CrossRef]
  101. Gu, C.; Zhang, S.; Han, P.; Hu, X.; Xie, L.; Li, Y.; Brooks, M.; Liao, X.; Qin, L. Soil enzyme activity in soils subjected to flooding and the effect on nitrogen and phosphorus uptake by oilseed rape. Front. Plant Sci. 2019, 10, 1–9. [Google Scholar] [CrossRef] [Green Version]
  102. Dick, R.P.; Breakwell, D.P.; Turco, R.F. Soil enzyme activities and biodiversity measurements as integrative microbiological indicators. In Methods of Assessing Soil Quality; Doran, J.W., Jones, A.J., Eds.; Soil Science Society of America: Madison, WI, USA, 1996; pp. 247–271. [Google Scholar]
  103. Das, S.K.; Varma, A. Role of Enzymes in Maintaining Soil Health. In Soil Enzymology; Shukla, G., Varma, A., Eds.; Springer: Berlin/Heidelberg, Germany, 2010; Volume 22, pp. 119–148. [Google Scholar]
  104. Tabatabai, M.A.; Dick, W.A. Enzymes in soil. In Enzymes in the Environment: Activity, Ecology and Applications; Burns, R.G., Dick, R.P., Eds.; Marcel Dekker: New York, NY, USA, 2002; pp. 567–596. [Google Scholar]
  105. Dick, R.P. Soil Enzyme Activities as Indicators of Soil Quality. In Defining Soil Quality for a Sustainable Environment; John Wiley & Sons: Hoboken, NJ, USA, 1994; pp. 107–124. [Google Scholar]
  106. Dick, R.P.; Kandeler, E. Enzymes in Soils. In Encyclopedia of Soils in the Environment; Elsevier Inc.: Amsterdam, The Netherlands, 2004; Volume 4, pp. 448–456. ISBN 9780080547954. [Google Scholar]
  107. Ezeokoli, O.T.; Mashigo, S.K.; Paterson, D.G.; Bezuidenhout, C.C.; Adeleke, R.A. Microbial community structure and relationship with physicochemical properties of soil stockpiles in selected South African opencast coal mines. Soil Sci. Plant Nutr. 2019, 65, 332–341. [Google Scholar] [CrossRef]
  108. Shi, A.; Chakrawal, A.; Manzoni, S.; Fischer, B.M.C.; Nunan, N.; Herrmann, A.M. Substrate spatial heterogeneity reduces soil microbial activity. Soil Biol. Biochem. 2021, 152, 108068. [Google Scholar] [CrossRef]
  109. Ye, H.; Lu, C.; Lin, Q. Investigation of the spatial heterogeneity of soil microbial biomass carbon and nitrogen under long-term fertilizations in fluvo-aquic soil. PLoS ONE 2019, 14, e0209635. [Google Scholar] [CrossRef] [Green Version]
  110. Pittol, M.; Scully, E.; Miller, D.; Durso, L.; Mariana Fiuza, L.; Valiati, V.H. Bacterial community of the rice floodwater using cultivation-independent approaches. Int. J. Microbiol. 2018, 2018. [Google Scholar] [CrossRef] [Green Version]
  111. Wu, Z.; Liu, Q.; Li, Z.; Cheng, W.; Sun, J.; Guo, Z.; Li, Y.; Zhou, J.; Meng, D.; Li, H.; et al. Environmental factors shaping the diversity of bacterial communities that promote rice production. BMC Microbiol. 2018, 18, 51. [Google Scholar] [CrossRef] [PubMed] [Green Version]
  112. Suzuki, K.; Takemura, M.; Miki, T.; Nonaka, M.; Harada, N. Differences in soil bacterial community compositions in paddy fields under organic and conventional farming conditions. Microbes Environ. 2019, 34, 108–111. [Google Scholar] [CrossRef] [PubMed]
  113. Xu, S.; Tian, L.; Chang, C.; Li, X.; Tian, C. Cultivated rice rhizomicrobiome is more sensitive to environmental shifts than that of wild rice in natural environments. Appl. Soil Ecol. 2019, 140, 68–77. [Google Scholar] [CrossRef]
  114. Huang, Q.; Wang, J.; Wang, C.; Wang, Q. The 19-years inorganic fertilization increased bacterial diversity and altered bacterial community composition and potential functions in a paddy soil. Appl. Soil Ecol. 2019, 144, 60–67. [Google Scholar] [CrossRef]
  115. Kumar, U.; Kumar Nayak, A.; Shahid, M.; Gupta, V.V.S.R.; Panneerselvam, P.; Mohanty, S.; Kaviraj, M.; Kumar, A.; Chatterjee, D.; Lal, B.; et al. Continuous application of inorganic and organic fertilizers over 47 years in paddy soil alters the bacterial community structure and its influence on rice production. Agric. Ecosyst. Environ. 2018, 262, 65–75. [Google Scholar] [CrossRef]
  116. Jiao, S.; Xu, Y.; Zhang, J.; Hao, X.; Lu, Y. Core Microbiota in Agricultural Soils and Their Potential Associations with Nutrient Cycling. mSystems 2019, 4. [Google Scholar] [CrossRef] [PubMed] [Green Version]
  117. Wang, Z.; Liu, Y.; Zhao, L.; Zhang, W.; Liu, L. Change of soil microbial community under long-term fertilization in a reclaimed sandy agricultural ecosystem. PeerJ 2019, 2019. [Google Scholar] [CrossRef] [PubMed]
  118. Yao, R.; Yang, J.; Wang, X.; Xie, W.; Zheng, F.; Li, H.; Tang, C.; Zhu, H. Response of soil characteristics and bacterial communities to nitrogen fertilization gradients in a coastal salt-affected agroecosystem. Land Degrad. Dev. 2021, 32, 338–353. [Google Scholar] [CrossRef]
  119. Zhang, Y.; Li, Q.; Chen, Y.; Dai, Q.; Hu, J. Dynamic change in enzyme activity and bacterial community with long-term rice cultivation in mudflats. Curr. Microbiol. 2019, 76, 361–369. [Google Scholar] [CrossRef]
  120. Zhao, J.; Ni, T.; Li, Y.; Xiong, W.; Ran, W.; Shen, B.; Shen, Q.; Zhang, R. Responses of bacterial communities in arable soils in a rice-wheat cropping system to different fertilizer regimes and sampling times. PLoS ONE 2014, 9, e85301. [Google Scholar] [CrossRef]
  121. Fan, F.; Yin, C.; Tang, Y.; Li, Z.; Song, A.; Wakelin, S.A.; Zou, J.; Liang, Y. Probing potential microbial coupling of carbon and nitrogen cycling during decomposition of maize residue by 13C-DNA-SIP. Soil Biol. Biochem. 2014, 70, 12–21. [Google Scholar] [CrossRef]
  122. Zhu, J.; Peng, H.; Ji, X.; Li, C.; Li, S. Effects of reduced inorganic fertilization and rice straw recovery on soil enzyme activities and bacterial community in double-rice paddy soils. Eur. J. Soil Biol. 2019, 94, 103116. [Google Scholar] [CrossRef]
  123. Yi, X.; Yuan, J.; Zhu, Y.; Yi, X.; Zhao, Q.; Fang, K.; Cao, L. Comparison of the abundance and community structure of N-cycling bacteria in paddy rhizosphere soil under different rice cultivation patterns. Int. J. Mol. Sci. 2018, 19, 3772. [Google Scholar] [CrossRef] [PubMed] [Green Version]
  124. Krüger, K.; Chafee, M.; Ben Francis, T.; Glavina del Rio, T.; Becher, D.; Schweder, T.; Amann, R.I.; Teeling, H. In marine Bacteroidetes the bulk of glycan degradation during algae blooms is mediated by few clades using a restricted set of genes. ISME J. 2019, 13, 2800–2816. [Google Scholar] [CrossRef] [PubMed] [Green Version]
  125. Zeybek, N.; Rastall, R.A.; Buyukkileci, A.O. Utilization of xylan-type polysaccharides in co-culture fermentations of Bifidobacterium and Bacteroides species. Carbohydr. Polym. 2020, 236, 116076. [Google Scholar] [CrossRef]
  126. de Chaves, M.G.; Silva, G.G.; Rossetto, R.; Edwards, R.A.; Tsai, S.M.; Navarrete, A.A. Acidobacteria subgroups and their metabolic potential for carbon degradation in sugarcane soil amended with vinasse and nitrogen fertilizers. Front. Microbiol. 2019, 10, 1680. [Google Scholar] [CrossRef] [PubMed] [Green Version]
  127. Sathya, A.; Vijayabharathi, R.; Gopalakrishnan, S. Plant growth-promoting actinobacteria: A new strategy for enhancing sustainable production and protection of grain legumes. 3 Biotech 2017, 7, 102. [Google Scholar] [CrossRef] [Green Version]
  128. Luo, Y.; Wang, F.; Huang, Y.; Zhou, M.; Gao, J.; Yan, T.; Sheng, H.; An, L. Sphingomonas sp. Cra20 increases plant growth rate and alters rhizosphere microbial community structure of Arabidopsis thaliana under drought stress. Front. Microbiol. 2019, 10. [Google Scholar] [CrossRef] [Green Version]
  129. Menon, R.R.; Kumari, S.; Kumar, P.; Verma, A.; Krishnamurthi, S.; Rameshkumar, N. Sphingomonas pokkalii sp. nov., a novel plant associated rhizobacterium isolated from a saline tolerant pokkali rice and its draft genome analysis. Syst. Appl. Microbiol. 2019, 42, 334–342. [Google Scholar] [CrossRef]
  130. Sørensen, S.R.; Ronen, Z.; Aamand, J. Isolation from agricultural soil and characterization of a Sphingomonas sp. able to mineralize the phenylurea herbicide isoproturon. Appl. Environ. Microbiol. 2001, 67, 5403–5409. [Google Scholar] [CrossRef] [Green Version]
  131. Gómez Expósito, R.; Postma, J.; Raaijmakers, J.M.; De Bruijn, I. Diversity and Activity of Lysobacter Species from Disease Suppressive Soils. Front. Microbiol. 2015, 6, 1243. [Google Scholar] [CrossRef] [Green Version]
  132. Albayrak, Ç.B. Bacillus species as biocontrol agents for fungal plant pathogens. In Bacilli and Agrobiotechnology: Phytostimulation and Biocontrol; Springer: Cham, Switzerland, 2019; pp. 239–265. [Google Scholar]
  133. El-Tarabily, K.A.; AlKhajeh, A.S.; Ayyash, M.M.; Alnuaimi, L.H.; Sham, A.; ElBaghdady, K.Z.; Tariq, S.; AbuQamar, S.F. Growth Promotion of Salicornia bigelovii by Micromonospora chalcea UAE1, an Endophytic 1-Aminocyclopropane-1-Carboxylic Acid Deaminase-Producing Actinobacterial Isolate. Front. Microbiol. 2019, 10, 1694. [Google Scholar] [CrossRef]
  134. De Schrijver, A.; De Mot, R. Degradation of pesticides by actinomycetes. Crit. Rev. Microbiol. 1999, 25, 85–119. [Google Scholar] [CrossRef]
  135. Hamdi, C.; Arous, F.; Jaouani, A. Actinobacteria: A Promising Source of Enzymes Involved in Lignocellulosic Biomass Conversion. Adv. Biotechnol. Microbiol. 2020, 13. [Google Scholar] [CrossRef]
  136. Shen, H.; Yan, W.; Yang, X.; He, X.; Wang, X.; Zhang, Y.; Wang, B.; Xia, Q. Co-occurrence network analyses of rhizosphere soil microbial PLFAs and metabolites over continuous cropping seasons in tobacco. Plant Soil 2020, 452, 119–135. [Google Scholar] [CrossRef]
  137. Tu, Q.; Yan, Q.; Deng, Y.; Michaletz, S.T.; Buzzard, V.; Weiser, M.D.; Waide, R.; Ning, D.; Wu, L.; He, Z.; et al. Biogeographic patterns of microbial co-occurrence ecological networks in six American forests. Soil Biol. Biochem. 2020, 148, 107897. [Google Scholar] [CrossRef]
  138. Ma, B.; Wang, Y.; Ye, S.; Liu, S.; Stirling, E.; Gilbert, J.A.; Faust, K.; Knight, R.; Jansson, J.K.; Cardona, C.; et al. Earth microbial co-occurrence network reveals interconnection pattern across microbiomes. Microbiome 2020, 8, 82. [Google Scholar] [CrossRef] [PubMed]
  139. Li, J.; Li, C.; Kou, Y.; Yao, M.; He, Z.; Li, X. Distinct mechanisms shape soil bacterial and fungal co-occurrence networks in a mountain ecosystem. FEMS Microbiol. Ecol. 2020, 96. [Google Scholar] [CrossRef] [PubMed]
  140. Obieze, C.C.; Chikere, C.B.; Selvarajan, R.; Adeleke, R.; Ntushelo, K.; Akaranta, O. Functional attributes and response of bacterial communities to nature-based fertilization during hydrocarbon remediation. Int. Biodeterior. Biodegradation 2020, 154, 105084. [Google Scholar] [CrossRef]
  141. Liljeros, F.; Edling, C.R.; Nunes Amaral, L.A.; Stanley, H.E.; Åberg, Y. Social networks: The web of human sexual contacts. Nature 2001, 411, 907–908. [Google Scholar] [CrossRef] [PubMed] [Green Version]
  142. Albert, R.; Jeong, H.; Barabási, A.L. Diameter of the world-wide web. Nature 1999, 401, 130–131. [Google Scholar] [CrossRef] [Green Version]
  143. Barberán, A.; Bates, S.T.; Casamayor, E.O.; Fierer, N. Using network analysis to explore co-occurrence patterns in soil microbial communities. ISME J. 2012, 6, 343–351. [Google Scholar] [CrossRef] [PubMed] [Green Version]
  144. Bauer, M.A.; Kainz, K.; Carmona-Gutierrez, D.; Madeo, F. Microbial wars: Competition in ecological niches and within the microbiome. Microb. Cell 2018, 5, 215–219. [Google Scholar] [CrossRef] [PubMed]
  145. Niu, J.; Rang, Z.; Zhang, C.; Chen, W.; Tian, F.; Yin, H.; Dai, L. The succession pattern of soil microbial communities and its relationship with tobacco bacterial wilt. BMC Microbiol. 2016, 16, 1–10. [Google Scholar] [CrossRef] [Green Version]
  146. Banerjee, S.; Walder, F.; Büchi, L.; Meyer, M.; Held, A.Y.; Gattinger, A.; Keller, T.; Charles, R.; van der Heijden, M.G.A. Agricultural intensification reduces microbial network complexity and the abundance of keystone taxa in roots. ISME J. 2019, 13, 1722–1736. [Google Scholar] [CrossRef] [Green Version]
  147. Xue, L.; Ren, H.; Brodribb, T.J.; Wang, J.; Yao, X.; Li, S. Long term effects of management practice intensification on soil microbial community structure and co-occurrence network in a non-timber plantation. For. Ecol. Manag. 2020, 459, 117805. [Google Scholar] [CrossRef]
  148. Banerjee, S.; Schlaeppi, K.; van der Heijden, M.G.A. Keystone taxa as drivers of microbiome structure and functioning. Nat. Rev. Microbiol. 2018, 16, 567–576. [Google Scholar] [CrossRef]
  149. Xie, Y.; Wright, S.; Shen, Y.; Du, L. Bioactive natural products from Lysobacter. Nat. Prod. Rep. 2012, 29, 1277–1287. [Google Scholar] [CrossRef] [Green Version]
  150. Qin, Y.; Fu, Y.; Dong, C.; Jia, N.; Liu, H. Shifts of microbial communities of wheat (Triticum aestivum L.) cultivation in a closed artificial ecosystem. Appl. Microbiol. Biotechnol. 2016, 100, 4085–4095. [Google Scholar] [CrossRef]
  151. Puopolo, G.; Tomada, S.; Pertot, I. The impact of the omics era on the knowledge and use of Lysobacter species to control phytopathogenic micro-organisms. J. Appl. Microbiol. 2018, 124, 15–27. [Google Scholar] [CrossRef] [PubMed] [Green Version]
  152. Pascual, J.; Huber, K.J.; Foesel, B.U.; Overmann, J. Stenotrophobacter. In Bergey’s Manual of Systematics of Archaea and Bacteria; Wiley: Hoboken, NJ, USA, 2017; pp. 1–8. [Google Scholar]
  153. Daims, H.; Lebedeva, E.V.; Pjevac, P.; Han, P.; Herbold, C.; Albertsen, M.; Jehmlich, N.; Palatinszky, M.; Vierheilig, J.; Bulaev, A.; et al. Complete nitrification by Nitrospira bacteria. Nature 2015, 528, 504–509. [Google Scholar] [CrossRef]
  154. Luo, Y.; Zhou, M.; Zhao, Q.; Wang, F.; Gao, J.; Sheng, H.; An, L. Complete genome sequence of Sphingomonas sp. Cra20, a drought resistant and plant growth promoting rhizobacteria. Genomics 2020, 112, 3648–3657. [Google Scholar] [CrossRef] [PubMed]
  155. Brooks, C.N.; Field, E.K. Iron flocs and the three domains: Microbial interactions in freshwater iron mats. mBio 2020, 11, 1–16. [Google Scholar] [CrossRef] [PubMed]
  156. Fru, E.C.; Piccinelli, P.; Fortin, D. Insights into the Global Microbial Community Structure Associated with Iron Oxyhydroxide Minerals Deposited in the Aerobic Biogeosphere. Geomicrobiol. J. 2012, 29, 587–610. [Google Scholar] [CrossRef]
  157. Roden, E.E. Microbial iron-redox cycling in subsurface environments. In Proceedings of the Biochemical Society Transactions; Portland Press: London, UK, 2012; Volume 40, pp. 1249–1256. [Google Scholar]
  158. Emerson, D.; Roden, E.; Twining, B.S. The microbial ferrous wheel: Iron cycling in terrestrial, freshwater, and marine environments. Front. Microbiol. 2012, 3, 383. [Google Scholar] [CrossRef] [Green Version]
  159. Weiss, J.V.; Rentz, J.A.; Plaia, T.; Neubauer, S.C.; Merrill-Floyd, M.; Lilburn, T.; Bradburne, C.; Megonigal, J.P.; Emerson, D. Characterization of neutrophilic Fe(II)-oxidizing bacteria isolated from the rhizosphere of wetland plants and description of Ferritrophicum radicicola gen. nov. sp. nov., and Sideroxydans paludicola sp. nov. Geomicrobiol. J. 2007, 24, 559–570. [Google Scholar] [CrossRef]
Figure 1. Relationship between enzyme activities and soil chemical properties in Umbeluzi (ad) and Chokwe (ei). Rho (ρ) and p-values embedded in the plot are rounded off to 2 d.p. and 3 d.p., respectively. 10YF, ten years fallow; 5YF, five years fallow; 1YF, one-year fallow; PH, postharvest; 5mR, five months off-season time point. “10YF/5YF” denotes fallow fields in Umbeluzi or Chokwe, respectively. SOC, Soil organic carbon.
Agronomy 11 00694 g001
Figure 2. Observed ASVs, Chao1, Shannon–Wiener index of diversity and Pielou’s evenness in Umbeluzi (ad) and Chokwe (eh). Black-filled dots depict mean values on the boxplot. Plots for 10YF, 1YF or PH with different superscript letters for each location are significantly different (Bonferroni adjusted p < 0.05) based on Kruskal–Wallis or Mann–Whitney test. 5mR is only compared to PH. Plots for 5mR with asterisks (*) is significantly (Wilcoxon rank-sum test p < 0.05) different from PH.
Agronomy 11 00694 g002
Figure 3. Multivariate differentiation of bacterial communities in rice cultivation statuses or time points (RCST). (a,b) Umbeluzi (c,d) Chokwe. Principal coordinate analysis (PCoA) plot and unweighted pair group method with arithmetic mean (UPGMA) cluster dendrogram are based on Bray-Curtis dissimilarities. Dotted lines in the PCoA plot show the distance of every sample to its group centroids in multivariate space, while ellipses show 95% confidence intervals (standard error) in multivariate space around group centroids. 10YF, ten years fallow; 5YF, five years fallow; 1YF, one-year fallow; PH, postharvest; 5mR, five months off-season time point. “10YF/5YF” denotes fallow fields in Umbeluzi or Chokwe, respectively. The differences in multivariate space among RCSTs in Umbeluzi and Chokwe are significant (PERMANOVA p < 0.05; see Table S1).
Agronomy 11 00694 g003
Figure 4. Dominant and differentially abundant (false discovery rate (FDR)-adjusted p < 0.05, least discriminant analysis (LDA) > 4.0) phylotypes at phylum taxonomic rank. (a) Mean relative abundance (b) differentially abundant phyla in Umbeluzi and (c) Differentially abundant phyla in Chokwe. 10YF, ten years fallow; 5YF, five years fallow; 1YF, one-year fallow; PH, postharvest; 5mR, five months off-season time point.
Agronomy 11 00694 g004
Figure 5. Relative abundance and differentially abundant phylotypes at the genus taxonomic rank. (a) Mean relative abundance. (b) Top 10 differentially abundant phylotypes (FDR-adjusted p < 0.05, LDA > 4.0) in Umbeluzi. (c) Top 10 differentially abundant phylotypes (FDR-adjusted p < 0.05, LDA > 4.0) in Chokwe. In Figure 4a, phylotypes with relative proportion less than 0.01 (1%) and phylotypes unclassified at the genus taxonomic level were excluded. Family names are in parenthesis for some phylotypes without standard genus names. See Tables S2 and S3 for other differentially abundant phylotypes. 10YF, ten years fallow; 5YF, five years fallow; 1YF, one year fallow; PH, postharvest; 5mR, five months postharvest recovery or pre-planting.
Agronomy 11 00694 g005
Figure 6. Constrained redundancy analysis (RDA) explaining bacterial species-environment interaction for the different RCST in Umbeluzi (a) and Chokwe (b). 10YF, ten years fallow; 5YF, five years fallow; 1YF, one year fallow; PH, postharvest; 5mR, five months off-season recovery period. “10YF/5YF” denotes fallow fields in Umbeluzi or Chokwe, respectively. Gray dots on the plot represent bacterial species.
Agronomy 11 00694 g006
Figure 7. Co-occurrence network of bacterial communities in rice-cultivated fields in Umbeluzi (a) and Chokwe (b) and in the fallow fields in Umbeluzi (c) and Chokwe (d). The nodes represent bacterial genera or environmental variables and are colored according to modules. Nodes with <3 connections are colored gray. The size of each node is proportional to their betweenness centrality. The connections (edges) stand for significant (FDR-adjusted p < 0.01) associations, while their sizes are proportional to ρ. Positive associations (edges) are colored green, while negative associations are colored red. Rectangles denote environmental variables, while ellipses denote bacteria phylotypes.
Agronomy 11 00694 g007
Table 1. Study site description.
Location
(Region)
Site CodeDescription (Rice Cultivation Status or Time Point, RCST)Sampling DateSampling Time (Planting Season)
Umbeluzi
(Maputo)
10YFAt least ten years without rice cultivationMay 2016Fallow field
PHCultivated fields with Makassane rice variety under an irrigated system. The fields were completely flooded. Samples were collected immediately after rice harvest (i.e., postharvest)May 2016Postharvest (2015/2016)
1YFOne year without growing rice. Cultivated with Makassane rice variety one year priorMay 2016Fallow field
5mRSame site as PH. Samples were collected five months postharvest but before pre-planting preparation for the next season. The field was completely flooded at the time of samplingOctober 2016Pre-planting (2016/2017)
Chokwe
(Gaza)
5YFAt least five years without rice cultivation. The fields were completely flooded at the time of samplingMay 2016Fallow field
PHCultivated fields with Makassane rice variety in an irrigated system. The fields were completely flooded. Samples were collected immediately after rice harvest (i.e., postharvest)May 2016Postharvest (2015/2016)
5mRSame site as PH. Samples were collected five months postharvest but before pre-planting preparation for the next season. The field was completely dry at the time of samplingOctober 2016Pre-planting (2016/2017)
Table 2. Selected physicochemical properties of bulk soil.
PropertiesUmbeluziChokwe
10YF1YFPH5mR5YFPH5mR
pH (H2O)7.17 ± 0.93 b7.67 ± 0.48 b8.25 ± 0.21 a7.99 ± 0.497.76 ± 0.50 a8.08 ± 0.29 a7.11 ± 0.69 *
EC (mS/cm)5.18 ± 6.35 a0.41± 0.05 b0.55 ± 0.13 b4.45 ± 0.66 *1.00 ± 0.32 a0.63 ± 0.31 a5.42 ± 3.06 *
Moisture (g H2O kg−1)30.50 ± 9.18 a27.84 ± 8.33 a29.71 ± 12.18 a22.75 ± 21.1253.35 ± 2.31 a56.67 ± 5.82 a39.47 ± 11.32 *
SOC (g kg−1)16.09 ± 5.08 a14.00 ± 2.25 a15.24 ± 1.85 a15.92 ± 1.4420.68 ± 4.16 a14.44 ± 1.21 b16.23 ± 0.91 *
NH4+–N (mg N kg−1)33.28 ± 58.39 a2.13 ± 0.83 c6.96 ± 2.34 b4.73 ± 0.90 *6.36 ± 1.38 a4.34 ± 0.93 b10.22 ± 15.1
NO3 –N (mg N kg−1)29.17 ± 51.46 a0.10 ± 0.31 b0.06 ± 0.19 b1.87 ± 4.62 *0.00 ± 0.000.00 ± 0.0022.52 ± 25.12 *
Total N (g kg−1 dry soil)0.70 ± 0.34 a0.75 ± 0.19 a0.77 ± 0.15 a0.91 ± 0.121.34 ± 0.63 a0.77 ± 0.11 a1.14 ± 0.08 *
P-Olsen (mg kg−1)28.30 ± 8.86 a26.44 ± 6.59 a29.87 ± 8.22 a20.81 ± 1.6515.42 ± 3.91 a9.67 ± 3.58 a9.39 ± 1.67
Egner Rhiem K (mg kg−1)240.70 ± 45.21 a251.37 ± 35.77 a239.25 ± 33.92 a328.59 ± 60.59 *463.61 ± 104.05 a524.98 ± 60.14 a492.85 ± 249.28
Values are mean ± SD (N = 9). Mean for 10YF, 5YF, 1YF or PH with different superscript letters across rows for each location (i.e., within location comparison) are significantly different (Bonferroni adjusted p < 0.05) based on Kruskal–Wallis or Mann–Whitney test. 5mR is compared to the only PH. * 5mR is significantly (p < 0.05) different from PH based on the Wilcoxon rank-sum test. Comparisons between locations were not performed due to differences in the number of sampled sites, soil type and varying agronomic practices. EC, electrical conductivity; SOC, soil organic carbon.
Table 3. Enzyme activities in soils.
LocationRCSTβ-Glucosidase
(µg p- Nitrophenol g−1 h−1)
Acid Phosphatase
(µg p- Nitrophenol g−1 h−1)
Alkaline Phosphatase
(µg p- Nitrophenol g−1 h−1)
Urease
(mg N–NH4+ kg−1 2 h−1)
Umbeluzi10YF41.18 ± 25.55 ab303.54 ± 201.14 a218.68 ± 104.83 a49.59 ± 32.97 a
1YF43.99 ± 14.5 a188.31 ± 57.79 a170.91 ± 31.69 a42.67 ± 8.97 a
PH25.83 ± 3.68 b127.15 ± 31.99 a148.68 ± 39.31 a25.11 ± 11.33 a
5mR30.50 ± 6.69 *122.98 ± 38.36121.43 ± 45.4924.34 ± 11.64
Chokwe5YF60.70 ± 23.99 a351.9 ± 111.1 a240.51 ± 69.41 a71.22 ± 19.47 a
PH58.51 ± 9.97 a198.37 ± 44.24 b172.99 ± 43.16 a82.00 ± 21.10 a
5mR74.26 ± 12.91 *220.03 ± 27.04191.61 ± 27.4882.30 ± 20.67
Values are mean ± SD of 9 bulk samples. Means for 10YF, 1YF or PH with different superscript letters across columns for each location (Umbeluzi or Chokwe) are statistically different (p < 0.05). * Significantly (p < 0.05) different from PH-based on the Wilcoxon rank-sum test (paired-sample t-test statistic) for each location. Comparisons between locations were not performed due to differences in the number of sampled sites, soil type and varying agronomic practices.
Publisher’s Note: MDPI stays neutral with regard to jurisdictional claims in published maps and institutional affiliations.

