Article

SPAER: Sparse Deep Convolutional Autoencoder Model to Extract Low Dimensional Imaging Biomarkers for Early Detection of Breast Cancer Using Dynamic Thermography

by
Bardia Yousefi
1,†,
Hamed Akbari
2,†,
Michelle Hershman
2,
Satoru Kawakita
3,
Henrique C. Fernandes
4,
Clemente Ibarra-Castanedo
1,
Samad Ahadian
3,* and
Xavier P. V. Maldague
1
1
Department of Electrical and Computer Engineering, Laval University, Quebec City, QC G1V 0A6, Canada
2
Department of Radiology, University of Pennsylvania, Philadelphia, PA 19104, USA
3
Terasaki Institute for Biomedical Innovation, Los Angeles, CA 90024, USA
4
Faculty of Computing, Federal University of Uberlandia, Uberlandia 38408-100, Brazil
*
Author to whom correspondence should be addressed.
Equal authors contribution.
Appl. Sci. 2021, 11(7), 3248; https://doi.org/10.3390/app11073248
Submission received: 11 March 2021 / Revised: 28 March 2021 / Accepted: 3 April 2021 / Published: 5 April 2021
(This article belongs to the Special Issue Structural Health Monitoring & Nondestructive Testing)

Abstract

:
Early diagnosis of breast cancer unequivocally improves the survival rate of patients and is crucial for disease treatment. With the current developments in infrared imaging, breast screening using dynamic thermography seems to be a great complementary method for clinical breast examination (CBE) prior to mammography. In this study, we propose a sparse deep convolutional autoencoder model named SPAER to extract low-dimensional deep thermomics to aid breast cancer diagnosis. The model receives multichannel, low-rank, approximated thermal bases as input images. SPAER provides a solution for high-dimensional deep learning features and selects the predominant basis matrix using matrix factorization techniques. The model has been evaluated using five state-of-the-art matrix factorization methods and 208 thermal breast cancer screening cases. The best accuracy was for non-negative matrix factorization (NMF)-SPAER + Clinical and NMF-SPAER for maintaining thermal heterogeneity, leading to finding symptomatic cases with accuracies of 78.2% (74.3–82.5%) and 77.7% (70.9–82.1%), respectively. SPAER showed significant robustness when tested for additive Gaussian noise cases (3–20% noise), evaluated by the signal-to-noise ratio (SNR). The results suggest high performance of SPAER for preserveing thermal heterogeneity, and it can be used as a noninvasive in vivo tool aiding CBE in the early detection of breast cancer.

1. Introduction

Cancer is the foremost cause of death worldwide and in the United States. Based on the American Cancer Society and World Health Organization (WHO) reports, newly diagnosed cancer cases in 2021 accounted for an overall estimation of 608,570 cancer deaths, where breast cancer alone was 30% of the overall cases [1,2]. Despite better survival rates and developments in different imaging modalities for screening and therapy, breast cancer is the most fatal cancer among women (second-most common cancer) [1]. Early detection of breast cancer has a crucial role in disease treatment planning and patients’ survival. This study proposes a deep learning-based model for dynamic thermography imaging for a clinical breast exam (CBE) before performing mammography. We hypothesize that deep learning features can track thermal heterogeneity in breast tissue, which may associate with the angiogenesis and vasodilation caused by cancer metabolism.
Since the 1960s, mammography has been a gold standard method for breast cancer screening. Studies reported some variabilities in the screening results with this modality, facing various clinical factors such as age, breast density, type of malignancy, and family history [3,4,5,6,7]. Fibrocystic breasts, hormone replacement therapy, and dense breasts undermine the strength of mammography imaging for accurate diagnosis (and screening) [8,9,10,11]. As an alternative, magnetic resonance imaging (MRI) is often used as it is relatively expensive and has lower specificity than mammography [12,13]. A CBE is performed by clinicians, which helps for detecting breast cancer with reasonable accuracy, but it is not usually employed alone [14,15]. The proposed system can be used in combination with CBE to increase the detection rate of breast cancer as a noninvasive low-cost tool.
Infrared imaging captures thermal radiation emitted from tissue within an 8–10 μm bandwidth. Skin’s emissivity is close to black-body emissivity (0.98) [16,17], which can transfer thermal fluctuations in such a way as to be observed with an infrared camera. The main source of thermal radiation is blood circulation, which becomes more heterogeneous due to the vasodilation and angiogenesis of tumor-adjacent tissues in abnormal tissue [18,19]. Additionally, metabolic activity in malignant tissue correlating with nitric oxide and estrogen expression causes increased temperatures, which can be detected through the skin [6,19,20,21,22]. In malignant neoplasia, the tumors’ growth is dependent on angiogenic sprouts, such that without this vascular support, tumors cannot receive vital nutrients [23,24]. Angiogenesis also promotes breast cancer progression and metastasis [25] through the cessation of C–C chemokine ligand 2 (CCL2) inhibitors [26]. The vascular endothelial growth factor (VEGF) is an important angiogenic factor for growing vascularity and providing nutrients to cancer cells [27]. Several studies have tried to detect such metabolic activities through different imaging tools, such as Raman spectroscopy [28,29] and infrared imaging [30,31,32]. In this study, we focus on the application of infrared imaging as an indicator of cancer’s presence (see Figure 1).
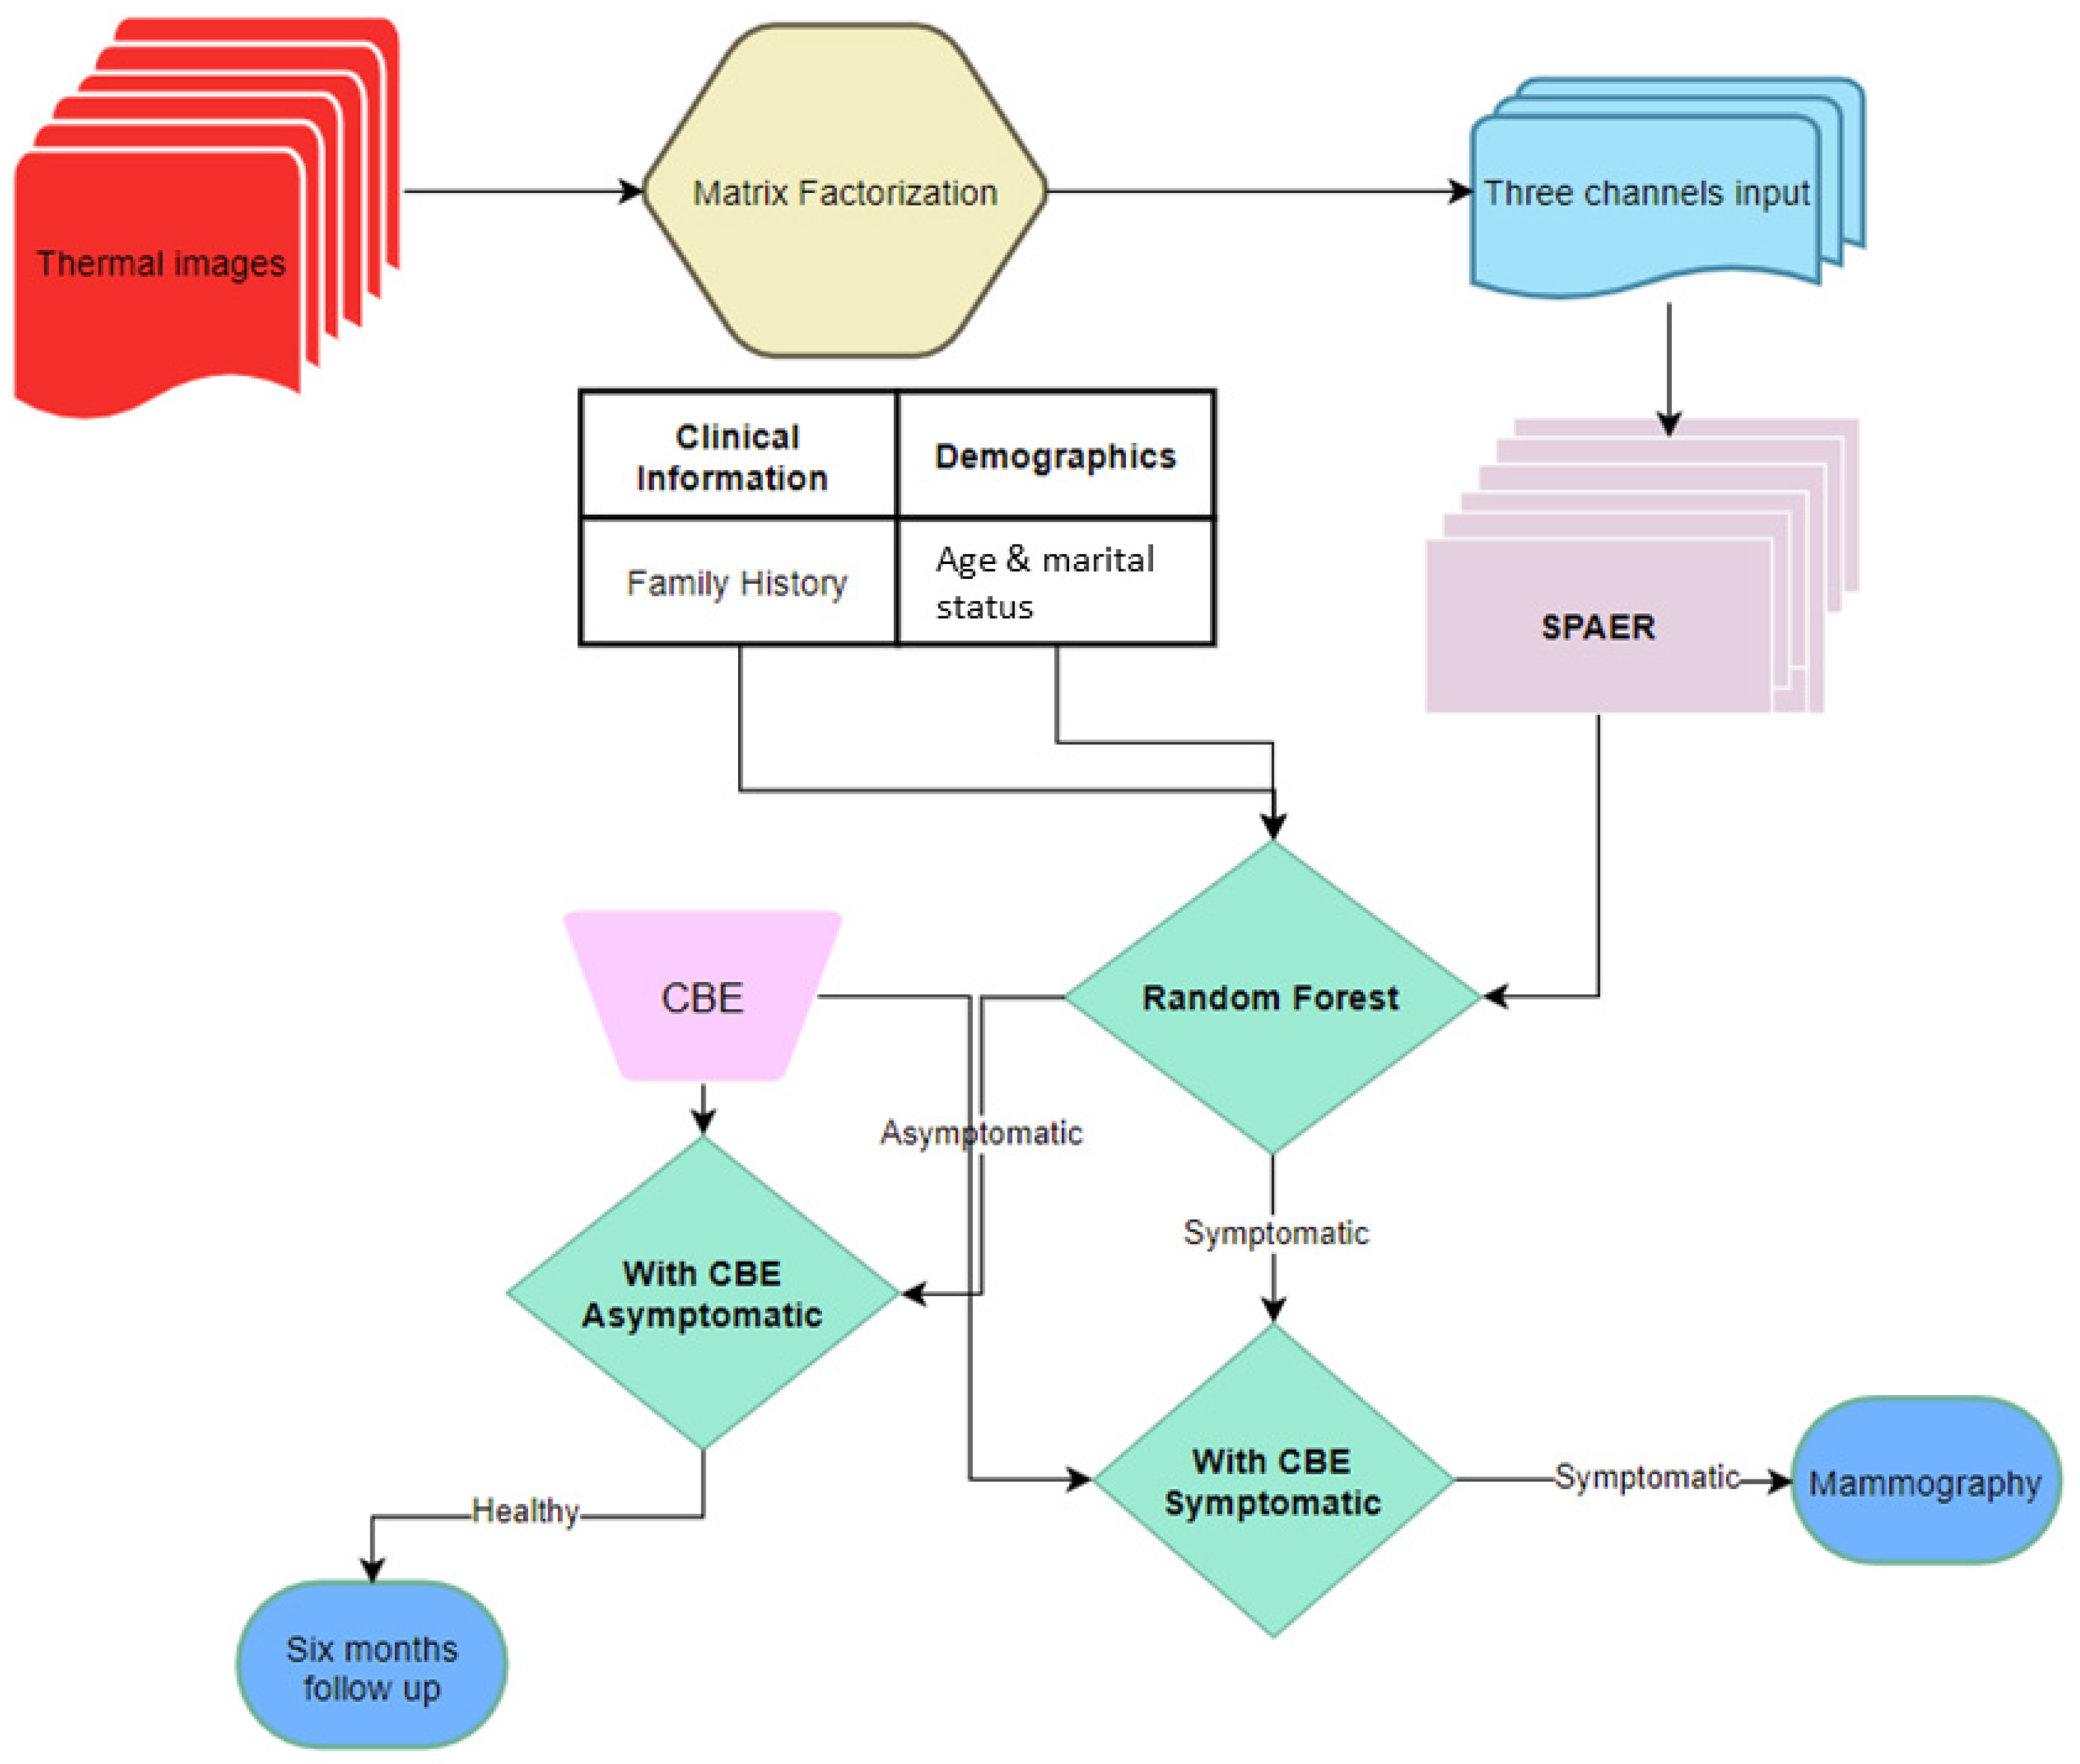
The application of infrared thermography in breast cancer screening involves computational methods to extract thermal heterogeneity. There are many methods for thermography that capture variance and reduce the dimensionality of thermal images [33,34,35,36,37,38,39,40,41,42,43,44,45,46,47,48,49,50,51]. In this study, we propose an infrared imaging system equipped with deep learning-based thermomics to assist the clinician in the early diagnosis of breast cancer combined with CBE. Figure 2 shows the workflow of the proposed method. We designed a sparse deep convolutional autoencoder (SPAER) to not only compress the dimensionality of the data but also perform embedding for low-rank matrix approximations for the thermal matrix. The proposed approach significantly aided in early diagnosis of breast cancer. The system showed significant robustness in preserving thermal patterns while facing additive Gaussian noise increasing from 3% to 20%. Moreover, this study performed a comparative assessment for the state-of-the-art matrix factorization techniques to generate multichannel inputs. In the next section, the proposed methodology is presented by describing details about the applied matrix factorization approaches and the SPAER and random forest models to perform the early diagnosis of breast cancer.

2. Materials and Methods

2.1. Low-Rank Matrix Approximation

Thermal variance during the short acquisition intervals provides an indication of thermal heterogeneity, which can be detected by different matrix factorization (MF) methods that are widely used in noninvasive evaluation [33,34,35,36,37,38,39,40,41,42,43,44,45,46,47], such as principal component analysis (PCA) in thermography, named as PCT [33,34], and non-negative matrix factorization (NMF) [36,37,38,39]. High dimensionality of thermography in various applications is still an open research challenge in the field. PCT decomposes the vectorized thermal images that are stacked in a matrix, called a heat matrix. It sorts the thermal base vectors based on their variance. Some methods, such as fixed eigenvector analysis [36], incremental PCT (IPCT) [37], and candid covariance-free incremental principal component thermography (CCIPCT) [40], attempt to overcome the computational load by a fixed set of previously generated eigenvectors and a covariance-free approach, respectively. SparsePCT [41,42] (also known as sparse dictionary matrix decomposition [38]) adds regularization terms to the PCT to not only restrict the domain of solution, but to also make it nonlinear, which strengthens the important basis of improving the detection of defective patterns. NMF [35,39] adds constraints to the basis and coefficients and converts MF to a clustering problem, which helps in thermography to better evaluate the thermal abnormalities with no overlapping bases [43,44]. Semi-NMF and sparse NMF are used for infrared, noninvasive evaluation and extraction of the thermal patterns as well as for preliminary breast cancer screening, along with all the aforementioned methods for comparison [45,46,47]. Imaging features extracted from thermal images, called thermomics [47], are used to provide diagnostic solutions along with deep learning-based thermomics [48]. Deep learning approaches are also used to diagnose breast cancer using thermographic imaging [49,50].
Input data X is the heat matrix obtained by stacking the vectorized thermal images X M N   ×   τ . PCT decomposes the input heat matrix X to eigenvalue and eigenvector matrices, which are also known as coefficients and bases. The bases matrix represents the highest variance of thermal patterns, sorted in descending variance order corresponding to the coefficients. SparsePCT [41,42] adds penalty terms to the original PCT to limit the domain of the solutions, which leads to nonlinear behavior and a sparse outcome. NMF modifies the PCA’s decomposition using non-negative constraints, whereas the bases and coefficients in PCA are allowed to be negative. X can be presented as a linear relation of τ bases B =   { β 1 , β 2 , , β p } ,   B M N   ×   τ + and A coefficient matrix A   τ   ×   τ + , and X = B A   s . t .   A 0 ,   B 0 . The 1 norm penalty term, along with a regularization parameter, is added to NMF for compensating the bases’ distinctiveness and improving their presentation, which is shown by the following equation:
C Sparse NMF = 1 2 X B A F 2 + λ B 1
where B p represents the p norm of B, defined by p =   d , m B d , m p 1 / p , which is similar to the 1 penalty term [51,52] calculating B for convex A. Like SparsePCT, low-rank SparseNMF is obtained by selecting k bases, corresponding to the highest coefficients and representing the highest variance of the targeted thermal images (here, k = 3 ).

2.2. Sparse Latent Space Deep Thermomics

The high-dimensional throughput of thermal features, called thermomics [44,45,46,47,48], inspired from radiomics [53,54,55], are often referred to as quantitative feature extraction from medical images. Thermomics contain quantitative measurements of distinct thermal patterns that may aid in the diagnosis of diseases or assist in the course of treatment. Like radiomics (well known in radiographic medical imaging), thermomics have proven to have the capability to find the characteristics of some diseases that cannot be revealed by the naked eye [44,45,46,47,48]. These features are usually complimentary with clinical covariates to increase analytical power. Deep neural networks have been recently explored to improve conventional radiomics [48,49,50]. Computer-aided diagnosis systems often leverage having a sufficient number of features to capture the imaging characteristics, whereas the abundance of thermomics impedes the performance of the system and creates an overfitting problem, known as the curse of dimensionality [48].
Deep features are commonly extracted from the hidden weight layers of pre-trained models such as ResNet [56], ImageNet [57], and VGG [58]. This often leads to high-dimensional throughput information and challenges in reducing the dimensionality, which often overfits the model. Conventional feature selection methods, which are efficient for traditional radiomics, might not be the best solution to reduce the dimensionality in such features due to a tight connection among the hidden weights, which can be interpreted as collinearity. The application of a sparse autoencoder for reducing the dimensionality of the pre-trained hidden layers of pre-trained deep learning models can be an acceptable solution for such problems due to training such dimensionality reduction models to be sensitive to slowly varying high dimensionality [48].
In this study, we propose a sparse autoencoder directly for the low-rank approximation of thermal sequences to extract the low-dimensional thermomics and use them to diagnose breast cancer. This surpasses the use of pre-trained models. The autoencoder comprises encoding and decoding pathways to compress the input data to lower dimensions hierarchically and expand the compressed data to regenerate the input image and strive to get as similar an output as possible. This measures the loss function and distance between the original input and the regenerated output, and the parameters of such a model are optimized through a stochastic gradient descent algorithm and strive to minimalize the differences between the input and the reconstructed image (otherwise known as reconstruction loss).
Let x n   ×   m be the input with the spatial dimensions of 512 × 512 × 3 . The latent space dimension of η , η = F e ( x ) = a e ( W x + b e ) is the compressed representation of the input image, a e is the encoder activation, and W and b e are the weight and encoder bias matrices, respectively. y =   G d ( η ) = a d ( W T η ) expands the latent features back to the original input spatial dimensions. y is the equivalent of x , and a d is the decoder’s activation. A deep autoencoder composed of a multilayer model with several activations a ( . ) i , biases b ( . ) i , and weights W i and matrices with the goal of minimization { W i , b e i } :
J AE =   E x [ ( x , G d i ( F e i ( x ) ) ) ]
Following this optimization, the predominant noise invariant representative patterns of the thermal data are captured. ( . ) is our loss function for training our model, for which we use binary cross-entropy (BCE) as presented below:
BCE =     1 F   i = 1 F y i   log ( p ( y i ) ) + ( 1 y i ) log ( 1 p ( y i ) )
where p ( y ) presents the likelihood of predicting the label y for each point (form i = 1 , ,   F ). The presenting value of the background versus the targeted class binarizes with 1 1 + e y , a Sigmoid function. To fit a training set through learning a dictionary through the sparse latent representation, an additional 1 of the latent space as an additional penalty term with a regularization parameter is added to the model as follows [59,60]:
m i n W i ,   η i j = 1 F ( x j W j T η j 2 +   λ η j 1 )
where each W i and η i are convex in the objective of this optimization. The aforementioned objective applies for W 1 and η 1 .
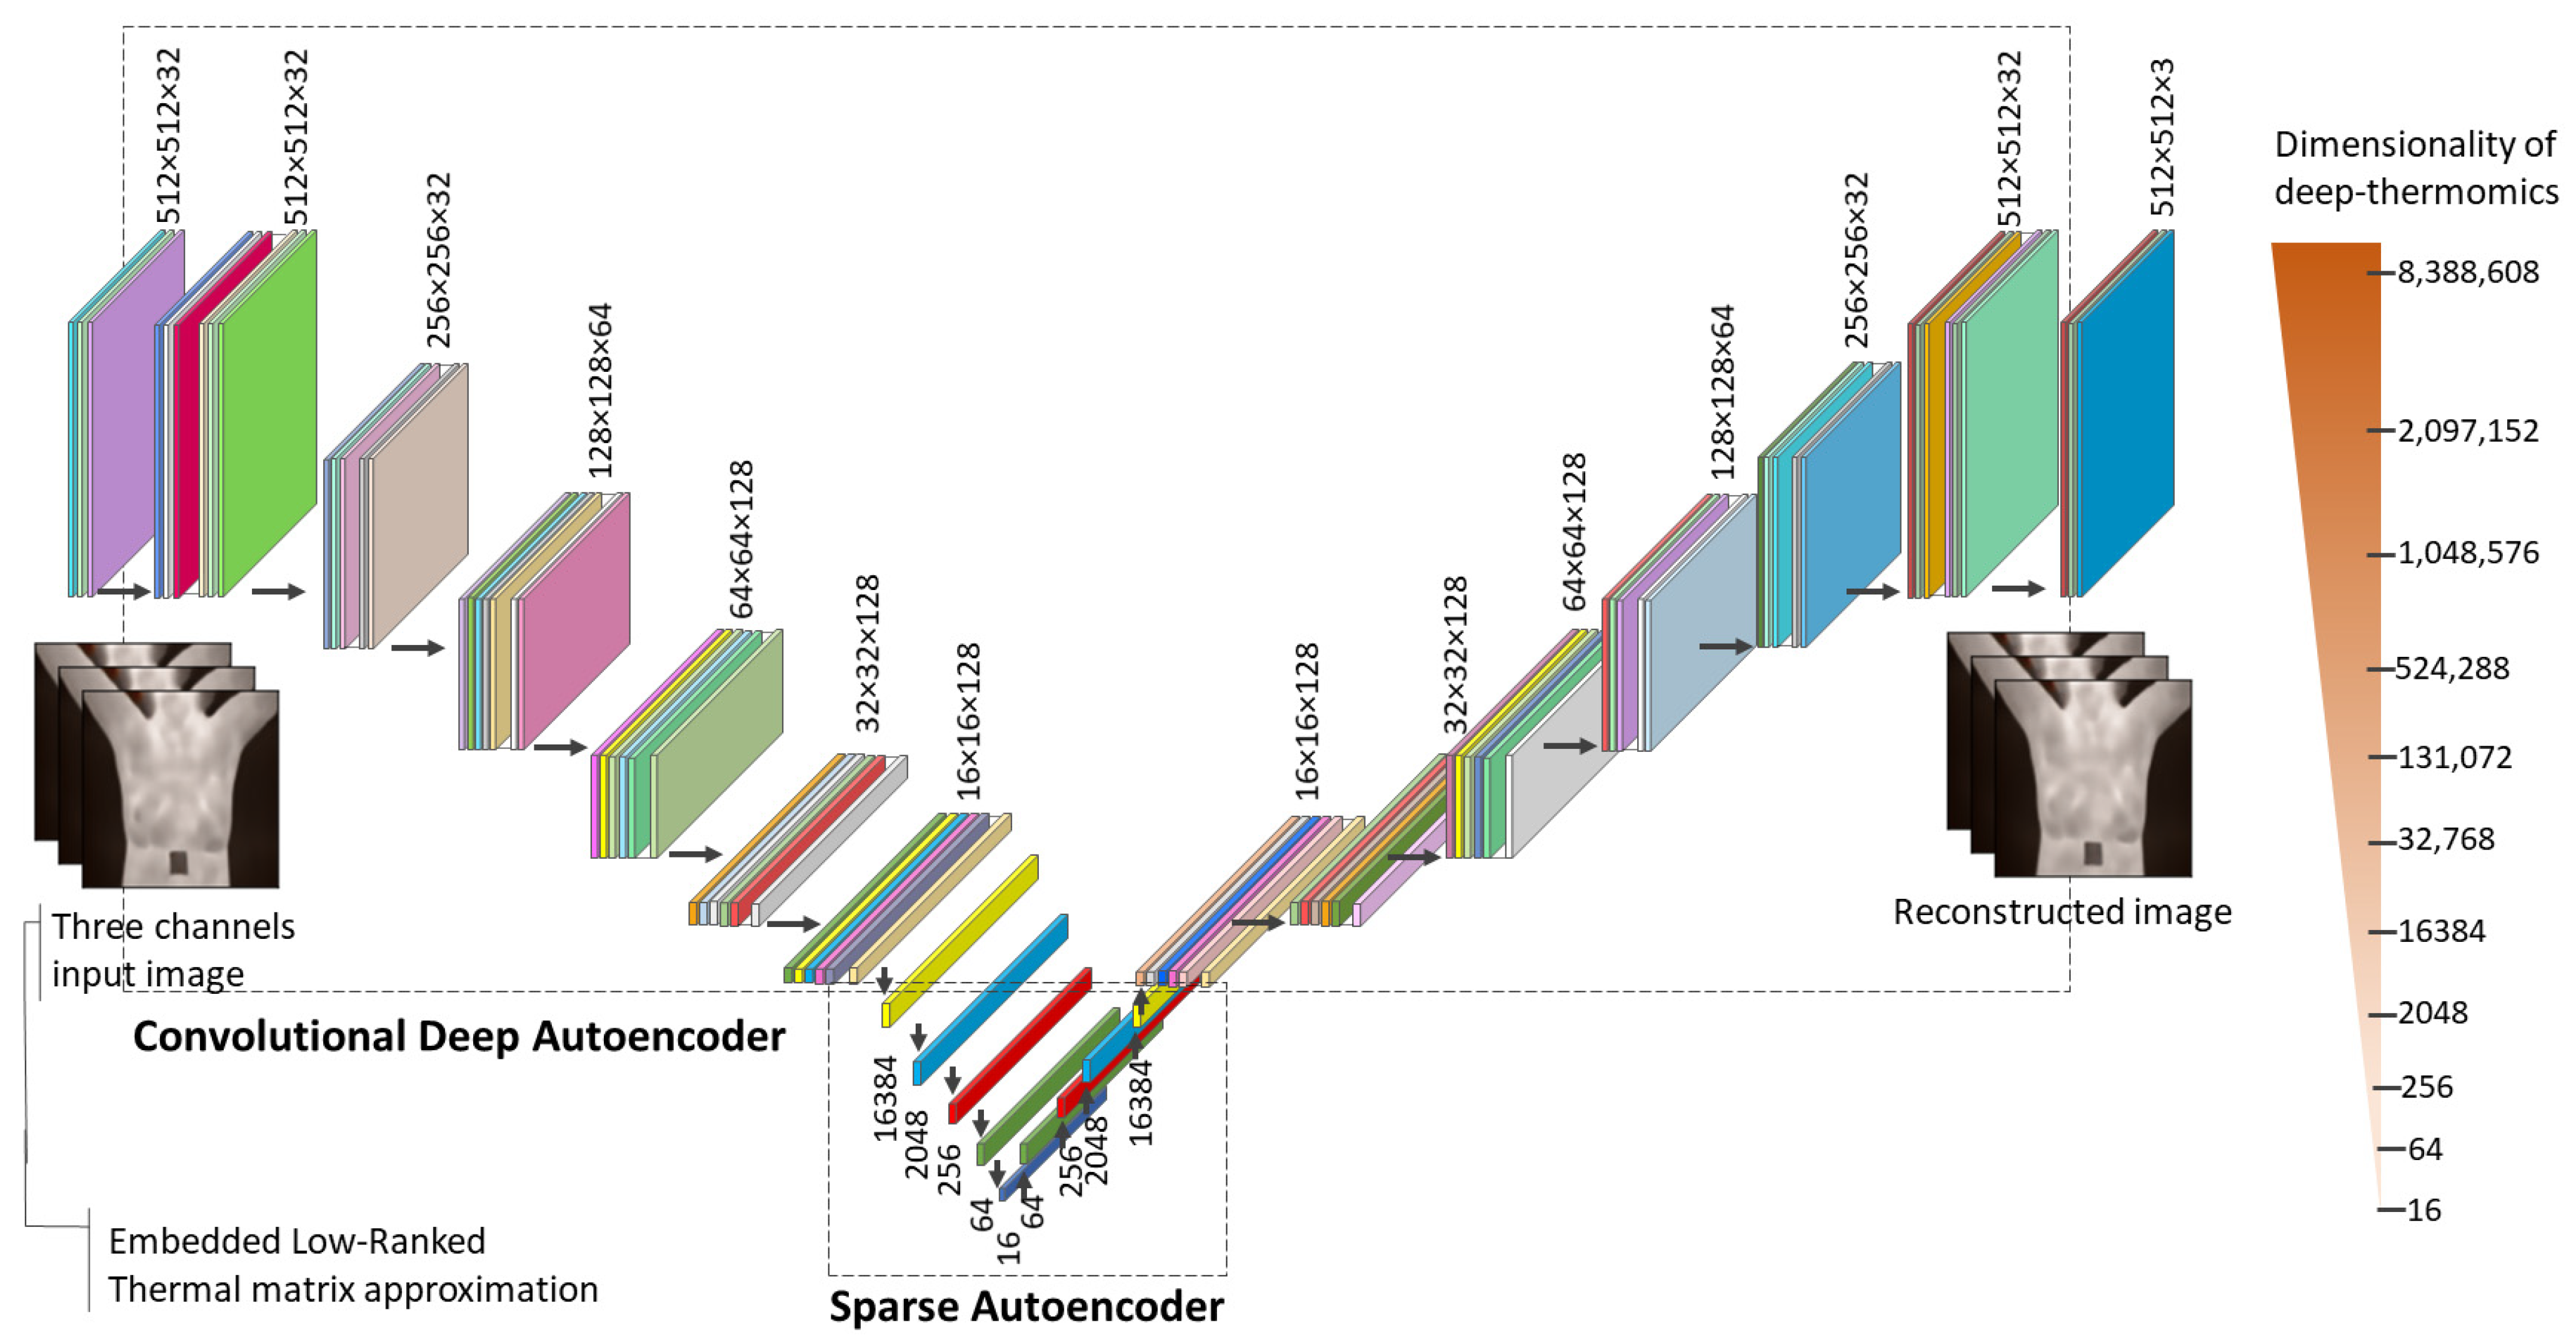
Applying the following procedure, we extracted the low-dimensional deep thermomics and used them to train a random forest model, then classified the participants into symptomatic and healthy groups. Figure 3 shows the configuration of the SPAER network.
This study used 208 participants from the database for mastology research (DMR), acquired from patients of the Hospital Universitário Antônio Pedro (HUAP) of the Federal University Fluminense [30]. This study was approved by the ethical committee of the HUAP under registration number CAAE: 01042812.0.0000.5243 by the Brazilian Ministry of Health and met the criteria defined by the Declaration of Helsinki. The participants cohort was divided into healthy (without symptoms) and symptomatic (healthy with symptoms or cancer patients) groups with a median age of 60 years, while the youngest and the oldest participants were 20 and 120 years old, respectively. There were 57 African (27.4%), 72 Pardo (34.6%), 77 Caucasian (37%), 1 Mulatto (0.5%), and 1 indigenous (0.5%) woman in this dataset. Among the participants, 38 went through hormone replacement (18.3%), and 52 had diabetes in their family histories (25%). A forward-looking infrared (FLIR) SC620 model infrared camera (Wilsonville, OR) with a sensitivity range of <0.04 °C was used to perform infrared imaging acquisition with a spatial resolution of 640 × 480 pixels. It captured a range of [−40 °C, 500 °C] [15,30]. Table 1 summarizes the demography and clinical information of our study set.

3. Results

Our proposed models were tested on 208 participants. The results of the system were compared to the ground truth to measure the accuracy of the system.

3.1. Results of Low-Rank Thermal Matrix Approximation

We calculated three predominant low-rank matrices from 23 baseline thermal imaging sequences using matrix factorization. Figure 4 shows the low-rank representation of thermal patterns captured by PCT, IPCT, NMF, sparse PCT, and sparse NMF for six examples of healthy and symptomatic participants. With this procedure, a region of interest (ROI) was identified for each participant for three bases. For every case in Figure 4, the targeted ROI was magnified to highlight the thermal patterns for the screening cases. These thermal patterns revealed the potential angiogenesis in thermal images, as there was more heterogeneity in the ROI of cancerous or healthy with symptoms cases (Figure 4iii–vi) than the healthy ROI (Figure 4i,ii). Figure 4iii,iv presents healthy participants with pain and changes in the nipple, but the mammography and biopsy results did not conclude the presence of cancer. In this analysis, thermal heterogeneity was detected for symptomatic patients using various low-rank matrix factorizations (see Figure 4a–e), whereas there were more homogeneous thermal patterns observed for asymptomatic participants (Figure 4a–e, rows i,ii).

3.2. Sparse Autoencoder and Deep Thermomics

Sixteen (16) deep thermomics were extracted from the proposed SPAER model from three-channel images with a spatial resolution of 512 × 512 as the input. The input channels were three predominant, low-rank thermal matrix approximations. The proposed deep autoencoder used in this study contained five convolutional layers (Figure 3) to reduce the dimensionality of the input from 786,432 to 32,768, where another five sparse, dense layers reduced the dimensionality of the imaging markers from 16,384 to 2048, 256, 64, and 16 deep thermomics. The SPAER model has 637,507 trainable parameters, which are trained using the Adam optimizer for 100 epochs for 3000 raw thermal images and validated for 788 baseline thermal images, with a sparsity 1 regularization value of 10−5 in the dense layers and 16 batch sizes. Consequently, the SPAER model mitigated the dimensionality of the embedded low-rank thermal matrices slightly less than 50,000 times while striving to keep the characteristics of the thermal images intact.

3.3. Classification Outcome

The extracted deep thermomics generated by the SPAER model were used to train a random forest model and distinguish symptomatic patients from asymptomatic participants. The accuracy of this model was evaluated by comparing the model’s suggested cohort versus the ground truth, which was obtained by mammography and breast biopsy. We benchmarked the model using 16 extracted deep thermomics biomarkers and other clinical and demographic information (e.g., age, marital status, and family history) through leave-one-out cross-validation. The accuracy of the maximal multivariate model yielded 78.2% (74.3–82.5%) for NMF deep thermomics and clinical information, which was challenged by NMF-SPAER, PCT-SPAER and sparse PCT-SPAER with clinical information, having accuracies of 77.7% (70.9–82.1%), 77.7% (73.3–82.1%), and 77.7% (72.3–81.6%), respectively. IPCT-SPAER, PCT-SPAER, and sparse PCT-SPAER showed considerably similar accuracies of diagnosis, yielding 85.4% (79.6–88.8%) and 86.4% (81.1–88.8%) with and without clinical information, respectively. IPCT-SPAER showed the lowest diagnostic accuracy of 74.3% (69.4–80.1%), 74.3% (70.4–79.1%), and 74.3% (69.9–79.6%), respectively. IPCT-SPAER’s accuracy slightly increased to 76.2% (71.4–79.6%) with demographics. The minimal full multivariate model, which was for sparse NMF-SPAER with clinical information, showed an accuracy of 74.8% (70.9–77.2%), indicating lower performance, probably due to dual sparsity and non-negative matrix factorization with the models (see Table 2).
The sensitivity, specificity, positive predictive value (PPV), and negative predictive value (NPV) were calculated using the optimum point in the receiver operating characteristic (ROC) for the trained model (Table 2). Sparse NMF-SPAER + Clinical showed the maximum sensitivity (87.5%) among the other methods, where IPCT-SPAER + Clinical and Sparse PCT-SPAER at 86.3% were the second-best sensitivities among the methods. Clinical covariates alone showed the minimum sensitivity (73.8%) compared with the other approaches. The sparse NMF-SPAER (91.4%) and NMF-SPAER + Clinical (87.5%) showed the maximum specificities, while clinical alone showed the worst specificity of 70.3%. The sparsity in the model might be the key to having higher specificity and indicating which cases are not symptomatic. Similarly, sparse NMF-SPAER showed the maximum PPV (85.5%), while sparse NMF-SPAER + Clinical had the highest NPV among the rest of the algorithms (91.2%). The clinical covariate was the least significant for the PPV and NPV.
A multivariate model consisting of clinical information and demographics alone provided an accuracy of 72.8% (70.4–75.3%). We also calculated the statistical difference of the maximal accuracy (NMF-SPAER + Clinical), with other approaches using a two-tailed t-test (see Table 2). NMF-SPAER + Clinical showed considerable similarity to NMF-SPAER with clinical covariates (t-statistic = 1.1, p-value = 0.27) as well as sparse PCT-SPAER + Clinical (t-statistic = 0.2, p-value = 0.8) and PCT-SPAER+ Clinical (t-statistic = 0.6, p-value = 0.5), whereas the rest of the methods showed significant statistical differences. Figure 5 presents the ROC graphs of the baseline models with different embedding SPAER methods. The total computation of this study was performed in the Python programming language using the TensorFlow Python library [61,62].
All parameters, including the number of trees, depth, and random state, were optimized in a cross-validation loop through a greed search. This greed search not only guaranteed that we optimized the parameters, but it also confirmed that we did not overfit the parameters as we did it after leaving one subject out of the optimization. To improve the model’s accuracy, we suggest increasing the number of patients to increase the learning and statistical power.

3.4. System’s Robustness

Thermography is usually affected by noise, as one of the undeniable facts of using infrared imagery induced by environmental conditions surrounding the breast cancer screening exam. Robustness of the model versus noise can be vital for the system, particularly on the imaging acquisition and decision-making system. This problem is highlighted especially for our study cohort with different ages, races, family histories, and body shapes. The proposed SPAER model is presumably robust against noise because of the nature of the low-rank matrix approximation and latent space representation of the input image. To show such stability in the SPAER model, we measured the signal-to-noise ratio (SNR) of the model with additive Gaussian noise in the multiple channels of input of the SPEAR model. We used the following SNR equation to measure the stability of the SPAER model (from [63]):
SNR = 10 log 10 | μ S   μ N | 2 σ N 2  
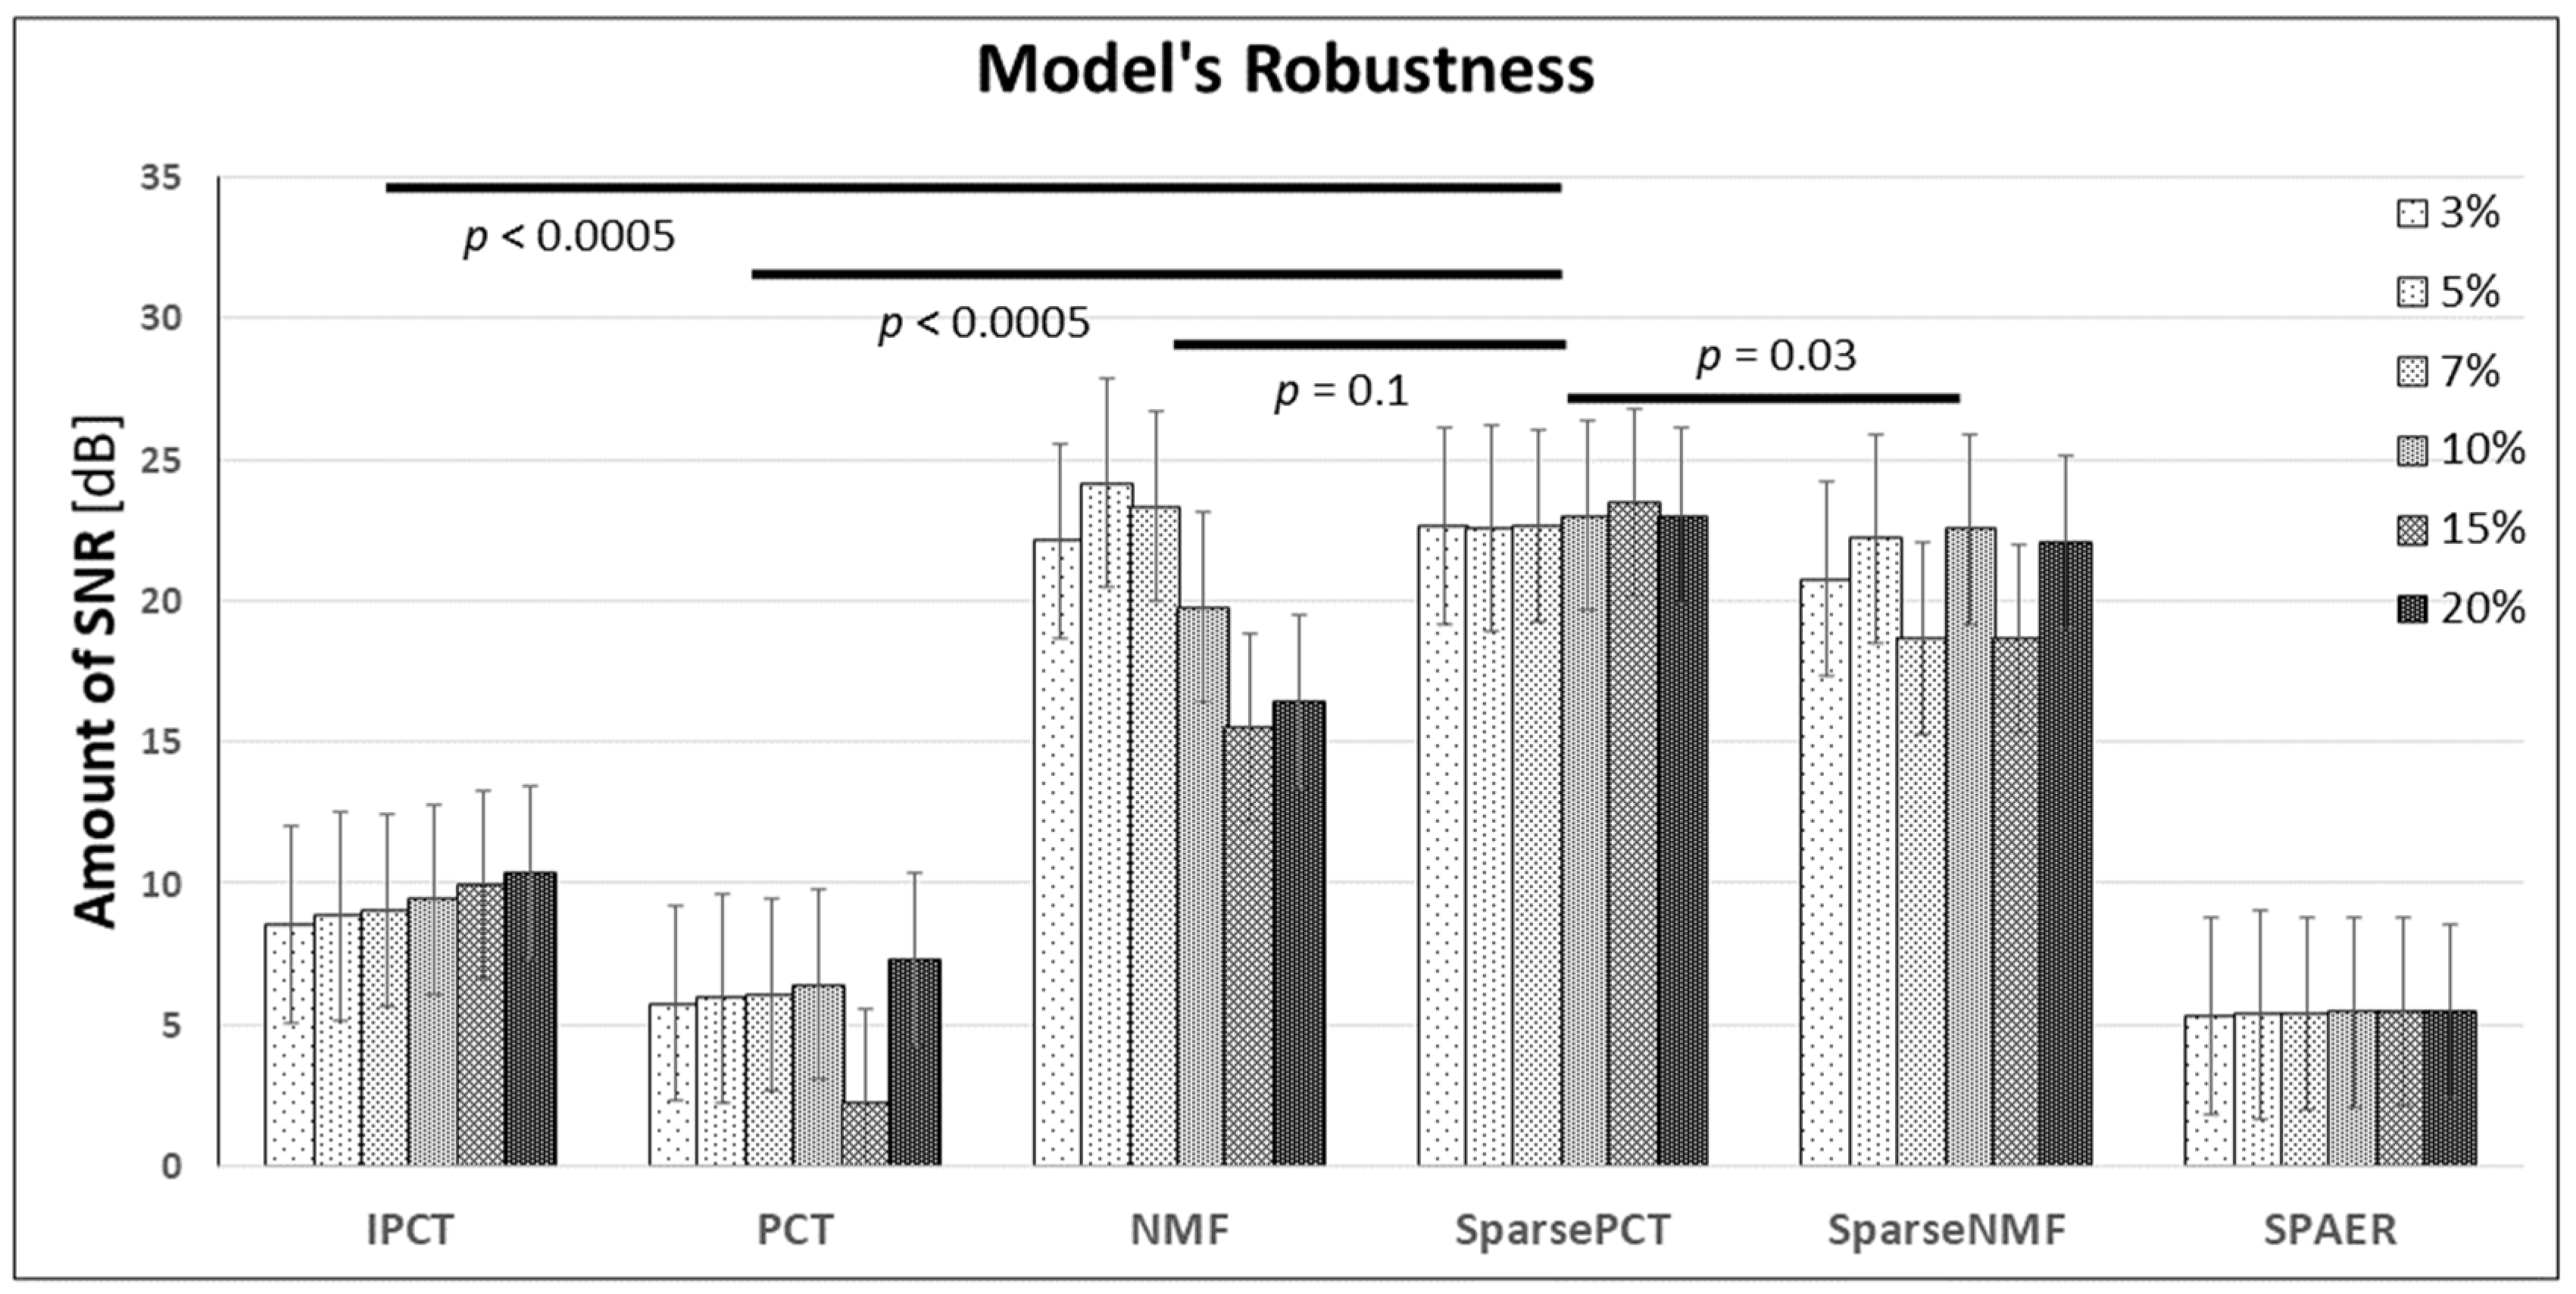
where μ S and μ N are the signal and noise averages in the ROI, respectively, and σ N denotes the standard deviation of the noise, obtained from the thermal referencing point in the images. The low-rank matrix approximation techniques significantly eliminated the noise of the input data (see [37,46]). The reason we evaluated the SNR only for the multichannel input of the SPAER model was to have a separate assessment of this model. We included the additive Gaussian noise, incrementally increasing it from 3% to a 20% noise level for the multichannel input of the trained SPAER model and extracting deep thermomics, then reconstructing the image where the SNR was measured to evaluate the stability of the SPAER model. With that, we also measured the SNRs for the thermal matrix factorization techniques separately. Figure 6 presents the robustness of the model, divided into two parts: low-rank matrix approximation methods and the SPAER model. The results showed that sparse PCT and the SPAER model demonstrated the highest robustness due to additive penalty terms, inducing nonlinear behavior and limiting the domain of the solution, which increased the robustness of the model. This was also seen in sparse NMF, where non-negative constraints may have weakened the robustness occurring in NMF, with the lowest robustness among the matrix factorization algorithms. IPCT showed more robustness than PCT. This might be because of the incremental adjusting of the bases in the algorithm. We also performed statistical analysis among matrix factorization methods using a t-test between sparse PCT and other approaches. The results showed a significant difference between sparse PCT and sparse NMF, IPCT, and PCT. It may be due to the dissimilarity between PCT and IPCT and the non-negative and sparsity constraints in sparse NMF. NMF and sparse PCT showed more similarity in SNR while the noise increased, as non-negative constraints also limited the domain of the solution, similar to the sparsity penalty term in sparse PCT, despite the lower stability of NMF.

4. Discussion

In this study, we introduced a sparse deep convolutional autoencoder called SPAER to generate deep thermomic features. It embedded three predominant thermal bases, obtained by low-rank matrix approximation in the form of a multichannel input matrix. We designed the SPAER model to be applicable to any imaging modality, but we tested it for dynamic thermography. The results indicated that SPAER could identify the potential symptomatic patients and aid in the early diagnosis of breast abnormality as a noninvasive, efficient, and fast technique to be used with CBE and before mammography.
SPAER potentially surpasses the use of pre-trained deep neural networks to extract high-dimensional imaging throughput, which leads to high collinearity among the features and overfitting the system, known as the curse of dimensionality. The results indicate that SPAER significantly reduced the noise throughout the process by having sparse regularizations in dense layers, which were tested with additive noise (Figure 6). Autoencoders are often used for noise elimination due to their nonlinearity. SPAER also behaved the same and showed a significant SNR when facing additive noise [64,65,66]. Low-rank matrix approximation used for the extraction of high variance bases also enhanced the stability of the system against noise [37,46]. This had the opposite effect on the accuracy of sparse NMF, and relatively Sparse PCT, as two-folds sparsity with non-negative constraints mitigating the outcome performance of the overall system. This may be due to reducing the domain of the solution having two penalty terms, which led to a slight decrease in the overall accuracy for sparse NMF-SPAER and even for sparse PCT-SPAER (Table 2).
The application of infrared thermography to establish early breast abnormality has been suggested previously [30,49]. This can be expanded for several nonneoplastic diseases and normal homeostatic processes [21,22]. Despite some discussions about its reliability as a single applied system for finding breast cancer [20], dynamic thermography showed promising outcomes [46,47,48], and this makes it a valuable complementary mechanism along with CBE for increasing the possibility of finding abnormalities at an initial stage (not as a mammography substitute [67,68]). Moreover, the association of heterogeneous thermal patterns with early breast cancer detection has not been discussed in the literature and significantly increases the novelty of the proposed model. Besides that, the SPAER model was tested for dynamic thermography, yet its applications are not limited to this application, and it can be used for any other imaging modality, which makes SPAER a generalized model for a variety of applications.
One of the limitations of this study is the number of patients. Despite having a relatively large cohort of patients, having access to an even larger cohort would increase the validation of the statistical analysis and improve the accuracy of the system. The maximum efficiency of the method would be revealed by a higher number of patients. DMR was the only available dataset with such analyses that we could access, and this limited the possibility of an independent validation set to confirm the performance of the system. Another limitation of this study is related to the lack of comprehensive clinical information. Even with the great effort of the DMR team [30], there could be more potential clinical information, such as pathology information. This could help to find the correlation of different factors with thermal heterogeneity. Moreover, there is a limitation regarding the minimum number of thermal images required for the process, which should be more than four images, as there is a matrix factorization method involved that selects three bases, which requires a minimum of four thermal images.
The proposed model provides several advantages. (1) SPAER provides low-dimensional deep thermomics (imaging biomarkers), which exceeds the use of pre-trained models for feature extraction with high dimensionality and their complications. (2) The SPAER model can be trained for the specific data and generate relevant imaging features, rather than diverse training datasets (e.g., natural images versus medical imaging sets), which provides another advantage for this application. (3) SPAER uses the multichannel low-rank thermal matrix approximation that provides embedding for the use of the low-rank matrix factorization method. This mitigates the use of manual selection of predominant bases. (4) This model significantly mitigates the noise and motion artifacts during imaging, which often happens for infrared thermographic imaging. To the best of our knowledge, the model and the way of embedding multichannels for extracting deep thermomics has not been proposed before, which makes this research a novel study.

5. Conclusions

The proposed study tackled one of the major challenges of using deep learning imaging biomarkers by developing a sparse deep convolutional autoencoder, called the SPAER model, which generates low-dimensional deep thermomics. It used the low-rank multichannel thermal matrix approximation as an input for the SPAER model. The SPAER model provided significant dimensionality reduction without lessening the diagnostic performance, decreasing from 786,432 to 16 imaging biomarkers. Five state-of-the-art matrix factorizations were employed to extract three initial predominant bases and embed them, which provided a solution for selecting manual bases. A total of 208 breast cancer screening cases with dynamic thermography were used for testing the proposed model. The best accuracy was for NMF-incorporated SPAER with demographics for preserving thermal heterogeneity to classify between symptomatic and asymptomatic cases (yielded to 78.2% (74.3–82.5%)). In addition, SPAER showed significant robustness against additive Gaussian noise, increasing from 3% to 20%, while the highest SNR was obtained by sparse PCT, generating multichannel low-rank thermal matrix approximation. Future work would involve the integration of other available clinical factors to enhance the ability to assess the thermal characteristics of tissues. This could be better evaluated by increasing the study cohort and multimodal analysis.

Author Contributions

Conceptualization, B.Y. and H.A.; methodology, software, validation, formal analysis, investigation, and resources, B.Y.; study data, B.Y. and H.C.F.; writing the original draft preparation, B.Y.; writing—review and editing, B.Y., H.A., M.H., H.C.F., S.K., S.A., C.I.-C. and X.P.V.M.; visualization, B.Y.; supervision, S.A. and X.P.V.M.; All authors have read and agreed to the published version of the manuscript.

Funding

This research received no external funding.

Institutional Review Board Statement

The study was conducted according to the guidelines of the Declaration of Helsinki, and approved by the Institutional Review Board (or Ethics Committee) of the Hospital Universitário Antônio Pedro (HUAP) of the Federal University Fluminense (under registration number CAAE: 01042812.0.0000.5243 by the Brazilian Ministry of Health).

Informed Consent Statement

Not applicable.

Acknowledgments

This research was conducted under multi-institutional collaboration with a Tier-1—Canadian Research Chair in Multipolar Infrared Vision (MIVIM) at the Department of Electrical and Computer Engineering at Laval University, Canada.

Conflicts of Interest

The authors declare no conflict of interest.

References

  1. Siegel, R.L.; Miller, K.D.; Fuchs, H.E.; Jemal, A. Cancer statistics. A Cancer J Clin. 2021, 71, 7–33. [Google Scholar] [CrossRef] [PubMed]
  2. World Health Organization Report on Cancer. September 2018. Available online: https://www.who.int/news-room/fact-sheets/detail/cancer (accessed on 3 March 2021).
  3. Crystal, P.; Strano, S.D.; Shcharynski, S.; Koretz, M.J. Using sonography to screen women with mammographically dense breasts. Am. J. Roentgenol. 2003, 181, 177–182. [Google Scholar] [CrossRef] [Green Version]
  4. Kerlikowske, K.; Grady, D.; Barclay, J.; Sickles, E.A.; Ernster, V. Effect of age, breast density, and family history on the sensitivity of first screening mammography. JAMA 1996, 276, 33–38. [Google Scholar] [CrossRef]
  5. Hong, S.; Song, S.Y.; Park, B.; Suh, M.; Choi, K.S.; Jung, S.E.; Jun, J.K. Effect of digital mammography for breast cancer screening: A comparative study of more than 8 million Korean women. Radiology 2020, 294, 247–255. [Google Scholar] [CrossRef]
  6. Kennedy, D.A.; Lee, T.; Seely, D. A comparative review of thermography as a breast cancer screening technique. Integr. Cancer Ther. 2009, 8, 9–16. [Google Scholar] [CrossRef]
  7. De Gonzalez, A.B.; Reeves, G. Mammographic screening before age 50 years in the UK: Comparison of the radiation risks with the mortality benefits. Br. J. Cancer 2005, 93, 590–596. [Google Scholar] [CrossRef] [PubMed] [Green Version]
  8. Fletcher, S.W.; Elmore, J.G. Mammographic screening for breast cancer. N. Engl. J. Med. 2003, 348, 1672–1680. [Google Scholar] [CrossRef] [PubMed] [Green Version]
  9. Osako, T.; Iwase, T.; Takahashi, K.; Iijima, K.; Miyagi, Y.; Nishimura, S.; Kasumi, F. Diagnostic mammography and ultrasonography for palpable and nonpalpable breast cancer in women aged 30 to 39 years. Breast Cancer 2007, 14, 255–259. [Google Scholar] [CrossRef]
  10. Duffy, S.W.; Vulkan, D.; Cuckle, H.; Parmar, D.; Sheikh, S.; Smith, R.A.; Myles, J. Effect of mammographic screening from age 40 years on breast cancer mortality (UK Age trial): Final results of a randomised, controlled trial. Lancet Oncol. 2020, 21, P1165–P1172. [Google Scholar] [CrossRef]
  11. Nguyen, Q.D.; Nguyen, N.T.; Dixon, I.I.I.L.; Monetto, F.E.P.; Robinson, A.S. Spontaneously Disappearing Calcifications in the Breast: A Rare Instance Where a Decrease in Size on Mammogram Is Not Good. Cureus 2020, 12, e8753. [Google Scholar] [CrossRef] [PubMed]
  12. Morris, E.A. Screening for breast cancer with MRI. In Seminars in Ultrasound, CT and MRI; WB Saunders: Berlin/Heidelberg, Germany, 2003; Volume 24, pp. 45–54. [Google Scholar]
  13. Ahern, C.H.; Shih, Y.T.; Dong, W.; Parmigiani, G.; Shen, Y. Cost-effectiveness of alternative strategies for integrating MRI into breast cancer screening for women at high risk. Br. J. Cancer 2014, 111, 1542–1551. [Google Scholar] [CrossRef] [Green Version]
  14. Barton, M.B.; Harris, R.; Fletcher, S.W. Does this patient have breast cancer? The screening clinical breast examination: Should it be done? How? JAMA 1999, 282, 1270–1280. [Google Scholar] [CrossRef]
  15. Oestreicher, N.; Lehman, C.D.; Seger, D.J.; Buist, D.S.; White, E. The incremental contribution of clinical breast examination to invasive cancer detection in a mammography screening program. Am. J. Roentgenol. 2005, 184, 428–432. [Google Scholar] [CrossRef] [PubMed]
  16. Feig, S.A.; Shaber, G.S.; Schwartz, G.F.; Patchefsky, A.; Libshitz, H.I.; Edeiken, J.; Wallace, J.D. Thermography, mammography, and clinical examination in breast cancer screening: Review of 16,000 studies. Radiology 1977, 122, 123–127. [Google Scholar] [CrossRef]
  17. Keyserlingk, J.R.; Ahlgren, P.D.; Yu, E.; Belliveau, N.; Yassa, M. Functional infrared imaging of the breast. IEEE Eng. Med. Biol. Mag. 2000, 19, 30–41. [Google Scholar] [CrossRef] [PubMed]
  18. Anbar, M. Clinical thermal imaging today. IEEE Eng. Med. Biol. Mag. 1998, 17, 25–33. [Google Scholar] [CrossRef]
  19. Gautherie, M. Thermopathology of breast cancer: Measurement and analysis of in vivo temperature and blood flow. Ann. New York Acad. Sci. 1980, 335, 383–415. [Google Scholar] [CrossRef] [PubMed]
  20. Recinella, A.N.; Gonzalez-Hernandez, J.L.; Kandlikar, S.G.; Dabydeen, D.; Medeiros, L.; Phatak, P. Clinical Infrared Imaging in the Prone Position for Breast Cancer Screening—Initial Screening and Digital Model Validation. J. Eng. Sci. Med Diagn. Ther. 2020, 3, 011005. [Google Scholar] [CrossRef]
  21. Folkman, J.; Merler, E.; Abernathy, C.; Williams, G. Isolation of a tumor factor responsible for angiogenesis. J. Exp. Med. 1971, 133, 275. [Google Scholar] [CrossRef] [PubMed] [Green Version]
  22. Algire, G.H.; Chalkley, H.W.; Legallais, F.Y.; Park, H.D. Vascular reactions to normal and malignant tissue in vivo. I vascular reactions of mice to wound and to normal and neoplastic transplants. J. Natl. Cancer Inst. 1945, 6, 7385. [Google Scholar] [CrossRef]
  23. Longatto Filho, A.; Lopes, J.M.; Schmitt, F.C. Angiogenesis and breast cancer. J. Oncol. 2010, 2010. [Google Scholar] [CrossRef]
  24. Kerbel, R.S. Tumor angiogenesis. N. Engl. J. Med. 2008, 358, 2039–2049. [Google Scholar] [CrossRef] [Green Version]
  25. Kalluri, R.; Zeisberg, M. Fibroblasts in cancer. Nat. Rev. Cancer 2006, 6, 392–401. [Google Scholar] [CrossRef] [PubMed]
  26. Bonapace, L.; Coissieux, M.M.; Wyckoff, J.; Mertz, K.D.; Varga, Z.; Junt, T.; Bentires-Alj, M. Cessation of CCL2 inhibition accelerates breast cancer metastasis by promoting angiogenesis. Nature 2014, 515, 130–133. [Google Scholar] [CrossRef] [PubMed]
  27. Relf, M.; LeJeune, S.; Scott, P.A.; Fox, S.; Smith, K.; Leek, R.; Harris, A.L. Expression of the angiogenic factors vascular endothelial cell growth factor, acidic and basic fibroblast growth factor, tumor growth factor β-1, platelet-derived endothelial cell growth factor, placenta growth factor, and pleiotrophin in human primary breast cancer and its relation to angiogenesis. Cancer Res. 1997, 57, 963–969. [Google Scholar]
  28. Kopeć, M.; Abramczyk, H. Angiogenesis-a crucial step in breast cancer growth, progression and dissemination by Raman imaging. Spectrochim. Acta Part A Mol. Biomol. Spectrosc. 2018, 198, 338–345. [Google Scholar] [CrossRef] [PubMed]
  29. Abramczyk, H.; Surmacki, J.; Kopeć, M.; Olejnik, A.K.; Kaufman-Szymczyk, A.; Fabianowska-Majewska, K. Epigenetic changes in cancer by Raman imaging, fluorescence imaging, AFM and scanning near-field optical microscopy (SNOM). Acetylation in normal and human cancer breast cells MCF10A, MCF7 and MDA-MB-231. Analyst 2016, 141, 5646–5658. [Google Scholar] [CrossRef] [PubMed]
  30. Silva, L.F.; Saade, D.C.M.; Sequeiros, G.O.; Silva, A.C.; Paiva, A.C.; Bravo, R.S.; Conci, A. A New Database for Breast Research with Infrared Image. J. Med Imaging Health Inform. 2014, 4, 92–100. [Google Scholar] [CrossRef]
  31. Figueiredo, A.A.A.; Fernandes, H.C.; Guimaraes, G. Experimental approach for breast cancer center estimation using infrared thermography. Infrared Phys. Technol. 2018, 95, 100–112. [Google Scholar] [CrossRef]
  32. Hildebrandt, C.; Raschner, C.; Ammer, K. An overview of recent application of medical infrared thermography in sports medicine in Austria. Sensors 2010, 10, 4700–4715. [Google Scholar] [CrossRef] [Green Version]
  33. Usamentiaga, R.; Mokhtari, Y.; Ibarra-Castanedo, C.; Klein, M.; Genest, M.; Maldague, X. Automated dynamic inspection using active infrared thermography. IEEE Trans. Ind. Inform. 2018, 14, 5648–5657. [Google Scholar] [CrossRef]
  34. Rajic, N. Principal component thermography for flaw contrast enhancement and flaw depth characterisation in composite structures. Compos. Struct. 2002, 58, 521–528. [Google Scholar] [CrossRef]
  35. Marinetti, S.; Finesso, L.; Marsilio, E. Matrix factorization methods: Application to thermal ndt/e. NDT E Int. 2006, 39, 611–616. [Google Scholar] [CrossRef]
  36. Cramer, K.E.; Winfree, W.P. Fixed eigenvector analysis of thermographic NDE data. In Thermosense: Thermal Infrared Applications XXXIII, M; Safai, J., Brown, R., Eds.; International Society for Optics and Photonics: Bellingham, WA, USA, 2011; Volume 8013, pp. 225–235. [Google Scholar] [CrossRef] [Green Version]
  37. Yousefi, B.; Sharifipour, H.M.; Eskandari, M.; IbarraCastanedo, C.; Laurendeau, D.; Watts, R.; Klein, M.; Maldague, X.P. Incremental low rank noise reduction for robust infrared tracking of body temperature during medical imaging. Electronics 2019, 8, 1301. [Google Scholar] [CrossRef] [Green Version]
  38. Ahmed, J.; Gao, B.; Woo, W.L. Wavelet-integrated alternating sparse dictionary matrix decomposition in thermal imaging cfrp defect detection. IEEE Trans. Ind. Inform. 2018, 15, 4033–4043. [Google Scholar] [CrossRef]
  39. Lee, D.D.; Seung, H.S. Learning the parts of objects by non-negative matrix factorization. Nature 1999, 401, 788–791. [Google Scholar] [CrossRef]
  40. Yousefi, B.; Sfarra, S.; Castanedo, C.I.; Maldague, X.P. Comparative analysis on thermal non-destructive testing imagery applying Candid Covariance-Free Incremental Principal Component Thermography (CCIPCT). Infrared Phys. Technol. 2017, 85, 163–169. [Google Scholar] [CrossRef]
  41. Yousefi, B.; Sfarra, S.; Sarasini, F.; Castanedo, C.I.; Maldague, X.P. Low-rank sparse principal component thermography (sparse-pct): Comparative assessment on detection of subsurface defects. Infrared Phys. Technol. 2019, 98, 278–284. [Google Scholar] [CrossRef]
  42. Wu, J.-Y.; Sfarra, S.; Yao, Y. Sparse principal component thermography for subsurface defect detection in composite products. IEEE Trans. Ind. Inform. 2018, 14, 5594–5600. [Google Scholar] [CrossRef]
  43. Ding, C.H.; Li, T.; Jordan, M.I. Convex and semi-nonnegative matrix factorizations. IEEE Trans. Pattern Anal. Mach. Intell. 2008, 32, 45–55. [Google Scholar] [CrossRef] [PubMed] [Green Version]
  44. Yousefi, B.; Sfarra, S.; Ibarra-Castanedo, C.; Avdelidis, N.P.; Maldague, X.P. Thermography data fusion and nonnegative matrix factorization for the evaluation of cultural heritage objects and buildings. J. Therm. Anal. Calorim. 2019, 136, 943–955. [Google Scholar] [CrossRef] [Green Version]
  45. Yousefi, B.; Ibarra-Castanedo, C.; Maldague, X.P. Infrared nondestructive testing via semi-nonnegative matrix factorization. In Proceedings of the 15th International Workshop on Advanced Infrared Technology and Applications (AITA 2019), Florence, Italy, 17–19 September 2019; p. 13. [Google Scholar]
  46. Yousefi, B.; Castanedo, I.C.; Maldague, P.X. Measuring heterogeneous thermal patterns in infrared-based diagnostic systems using sparse low-rank matrix approximation: Comparative study. IEEE Trans. Instrum. Meas. 2020, 70, 1–9. [Google Scholar] [CrossRef]
  47. Yousefi, B.; Castanedo, I.C.; Maldague, P.X. Low-rank Convex/Sparse Thermal Matrix Approximation for Infrared-based Diagnostic System. arXiv 2020, arXiv:2010.06784. [Google Scholar]
  48. Yousefi, B.; Akbari, H.; Maldague, X.P. Detecting Vasodilation as Potential Diagnostic Biomarker in Breast Cancer Using Deep Learning-Driven Thermomics. Biosensors 2020, 10, 164. [Google Scholar] [CrossRef]
  49. Chaves, E.; Gonçalves, C.B.; Albertini, M.K.; Lee, S.; Jeon, G.; Fernandes, H.C. Evaluation of transfer learning of pre-trained CNNs applied to breast cancer detection on infrared images. Appl. Opt. 2020, 59, E23–E28. [Google Scholar] [CrossRef]
  50. Gonçalves, C.B.; Leles, A.C.; Oliveira, L.E.; Guimaraes, G.; Cunha, J.R.; Fernandes, H. Machine learning and infrared thermography for breast cancer detection. In Proceedings of the 15th International Workshop on Advanced Infrared Technology and Applications (AITA 2019), Florence, Italy, 17–19 September 2019; p. 45. [Google Scholar]
  51. Ruiz, L.; Torres, M.; Gómez, A.; Díaz, S.; González, J.M.; Cavas, F. Detection and Classification of Aircraft Fixation Elements during Manufacturing Processes Using a Convolutional Neural Network. Appl. Sci. 2020, 10, 6856. [Google Scholar] [CrossRef]
  52. Donoho, D.L. For most large underdetermined systems of linear equations the minimal 1-norm solution is also the sparsest solution. Communications on Pure and Applied Mathematics. Courant Inst. Math. Sci. 2006, 59, 797–829. [Google Scholar]
  53. Kumar, V.; Gu, Y.; Basu, S.; Berglund, A.; Eschrich, S.A.; Schabath, M.B.; Gillies, R.J. Radiomics: The process and the challenges. Magn. Reson. Imaging 2012, 30, 1234–1248. [Google Scholar] [CrossRef] [Green Version]
  54. Gillies, R.J.; Kinahan, P.E.; Hricak, H. Radiomics: Images are more than pictures, they are data. Radiology 2016, 278, 563–577. [Google Scholar] [CrossRef] [PubMed] [Green Version]
  55. Van Griethuysen, J.J.; Fedorov, A.; Parmar, C.; Hosny, A.; Aucoin, N.; Narayan, V.; Aerts, H.J. Computational radiomics system to decode the radiographic phenotype. Cancer Res. 2017, 77, e104–e107. [Google Scholar] [CrossRef] [Green Version]
  56. He, K.; Zhang, X.; Ren, S.; Sun, J. Deep residual learning for image recognition. In Proceedings of the 2016 IEEE Conference on Computer Vision and Pattern Recognition (CVPR), Las Vegas, NV, USA, 27–30 June 2016; pp. 770–778. [Google Scholar]
  57. Krizhevsky, A.; Sutskever, I.; Hinton, G.E. Imagenet classification with deep convolutional neural networks. Adv. Neural Inf. Process. Syst. 2012, 25, 1097–1105. [Google Scholar] [CrossRef]
  58. Simonyan, K.; Zisserman, A. Very deep convolutional networks for large-scale image recognition. arXiv 2014, arXiv:1409.1556. [Google Scholar]
  59. Olshausen, B.A.; Field, D.J. Sparse coding with an overcomplete basis set: A strategy employed by V1? Vis. Res. 1997, 37, 3311–3325. [Google Scholar] [CrossRef] [Green Version]
  60. Arpit, D.; Zhou, Y.; Ngo, H.; Govindaraju, V. Why regularized auto-encoders learn sparse representation? In Proceedings of the 33rd International Conference on Machine Learning, New York, NY, USA, 19–24 June 2016; pp. 136–144. [Google Scholar]
  61. Google. Python 3 Google Compute engine backend, T4, and P100 GPU and 27.4 Gb RAM; Google: Mountain View, CA, USA, 2020. [Google Scholar]
  62. Abadi, M.; Barham, P.; Chen, J.; Chen, Z.; Davis, A.; Dean, J.; Zheng, X. Tensorflow: A system for large-scale machine learning. In Proceedings of the 12th Symposium on Operating Systems Design and Implementation, Savannah, GA, USA, 2–4 November 2016; pp. 265–283. [Google Scholar]
  63. Usamentiaga, R.; Ibarra-Castanedo, C.; Maldague, X. More than fifty shades of grey: Quantitative characterization of defects and interpretation using snr and cnr. J. Nondestruct. Eval. 2018, 37, 25. [Google Scholar] [CrossRef]
  64. Chiang, H.T.; Hsieh, Y.Y.; Fu, S.W.; Hung, K.H.; Tsao, Y.; Chien, S.Y. Noise reduction in ECG signals using fully convolutional denoising autoencoders. IEEE Access 2019, 7, 60806–60813. [Google Scholar] [CrossRef]
  65. Sakurada, M.; Yairi, T. Anomaly detection using autoencoders with nonlinear dimensionality reduction. In Proceedings of the MLSDA 2014 2nd Workshop on Machine Learning for Sensory Data Analysis, Gold Coast, QLD, Australia, 2 December 2014; pp. 4–11. [Google Scholar]
  66. Bhowick, D.; Gupta, D.K.; Maiti, S.; Shankar, U. Stacked autoencoders based machine learning for noise reduction and signal reconstruction in geophysical data. arXiv 2019, arXiv:1907.03278. [Google Scholar]
  67. FDA. Safety Communication, FDA Warns Thermography Should Not Be Used in Place of Mammography to Detect, Diagnose, or Screen for Breast Cancer. Available online: www.fda.gov (accessed on 25 February 2019).
  68. FDA. Consumer Update, Breast Cancer Screening: Thermogram No Substitute for Mammogram, U.S. Food and Drug Administration. Available online: www.fda.gov (accessed on 13 January 2021).
Figure 1. The schematic of angiogenesis (blood vessel formation) surrounding tumor cells in the breast area and vasodilation, which can be captured through short acquisition interval thermal imaging using dynamic thermography.
Applsci 11 03248 g001
Figure 2. Scheme of the presented thermographic system to be used prior to mammography for the initial diagnosis of breast cancer along with clinical breast examination (CBE).
Applsci 11 03248 g002
Figure 3. Workflow of the proposed sparse deep convolutional autoencoder (SPAER) model, having an embedded, low-rank, matrix-approximated image as the input. The model contains two parts: a convolutional deep autoencoder and a sparse autoencoder, which decrease the dimensionality of the input to 16 thermomics.
Applsci 11 03248 g003
Figure 4. Some examples of low-rank thermal matrix approximation for six cases (healthy, healthy with symptoms, and symptomatic) using different matrix factorization techniques. (i,ii) The regions of interest (ROIs) of low-rank approximate representations of healthy cases. (iii) A healthy case with pain and changes in the nipple of the patient. (iv) Case in which a patient experienced pain in the breast and the results of the biopsy indicated a noncancerous lesion. (v,vi) Cases representing cancer patients. Their columns show low-rank thermal matrix representation for the targeted ROI. Columns (ae) represent the matrix factorization techniques used to extract the low-rank representation IPCT, PCT, Sparse PCT, NMF, and Sparse NMF, respectively.
Applsci 11 03248 g004
Figure 5. The receiver operating characteristic (ROC) curves of different embedding approaches used with SPAER, both with and without adding demographics.
Applsci 11 03248 g005
Figure 6. The robustness of the model in the presence of Gaussian additive noise following our signal-to-noise ratio (SNR) definition for all the parts of the model.
Applsci 11 03248 g006
Table 1. Demographics and clinical information of our targeted cohort from the thermography database.
DMR: Database for Mastology Research.
AgeMedian (±IQR)60 (25,120)
RaceCaucasian77 (37%)
African57 (27.4%)
Pardo72 (34.6%)
Mulatto1 (0.5%)
Indigenous1 (0.5%)
Martial statusMarried104 (50%)
Single66 (31.7%)
Widow26 (12.5%)
Divorced12 (5.7%)
Diagnosis 1Healthy 2128 (61.5%)
Symptomatic80 (38.5%)
Sick 336 (17.3%)
Family historyDiabetes52 (25%)
Hypertensive5 (2.4%)
Leukemia1 (0.5%)
None150 (72.1%)
Hormone therapy (HT)Hormone replacement38 (18.3%)
None170 (81.7%)
1 The diagnostic gold standard for this dataset was mammography, which was verified with a breast biopsy. 2 The term healthy denotes noncancerous and asymptomatic participants. 3 Sick cases refer to breast cancer patients who were diagnosed by mammographic imaging and verified by breast biopsy.
Table 2. Results of diagnosis based on the classification of symptomatic versus asymptomatic patients with leave-one-out cross-validation.
Accuracy of Different Multivariate Models for Breast Cancer Diagnosis
MethodsClassification Accuracy 2 (%)Sensitivity (%)Specificity (%)PPV (%)NPV (%)T-Test 3
t-Statistic, Two-Tailed p-Value
IPCT-SPAER74.3 (69.4–80.1)8081.372.786.75, < 0.0005
PCT-SPAER74.3 (70.4–79.1)85.085.979.190.24.5, < 0.0005
NMF-SPAER77.7 (70.9–82.1)78.782.173.386.11.1, < 0.27
Sparse PCT-SPAER74.3 (69.9–79.6)86.380.573.490.44.9, < 0.0005
Sparse NMF-SPAER72.3 (68.5–76.2)81.391.485.588.67.8, < 0.0005
Clinical 172.8 (70.4–75.3)73.870.360.881.17.1, < 0.0005
IPCT-SPAER + Clinical76.2 (71.4–79.6)86.382.875.890.62.6, 0.009
PCT-SPAER + Clinical77.7 (73.3–82.1)83.784.477.0189.30.6, 0.5
NMF-SPAER + Clinical78.2 (74.3–82.5)8087.58087.5-
Sparse PCT-SPAER + Clinical77.7 (72.3–81.6)81.388.381.388.30.2, 0.8
SparseNMF-SPAER + Clinical74.8 (70.9–77.2)87.581.374.591.24.8, < 0.0005
1 The covariates used for the clinical and demographics were family history, age, and marital status. 2 Classification accuracy reported by median (±IQR) (Interquartile range-IQR). 3 t-test calculated for each method versus maximal accuracy.
Publisher’s Note: MDPI stays neutral with regard to jurisdictional claims in published maps and institutional affiliations.