
Vulnerability Assessment for Sea Level Rise Impacts on Coastal Systems of Gamasa Ras El Bar Area, Nile Delta, Egypt


1
Costal Research Institute (CoRI), National Water Research Center (NWRC), Behind 15, El-Pharaana Street, El SHalalaat, Alexandria 21514, Egypt
2
Department of Civil Engineering, College of Engineering, Taif University, P.O. Box 11099, Taif 21044, Saudi Arabia
*
Author to whom correspondence should be addressed.
Sustainability 2021, 13(7), 3624; https://doi.org/10.3390/su13073624
Submission received: 15 February 2021
/
Revised: 22 March 2021
/
Accepted: 22 March 2021
/
Published: 24 March 2021
(This article belongs to the Section Environmental Sustainability and Applications)
Abstract
:The objective of the current study was to assess the vulnerability of coastal systems to sea level rise (SLR) impacts in the Gamasa Ras El Bar area, which is one of the most vulnerable coastal areas in the Nile delta, Egypt. To achieve the study objective, a field campaign was carried out to investigate, measure and collect data. These data, as well as historical data, were analyzed to identify projected inundation areas, erosion and accretion rates, shoreline changes, wave climate and saltwater intrusion, as well as drainage infrastructure efficiency. The results of a 73-cm SLR, projected up to the end of current century in the study area, indicate the following. Inundation areas will be about 2.16% of the study area. Although the significant wave height increased by 3.1 cm per year from 1999 to 2010, the results are indicative and might be taken into consideration in future coastal management plans. The expected variation in groundwater heads due to sea level rise will lead to an increase in groundwater heads ranging from 0 to 0.5 m above the current level. The change expected in groundwater will lead to saltwater intrusion by 1 km landward. The analysis of our results showed that about 271 km2 (60%) of the area under study will be negatively affected by rising groundwater. This area is occupied by about 70% of the localities in the study area. The analysis of the projected groundwater level rise showed that it will increase the discharges of the sub-drainage system by about 10% of the current rates and less than 1.2% for the open system. It is concluded that the drainage system has the sub-capacity to host the expected increase in drainage discharges without any modifications of the cross-sectional area of most of the drains. In addition, the coastal groundwater aquifer was found to be the most vulnerable system in the study area.
1. Introduction
Climate change is one of the most important environmental phenomena on the Earth’s surface. It has a wide range of implications for the world population and economies, as well as natural and built environments. Climate change is expected to exacerbate already existing environmental, social and economic problems in many countries. Human systems that are sensitive to climatic changes include water resources and agriculture (especially as it relates to food security), coastal zones and marine systems (particularly fisheries), human settlements, energy, industry and health. The vulnerability of natural and human systems to climate change is a function of exposure to risk and the capacity to adapt, which vary with geographic location; time; and social, economic, and environmental conditions [1]. Furthermore, research conducted by the IPCC has highlighted the vulnerability of the lower deltas of large rivers, making climate change a priority in the management of such coastal zones [2]. Adding to this, the poorest members of society are those most vulnerable to climate impacts as they are less able to withstand climate shocks such as droughts and floods, and less able to adapt to changing conditions. In this way, coastal zone management in delta areas within developing countries faces major challenges.
Global projections of the impacts of accelerated sea level rise (SLR) have highlighted the Nile Delta coast as one of the most vulnerable areas in the world [3]. Similar to other deltas worldwide, the Nile delta is subject to dramatic changes of its shorelines: erosion or accretion, subsidence and SLR, exacerbated by human interferences such as the reduction in Nile discharges due to the construction of the Aswan High Dam.
As a part of the Nile Delta coastal zone, the study area exhibits a low-lying backshore, which lies between −1 and 3 m relative to the mean sea level, making it particularly vulnerable to climate change-induced sea level rise. This vulnerability has been heightened by the growing population (up to 1600 people per km2) and the natural subsidence of the Nile delta coast, which is sinking at an average rate of 2 mm per year. The implications of climate change for local communities in the study area are serious, as climate impacts will exacerbate other stresses affecting the quality of fertile soil, fresh water, habitats and land cover.
Sea level rise is a serious consequence of global climate change, which will intensify stress on coastal zones, particularly those with weak adaptive capacity and resilience due to ecosystem degradation, socio-economic under-development and governance challenges. Rising sea levels have important direct impacts on coastal and island regions, where a substantial percentage of the world’s population lives [4].
Sea levels are rising now and are expected to continue rising for centuries, even if greenhouse gas emissions are curbed and their atmospheric concentrations stabilized. Rising ocean heat content (and hence, ocean thermal expansion) is an important element of climate change and sea-level rise. The remaining contributions to sea-level rise come principally from the melting of land ice: glaciers and ice caps (which include the small glaciers and ice caps fringing the major ice sheets) and the major ice sheets of Antarctica and Greenland, with additional contributions from changes in the storage of water on (or in) land [5].
Several worldwide investigators have developed chronologies of eustatic sea-level variations for the last 50,000 years [6,7]. The results generally agree that about 15,000 to 20,000 years ago, the sea level was approximately 100 m lower than at present. There was a rapid rise in sea level, averaging about 8 mm/year, until approximately 7000 years ago when it slowed to 1 to 2 mm/yr.
The eustatic rise has been estimated to be on the order of 1 to 2 mm/year, but other predictions suggest that it could increase to 2.5 mm/year during the 20th century and this rate is expected to accelerate during the 21st century due to human-induced global warming [8]. The UN Intergovernmental Panel on Climate Change (IPCC) estimated that the global rise from 1990 to 2100 would be between 23 and 96 cm, with a mid-estimate of 55 cm [9]. It is very likely that the mean rate of global average sea level rise was 1.7 (1.5 to 1.9) mm/yr between 1901 and 2010, 2.0 (1.7 to 2.3) mm/yr between 1971 and 2010 and 3.2 (2.8 to 3.6) mm/yr between 1993 and 2010. Tide-gauge and satellite altimeter data are consistent regarding the higher rate of the latter period. It is likely that similarly high rates occurred between 1920 and 1950.
Such rates agree with results obtained by [10]. They estimated the rise in global average sea level from satellite altimeter data for 1993–2009 and from coastal and island sea-level measurements from 1880 to 2009. For 1993–2009, they found that the estimated rate of rise is 3.2 ± 0.4 mm/year from the satellite data and 2.8 ± 0.8 mm/year from the in situ data. The global average sea-level rise from 1880 to 2009 is about 210 mm. The linear trend from 1900 to 2009 is 1.7 ± 0.2 mm/year and since 1961, it is 1.9 ± 0.4 mm/year. They concluded that there has been considerable variability in the rate of rise during the twentieth century but there has been a statistically significant acceleration since 1880 and 1900 of 0.009 ± 0.003 mm year−2 and 0.009 ± 0.004 mm year−2, respectively. Since the start of altimeter recording in 1993, they demonstrated that the global average sea level rose at a rate near the upper end of the sea level projections of the Intergovernmental Panel on Climate Change’s Third and Fourth Assessment Reports. However, the reconstruction indicates there was little net change in sea level from 1990 to 1993, most likely as a result of the volcanic eruption of Mount Pinatubo in 1991. Another study used data from 1900 to 2008 in its simulation to reconstruct the global mean sea level (GMSL, [11]. The GMSL from the simulation over that period showed a trend of 1.1 mm/yr, with significant inter-annual and decadal variability. Other efforts demonstrated the same trend in the rate of sea level rise [12]. They found that most of the modeled estimates agree with the observation ensemble, with a rate of about 1.7 mm/yr (174–71 mm for 1900–2005). In addition, of the four time series they used to construct the observation ensemble, three were within the modeled range (1900–2005 contribution, 146–51 mm). Efforts were made in Egypt to define local sea level rise trends from tide gauge measurements in three locations across Nile delta coastal zones. Long-term tide gauge measurements were collected and analyzed to estimate the sea level increase rate. Tide gauge data revealed an increase in the relative sea-to-land level of about 1.6 mm/year at Alexandria, 1.0 mm/year at Al-Burullus and 2.3 mm/year at Port Said [13].
The Nile delta plays a crucial role in the Egyptian economy, as it is the source of about 40%, 50% and 60% of its agriculture production, fish catch and industrial production, respectively [14]. Moreover, it hosts several human settlements, accommodating about 39.9 million inhabitants, representing about 42% of the total population of Egypt [15].
According to [16,17], several studies have concluded that Egypt is highly vulnerable to sea level rise (SLR). In one study, which considered the impact of a 1.0 m SLR for 84 developing countries, Egypt was ranked the 2nd most seriously impacted country with respect to the coastal population affected and the 5th highest ranked, in terms of the proportion of urban areas affected.
The Nile delta coastal area is low-lying land with a general elevation ranging between 0 and 1 m above mean sea level and considerable parts below sea level. Such a topography means that low-lying coastal areas would be highly sensitive to any trivial rise in sea level. Such sensitivity is copounded by the annual subsidence of the northern parts of the Nile delta [18,19]. In addition, it is perceived as vulnerable to the impacts of climate change, not only because of the impact of sea level rise, but also because of the impacts of saltwater intrusion on water resources, agricultural resources, tourism and human settlement [20]. Groundwater aquifers and lowland areas along the Mediterranean coast of Egypt are exposed to severe deterioration and salinization from saltwater intrusion due to SLR. This will lead to the deterioration of crop quality and productivity. In turn, increased health problems and the loss of tourism are expected to occur. This phenomenon is considered to be of utmost importance and warrants full investigation.
Many studies [21,22,23,24,25,26,27,28,29,30,31,32,33,34] concluded that the Nile delta is physically vulnerable to SLR inundation, with significant yet unassessed socioeconomic impacts.
As the coastal zones are crucial for Egypt’s economy, the main objective of this work was to investigate and study the vulnerability to SLR of the Gamasa Ras El Bar coastal systems, Nile Delta, Egypt. The sea level rise rate in Port Said was used in the current study to investigate the vulnerability to its effects on the coastal system of the study area.
The systems investigated were land inundation, wave climate, erosion/accretion rates, saltwater intrusion and drainage system efficiency. Our aim is to raise community awareness regarding the problems of SLR and to attract the attention of the authorities towards the urgency of SLR. To achieve the study objectives, many methods were adopted. Methods varied from one system to another. Many field investigations and measurements were carried out. In addition, aerial photos and GIS techniques were used. Furthermore, historical tide gauge and sediment transport data were collected and analyzed to study the changes expected in inundation processes and erosion/accretion rates. Wave climate and characteristics data from two different time periods were collected and analyzed to define changes that took place due to climate change and SLR. In addition, groundwater status was investigated and modeled under the effect of SLR. The drainage system was investigated through field missions and measurements in order to assess current and future vulnerability under the threat of SLR impacts.
2. Study Area
The study area (Gamassa Ras El-Bar) is located mainly in the Damietta governorate and partly in the Dakahlia governorate, with a total area of about 450 km2. The inland boundary of the study area extends from the shoreline to a contour line of 3 m above mean sea level. It lies between longitudes 31°30′ and 32° E and latitudes 31°15′ and 31°33′ N. The total agricultural area served in the study area was about 55,000 feddans (231 km2). These agricultural lands may be described as one of the most productive lands in the Nile delta. The study area is described as a delta-shaped semi-island with a base on the Mediterranean Sea that is 30 km long in the north, and the Damietta branch of River Nile is located to the east. The topography of the land is very slightly inclined from south to north.
Previous studies have considered the study area as a vulnerable area to the impacts of SLR and climate change. In their assessment of projected inundation areas of Nile delta coastal zones due to SLR up to the end of current century, the authors in [35] defined the study area as one of the most vulnerable coastal zones according to IPCC scenarios.
The broad criteria for the study area selection were based on its physical and socio-economic vulnerabilities to climate change-induced SLR, as shown in Figure 1. It encompasses three main urban centers, namely, Gamasa, Ras El Barr and New Damietta. The total urban population of the study area is about 600,000 inhabitants, equivalent to approximately 15,500 households. The main sources of income are related to tourism, fishing and agriculture, as well as employment from local industries and Damietta harbor.
The study area contains scattered rural settlements, inhabited largely by small-scale farmers and fishermen, as well as unskilled laborers that rely on commuting to nearby settlements for work. Agriculture, aquaculture and marine fishing activities are highly vulnerable to changing ecosystem conditions induced by SLR and climate change. Increases in water salinity and temperature, coastal erosion, flooding and land submersion, among other factors, negatively impact subsistence and small-scale producers. Consequently, communities dependent on these traditional activities will suffer from decreases in land productivity and fishing yields due to SLR. Women are particularly susceptible due to limited skills-sets and income to sustain their households. It is expected that stakeholder vulnerability in the study area is variable, especially geographically, as communities closer to the coast are more exposed to risks.
3. Materials and Methods
The vulnerability of Nile delta coastal zones to sea level rise has been assessed in many previous studies as in [36]. This was evaluated through B1 and A1F1 IPCC scenarios [37] in order to identify the areas vulnerable to SLR in 2025, 2050, 2075 and 2100. Different materials and methods have been used to investigate and assess the vulnerability of sea level rise impacts on the coastal systems of the study area.
In order to estimate the impacts of SLR on the study area, projections for future temperature increases as well as SLR increases were calculated for 25-year increments from 2025 through 2100 as shown in Table 1. To estimate local sea level rise, the average sea level in the Port Said area (2.3 mm/year), estimated previously, was deployed in the study. This value was extrapolated according to the non-linear increase in temperature for each scenario to estimate the sea level rise, as presented in Table 1. In addition, it was assumed that the land subsidence rate would remain constant at 3 mm yr−1 [38]. This value was considered in order to obtain the projected SLR (Table 2). According to the temperature increase projected in the A1F1 IPCC scenario, the average SLR was estimated to reach as much as 0.73 m in the study area by 2100 (Table 2).
To depict the vulnerability of the study area to SLR, local topography was investigated. The local topography of the study area was represented in detail using a digital elevation model (DEM) of the land surface, generated from contour lines using ArcGIS 9.3. In other words, the elevation values of the contour lines were used to produce a DEM with a pixel size of 50 m (raster surface), reflecting detailed and synoptic coverage of land elevation in all parts of the study area and its surroundings (Figure 2).
3.1. Inundation
The vulnerability of coastal areas to inundation was jointly determined based on three main factors: projected SLR and land subsidence patterns, as well as local topography. Therefore, to identify those parts within the study area that are vulnerable to inundation, 59 hydrographic profiles perpendicular to the shoreline were surveyed to define detailed elevations of the study area. The accuracy implemented was of the order of 1 cm. The surveyed profiles were deployed to develop the DEM (Figure 2). Pixels with elevations less than or equal to 0.73 m in the coastal strip were defined as areas subjected to inundation by the end of the current century.
3.2. Wave Climate
Wave measurements were carried out by a wave recording system (S4DW) in the Damietta area in two different periods. Wave data collected from the period of 2009–2010 were statistically analyzed and compared to wave data for same location measured from 1997 to 1999. The available wave data for both periods cover the period from November to April during the winter season, which is the most effective season for wave measurements during the year. Accordingly, wave characteristics were defined, and significant differences were estimated. The directional distribution for the analyzed wave samples is illustrated in Figure 3a,b.
3.3. Erosion/Accretion
Erosion/accretion rates and sectors were studied by estimating the rate of shoreline change and the volume of erosion and accretion for the study area in previous studies [39].
A well-known method used to formulate the relation between shoreline retreat and sea level rise was developed by Brunn [40]. He assumed that after sea level rise, the beach profile will simultaneously undergo an upward and a landward shift, though retaining its original shape. Thus, the final beach profile displacement can be considered the result of two rigid translations—vertical and horizontal, the latter being the shoreline retreat (R). The basic formula for Brunn’s rule is:
where (R) is the shoreline retreat (m), (L) is the distance from the shoreline to closure depth (m), (S) is the sea level rise (m), (B) is the berm elevation (m) and (di) is the depth of closure (m).
Brunn’s rule was implemented in a previous study to estimate the shoreline retreat due to expected sea level rise at the Damietta promontory (Ras El Bar) and the Rosetta promontory, Nile delta coastal zones, Egypt [41]. Shoreline retreat values (R), calculated by Brunn’s Rule, for 44.17 and 37.93 cm rises of sea level up to the year 2100, and were 2.7 and 2.5 m/year for the Rosetta and Damietta promontories, respectively. These values explained 4.3% and 9.6% of the long-term shoreline retreat, estimated from field measurements in a previous study for the same locations [42], (58 m/yr east of the Rosetta promontory and 28 m/yr east of the Damietta promontory). The study concluded that the remaining 95.7% and 90.4% of the shoreline retreat was caused by a combination of sediment input deficiency and prevailing coastal processes. Based on these results, the current study depended on data measured in the study area twice a year from 2006 through to 2010. This time period was chosen as the study area experienced many activities involving the construction of engineering protection systems to protect the study area from erosion before the year 2006.
In order to define shoreline changes, field investigations for marine surveying were carried out twice each year in April (after the winter season) and in October (before the winter season), as the shoreline changes are dominated by wave storms taking place in the winter season. Accretion/erosion sectors in the area studied were defined by comparing shoreline positions. Investigations were carried out for 59 fixed hydrographic profiles in the study area. The data are treated and statistically analyzed to define retreat trends associated with the sea level rise for a certain time period. This process is carried out using Digital Shoreline Analysis System (DSAS) software. The DSAS is an add-on to Esri ArcGIS desktop, which enables the user to calculate the rate of change statistics based on multiple historical shoreline positions. It provides an automated method for establishing measurement locations, performs rate calculations, provides the statistical data necessary to assess the robustness of the rates, and includes a beta model of shoreline forecasting with the option to generate 10- and/or 20-year shoreline horizons and uncertainty bands.
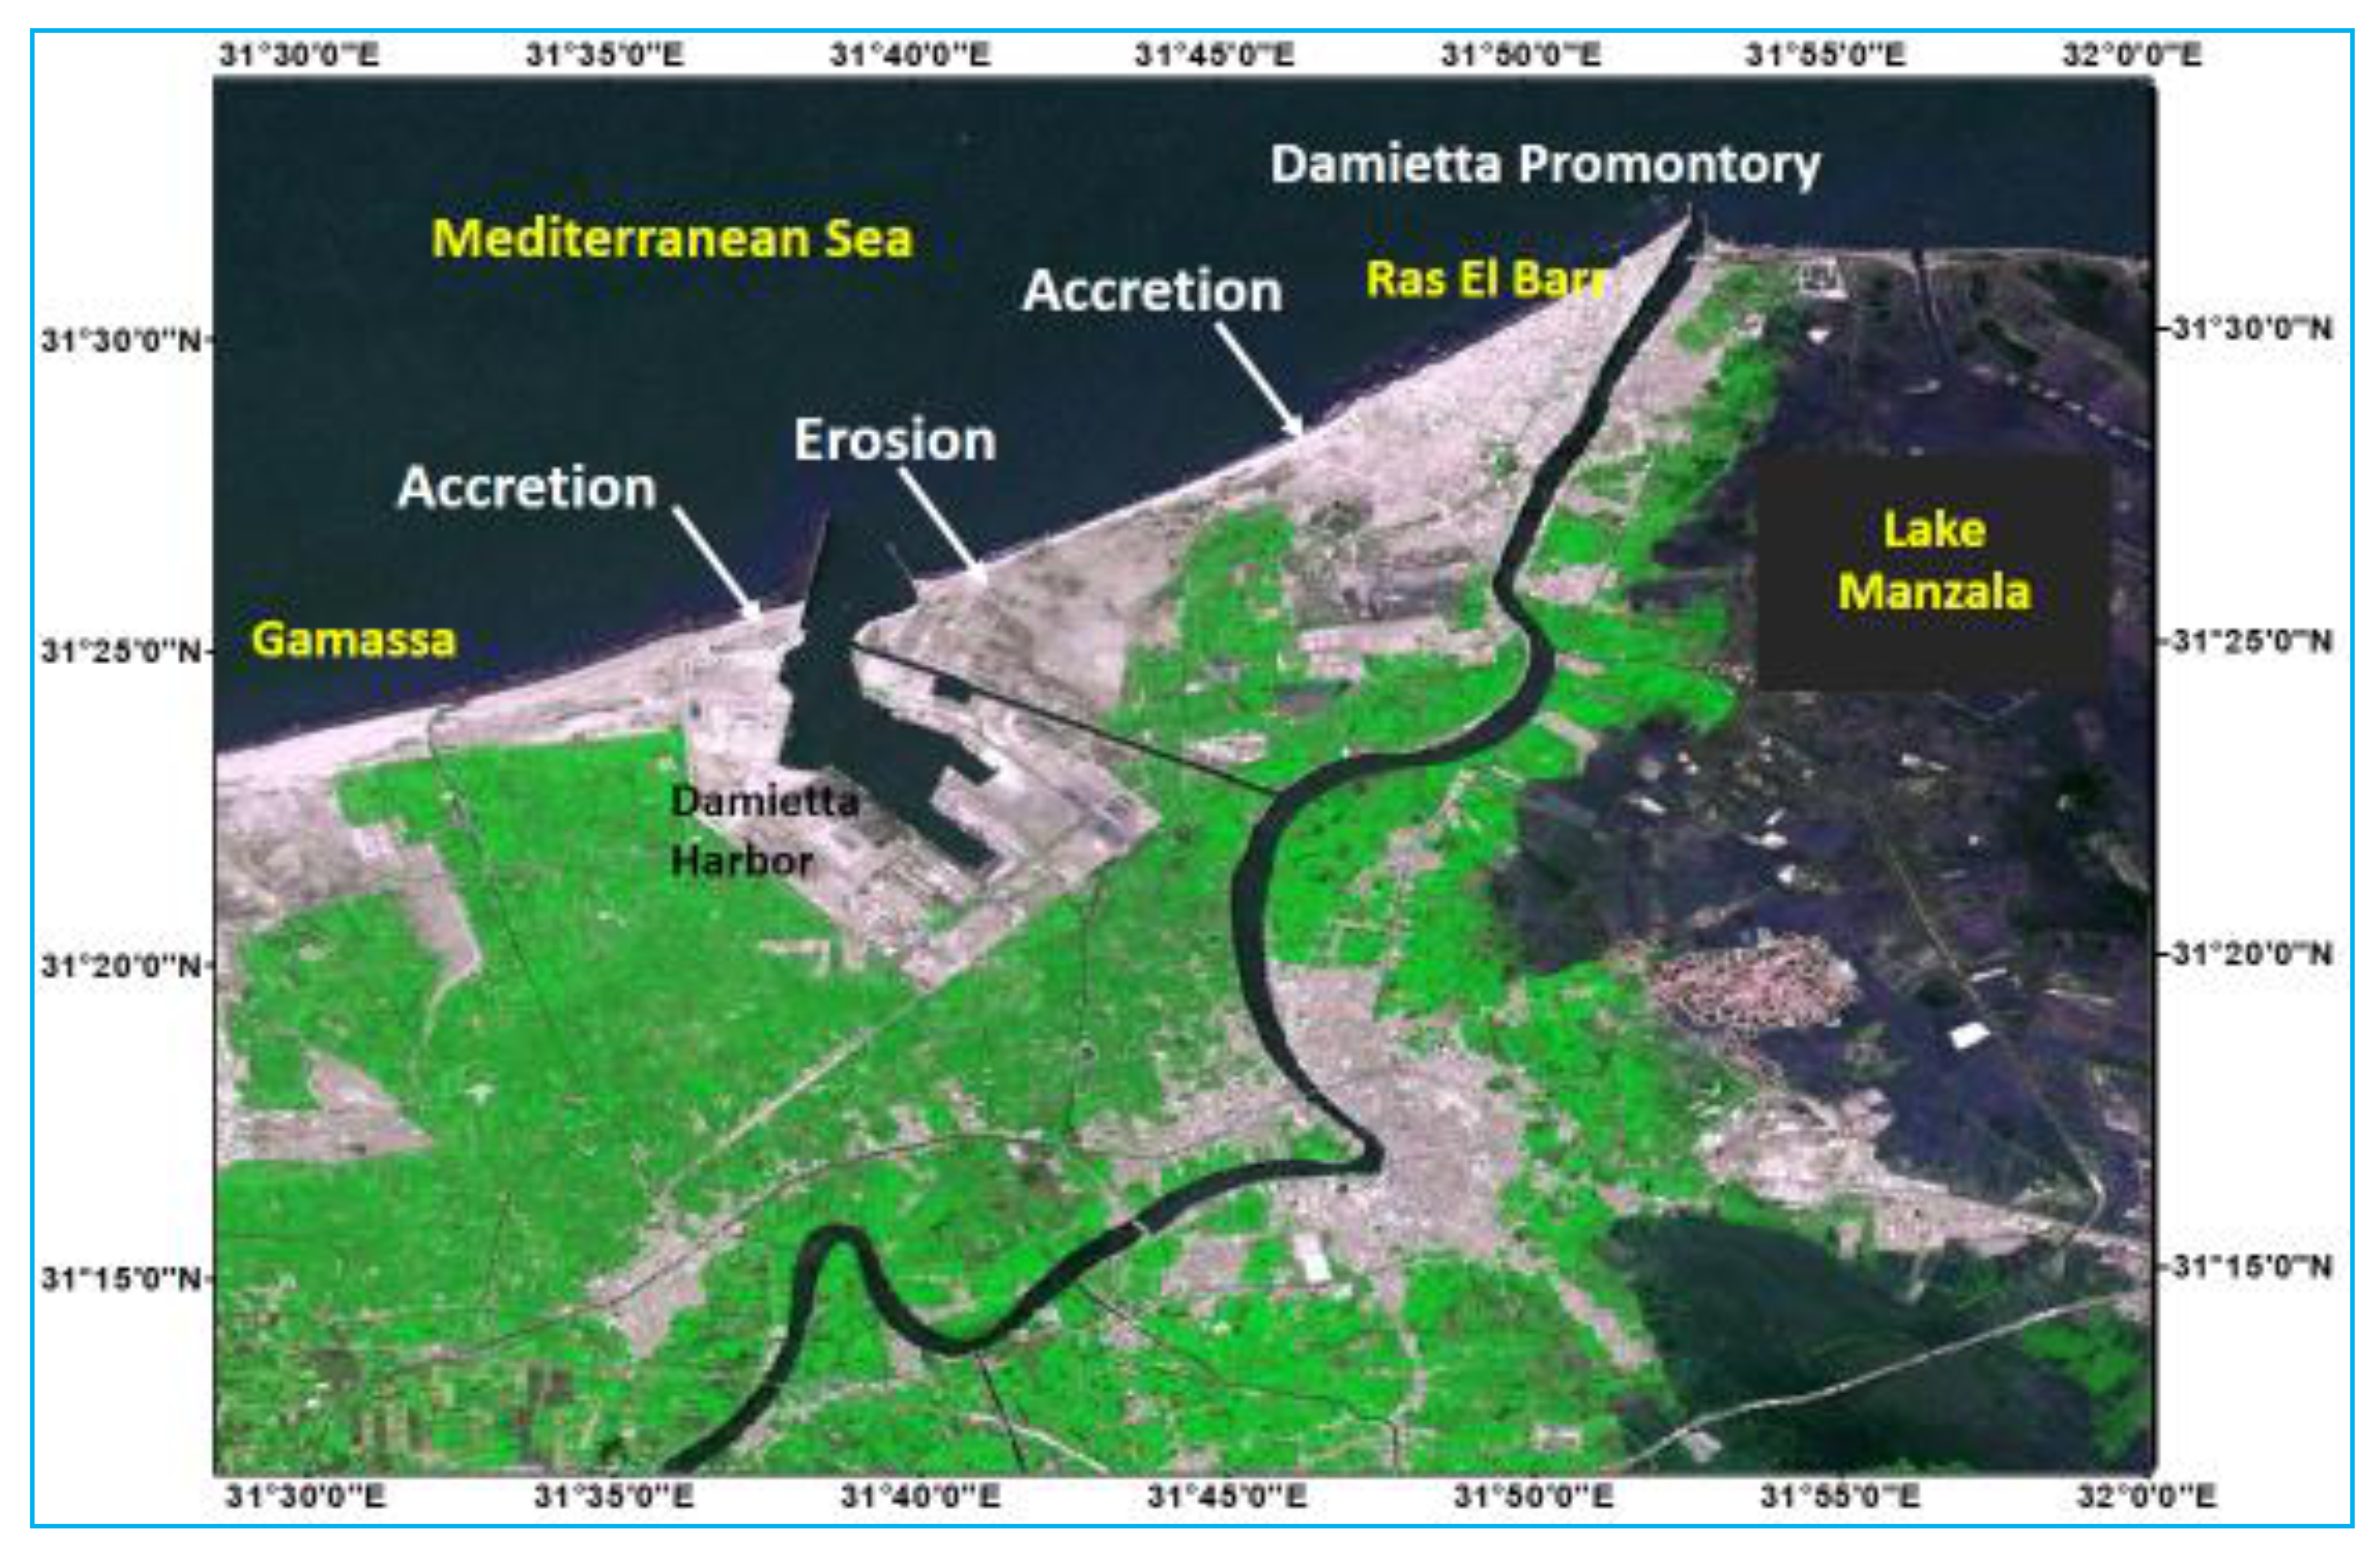
The estimation was based on two annual field measurements taken through fixed profiles within the study area. This process was implemented by the Coastal Research Institute (CoRI), National Water Research Center (NWRC), Egypt. Data measures were statically analyzed. Erosion and accretion volumes were determined by comparing beach profiles surveyed from 2006 until 2010. Volume changes (in m3) based on erosion and accretion within the different profile depth zones (vertical depth differences) from 0 to −2, <−2 to −4, <−4 to −6, and from 0 to −6 m was calculated. Net volume changes during this period represented the difference between accretion and erosion results for the different profile depth zones. The rate of erosion/accretion was related to the average temperature and sea level rise during the study period (2006–2010). This rate was projected for the expected sea level rise (73 cm) to define erosion/accretion expected by the end of the current century. The estimation of erosion/accretion was carried out for seven sectors that represented the coastal length of the study area. In addition, two satellite images (Landsat, TM and ETM sensors) acquired in 1984 and 2000 were used to identify zones subjected to erosion or accretion processes along the coastal zone of the study area and to indicate shoreline changes that took place in that period (Figure 4).
3.4. Saltwater Intrusion and Coastal Groundwater Aquifer
For saltwater intrusion and coastal groundwater aquifers, the study developed predictions for the impacts of different SLR scenarios using the solute transport modeling technique. This technique is run using Visual MODFLOW 4.2 software, the SEAWAT engine for three-dimensional models of groundwater flow and contaminant transport simulations, with special reference to salinity concentrations.
The flow boundary conditions assigned to the model were as follows: a specified head of zero meters at the northern boundary of the model, representing the Mediterranean Sea; and a specified head of 2 m at the southern boundary of the model, representing the piezometric head at that area. The Damietta branch of the River Nile was assigned to the model using the river package and all the geometric details and water levels for the different reaches of the branch, as well as the conductance values. The Al Manzala Lake (to the east of the study area) was also assigned as a water body. The concentration boundary conditions were assigned to the model as follows: a constant concentration of 35,000 ppm for the sea water; the constant concentration value of the water in Al Manzala Lake; and the concentration value of the water in Damietta Branch. In addition, the hydraulic conductivities of different soil types were assigned to the model. The hydraulic values ranged from 50 to 0.01 m/d. The dispersity value was also assigned to the model, with a value equal to one-tenth of the dimensions of the studied area.
The model calibration process was carried out using field investigations and collected data with alterations around the acceptable range for the soil hydraulic conductivity, recharge and dispersity values. The model was calibrated, and results showed 96% agreement with the measured data. Accordingly, the calibrated model was used to predict the groundwater and salinity levels within the study area in response to potential SLR scenarios, as well as the movement of freshwater/saline water inland [43].
In addition, a field investigation campaign was implemented during the study period, in which nine observation wells with different depths (40 to 600 m) were inventoried. These wells were related to the Research Institute for Ground Water (RIGW), NWRC, Egypt. The inventory program measured water depth and water salinity. In addition, land surveying was implemented to define the levels of the well top casing, as well as the water table level. Land and groundwater levels in 2010 are illustrated in Figure 5.
Field investigations revealed that the depth to groundwater varied from 0.2 to 19 m. Additionally, groundwater salinity in the study area vary between 10,000 to 61,000 ppm in deep wells that had depths from 200 to 600 m. On the other hand, the salinity in shallow wells with depths from 40 to 70 m amounted to 7500 to 9000 ppm, respectively. Salinity data were implemented in the groundwater modeling.
3.5. Drainage System Capacity
The vulnerability of the drainage network system to SLR was determined by the ability of its infrastructure to withstand changes and remain functional. Field investigations and measurements of the drainage network and infrastructure, as well as drain cross sections in the study area, were carried out (Figure 6).
In addition, additional seepage quantities resulted from rising groundwater level projected in 2100 and the effects of this on the design capacity of the current drainage system network were assessed. The main components investigated of the drainage systems’ infrastructure included the main and tributary drains’ waterways and banks, pump stations, water treatment plants (WTPs) and wastewater treatment plants (WWTPs).
According to our field survey of the drainage network, our investigations defined the drainage discharge (Q), (m3/s), served area (S.A.), water drained (W.D.) (m3/fed./d), water slope (W. Sl.) and bed slope (B. Sl.). Figure 7 presents the design cross-section of the Gamasa Drain as an example of all the drains investigated in the study area.
4. Results and Analysis
4.1. Projected Inundation
A direct impact of SLR is the inundation and loss of low-lying lands, including existing agricultural activities and infrastructure. This leads to the loss of assets, job opportunities and income opportunities, and can consequently affect the local food supply.
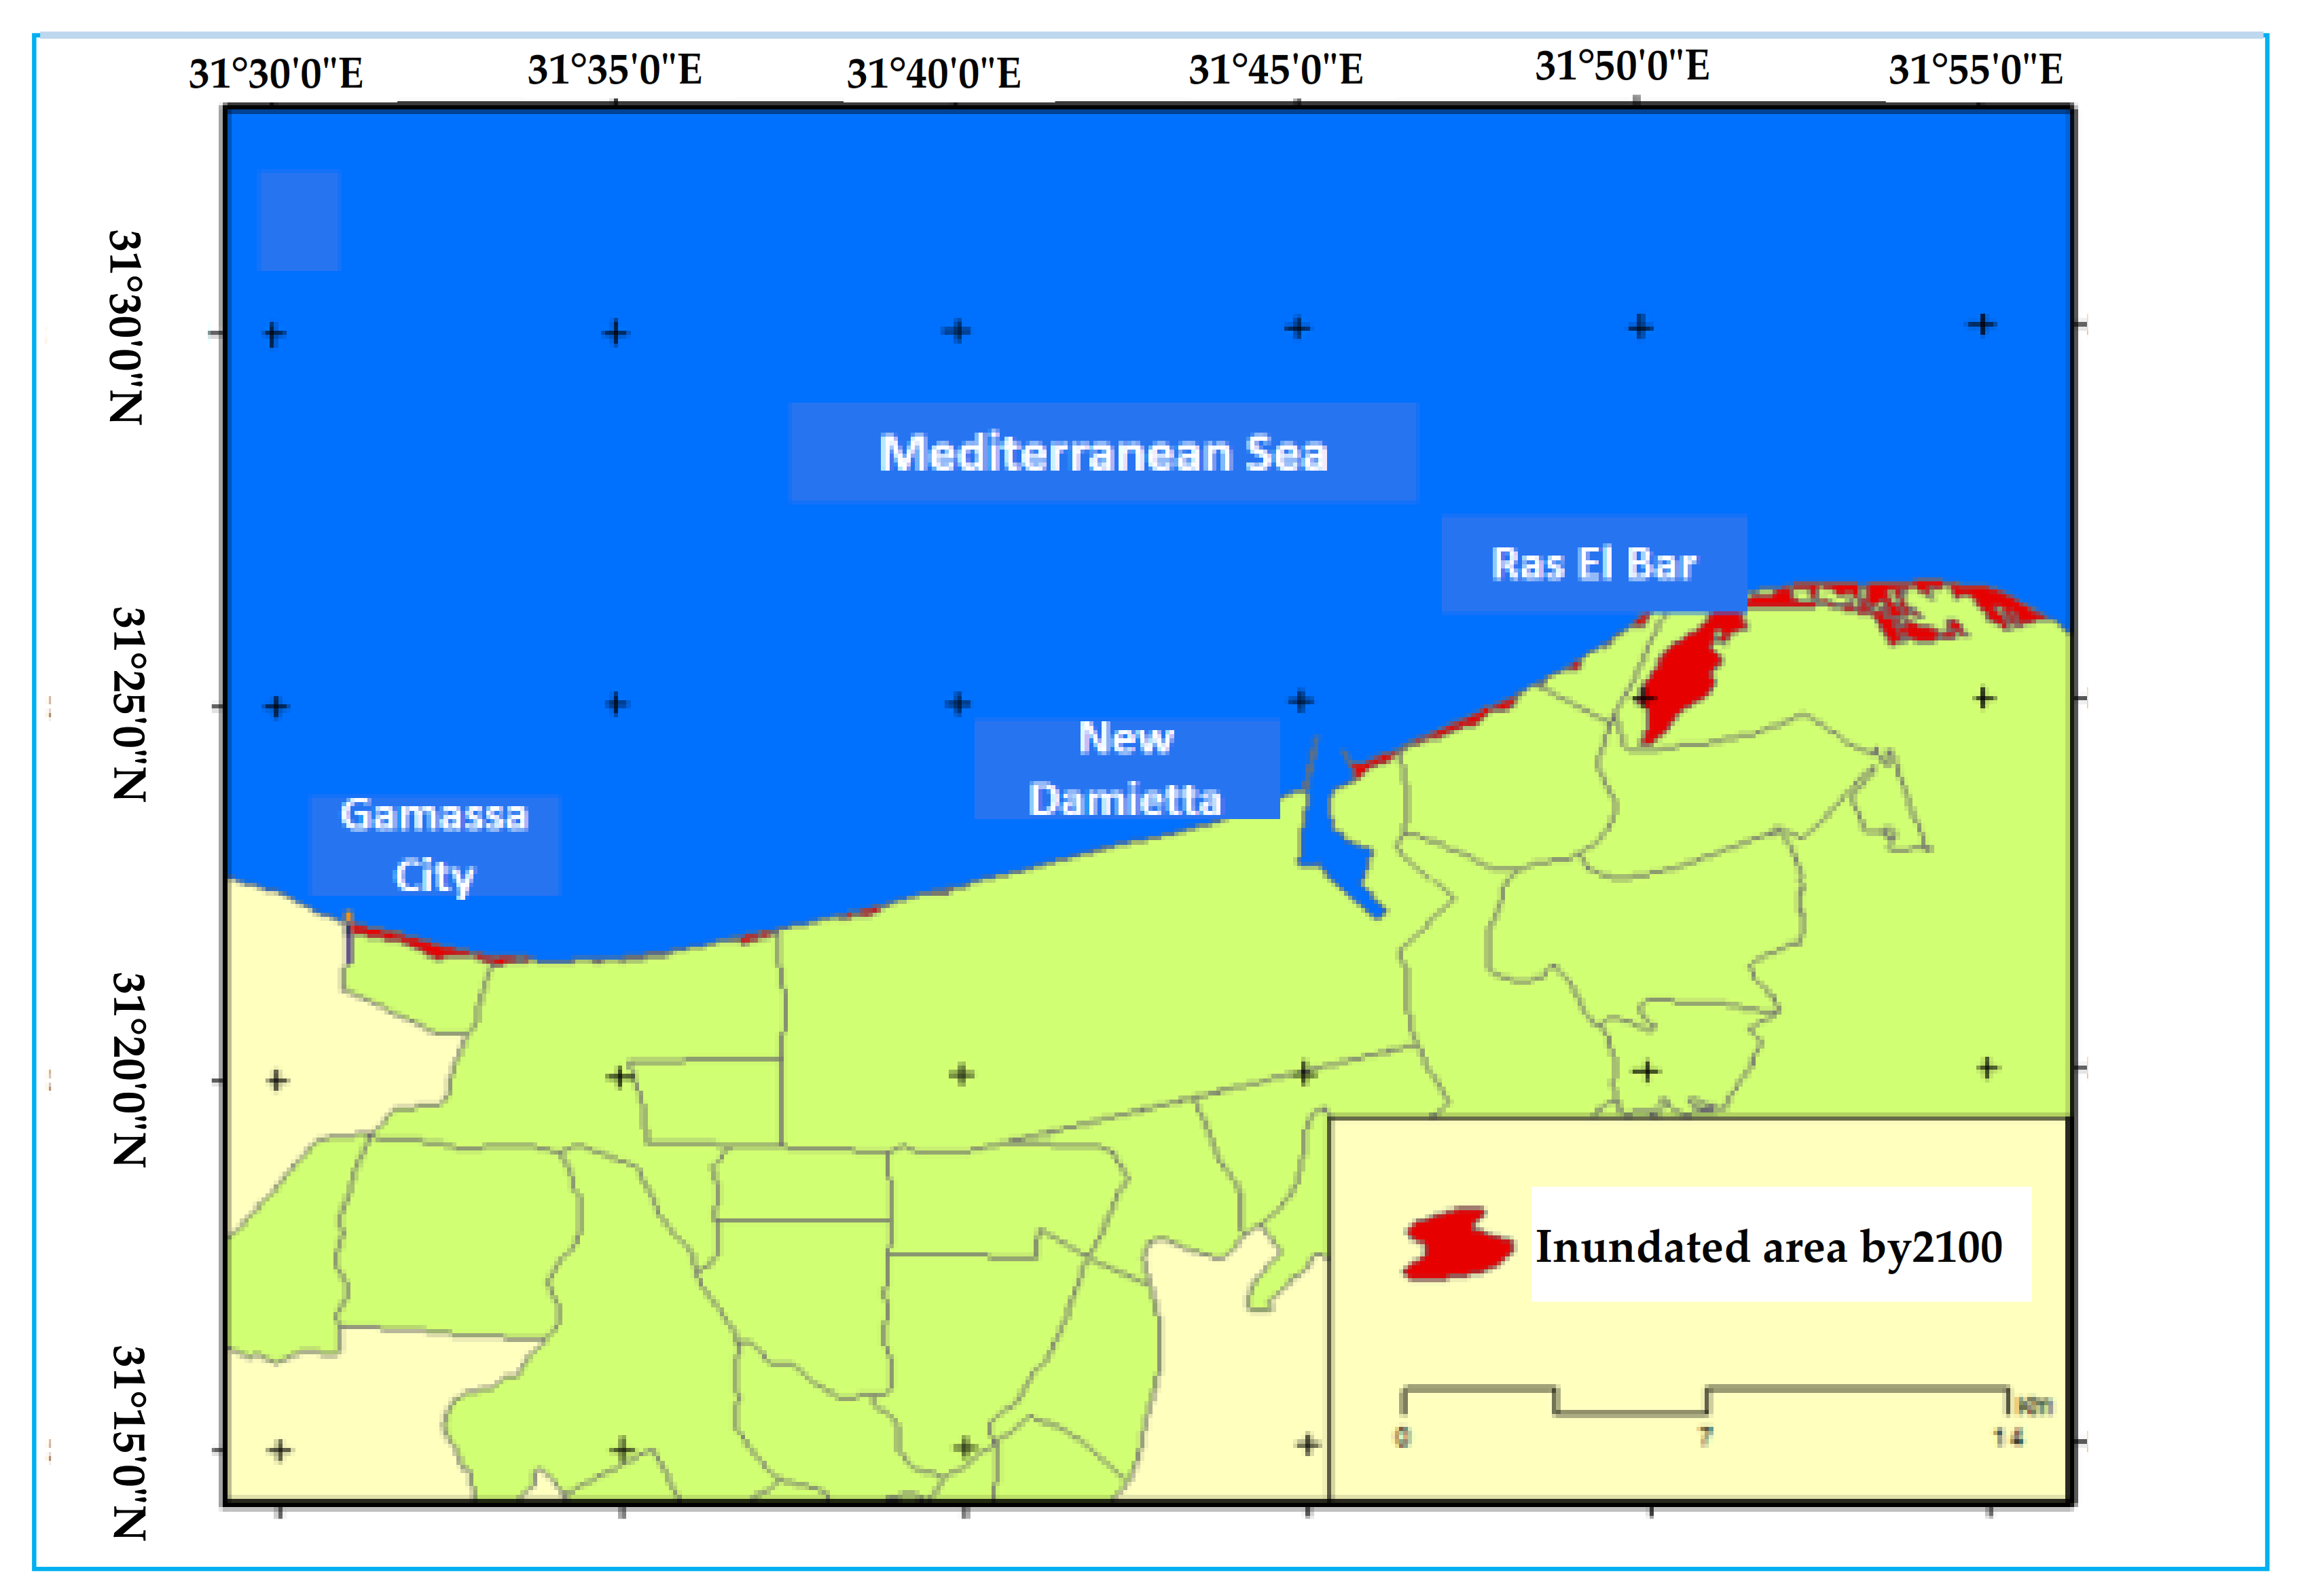
Our inundation assessment indicated that there are very limited areas that will be inundated by the year 2100. These areas have elevations less than or equal to 0.73 m and consequently, are expected to be vulnerable to SLR-induced inundation (Figure 8).
The study results indicated that not all locations in the study area are equally vulnerable to SLR-induced inundation. For example, some parts in New Damietta city, further inland, are actually not vulnerable to inundation, despite having an elevation less than or equal to 0.73 m, as they are surrounded by elevated land. This means that areas threatened by inundation should be characterized as having an elevation less than or equal to 0.73 m, as well as being adjacent to the shoreline.
As the study area had an area of 450 km2, the area threatened by inundation represented 9.70 km2, equivalent to 2.16% of the total study area. The concentration of inundated areas was located in Izbet El Borg locality, in the eastern part of the study area, which held about 76.33% of the total inundated areas. Meanwhile, the results indicate that the Gamasa locality will be the most affected by inundation; even though the inundated area is limited at 0.75 km2, this represents a considerable part of the total area of the locality (11.74%).
It should be noted that some areas vulnerable to inundation, such as parts of Izbet El Borg and Ras El Barr, are already protected by sea walls and other constructions which would mitigate inundation risks. Generally, it was demonstrated that inundation is expected to have limited impacts on the various localities in the study area.
4.2. Wave Climate
Although the duration of the data is not long enough, results are indicative and might be taken into consideration in the study of future coastal processes and coastal management plans until more data are available to verify the impacts of climate change on wave climate. Our results indicate many changes in wave characteristics (Table 3).
The significant wave height, average wave height and storm duration increased but the average storm height decreased. The results show an increase in significant wave height from 0.94 to 1.31 m in 1998 and 2010, respectively, with an annual increase of about 3.1 cm. This rate is in agreement with results obtained in a previous study on the Nile delta, which concluded that there was an increasing trend in the mean significant wave height during the period from 1985 to 2010 by rates ranging from 2.6 to 2.9 cm/year, [44].
The directional distribution of the statistically analyzed wave samples shows that main wave components existed within two quadrants—the N–W and N–E. The waves dominated from the N–W sector (71% during 1997–1999 and 70% during 2009–2010) and the remaining part came from the N–E quadrant. The N–W waves are of greater importance for morphological processes because of their long duration, particularly in winter, and they are responsible for generating the net long-shore sediment transport scheme along the Nile delta. It is clear that the directional distributions of waves for the two quadrants were almost same during the two periods. Conversely, inside each quadrant, there was a marked change, as shown in Table 4, in which a significant deviation of the predominant waves to the west was noticed. The obtained results agree with a previous study that revealed that there was a slight change (of about 10 degrees) in the predominant wave direction from 1985 to 2003 near the Rosetta coast, Nile Delta, Egypt, [45].
Analysis of the wave data in 1998 and 2010 may indicate the impact of climate change on wave climate. This impact, if proved through long-term data, has more significant implications on the coastal processes and the function of shore protection systems. A change in wave climate (height and predominant direction) would change the pattern and rate of erosion and accretion, as well as the rate of sediment transport. Changing the rate of the sediment transport pattern would reshape areas of accretion erosion along the coast of the study area, as well as the entire Nile Delta coast. Changes in wave climate would influence the inundation areas, as well as the scouring and sedimentation in the localities of protection structures constructed under certain wave climates. Analysis of wave data in 1998 and 2010 supports the results of a previous study (for 1985 and 2003) [45] and may provide evidence for climate change impacts on wave climate.
4.3. Erosion and Accretion
The results indicate that a large area between Gamasa and Ras El Bar would experience a shoreline retreat between 40 and 160 m by 2100, with an average rate of about 1.2 m per year. Among the seven examined shoreline sectors, numbers 1, 2 and 5 would be under serious risk (Figure 9). Sector 1 is located east of the Gamasa drain, extending 12 km eastward, and sector 2 is the extension of sector 1 located west of New Damietta City. Sector 5, meanwhile, is located at the down-drift side of Damietta harbor, 5 km west of Ras El Bar. These sectors have higher rates of coastal erosion; therefore, the predicted SLR will increase the degree of the risk of inundation for these sectors.
The remaining sectors of the area that extends from Gamasa drain to the western breakwater of New Damietta Harbor (sectors 3 and 4) are almost stable areas, with some accretion and erosion pockets. Sediment was trapped west of the two jetties constructed in 1980 to protect the entrance of new Damietta harbor: 1500 m long (west jetty) and 600 m long (east jetty), [46]. The accretion rate west of new Damietta harbor was 22 m3/m per year between 2006 and 2010. The western zone, which extends westwards from the Damietta promontory to east Damietta harbor, experienced erosion of −15 m3/m per year from 2006 to 2010.
4.4. Saltwater Intrusion and Coastal Groundwater Aquifer
Results of groundwater modeling revealed that the prediction of lateral and upward movement of the saltwater/freshwater interface—resulting from saltwater intrusion into coastal aquifers due to an increase of 73 cm in the sea level by the year 2100—would cause the intrusion of saltwater by about 1 km into the coastal aquifer. Furthermore, the elevation of the groundwater table would cause serious cultivation and drainage difficulties in vulnerable areas, as elevated groundwater will cause waterlogging. On the other hand, land surveying using the generated DEM related land surface levels to the groundwater levels in 2010.
In order to assess the significance of the impacts of rising groundwater levels on the study area, it was argued that different crops have different levels of resilience to high groundwater levels ranging between 20 and 100 cm above mean sea level (amsl). Accordingly, it was decided to set a groundwater level of 50 cm as a threshold under which the land would not be used for agricultural activities. Therefore, the developed DEM was employed to select those areas that would have groundwater levels less than or equal to 50 cm by the year 2100. The selected areas were considered as vulnerable areas to high groundwater levels (Figure 10). In this regard, the groundwater levels and the areas affected in the years 2010 and 2100 for each locality in the study area are projected and tabulated in Table 5.
4.5. Impact of Sea Level Rise on Drainage System
Field measurement results indicated that the drainage infrastructure, including channel banks, as well as channel cross section capacity, pumping stations, reuse pumping stations and controlling/hydraulic structures, are mostly safe, except for some specific cases.
Regarding the capacity of open drain cross-sections, Table 6 shows that the additional discharges resulting from the projected SLR varied between 0.7% and 1.2%. This means that drain channel cross-sections are capable of hosting the additional drainage rates expected by 2100 due to rising groundwater level.
Accommodation measures, meanwhile, may include enhancing the efficiency of the Gamasa drain system, which is one of the principle drains in the Nile Delta and consists of several collectors and sub-collectors, open drains and pumping stations. However, the siltation of the drain outlet represents a serious problem, which would increase waterlogging and salinity in the study area. Siltation at the Gamasa drain outlet also prevents fishermen in the area from moving with their boats through the drain canal into the Mediterranean. The expected SLR will accelerate these negative impacts on both the agriculture and the fishing sectors.
The capacity and efficiency of the pumping stations to perform over current suction and delivery levels were investigated. Few concerns were found, but our findings included potential impacts for certain pumping stations, including the pumping station feeder from Drain No. 2 to El-Benah Canal, which currently has suction-delivery levels ranging from 0.8 to 0.9 m. Therefore, this will require modifications of the engineering structural design to accommodate the expected changes. Other pumping stations, however, have sufficient clearance above the predicted SLR and would remain functional until 2100.
As for the subsurface drainage system, the increase in the rate of sea level rise will result in a consequent increase in groundwater levels, and hence in the drainage capacity and discharge. The estimated increase will not exceed 10% of the current discharge, which would necessitate an upgrade in the lifting pump stations.
The results of our investigations revealed that the study area contains seven drinking water treatment plants (WTPs). The results indicate that all WTP intakes are safe as they have been constructed on ground levels exceeding 2.0 m amsl. The only WTP intake that requires consideration is that of Gamasa city, as it faces the threat of high possible submergence due to the projected SLR.
Regarding water treatment plants (WWTPs), the study area had nine WWTPs. The results indicate that these structures and intakes are safe against SLR as they have levels varying between 2.0 and 3.35 for Ras El-Bar and Kafr Saad, respectively. Accordingly, the drainage system would need enhancement and continuous maintenance as well as monitoring.
The analysis of our results demonstrates that the study area will experience different vulnerabilities. Although the inundation of coastal zones threatens the infrastructure systems in the study area, this problem will have little impact on the study area for many reasons. Among them are the fact that the coastal strip is an undeveloped area and could be avoided in future management plans. Most of the projected inundated areas are protected by engineering protection systems. Some of these sectors have relatively low potential for tourism or agriculture activities. Analysis indicates that erosion/accretion rates would be very limited in some sectors of the coastline.
Although the wave climate results are not sufficient to draw a concrete conclusion on the impact of climate change-induced sea level rise, protective structures existing in the study area will ensure less impact on the shoreline. Protective structures are safe enough to withstand the expected change in wave climate.
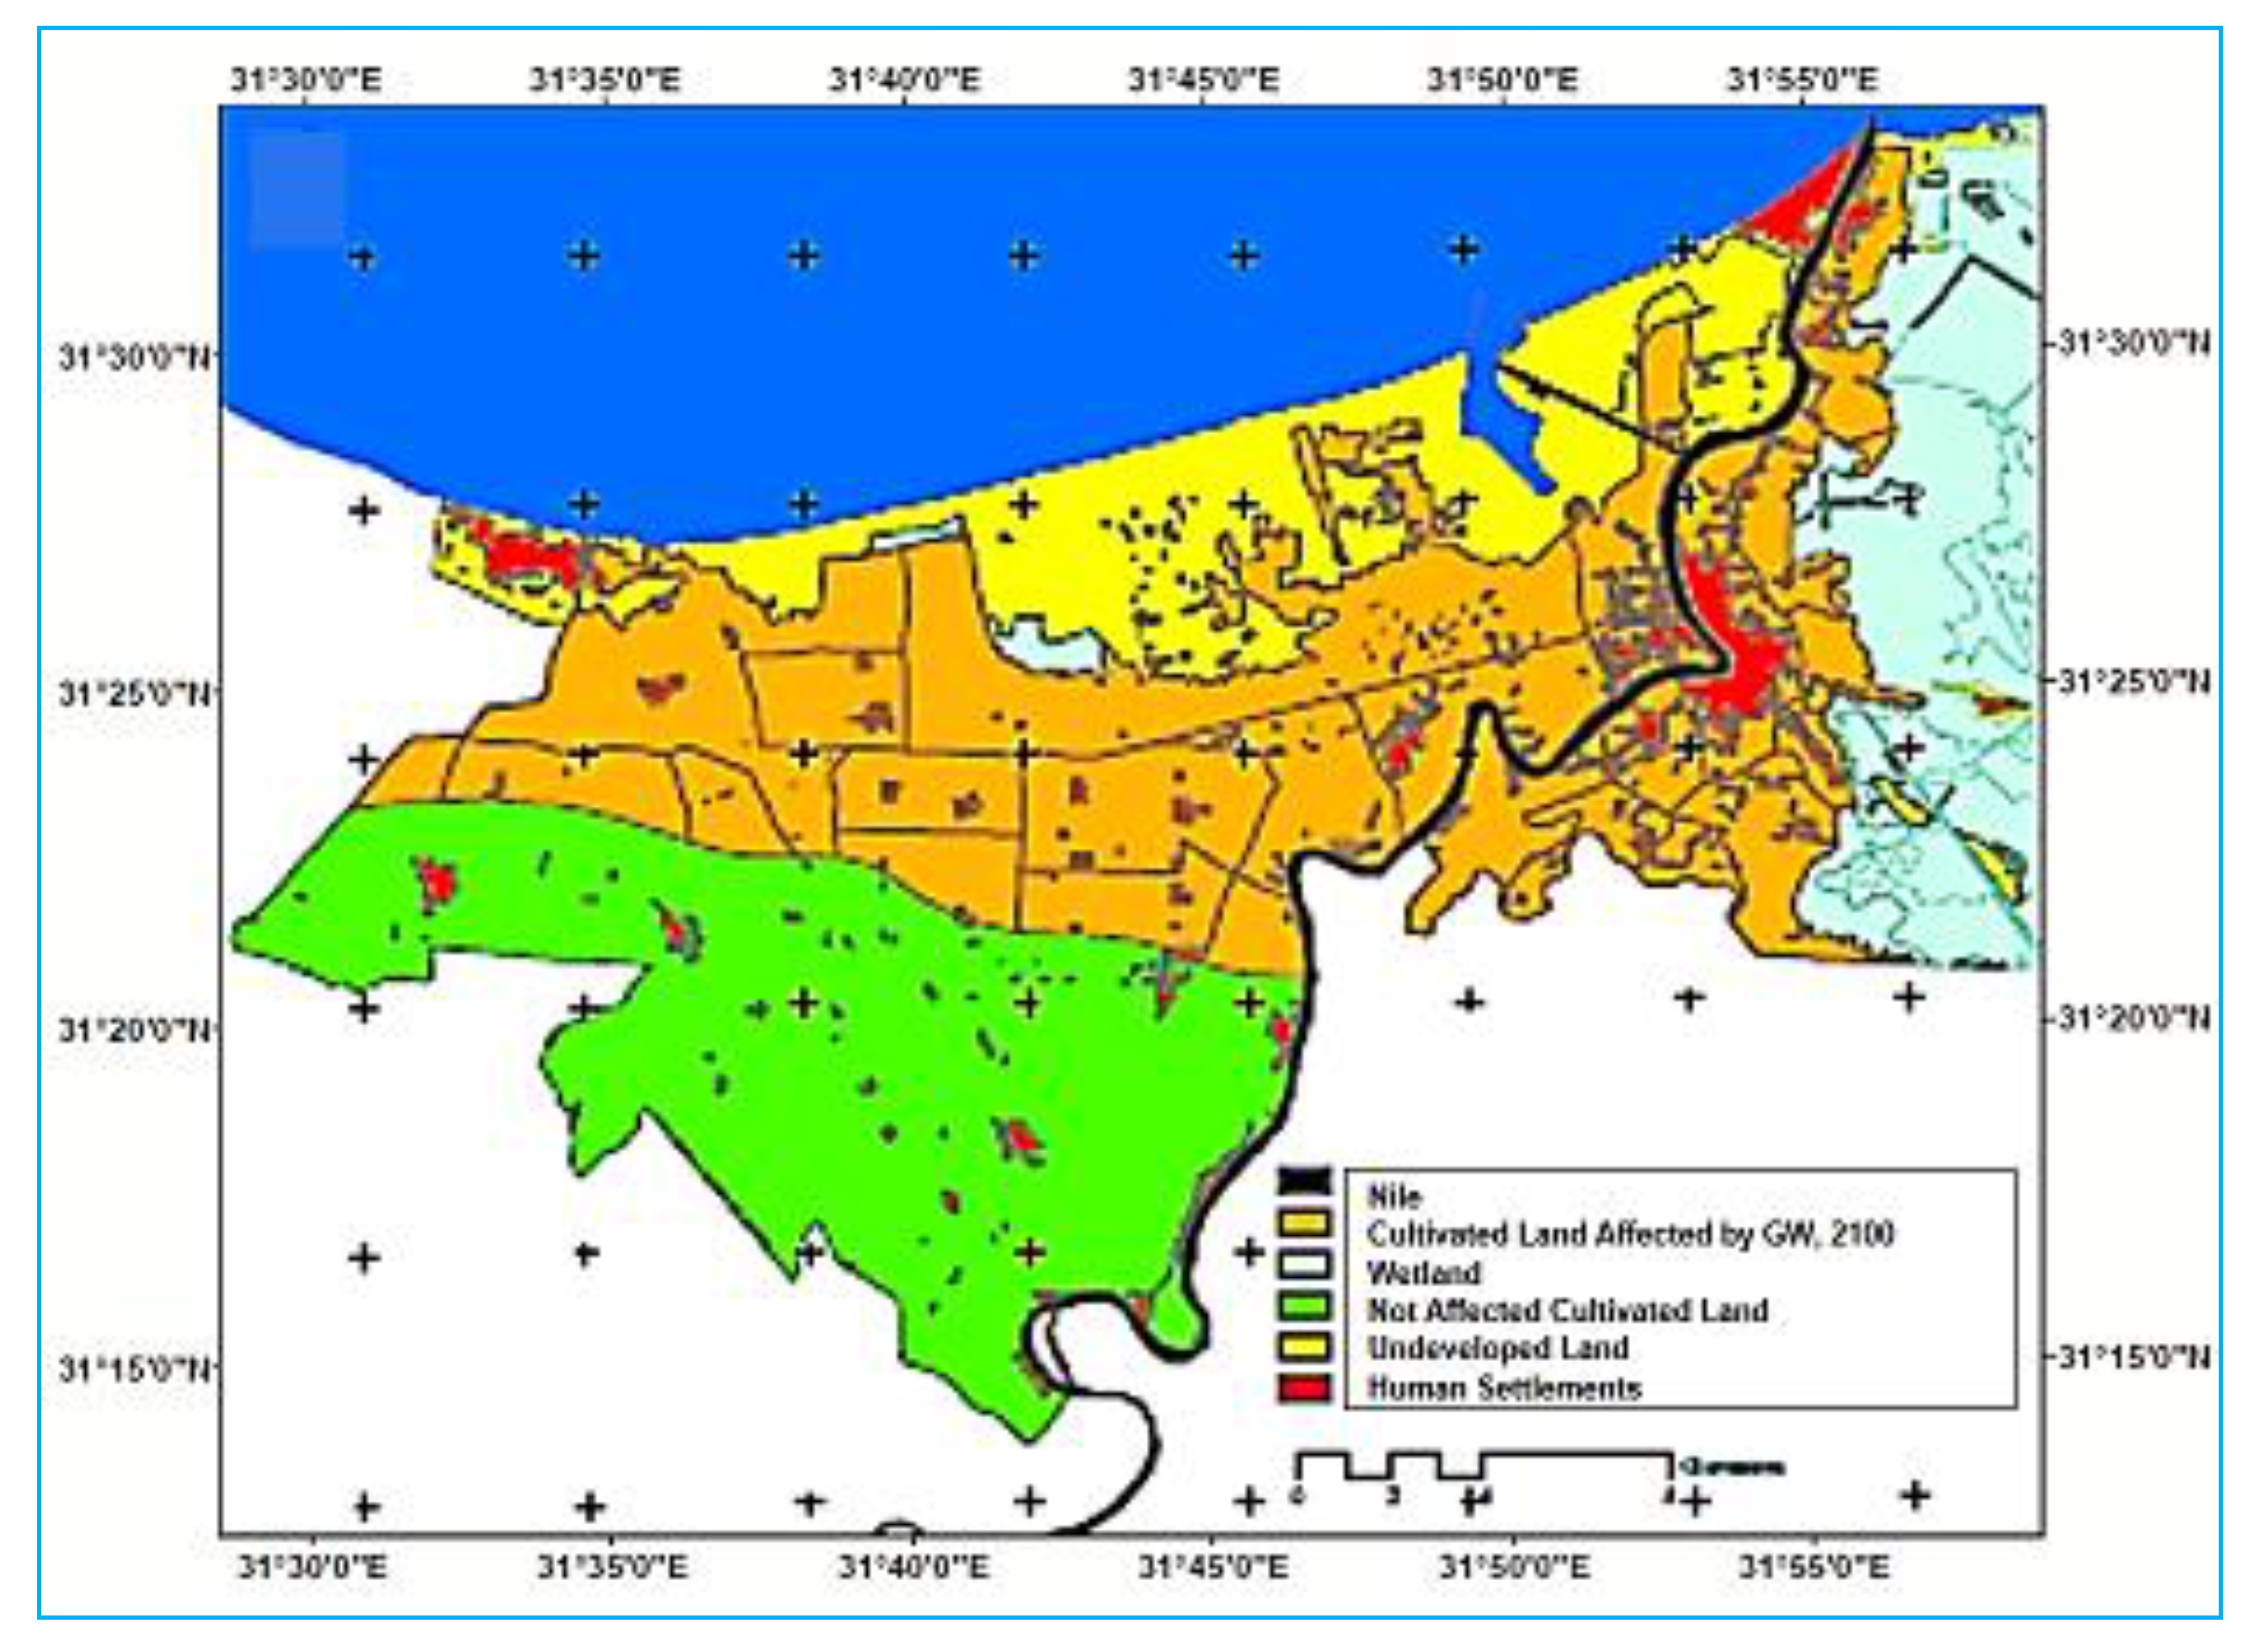
The analysis of the results indicates that the most vulnerable system in the study area is the rising levels of groundwater. The vulnerability of groundwater will have adverse implications on land use, land cover, infrastructures and buildings foundations. The area will suffer from waterlogging, which would change the existing agricultural practices to salt-tolerant agriculture practices. The impact of rising groundwater levels on land use in the study area is illustrated in Figure 11. It should be noted that the main cities in the study area are located in the area that would suffer from rising groundwater levels.
According to our analysis, the drainage system will need some enhancement and maintenance. In fact, the system may need some modifications or extra drains in order to maintain safe building foundations. Drains would be required for the dewatering process in order to protect infrastructure systems and the houses of settlers in the study area.
5. Conclusions and Recommendations
In this study, we examined the vulnerabilities of the most effective coastal systems to a 73 cm SLR projected up to the year 2100. The systems examined were inundation threats, wave climate, erosion/accretion process, saltwater intrusion and the coastal groundwater system, and the drainage system.
The results indicated that not all the locations in the study area are equally vulnerable to SLR-induced inundation. We concluded that inundation will have limited impacts on the various localities in the study area. The area threatened by inundation represents 9.70 km2, equivalent to 2.16% of the total study area.
Although the duration of the wave data is not long enough and the results are indicative, analysis of wave data in 1998 and 2010 supports the results of previous studies for 1985 and 2003, and may provide evidence for a possible impact of climate on wave climate. The results demonstrated that significant wave height increased from 0.94 to 1.31 m in 1998 and 2010, respectively, with an annual increase of about 3.1 cm. In addition, there was a significant deviation in the predominant waves to the west during the studied periods. In this respect, the available wave data are insufficient to provide concrete conclusions on climate change impacts on wave climate.
We concluded that the shoreline will experience a retreat between 40 and 160 m by 2100, with an average rate of about 1.2 m per year.
Due to rising groundwater level, we concluded that increased groundwater levels will adversely affect 60% of the total study area. In addition, SLR would advance the freshwater–saltwater interface by 1 km inland.
Regarding drainage system vulnerability, the system has the capacity to host the expected increase in drainage discharge by the year 2100 with no need to modify the cross-sectional area of most of the drains. We concluded that all drainage infrastructures are safe and will remain functional up to the year 2100. The estimated increase in the sub-drainage system will not exceed 10% of the current discharge and about 1.2% for the open drainage system.
The study proved that the groundwater rising is the most vulnerable system, as it would have implications and increase stress on the drainage system, causing waterlogging and having adverse impacts on building foundations as well as infrastructure systems in the study area.
According to these findings, it is suggested that the drainage system will need upgrades and enhancement. Furthermore, groundwater levels require continuous monitoring in terms of quality and levels. Moreover, long-term wave measurements are highly recommended in order to draw concrete conclusions on the impacts of climate change on wave climate. In addition, we recommend the establishment of an early warning monitoring system to monitor any changes in the study area due to sea level rises.
Author Contributions
All authors contributed equally to this work. All authors have read and agreed to the published version of the manuscript.
Funding
This research was funded by Taif University researchers supporting project number TURSP-2020/252, Taif University, Taif, Saudi Arabia.
Institutional Review Board Statement
Not applicable.
Informed Consent Statement
Not applicable.
Data Availability Statement
Data can be provided upon request from the corresponding author.
Acknowledgments
The authors would like to thank the Coastal Research Institute (CoRI) Staff, National Water Research Center (NWRC), Egypt, for their efforts and investigations carried out to collect and measure data used in the current study. Furthermore, the authors are grateful to the International Development Research Center (IDRC), Canada, for their funding for carrying out field work as well as desk work. The authors would like to acknowledge financial support from Taif University researchers supporting project number TURSP-2020/252, Taif University, Taif, Saudi Arabia.
Conflicts of Interest
The authors declare no conflict of interest.
References
- IPCC TAR. Climate Change 2001: Impacts, Adaptation and Vulnerability. In IPCC Third Assessment Report; Cambridge University Press: Cambridge, UK, 2001. [Google Scholar]
- Eid, E.; Hulsbergen, C.H. Sea Level Rise and Coastal Zone Management. Climate change: Science, impacts and policy. In Proceedings of the second world climate conference; Jager, J., Ferguson, H.L., Eds.; Cambridge University Press: Cambridge, UK, 1991; p. Xiii+578. [Google Scholar]
- Dasgupta, S.; Laplante, B.; Meisner, C.; Wheeler, D.; Yan, J. The Impact of Sea Level Rise on Developing Countries: A Comparative Analysis; World Bank: Washington, DC, USA, 2007. [Google Scholar]
- Anthoff, D.; Nicholls, R.J.; Tol, R.S.J.; Vafeidis, A.T. Global and regional exposure to large rises in sea level: A sensitivity analysis. In Tyndall Centre for Climate Change Research Working; Tyndall Centre for Climate Change Research: Norwich, UK, 2006; p. 96. [Google Scholar]
- Church, J.A.; Woodworth, P.L.; Aarup, T.; Wilson, S.W. (Eds.) Understanding Sea-Level Rise and Variability; Wiley-Blackwell Publishing: Chichester, UK, 2010. [Google Scholar]
- Curry, J.R. Late quaternary history, continental shelves of the United States. In The Quaternary of the United States; Write, H.E., Frey, D.J., Eds.; Princeton University Press: Princeton, NJ, USA, 1965; pp. 723–735. [Google Scholar]
- Millimam, J.D.; Emery, K.O. Sea levels during past 35,000 years. Science 1968, 162, 1121–1123. [Google Scholar] [CrossRef] [PubMed]
- Nicholls, R.J.; Klein, R.J. Some thoughts on impacts and adaptation to climare change in coastal zone. In Countries: A Comparative Analysis, Proceedings of the SURVAS Expert Workshop on Africa Vulnerability and Adaptation to Impacts of Accelerated Sea Level Rise (ASLR), Cairo, Egypt, 5–8 November 2000; World Bank: Washington, DC, USA, 2000; pp. 5–13. [Google Scholar]
- IPCC. Intergovernmental Panel on Climatic Change in the eastern Mediterranean basin. In Geological Evolution of the Mediterranean Basin; Stanley, D.J., Wezel, F.C., Eds.; Springer: New York, NY, USA, 1994; pp. 249–269. [Google Scholar]
- Church, J.A.; White, N.J. Sea-Level Rise from the Late 19th to the Early 21st Century (Open Access). Surv. Geophys. 2011, 32, 585–602. [Google Scholar] [CrossRef] [Green Version]
- Calafat, F.M.; Chambers, D.P.; Tsimplis, M.N. On the ability of global sea level reconstructions to determine trends and variability (Open Access). J. Geophys. Res. Ocean. 2014, 119, 1572–1592. [Google Scholar] [CrossRef] [Green Version]
- Slangen, A.B.A.; Church, J.A.; Agosta, C.; Fettweis, X.; Marzeion, B.; Richter, K. Anthropogenic forcing dominates global mean sea-level rise since 1970. Nat. Clim. Chang. 2016, 6, 701–705. [Google Scholar] [CrossRef]
- Frihy, O.E. The Nile delta-Alexandria coast: Vulnerability to sea-level rise, consequences and adaptation. Mitig. Adapt. Strateg. Glob. Chang. 2003, 8, 115–138. [Google Scholar] [CrossRef]
- Abdrabo, M.; Hassaan, M. Risks and Opportunities: Understanding Climate Change in the Nile Delta; Research Center for Adaption of Climate Change (ARCA), University of Alexandria: Alexandria, Egypt, 2015. [Google Scholar]
- Abdrabo, M.; Hassaan, M. Assessment of Policy-Research Interaction on Climate Change Adaptation Action: Inundation by Sea Level Rise in the Nile Delta. J. Geosci. Environ. Prot. 2020, 8, 314. [Google Scholar] [CrossRef]
- El-Sharkawy, H.; Rashed, H.; Rashed, I. Climate Change: The Impacts of Sea Level Rise on Egypt. In Proceedings of the 45th ISOCARP Congress, Porto, Portugal, 18–22 October 2009. [Google Scholar]
- Nicholls, R.J.; Marinova, N.; Lowe, J.A.; Brown, S.; Vellinga, P.; De Gusmao, D.; Hinkel, J.; Tol, R.S.J. Sea-level rise and its possible impacts given a ‘beyond 4 °C world’ in the twenty-first century. Philos. Trans. R. Soc. A 2011, 369, 161–181. [Google Scholar] [CrossRef] [Green Version]
- Stanley, D.J. Mediterranean Deltas: Subsidence as a Major Control of Relative Sea-Level Rise. Bull. I’lnslilul Occanographique 1997, 18, 35–62. [Google Scholar]
- Stanley, D.J.; Warne, A.G. Nile Delta: Recent Geological Evolution and Human Impact. Science 1993, 260, 628–634. [Google Scholar] [CrossRef]
- Stratus Consulting. Potential Impacts of Climate Change on the Egyptian Economy; Prepared for UNDP; Stratus Consulting Inc.: Cairo, Egypt, 2012. [Google Scholar]
- Dawod, G.M.; Mohamwed, H.F. Estimation of Sea Level Rise Hazardous Impacts in Egypt within a GIS Environment. In Proceedings of the 3rd National GIS Symposium in Saudi Arabia, Al-Khober, Saudi Arabia, 7–9 April 2008; pp. 1–14. [Google Scholar]
- El-Nahry, A.H.; Doluschitz, R. Climate Change and Its Impacts on the Coastal Zone of the Nile Delta, Egypt. Environ. Earth Sci. 2010, 59, 1497–1506. [Google Scholar] [CrossRef]
- El Raey, M. Vulnerability Assessment of the Coastal Zone of the Nile Delta of Egypt, to the Impacts of El Raey, M.; Dewidar, K.; El Hattab, M. Adaptation to the Impacts of Sea Level Rise in Egypt. Clim. Res. 1999, 12, 117–128. [Google Scholar] [CrossRef] [Green Version]
- Sea Level Rise. Ocean. Coast. Manag. 1997, 37, 29–40. [CrossRef]
- El Raey, M.; Nasr, S.; Omran, F.; Desouki, S.; Dewidar, K. Potential Impacts of Accelerated Sea-Level Rise on Alexandria Governorate, Egypt. J. Coast. Res. 1995, 51, 190–204. [Google Scholar]
- Abu-Zeid, A.B.I.; El-Banna, M.M.; Dijk, L.; van Farouk, A.; Hassan, M.A.H.; Abayazid, H.O.; Ali, M.A.M.; Deabes, E.A.; Fouad, E.E.; Iskandar, M.M.; et al. Sea Level Rise in the Nile Delta: Impacts, Vulnerability and Adaptation. Case Studies and Lessons Learned from Ras el Bar—Gamasa Areas; Elshinnawy, I.A., Abdrabo, M.A., Farouk, A., Eds.; Coastal Research Institute/Institute of Graduate Studies and Research/Center for Development Services: Alexandria, Egypt; Cairo, Egypt, 2012. [Google Scholar]
- Frihy, O.E.; El-Sayed, M.K. Vulnerability Risk Assessment and Adaptation to Climate Change Induced Sea Level Rise along the Mediterranean Coast of Egypt. Mitig. Adapt. Strateg. Glob. Chang. 2013, 18, 1215–1237. [Google Scholar] [CrossRef]
- Haggag, M.; El-Shazly, A.; Rakha, K. Impact of Sea Level Rise on the Nile Delta, Egypt. J. Eng. Appl. Sci. 2013, 60, 211–230. [Google Scholar]
- Hasan, E.; Khan, S.I.; Hong, Y. Investigation of Potential Sea Level Rise Impact on the Nile Delta, Egypt Using Digital Elevation Models. Environ. Monit. Assess. 2015, 187, 649. [Google Scholar] [CrossRef] [PubMed]
- Hassan, M.A.; Abdrabo, M.A. Vulnerability of the Nile Delta Coastal Areas to Inundation by Sea Level Rise. Environ. Monit. Assess. 2013, 185, 6607–6616. [Google Scholar] [CrossRef] [PubMed]
- Hereher, M.E. Vulnerability of the Nile Delta to Sea Level Rise: An Assessment Using Remote Sensing. Geomat. Nat. Hazards Risk 2010, 1, 315–321. [Google Scholar] [CrossRef]
- Ismail, N.; Iskander, M.; El-Sayed, W. Assessment of Coastal Flooding at Southern Mediterranean with Global Outlook for Lowland Coastal Zones. Int. Conf. Coast. Eng. 2012, 33, 83. [Google Scholar] [CrossRef]
- Refaat, M.M.; Eldeberky, Y. Assessment of Coastal Inundation Due to Sea-Level Rise along the Mediterranean Coast of Egypt. Mar. Geod. 2016, 39, 290–304. [Google Scholar] [CrossRef]
- Zaid, S.M.; Mamoun, M.M.; Al-Mobark, N.M. Vulnerability Assessment of the Impact of Sea Level Rise and Land Subsidence on North Nile Delta Region. World Appl. Sci. J. 2014, 32, 325–342. [Google Scholar]
- Elshinnawy, I.A.; Abu-Zeid, A.; Abdelhalim, E.D. Adaptation to Climate Change Impacts on Coastal Zones of Egypt. In Proceedings of the Regional Seminar on Climate Changes and Natural Disasters Management, Alexandria, Egypt, 10–13 August 2009; Hilton Green Plaza Hotel: Alexandria, Egypt, 2009. [Google Scholar]
- ElGanzori, A. Towards a climate change adaptation strategy for the water sector in Egypt. In Climate Change Risk Management in Egypt, An Integrated Water Resources Risk Management and Forecasting Component; MDG Achievment FUND, UNESCO: Cairo, Egypt, 2012. [Google Scholar]
- IPCC. Climate Change 2007: Impacts, Adaptation and Vulnerability. In Contribution of Working Group II to the Fourth Assessment Report of the Intergovernmental Panel on Climate Change; Parry, M.L., Canziani, O.F., Palutikof, J.P., van der Linden, P.J., Hanson, C.E., Eds.; Cambridge University Press: Cambridge, UK, 2007. [Google Scholar]
- CoRI and Delft Hydraulics. Vulnerability Assessment to Accelerated Sea Level Rise. In Case Study Egypt. Final Report, H1487; Coastal Research Institute: Alexandria, Egypt, 1992. [Google Scholar]
- El Banna, M.M. Erosion and accretion rates and their associated sediment characters along Ras El Bar coast, northeast Nile Delta, Egypt. Environ. Geol. 2007, 52, 41–49. [Google Scholar] [CrossRef]
- Brunn, P. Sea Level Rise as a Cause of Shore Erosion. Proc. Am. Soc. Civ. Eng. J. Waterw. Harb. Div. 1962, 88, 117–130. [Google Scholar]
- Frihy, O.E. Sea Level Rise and Shoreline Retreat of the Nile Delta Promontories, Egypt. Nat. Hazards 1992, 5, 65–81. [Google Scholar] [CrossRef]
- Frihy, O.E.; Khafagy, A.A. Climate and Human Induced Changes in Relation to Shoreline Migration Trends at the Nile Delta Promontories, Egypt. CATENA Interdiscip. J. Pedol. Hydrol. Geomorphol. West Ger. 1991, 18, 197–211. [Google Scholar]
- Elshinnawy, I.A.; Abayazid, H.O. Vulnerability Assessment of Climate Change Impact on Groundwater Salinity in the Nile Delta Coastal Region-Egypt. In Proceedings of the Conference on Coastal Engineering Practice: Engineering Sustainable Coastal Development, San Diego, CA, USA, 21–24 August 2011. [Google Scholar]
- Iskander, M.M. Wave Climate and Coastal Structures in the Nile Delta Coast of Egypt. Emir. J. Eng. Res. 2013, 18, 43–57. [Google Scholar]
- Abo Zed, A.I.; Gewilli, Y.M. Wave climate and coastal response at Rosetta coast, Nile Delta, Egypt. In Proceedings of the 3rd Arab Water Regional Conference, Research Advancement in Managing Limited Water Resources, Cairo, Egypt, 9–11 December 2006. [Google Scholar]
- Frihy, O.E.; Deabes, E.A.; Shereet, S.M.; Abdalla, F.M. Alexandria-Nile Delta coast, Egypt: Update and Future Projection of Relative Sea-Level Rise. Environ. Earth Sci. 2010, 61, 253–273. [Google Scholar] [CrossRef]
Figure 1.
Study area.
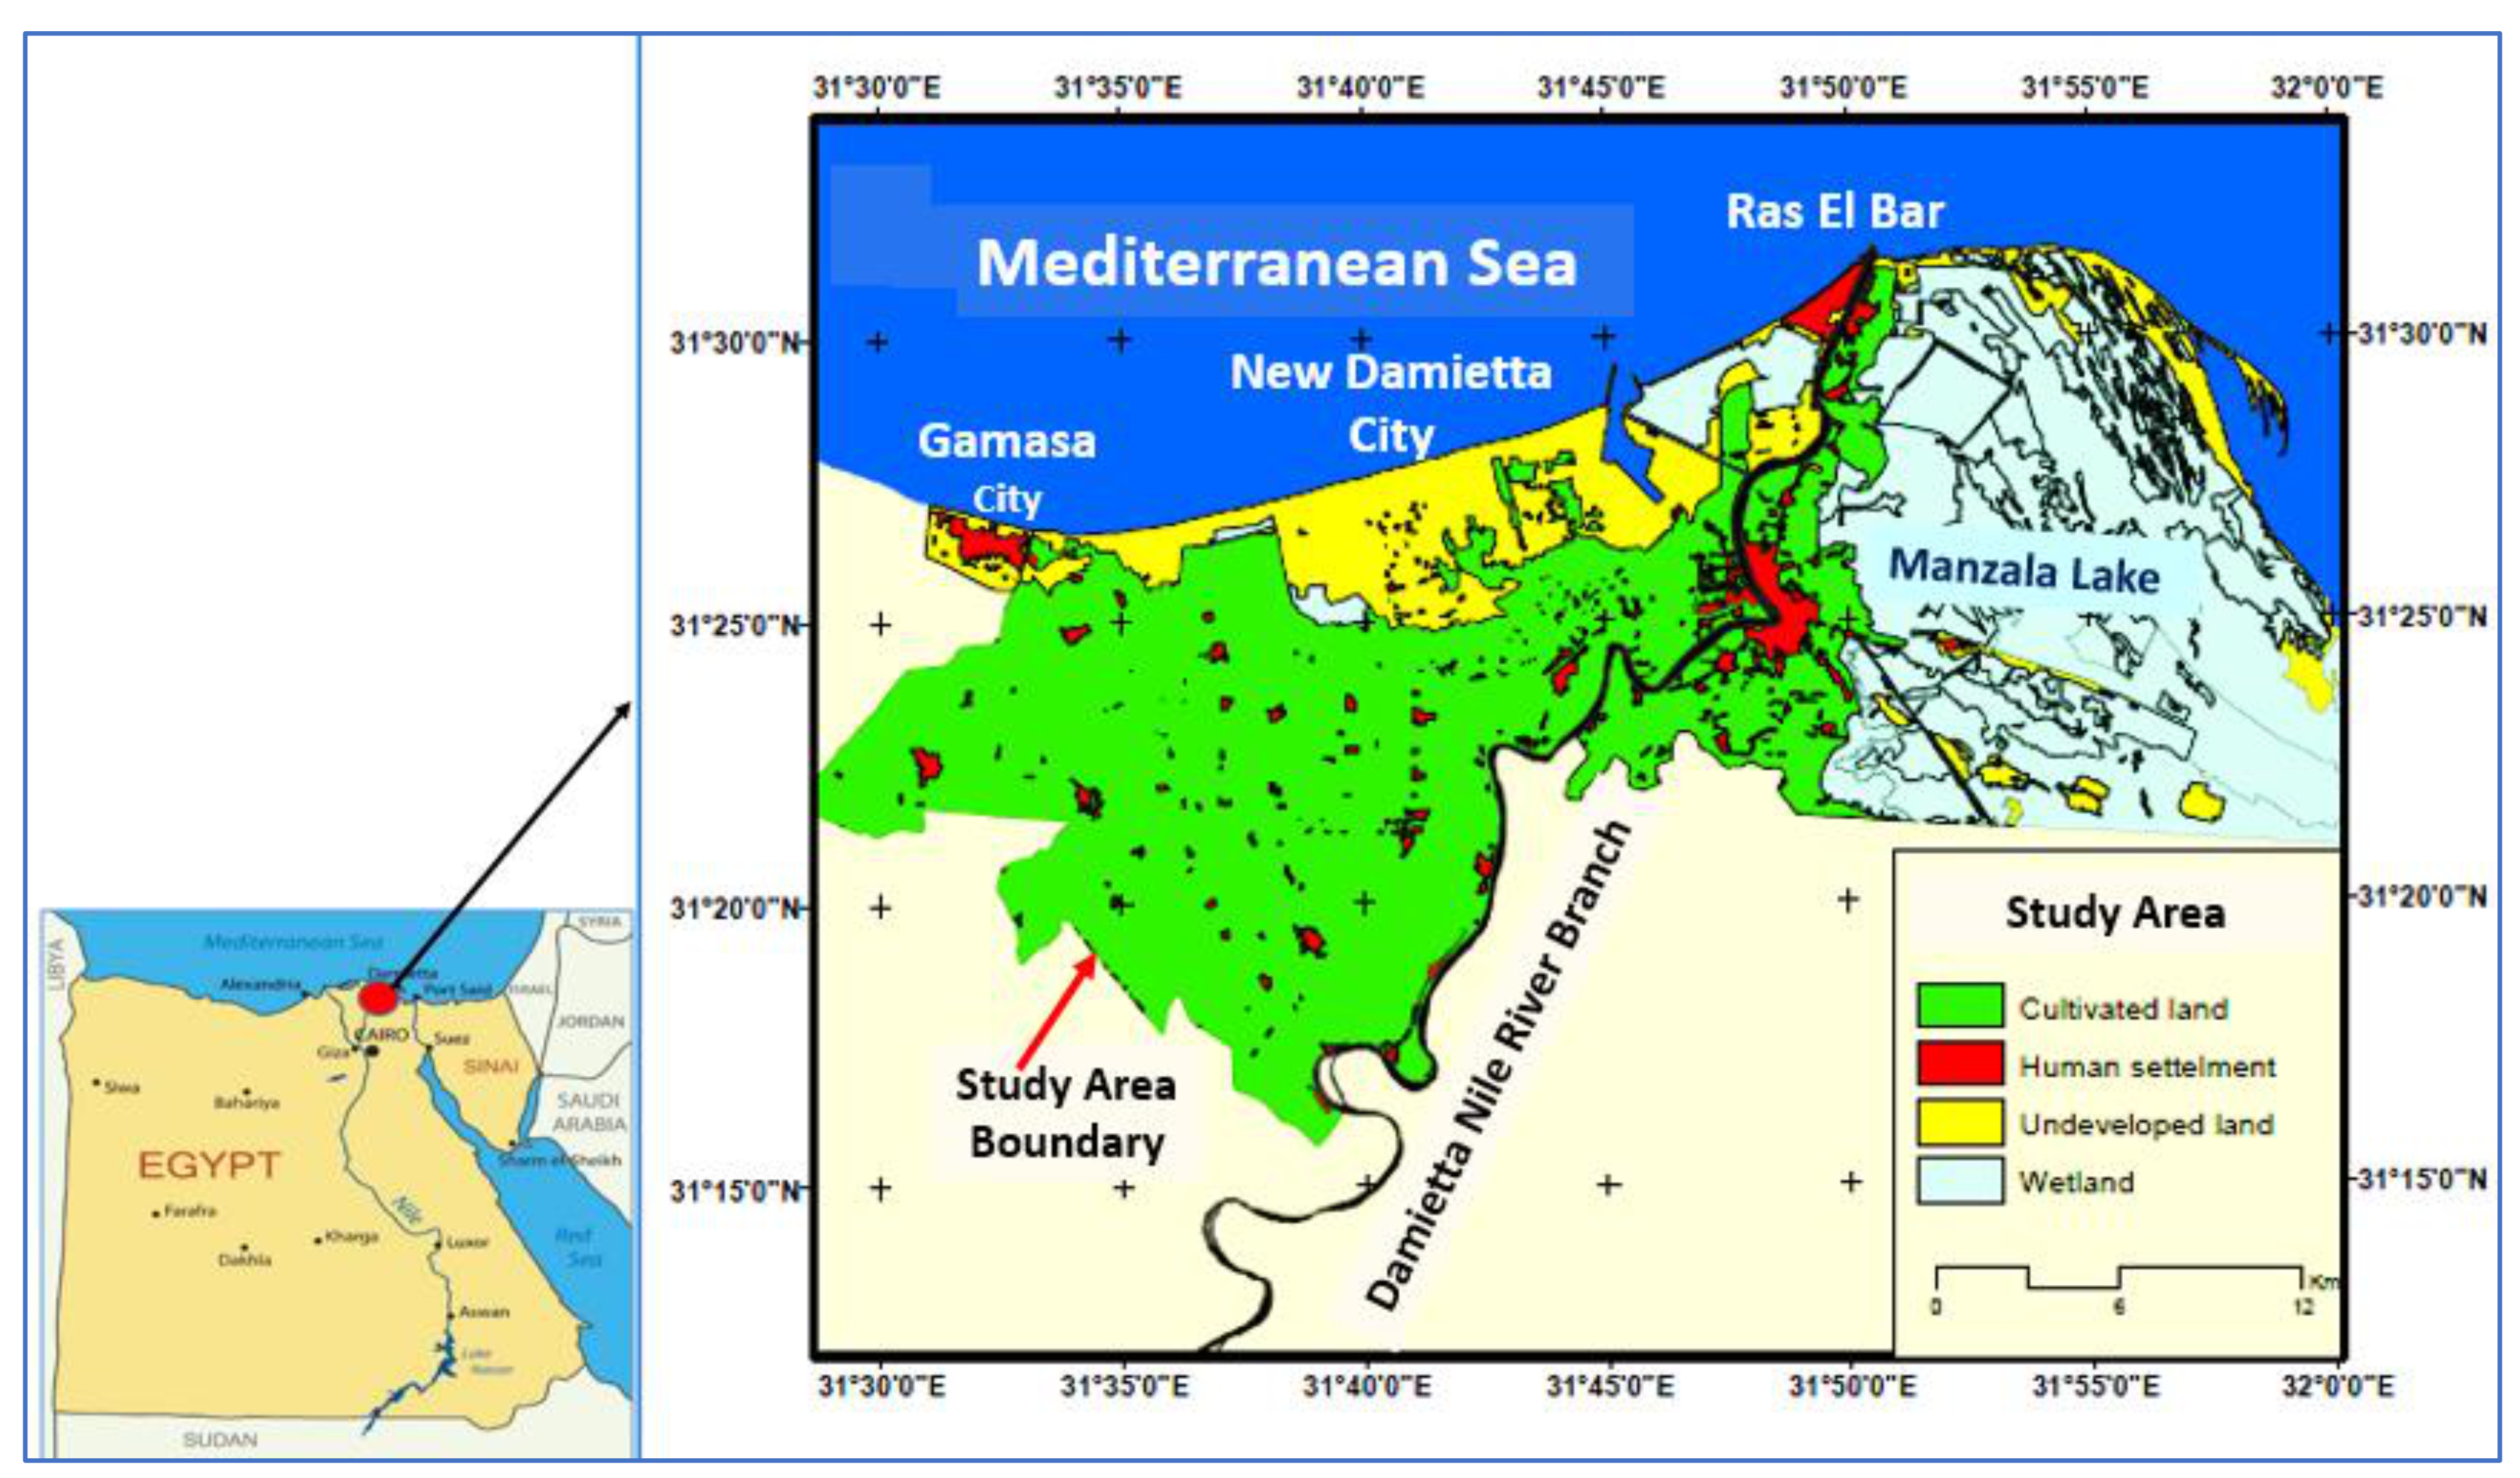
Figure 2.
Study area digital elevation model (DEM).
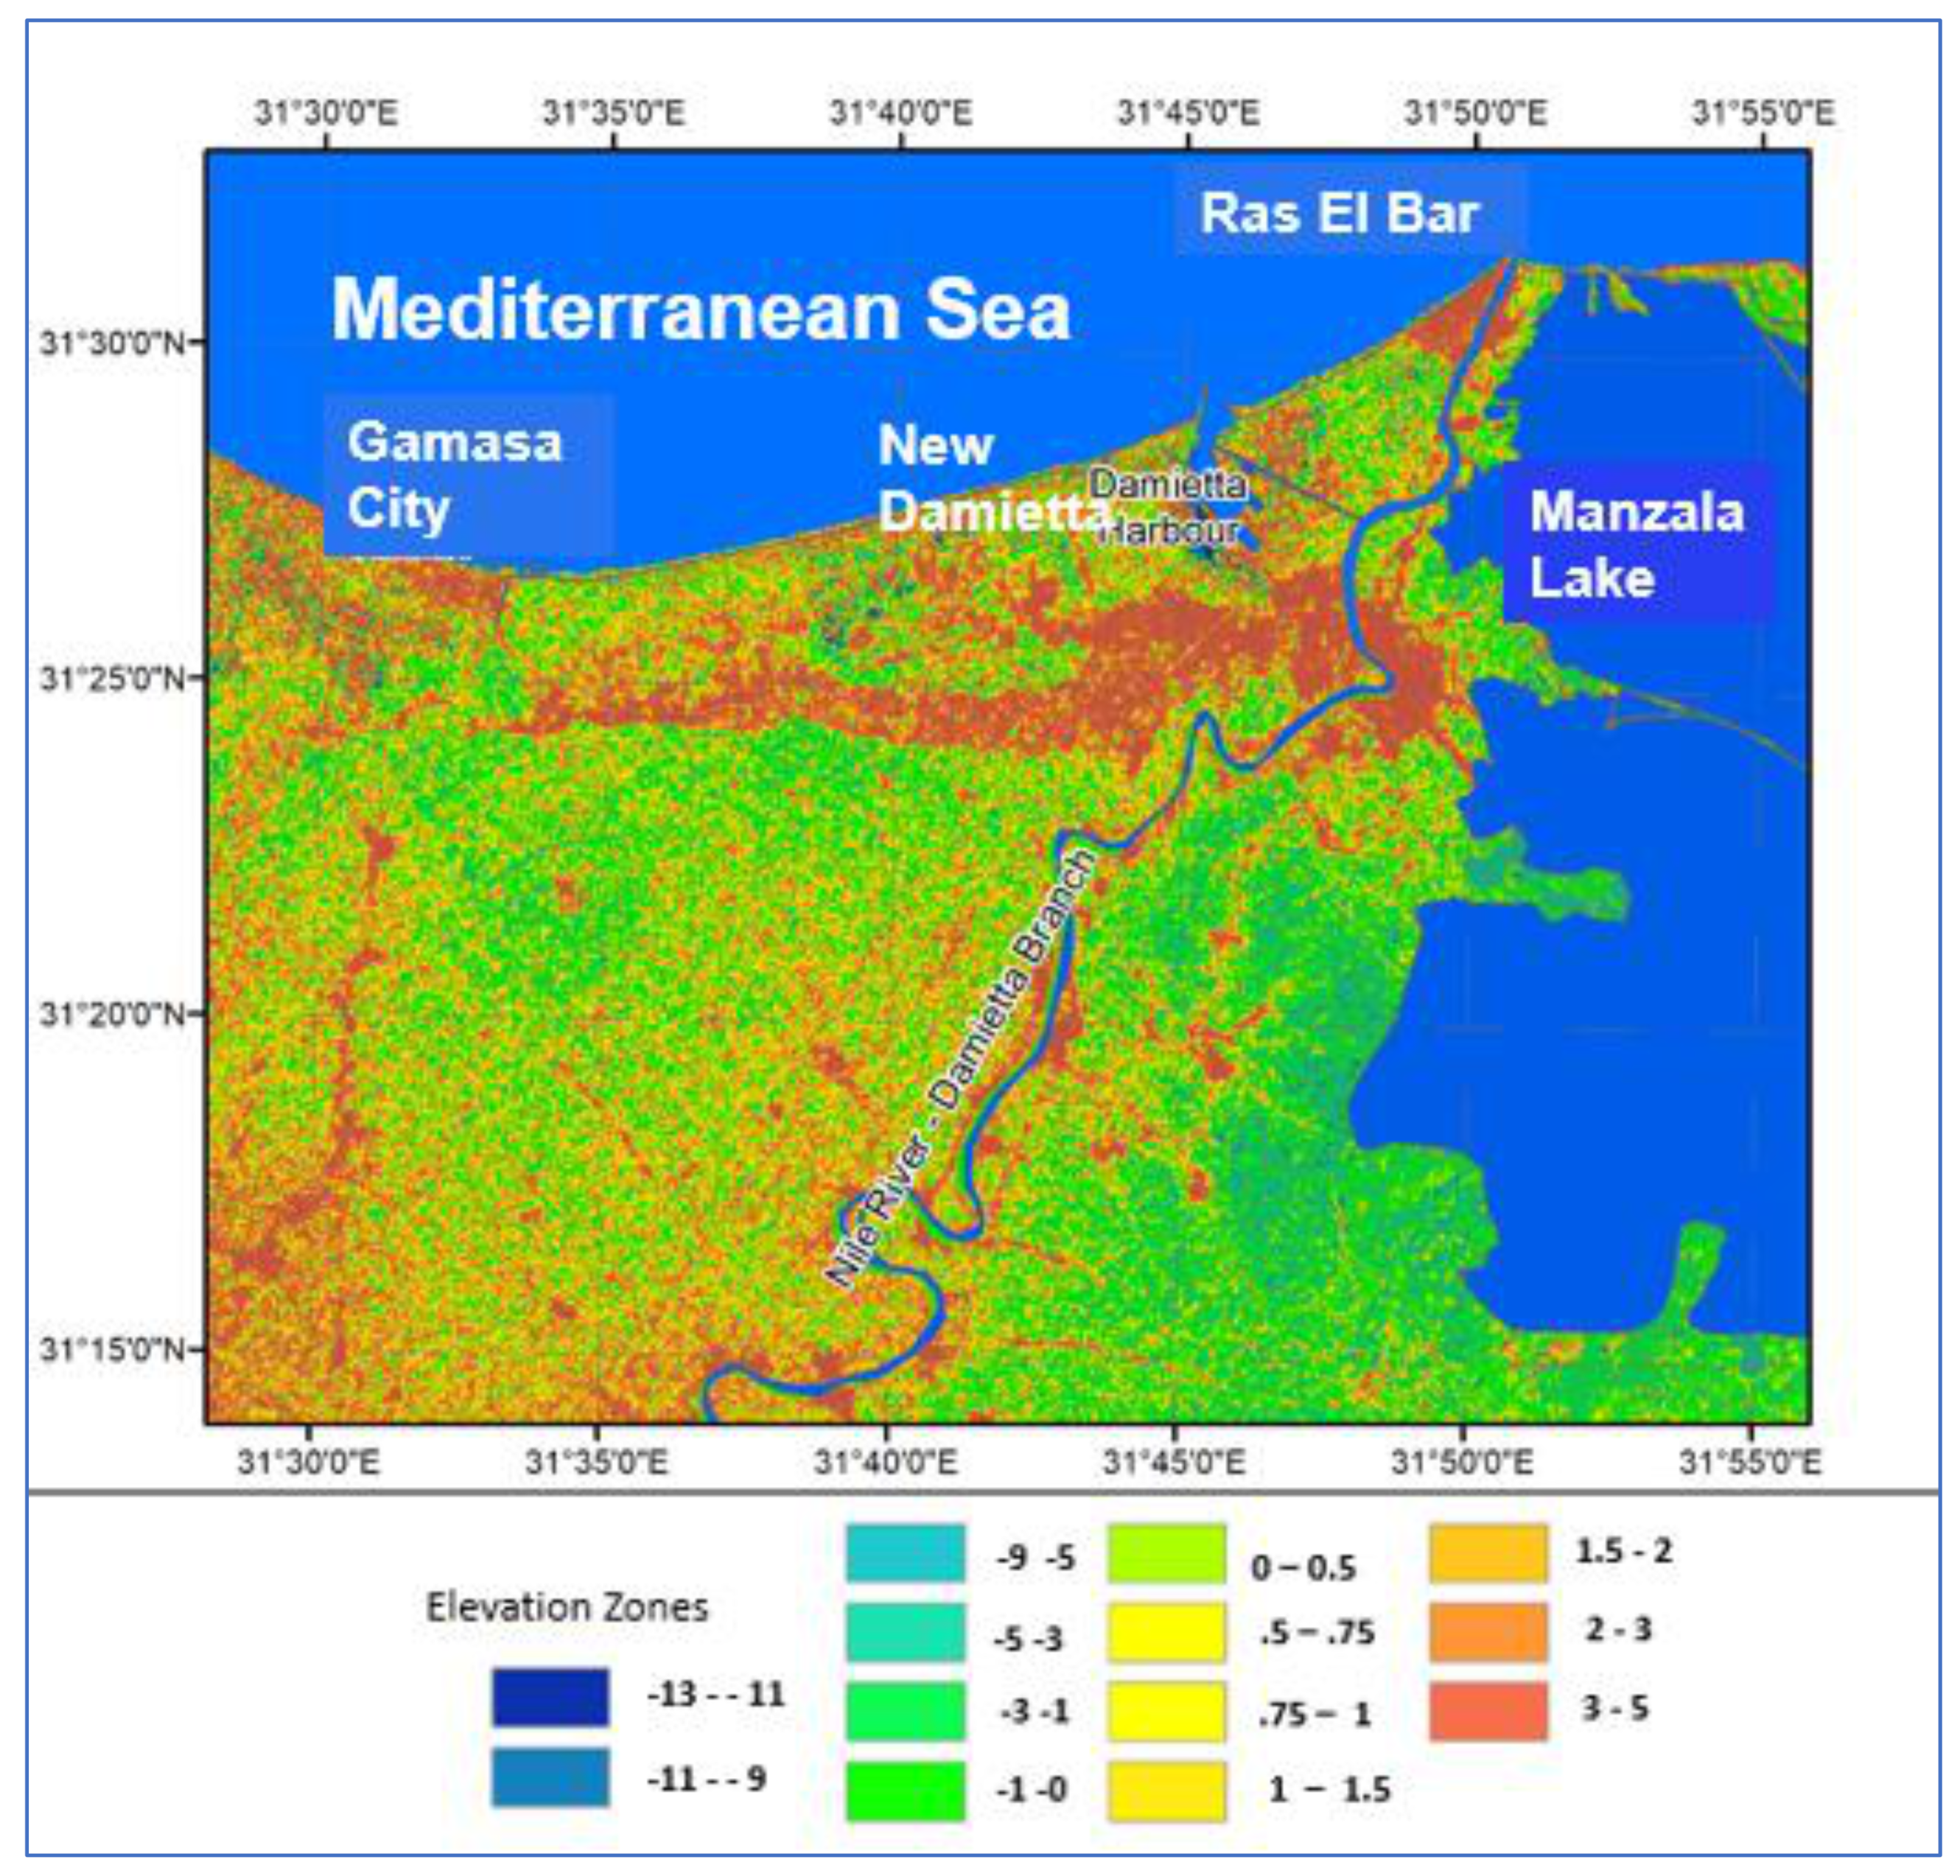
Figure 3.
(a) Directional distribution for the analyzed wave samples measured from 1997 to 1999; (b) Directional distribution for the analyzed wave samples measured in 2010.
Figure 3.
(a) Directional distribution for the analyzed wave samples measured from 1997 to 1999; (b) Directional distribution for the analyzed wave samples measured in 2010.
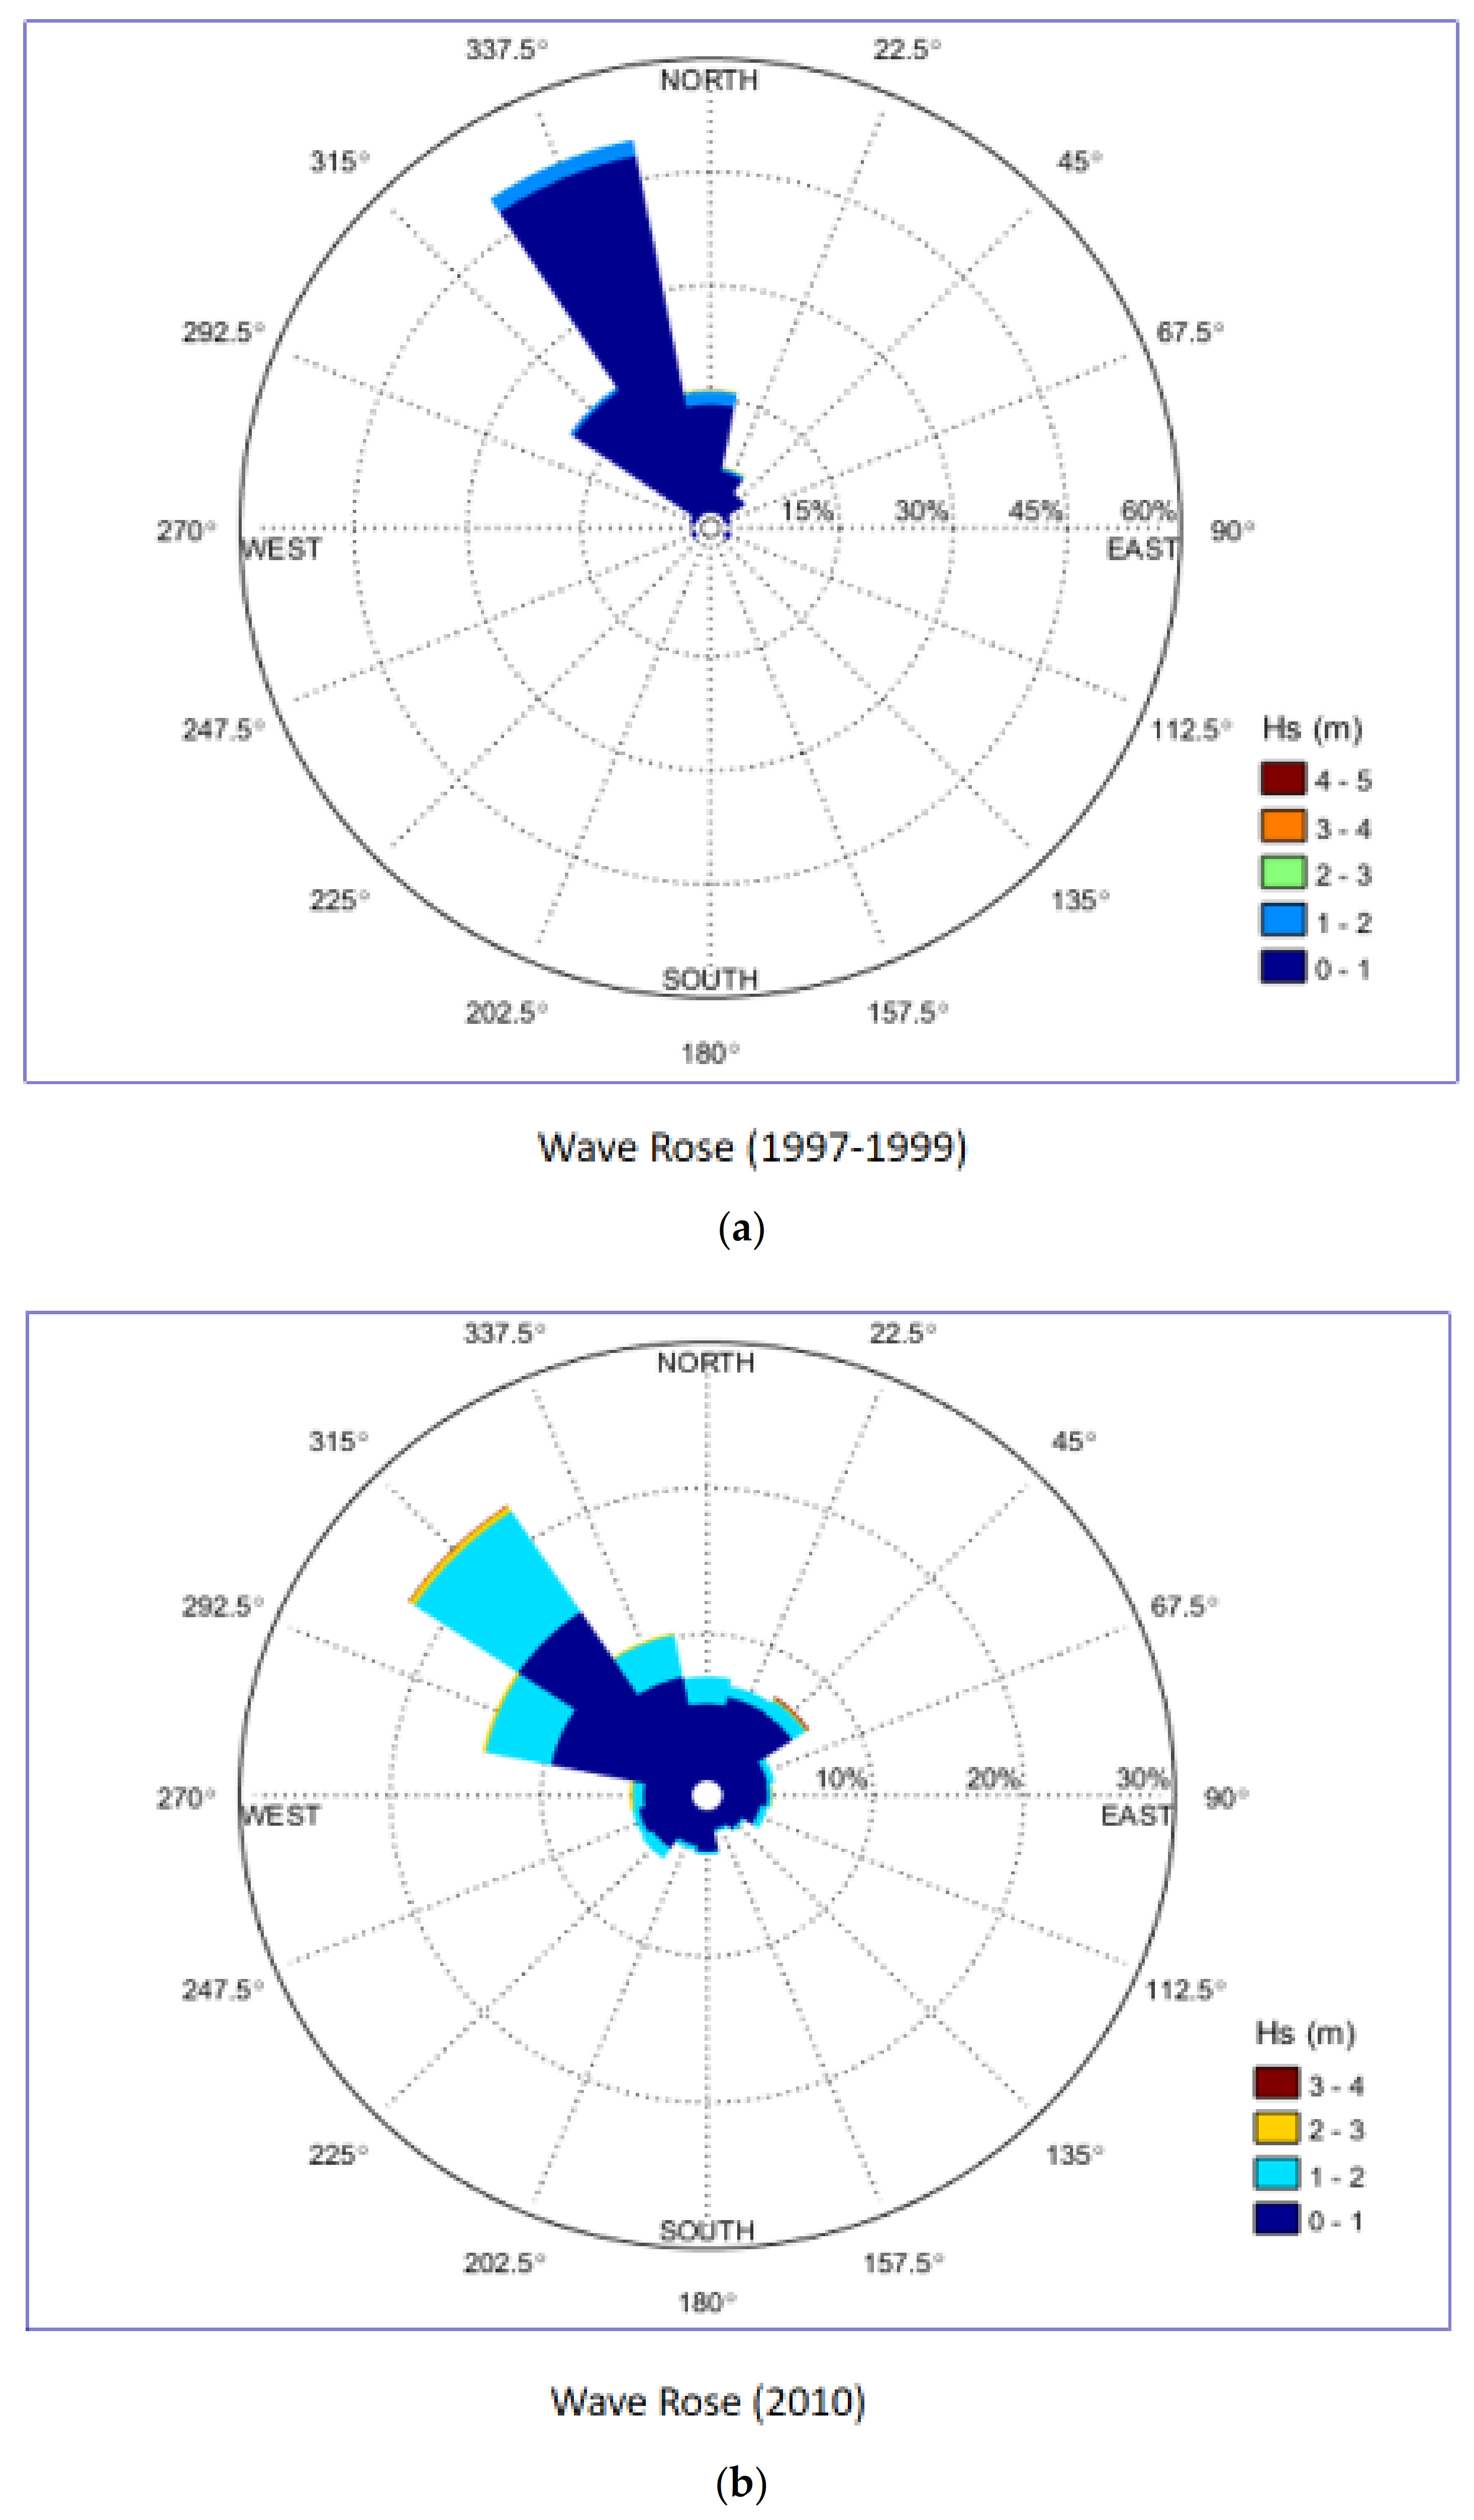
Figure 4.
Erosion/accretion sectors in the study area, 1984–2000.

Figure 5.
Land and groundwater levels in 2010.
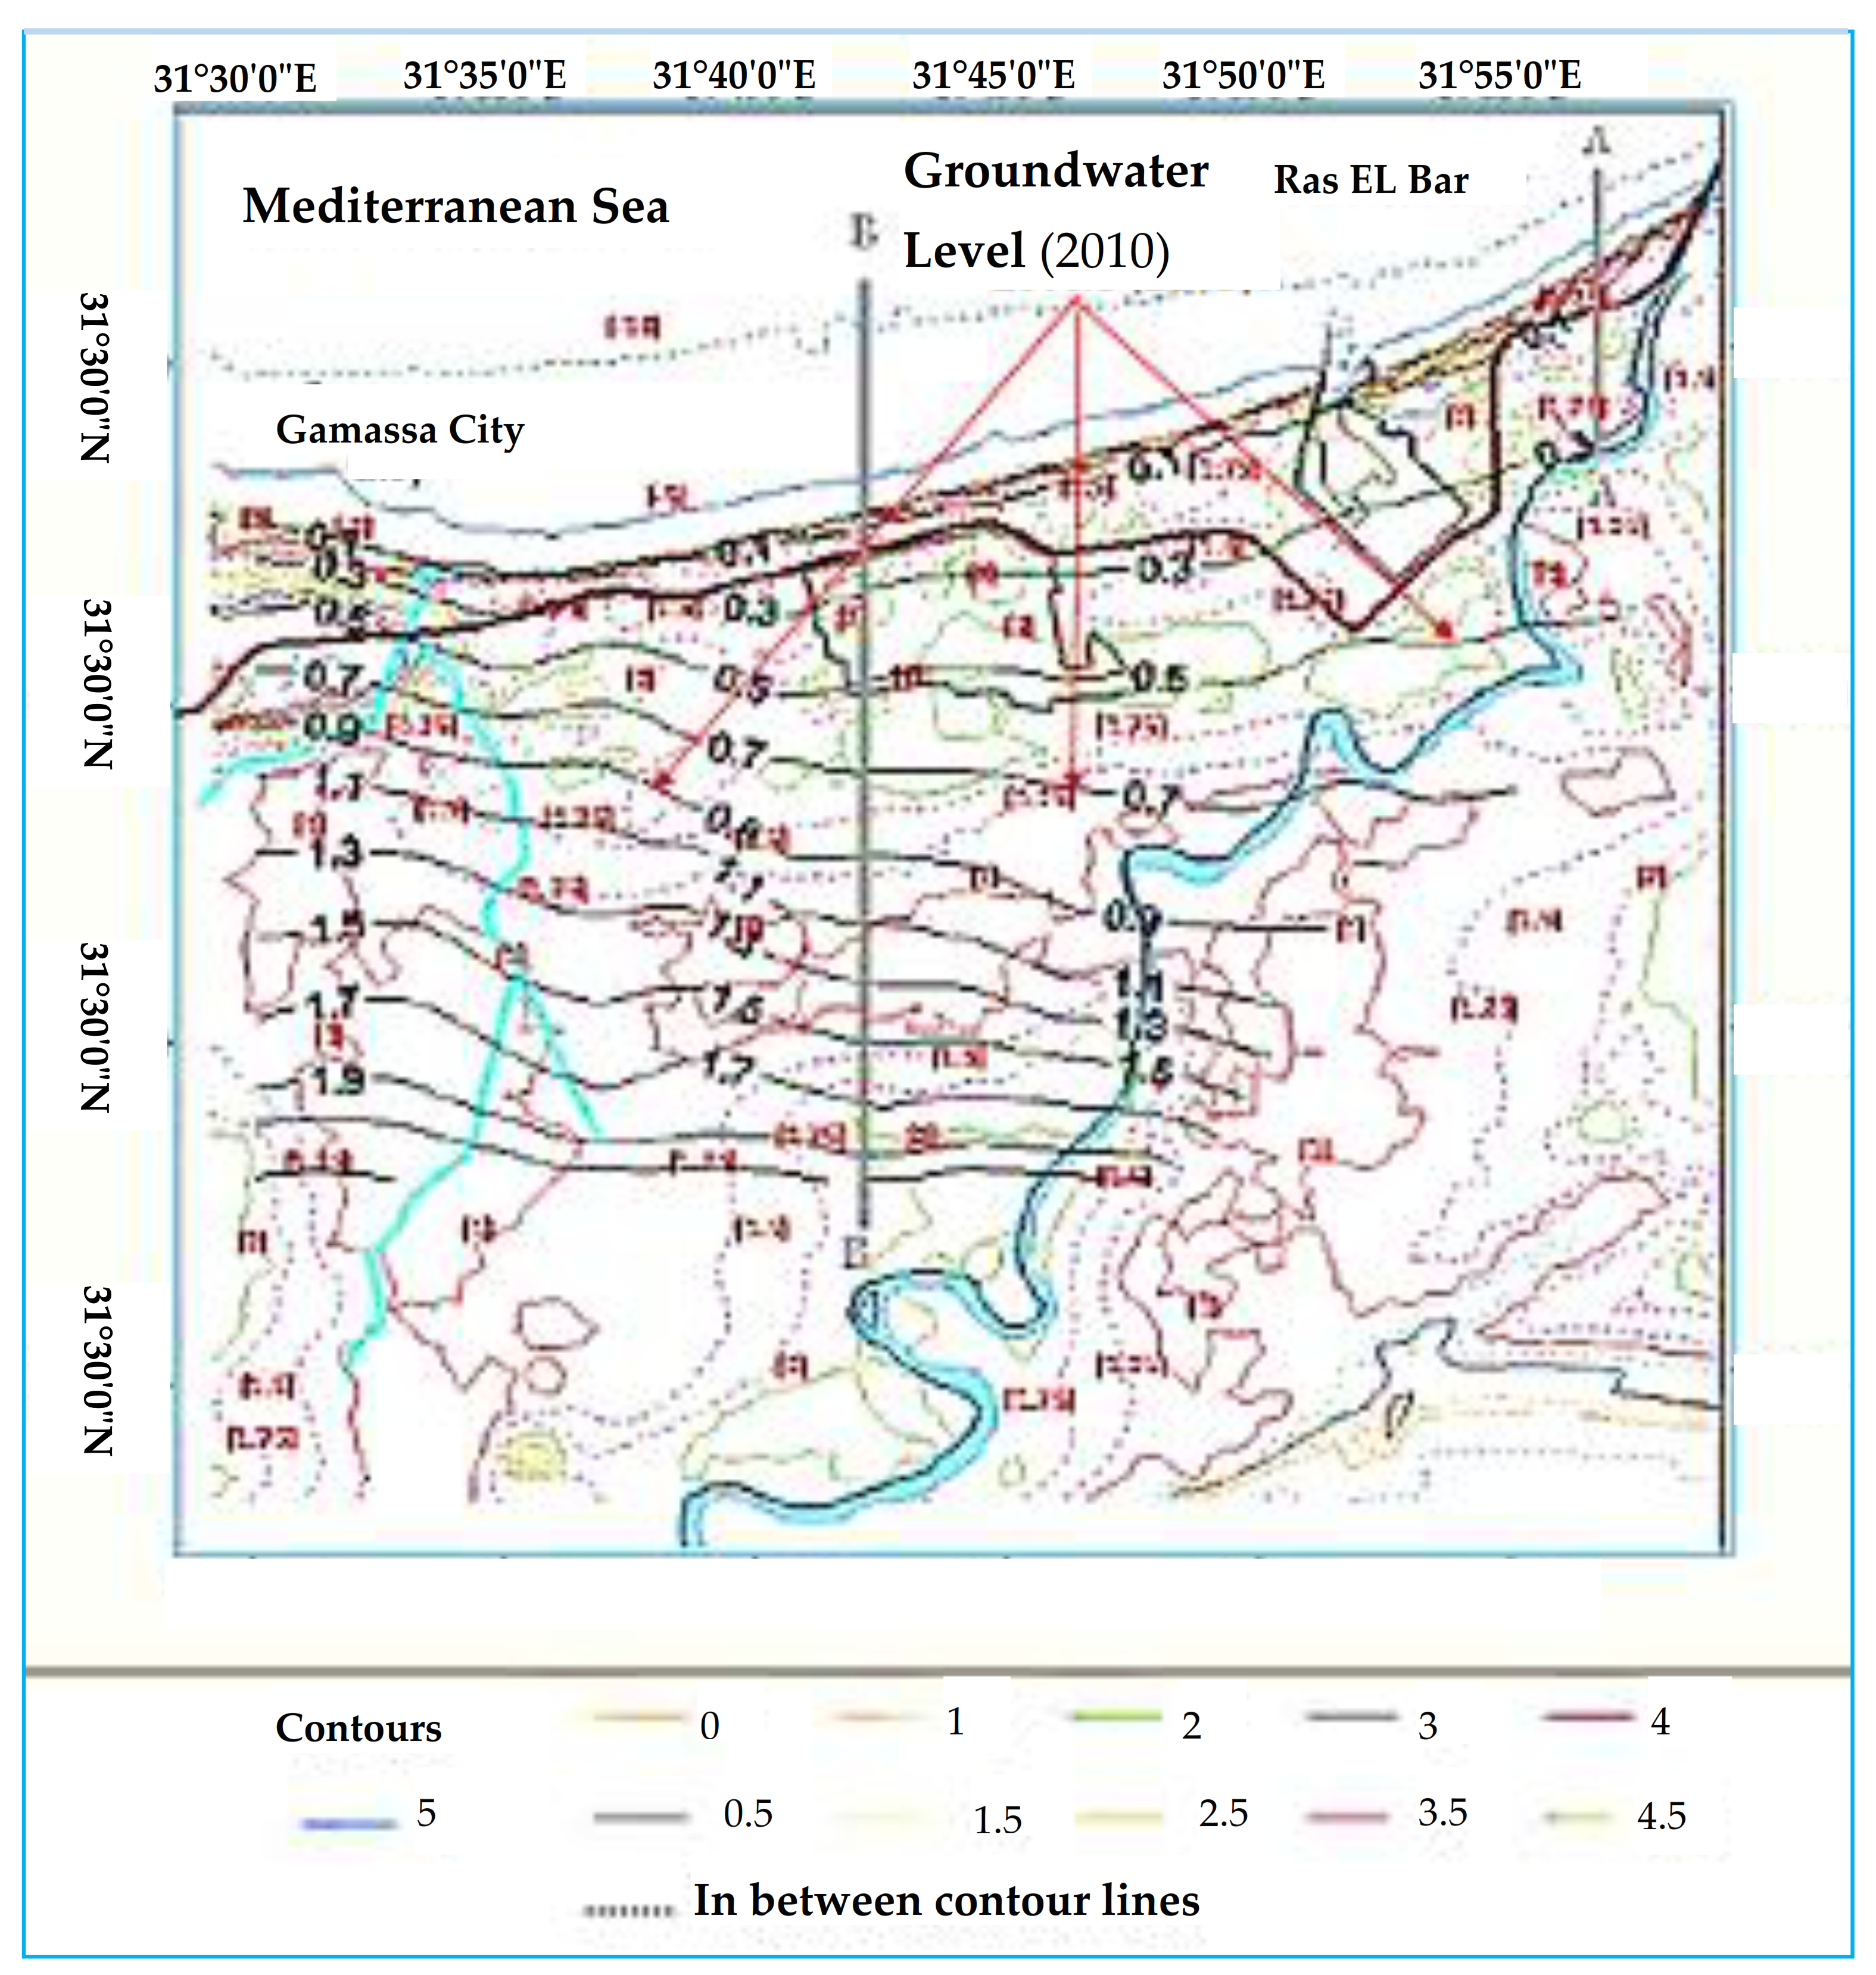
Figure 6.
Diagram of drainage infrastructure in the study area. Q indicates drainage discharge.
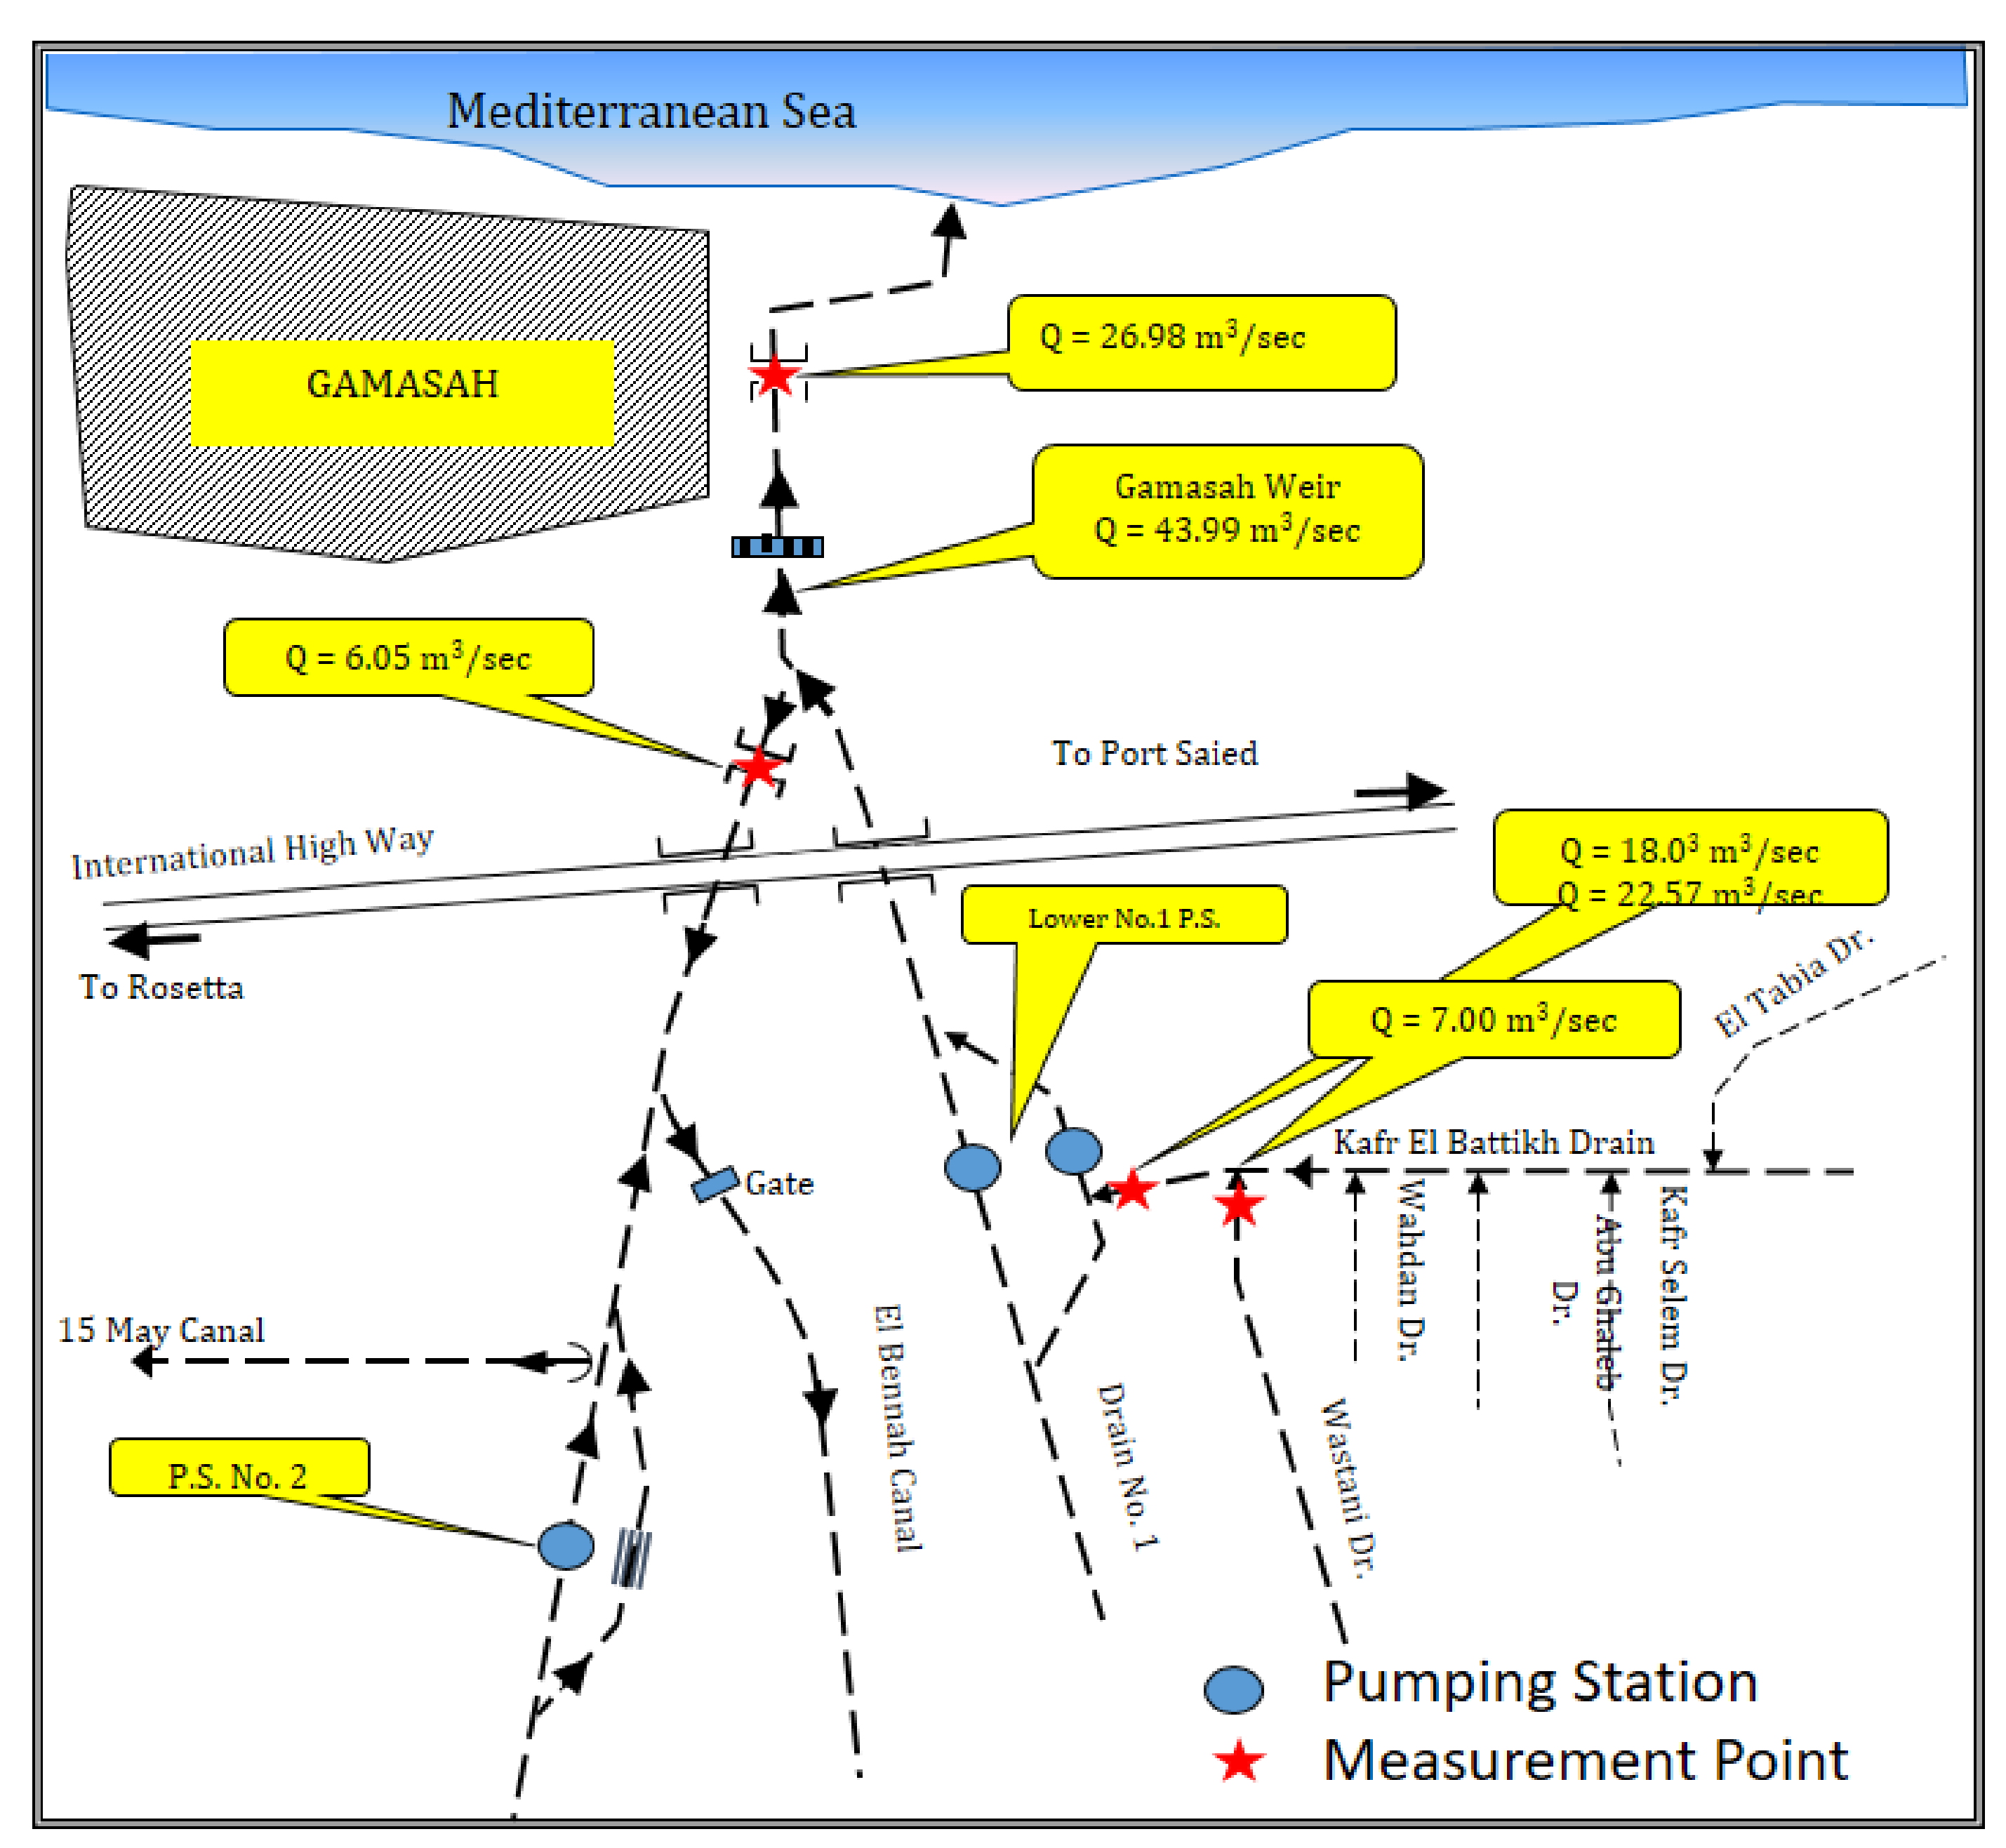
Figure 7.
Gamasa drain outfall to Mediterranean Sea (Gamasa Weir Site). Abbreviations: B. Sl., bed slope; S.A., served area; water drained, (W.D.) (m3/fed./d); water slope (W. Sl.).
Figure 7.
Gamasa drain outfall to Mediterranean Sea (Gamasa Weir Site). Abbreviations: B. Sl., bed slope; S.A., served area; water drained, (W.D.) (m3/fed./d); water slope (W. Sl.).
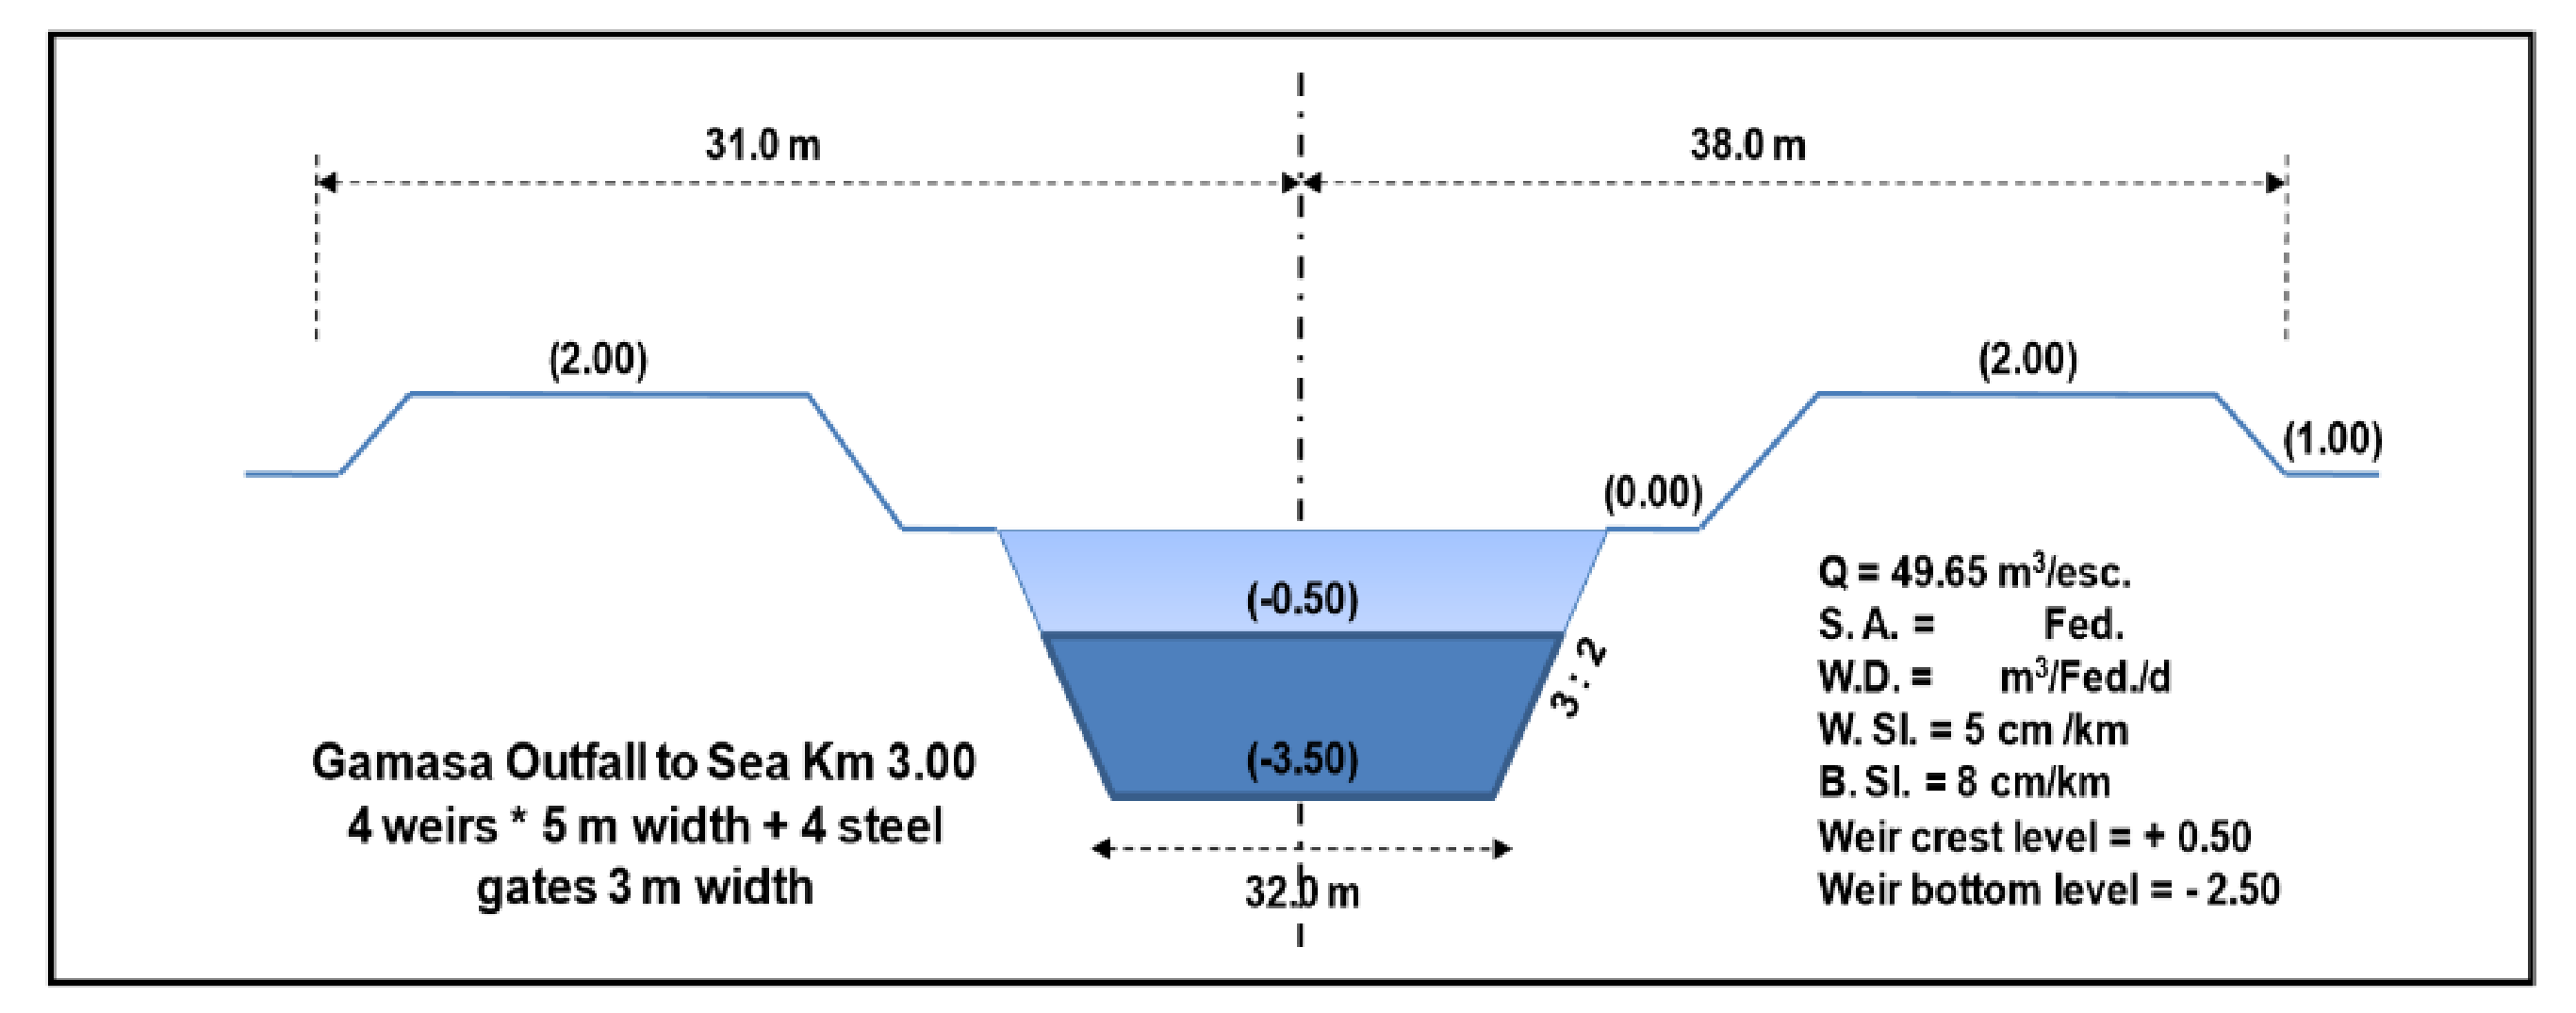
Figure 8.
Projected inundation areas by 2100.

Figure 9.
Predicted shoreline changes from 2010 until 2100 in the Gamasa-Ras El Bar area.

Figure 10.
Areas affected by groundwater levels by 2100.
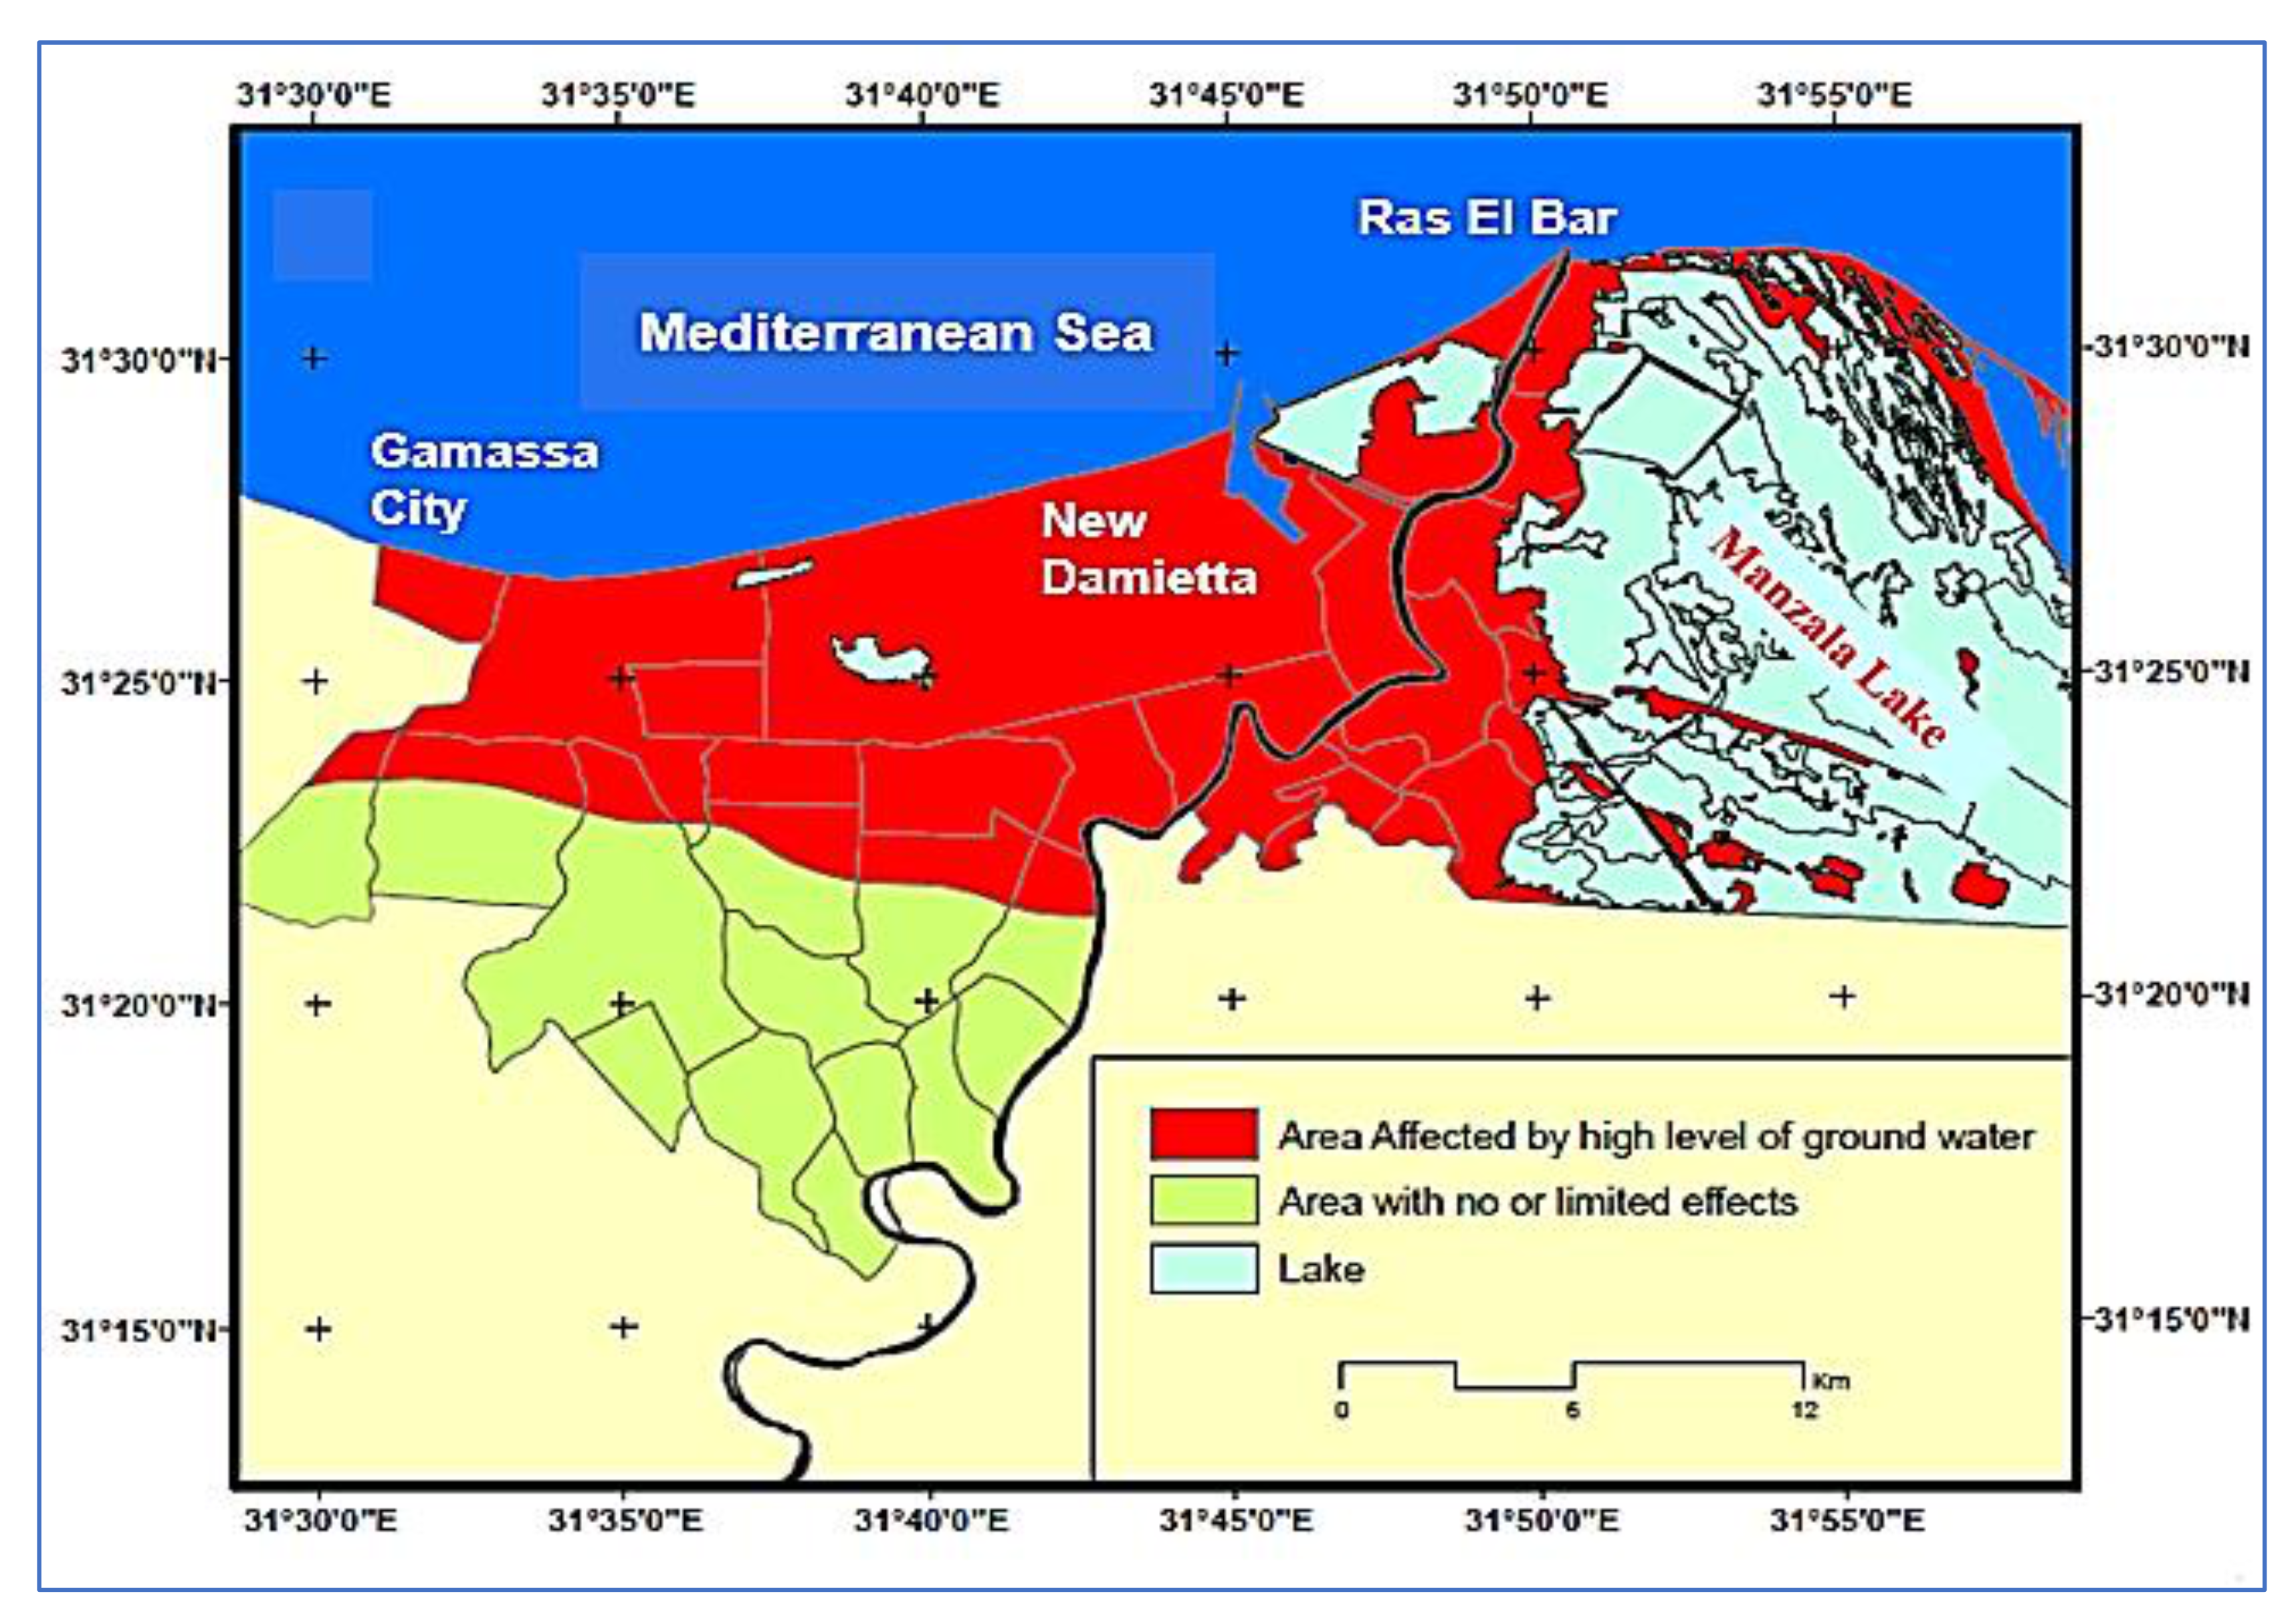
Figure 11.
Land and human settlements affected by rising groundwater levels, 2100.


Table 1.
Projected temperature increase and calculated local sea level rise (SLR) according to UN Intergovernmental Panel on Climate Change (IPCC) scenarios.
Table 1.
Projected temperature increase and calculated local sea level rise (SLR) according to UN Intergovernmental Panel on Climate Change (IPCC) scenarios.
| IPCC Scenario | Projected Temperature Increase (°C) and Local SLR (cm) | |||||||
|---|---|---|---|---|---|---|---|---|
| 2025 | 2050 | 2075 | 2100 | |||||
| T (C) | SLR | T (C) | SLR | T (C) | SLLR | T (C) | SLR | |
| B1 | 0.7 | 4.75 | 1.2 | 11.5 | 1.6 | 20.25 | 1.8 | 24 |
| A1T | 0.7 | 5.75 | 1.4 | 15.5 | 2.1 | 24.25 | 2.5 | 31 |
| B2 | 0.8 | 5.75 | 1.7 | 12.5 | 2.2 | 21.75 | 2.4 | 30 |
| A1B | 0.8 | 5.75 | 1.6 | 12.5 | 2.4 | 24.25 | 2.8 | 33 |
| A2 | 0.7 | 5.75 | 1.4 | 12.5 | 2.6 | 24.25 | 3.5 | 37 |
| A1F1 | 0.8 | 5.75 | 1.6 | 15.5 | 2.8 | 27.25 | 4.0 | 43 |
Table 2.
Projected SLR (cm) in the study area relative to 1990 sea levels.
| IPCC Scenario | Projected SLR (cm) | |||
|---|---|---|---|---|
| 2025 | 2050 | 2075 | 2100 | |
| B1 | 10.75 | 19.5 | 32.5 | 54 |
| A1T | 10.75 | 26 | 48.75 | 61.75 |
| B2 | 14 | 35.75 | 52 | 58.5 |
| A1B | 14 | 32.5 | 55.5 | 65.5 |
| A2 | 10.75 | 26 | 58 | 70.25 |
| A1F1 | 14 | 32.5 | 59.5 | 73 |
Table 3.
Wave characteristics in 1998 and 2010.
| Wave Climate | 1998 | 2010 |
|---|---|---|
| Significant Wave Height | 0.94 (m) | 1.31 (m) |
| Average Wave Height | 0.5 (m) | 0.76 (m) |
| Predominant Wave Direction | North Northwest (NNW) | Northwest (NW) |
| Average Storm Height | 2.75 (m) | 2.46 (m) |
| Total Durations of Storms | 1.6 day/year | 3.5 day/year |
| Predominant Storm Direction | North (N) | North West (NW) |
Table 4.
Directional distribution of analyzed wave samples for each wave sector.
| Duration | Wave Sector | ||||||||
|---|---|---|---|---|---|---|---|---|---|
| W | WNW | NW | NNW | N | NNE | NE | ENE | E | |
| 1997–1999 | - | 0.7% | 18% | 41% | 21% | 10.5% | 6.5% | 1.5% | 0.8% |
| 2009–2010 | 4.3% | 13.5% | 33% | 15% | 9.3% | 10.2% | 10% | 3.2% | 3.5% |
Table 5.
Projected groundwater levels and areas affected by 2100.
| Locality | GW 1 Levels (m) amsl 2 | Affected Area (km2) | Locality | GW Levels (m) amsl | Affected Area (km2) | ||
|---|---|---|---|---|---|---|---|
| 2010 | 2100 | 2010 | 2100 | ||||
| Ras El-Bar | 0.16 | 0.04 | 8.13 | Kafr Solayman | 1.40 | 0.69 | 0.00 |
| As-Sesaneyah | 0.22 | 0.04 | 8.48 | Kafr Abu Saad | 1.77 | 1.04 | 0.00 |
| New Damietta | 0.40 | 0.10 | 89.18 | Kafr El manazlah | 1.85 | 1.11 | 0.00 |
| Damietta | 0.50 | 0.12 | 21.84 | Mit Ab Ghaleb | 1.95 | 1.19 | 0.00 |
| Ar-Rakabeyah | 0.71 | 0.30 | 34.01 | Kfour Shehata | 2.09 | 1.33 | 0.00 |
| Gheit An0Nasara | 1.16 | 0.17 | 3.24 | As Sawalem | 2.20 | 1.42 | 0.00 |
| Kafr El-Batikh | 0.69 | 0.17 | 11.66 | Izbet El-Borg | 0.57 | 0.28 | 7.93 |
| Moheb-As-Sayala | 0.73 | 0.19 | 2.17 | Arriad | 0.78 | 0.20 | 10.54 |
| Abu-Bostan | 0.84 | 0.22 | 7.90 | Azahraa’ | 2.04 | 1.30 | 0.00 |
| Shat Eshoara | 0.74 | 0.19 | 2.39 | Om Erizk | 1.96 | 1.20 | 0.00 |
| Kafr Elmorabein E | 1.35 | 0.63 | 0.00 | Sheikh Dorgham | 0.37 | 0.11 | 12.34 |
| Kofour El-Ghab | 1.31 | 0.59 | 0,00 | Shat El-Khayatah | 0.46 | 0.12 | 8.80 |
| El-Mohamadeiah | 1.25 | 0.55 | 0.00 | Al Enanyah | 0.83 | 0.29 | 8.91 |
| Kafr El-Wastany | 1.51 | 0.78 | 0.00 | Al Basateen | 0.87 | 0.24 | 13.35 |
| Kafr Saad | 1.38 | 0.68 | 0.00 | Om El Reda | 0.72 | 0.18 | 6.90 |
| Izat Enahdah | 0.84 | 0.22 | 4.02 | El Abassia | 0.95 | 0.30 | 7.13 |
| Izab El-Basartah | 0.86 | 0.22 | 2.30 | Gamassa | 0.31 | 0.09 | 6.36 |
Total Area Affected by 2100 = 271.68 km2; 1 GW: groundwater; 2 ABSL: above mean sea level.
Table 6.
Impacts on open drain discharge by the year 2100.
|
Drain Name | Section Outlet Location (km) | Area Served (Feddan) | Designed Discharge (m3/d) | Additional Discharge (m3/d) | Expected Sec. Discharge (m3/d) | % of Additional Discharge |
|---|---|---|---|---|---|---|
| Drain1(Gamasa Outlet) | 0.05 | 105,000 | 26.6 | 0.32 | 26.92 | 1.2 |
| Kafr El-Batekh | 0.00 | 35,000 | 10.13 | 0.11 | 10.24 | 1.1 |
| Al Senanya | 0.00 | 2000 | 1.00 | 0.01 | 1.01 | 1.0 |
| Al Wastani | 0.00 | 12,000 | 5.97 | 0.04 | 6.01 | 0.7 |
| Al-Tabia | 4.80 | 2800 | 0.96 | 0.01 | 0.97 | 1.0 |
Publisher’s Note: MDPI stays neutral with regard to jurisdictional claims in published maps and institutional affiliations. |
© 2021 by the authors. Licensee MDPI, Basel, Switzerland. This article is an open access article distributed under the terms and conditions of the Creative Commons Attribution (CC BY) license (http://creativecommons.org/licenses/by/4.0/).
Share and Cite
MDPI and ACS Style
Elshinnawy, I.A.; Almaliki, A.H. Vulnerability Assessment for Sea Level Rise Impacts on Coastal Systems of Gamasa Ras El Bar Area, Nile Delta, Egypt. Sustainability 2021, 13, 3624. https://doi.org/10.3390/su13073624
AMA Style
Elshinnawy IA, Almaliki AH. Vulnerability Assessment for Sea Level Rise Impacts on Coastal Systems of Gamasa Ras El Bar Area, Nile Delta, Egypt. Sustainability. 2021; 13(7):3624. https://doi.org/10.3390/su13073624
Chicago/Turabian StyleElshinnawy, Ibrahim A., and Abdulrazak H. Almaliki. 2021. "Vulnerability Assessment for Sea Level Rise Impacts on Coastal Systems of Gamasa Ras El Bar Area, Nile Delta, Egypt" Sustainability 13, no. 7: 3624. https://doi.org/10.3390/su13073624
Note that from the first issue of 2016, this journal uses article numbers instead of page numbers. See further details here.