Article

Land Potential Assessment of Napier Grass Plantation for Power Generation in Thailand Using SWAT Model. Model Validation and Parameter Calibration

by
Kotchakarn Nantasaksiri
1,*,
Patcharawat Charoen-Amornkitt
2 and
Takashi Machimura
1
1
Division of Sustainable Energy and Environmental Engineering, Graduate School of Engineering, Osaka University, Suita, Osaka 565-0871, Japan
2
Institute of Engineering, School of Mechanical Engineering, Suranaree University of Technology, Muang Nakhon Ratchasima District, Nakhon Ratchasima 30000, Thailand
*
Author to whom correspondence should be addressed.
Energies 2021, 14(5), 1326; https://doi.org/10.3390/en14051326
Submission received: 16 January 2021 / Revised: 18 February 2021 / Accepted: 24 February 2021 / Published: 1 March 2021
(This article belongs to the Section A: Sustainable Energy)

Abstract

:
In Thailand, Napier grass is expected to play an important role as an energy resource for future power generation. To accomplish this goal, numerous areas are required for Napier grass plantations. Before introducing crops, the land potential of the country and the impact of crops on the environment should be assessed. The soil and water assessment tool (SWAT) model is very useful in investigating crop impacts and land potential. Unfortunately, the crop growth parameters of Napier grass are yet to be identified and, thus, conducting effective analysis has not been possible. Accordingly, in this study, parameter calibration and SWAT model validation of Napier grass production in Thailand was carried out using datasets from eight sites with 93 samples. Parameter sensitivity analysis was performed prior to parameter calibration, the results of which suggest that the radiation use efficiency and potential harvested index are both highly sensitive. The crop growth parameters were calibrated in order of their sensitivity index ranking, and the final values were obtained by reducing the root mean square error from 10.77 to 1.38 t·ha−1. The validation provides satisfactory results with coefficient of determination of 0.951 and a mean error of 0.321 t·ha−1. Using the developed model and calibrated parameters, local Napier grass dry matter yield can be evaluated accurately. The results reveal that, if only abandoned area in Thailand is used, then Napier grass can provide roughly 33,600–44,900 GWh of annual electricity, and power plant carbon dioxide (CO2) emissions can be reduced by approximately 21.2–28.3 Mt-CO2. The spatial distribution of estimated yield obtained in this work can be further utilized for land suitability analysis to help identify locations for Napier grass plantations, anaerobic digesters, and biogas power plants.

1. Introduction

The average amount of atmospheric carbon dioxide (CO2) increases every year due to the use of fossil fuels in energy production, resulting in the current problems associated with climate change. At present, the planet’s temperature is higher than it has ever been over the past 12,000 years [1]. Moreover, the world’s energy consumption is increasing annually, which, in the near future, will result in a severe energy crisis. To help reduce over consumption of energy and the rising planet temperature, improving energy converters [2], fuels [3,4], and characterization methods for electrochemical systems is essential [5,6,7]. Thailand in particular is at risk of energy-related catastrophe, since nearly 60% of its energy sources used to generate electricity are based on natural gas [8], and a heavy reliance on one energy source may cause some problems. Therefore, renewable energy dependency should be cultivated to reduce the use of conventional energy. As of 2020, the proportion of electricity produced from renewable energy is approximately 20% of the total electrical production capability of Thailand [8]. Moreover, more than 24% of the energy generated from renewable energy is obtained from biogas and biomass, a figure that is increasing every year.
Napier grass (Cenchrus purpureus (Schumach.) Morrone; formerly Pennisetum purpureum Schumach.) is a promising energy crop and has gained attention from Thailand’s Ministry of Energy due to its growth rate and high methane content [9]. Napier grass was introduced to Thailand in 1929 as animal feed. The tropical climate of Thailand with precipitation >1000 mm·year−1 suits Napier grass production, as the grass would fail to grow if the ambient temperature were lower than 15 °C [10]. To implement Napier grass as a new feedstock for electricity generation in Thailand, assessing the land potential before planting takes place is necessary.
Many models exist to estimate the land potential of crops, but a dynamic crop model is the most promising [11]. Over the past few decades, the dynamic crop models used for calculating the interaction between environment and management practices to reveal crop performance gained serious attention. Various dynamic crop models can be used to simulate the growth and development of crops, such as the environmental policy integrated climate (EPIC) model, the ALMANAC model, the Agro-BGC model, and the soil and water assessment tool (SWAT) model. The SWAT model can assess the long-term impact of land use for various crops [12,13]. Moreover, it is an open-source tool, which means it is more flexible than the other models [14,15,16], and it also exhibits a user-friendly graphic user interface. For SWAT, crops are categorized into seven groups (e.g., perennial crops, trees, and warm- and cold-season annual legumes), which require different models for growth simulation. In addition, these growth simulation models require more than 30 specific parameters related to the plant of interest.
In the SWAT database, 120 crops are provided with the relevant parameters, but Napier grass is not available. Therefore, performing land suitability analysis to find locations for Napier grass plantations, anaerobic digesters, and biogas power plants, all of which are important for Napier grass supply chains, is not possible. Although some of the parameters can be collected from previous studies, they do not cover all the software requirements. Therefore, calibration is necessary to obtain the set of parameters for the crop in question. Unfortunately, according to Dumont et al. [13], in crop models, parameter calibration is not straightforward, since the majority of equations used in the models are non-linear, coupled, and hierarchical. Not only that, but the number of parameters undergoing the process of optimization is also important. To indicate the number of influencing parameters, sensitivity analysis is conducted through simulations [17,18,19,20,21,22,23].
The main objective of this study was to evaluate the land potential for Napier grass plantation in Thailand using the SWAT model under different climatic and soil conditions across the country. This is to ensure the possibility of using Napier grass as a new energy feedstock in Thailand. To apply the model, the parameters specific to Napier grass are required. However, to the best of our knowledge, these parameters have never been available in the study area. Sensitivity analysis and parameter calibration were carried out using the root mean square error (RMSE) of yield as a criterion to obtain the parameters. To ensure that the parameters are realistic, a range of parameters obtained from previous studies was also considered in the calibration process. The time-series biomass growth calculated using the optimized parameters was validated with the biomass yield obtained from experimental surveys over 10 years. The model was further applied to estimate the overall energy supply potential of Napier grass when planted on abandoned croplands in Thailand. The obtained results can be further used for suitability analysis to examine sites for Napier grass plantations, anaerobic digesters, and biogas power plants.

2. Materials and Methods

2.1. The Soil and Water Assessment Tool and the Procedure for Parameter Selection

The SWAT model was developed by the Agricultural Research Service and Texas A&M University [24]. In this study, the model was run in ArcMAP 10.1 (ESRI Inc., Redlands, CA, USA) via the SWAT model user interface called ArcSWAT [24]. This model is a watershed-based model that simulates the impact of land management practices on water sediment and agricultural chemical yield over time. It considers the loads of any given area, i.e., hydrological cycle, nutrient, pesticides, and crop growth. Unique load combinations within sub-basin boundaries were generated based on soil map and land cover, called the hydrological response unit (HRU), which is a homogeneous physical property. In addition to the primary land conditions, specific inputs such as crop parameters and management practices were obtained for each HRU to examine the land load conditions.
The SWAT model operates on a daily timestep. It provides many components for simulations, such as weather simulation, hydrology, nutrient cycling, and plant growth. In this study, the main concern is crop yield prediction. Thus, only parameters related to biomass growth were considered. The crop growth calculation in the SWAT model [24] is based on the EPIC plant growth model developed by Monteith [25]. The model is capable of simulating crops such as legumes, perennials, and trees, with each crop demonstrating unique model parameter values. It also simulates leaf area development and light interception. These outputs were converted into biomass growth based on species-specific radiation-use efficiency. In this process, it is important to exhibit accurate parameters to obtain realistic outputs.
In the SWAT model, the daily solar radiation intercepted by the crop leaves was estimated using Beer’s law [24]:
H p h o s y n = 0.5 H d a y ( 1 exp ( k t L A I ) )
where H p h o s y n is the intercepted photosynthetically active radiation (MJ·m2), H d a y is the total solar radiation (MJ·m2), k t is the light extinction coefficient, and L A I is the leaf area index.
Daily total dry biomass growth was calculated by Equation (2) [24], which is the product of intercepted photosynthetically active radiation and radiation-use efficiency for the crop in question.
Δ b i o = B I O _ E H p h o s y n
where Δ b i o is the total biomass growth on a given day (kg·ha−1) and B I O _ E is the radiation-use efficiency (kg·ha−1)/(MJ·m2).
In Equations (1) and (2), the only unknowns are L A I and B I O _ E . L A I exhibits subsequent effects on the total amount of H p h o s y n and Δ b i o estimation. However, calculating the L A I curve is not straightforward, since many parameters are involved. These parameters are not only used for L A I calculation, but are also closely tied to the other equations. Moreover, they can also be used to evaluate the potential harvest index, which directly affects biomass yield. By studying the set of equations related to crop growth, eight unique parameter sets were identified. These parameters were provided by Gil et al. [26] with respect to Napier grass dry matter yield (DMY) for bioethanol production in Veracruz, Mexico. We preliminarily attempted to apply this set of parameters, including the potential heat unit (PHU), to estimate the Napier grass DMY in Thailand, but the results show overly high outcomes for biomass yield production as well as different harvesting schedules, as shown in Figure 1. This can be attributed to the different growing conditions of each country, which affected the PHU for crop growth. PHU is the accumulated heat unit required for plant maturity; it is a major indicator of when to harvest biomass. However, even when the harvesting schedule was used as in the survey (e.g., the biomass was harvested around every 70 days), the simulated yield was still be two times higher than the observed yield. To accurately predict Napier grass DMY, the aforementioned parameters were calibrated, and, to ensure the calibration was realistic, a range of parameters was collected from various studies [26,27,28,29,30]. Table 1 provides the parameters (and their ranges) calibrated in this study.

2.2. Data Sources and Model Setup

The input data of this study are listed in Table 2. At first, a digital elevation model (DEM) was used to determine slope, slope length and the stream network of each basin. The DEM data were derived from CGIAR CSI [32] with the resolution of 90 m. After obtaining the topography map, the data of soil, slope, and land cover were integrated to examine the condition of HRU. The land cover data were obtained from GlobCover 2009 [33] provided by European Space Agency (ESA) and the land cover map developed by the Land Development Department (LDD) of Thailand. The GlobCover2009 contained only forest and agricultural data. However, it lacks local land use data. Therefore, data from the LDD were integrated with the data from ESA to locate abandoned and urban area in Thailand. Historical weather data, including the daily data of maximum and minimum temperature, precipitation, solar radiation, and wind speed, were obtained from the Thai Meteorological Department (TMD). However, it was found that, in some areas in Thailand, the data were not available. Therefore, the weather data from the National Centers for Environmental Prediction (NCEP) [34] as suggested by SWAT model were used in those areas instead. The reason for combining the data from those two sources was because the data from TMD provide a better resolution. Future weather data were generated by weather generator algorithm (dGEN) provided by the SWAT model. Soil data used in this work were obtained from FAO-UNESCO harmonized world soil database [35]. The soil map contained the data of soil components, soil hydrologic groups, and acidity and alkalinity level in soil.
The experimental data of Napier grass plantation used in the calibration and validation were obtained from the previous research published by Animal Nutrition Division (AND), Department of Livestock Development, Ministry of Agriculture and Cooperatives of Thailand, during 1993–2005 [31,36,37,38,39,40,41,42,43]. These works studied the effects of management practice on the growth of Napier grass. The studies were conducted all over Thailand except the southern area. In total, 93 samples were obtained from nine reports in eight provincial pilot plants.
To perform the simulation using SWAT model, all field operations were chronologically applied into the model. As mentioned above, the PHU was crucial for the harvesting schedule. Therefore, it needed to be calculated to obtain the value which is unique for the grass growth in Thailand. To estimate for the PHU, the heating unit (HU) is required. HU is the difference of the average temperature for a day and the base temperature. In this work, the base temperature was assumed to be equal to the critical temperature below which Napier grass would not fully grow. Based on the suggestion of Kiyothong [10], the critical temperature for Napier grass is 15 °C. The calculated HU was summed from the first to the last days of a harvesting cycle to obtain the PHU of each pilot plant. The PHUs of eight pilot plants were later averaged resulting in 1300 °C as an input of the model. This value was set to be constant for all simulations throughout Thailand. Planting density was set between 4 and 6 plants·m−2 depending on the sites. Similar to the studies from AND, the samples were categorized into four groups according to the level of N-fertilizer application: 0 kg-N·ha−1 (Con), 125 kg-N·ha−1 (T1), 250 kg-N·ha−1 (T2), and 500 kg-N·ha−1 (T3).

2.3. Sensitivity Analysis, Parameter Calibration and Model Validation

As mentioned above, SWAT model provides many components for simulation which made numerous input parameters theoretically. Even though all parameters should be treated equally, this would result in an unrealistically high number of simulations. It might also lead to impractical computational loads [44,45]. Accordingly, the number of parameters was limited. Since our focus is on crop growth, only the eight crop growth parameters listed in Table 1 were considered. Prior to conducting the parameter calibration, sensitivity analysis was performed to assess the sensitivity level of each parameter with respect to predicting biomass yield. To do so, the relative sensitivity index ( S r ) was used [46,47]:
S r = I i n O i n O O i n I I i n
where I is the model input parameter, O is the model output, and the subscript i n refers the initial value of the parameters. A high index value means that the model outputs are sensitive to the input parameters. Lenhart et al. [48] suggested that indexes of 0.0–0.05, 0.05–0.20, 0.20–1.00, and >1.00 demonstrate negligible, medium, high, and very high sensitivity, respectively.
To identify the parameter sensitivity, only one parameter was changed at a time to estimate the model response; the other parameters were kept constant. The sensitivity analysis was conducted by modifying the parameters within the range given in Table 1. The initial values were obtained from Gil et al. [26]. The output from this analysis helped with respect to decreasing the number of parameters requiring calibration. The RMSE of yield was used for an object function in the parameter calibration process. Hence, the criterion for calibrating parameters involved identifying the set of parameters that minimizes the RMSE. All 93 datasets were used for parameter calibration. The model performance was evaluated using statistical analysis. This involved applying the RMSE, mean error (ME), and coefficient of determination (R2) to the model outputs, which are rarely used to evaluate model performance [28].

2.4. Land potential Evaluation and Estimation of Energy Supply Potential by Napier Grass Biomass in Thailand

To analyze the primary potential of Napier grass in Thailand, only abandoned areas were selected for plantation sites. The location of abandoned areas in Thailand was obtained from LDD for 2009–2014. The simulated Napier grass DMY from the SWAT model was used in the GIS analysis, which was conducted using ArcMap 10.1. The obtained result is the spatial distribution of biomass yield, which was further utilized in estimating the Napier grass-derived energy supply potential by assuming that all yields obtained from abandoned croplands can be utilized as feedstock in power generation. Thailand was categorized into six geographical regions, as suggested by the National Geographical Committee: central, eastern, northeastern, northern, western, and southern regions. The derived energy supply potential was compared with the statistical data of electric consumption provided by EGAT [8].
Simulations were conducted to evaluate the land potential for Napier grass plantations using the SWAT model in Thailand. To do so, eight unique parameters for Napier grass growth were required. Sensitivity analysis was performed to evaluate the sensitivity level of the parameters, and the obtained sensitivity level was used to rank them according to changes in the Napier grass DMY.

3. Results and Discussion

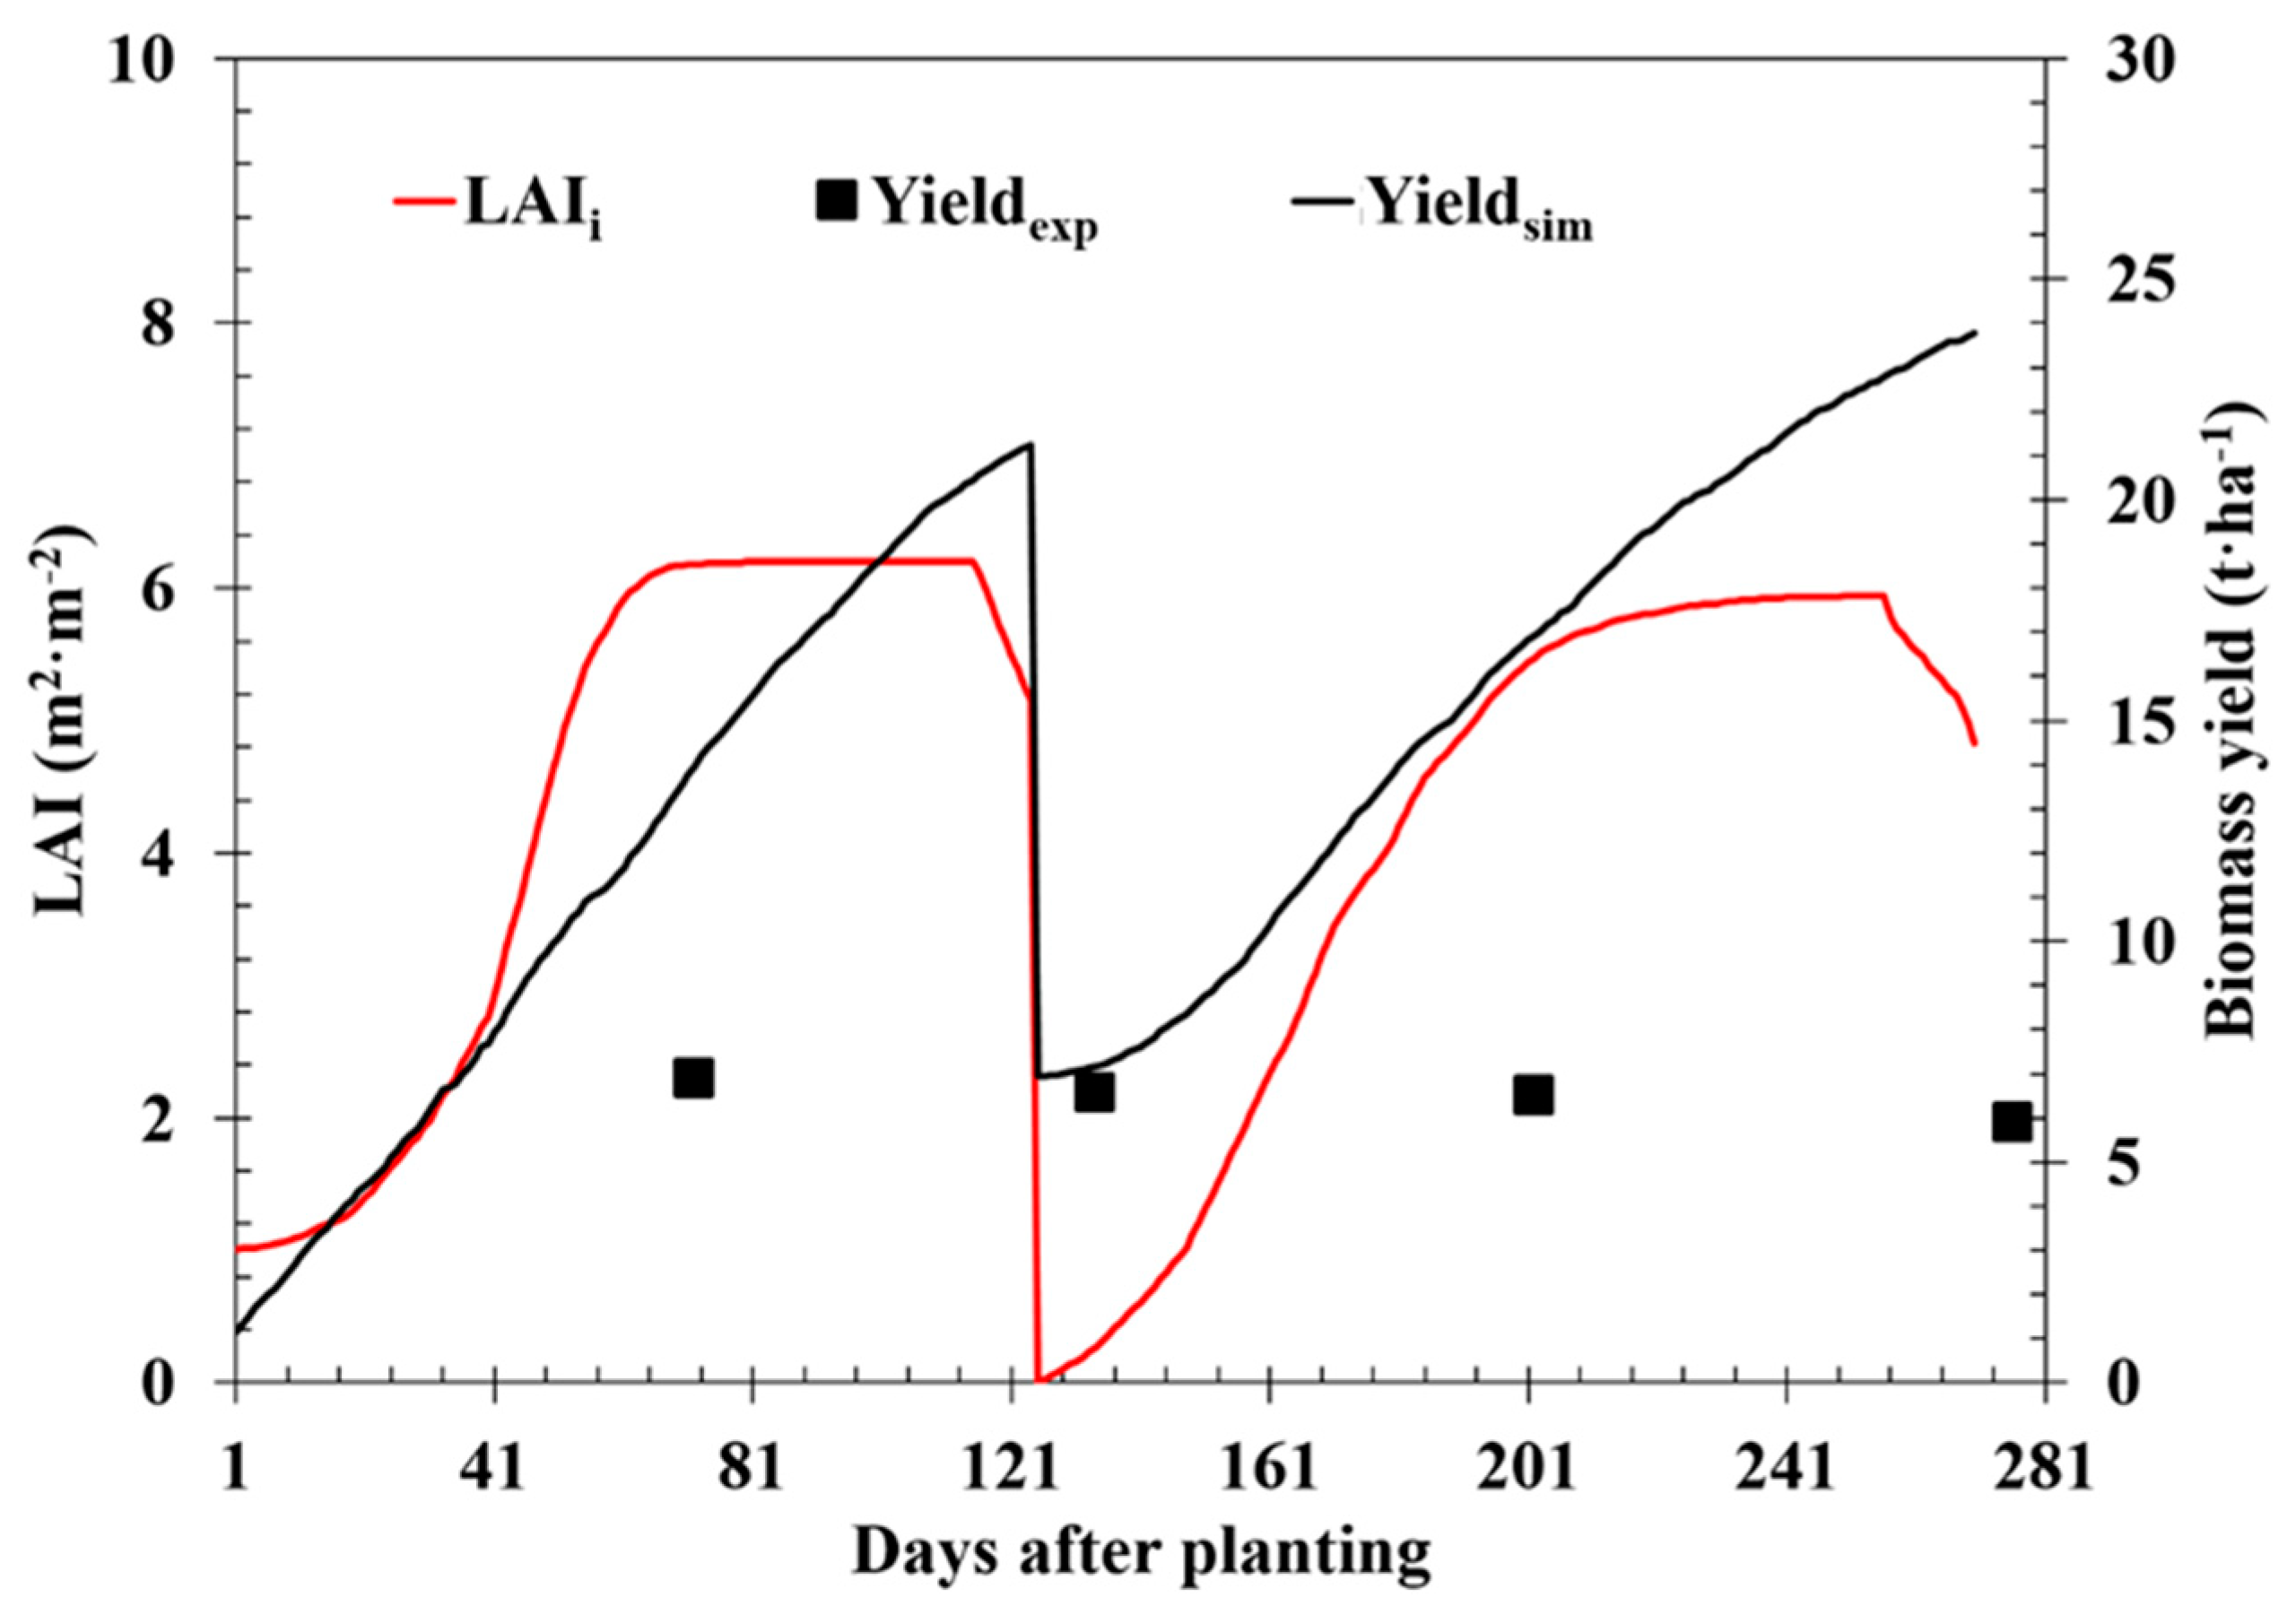
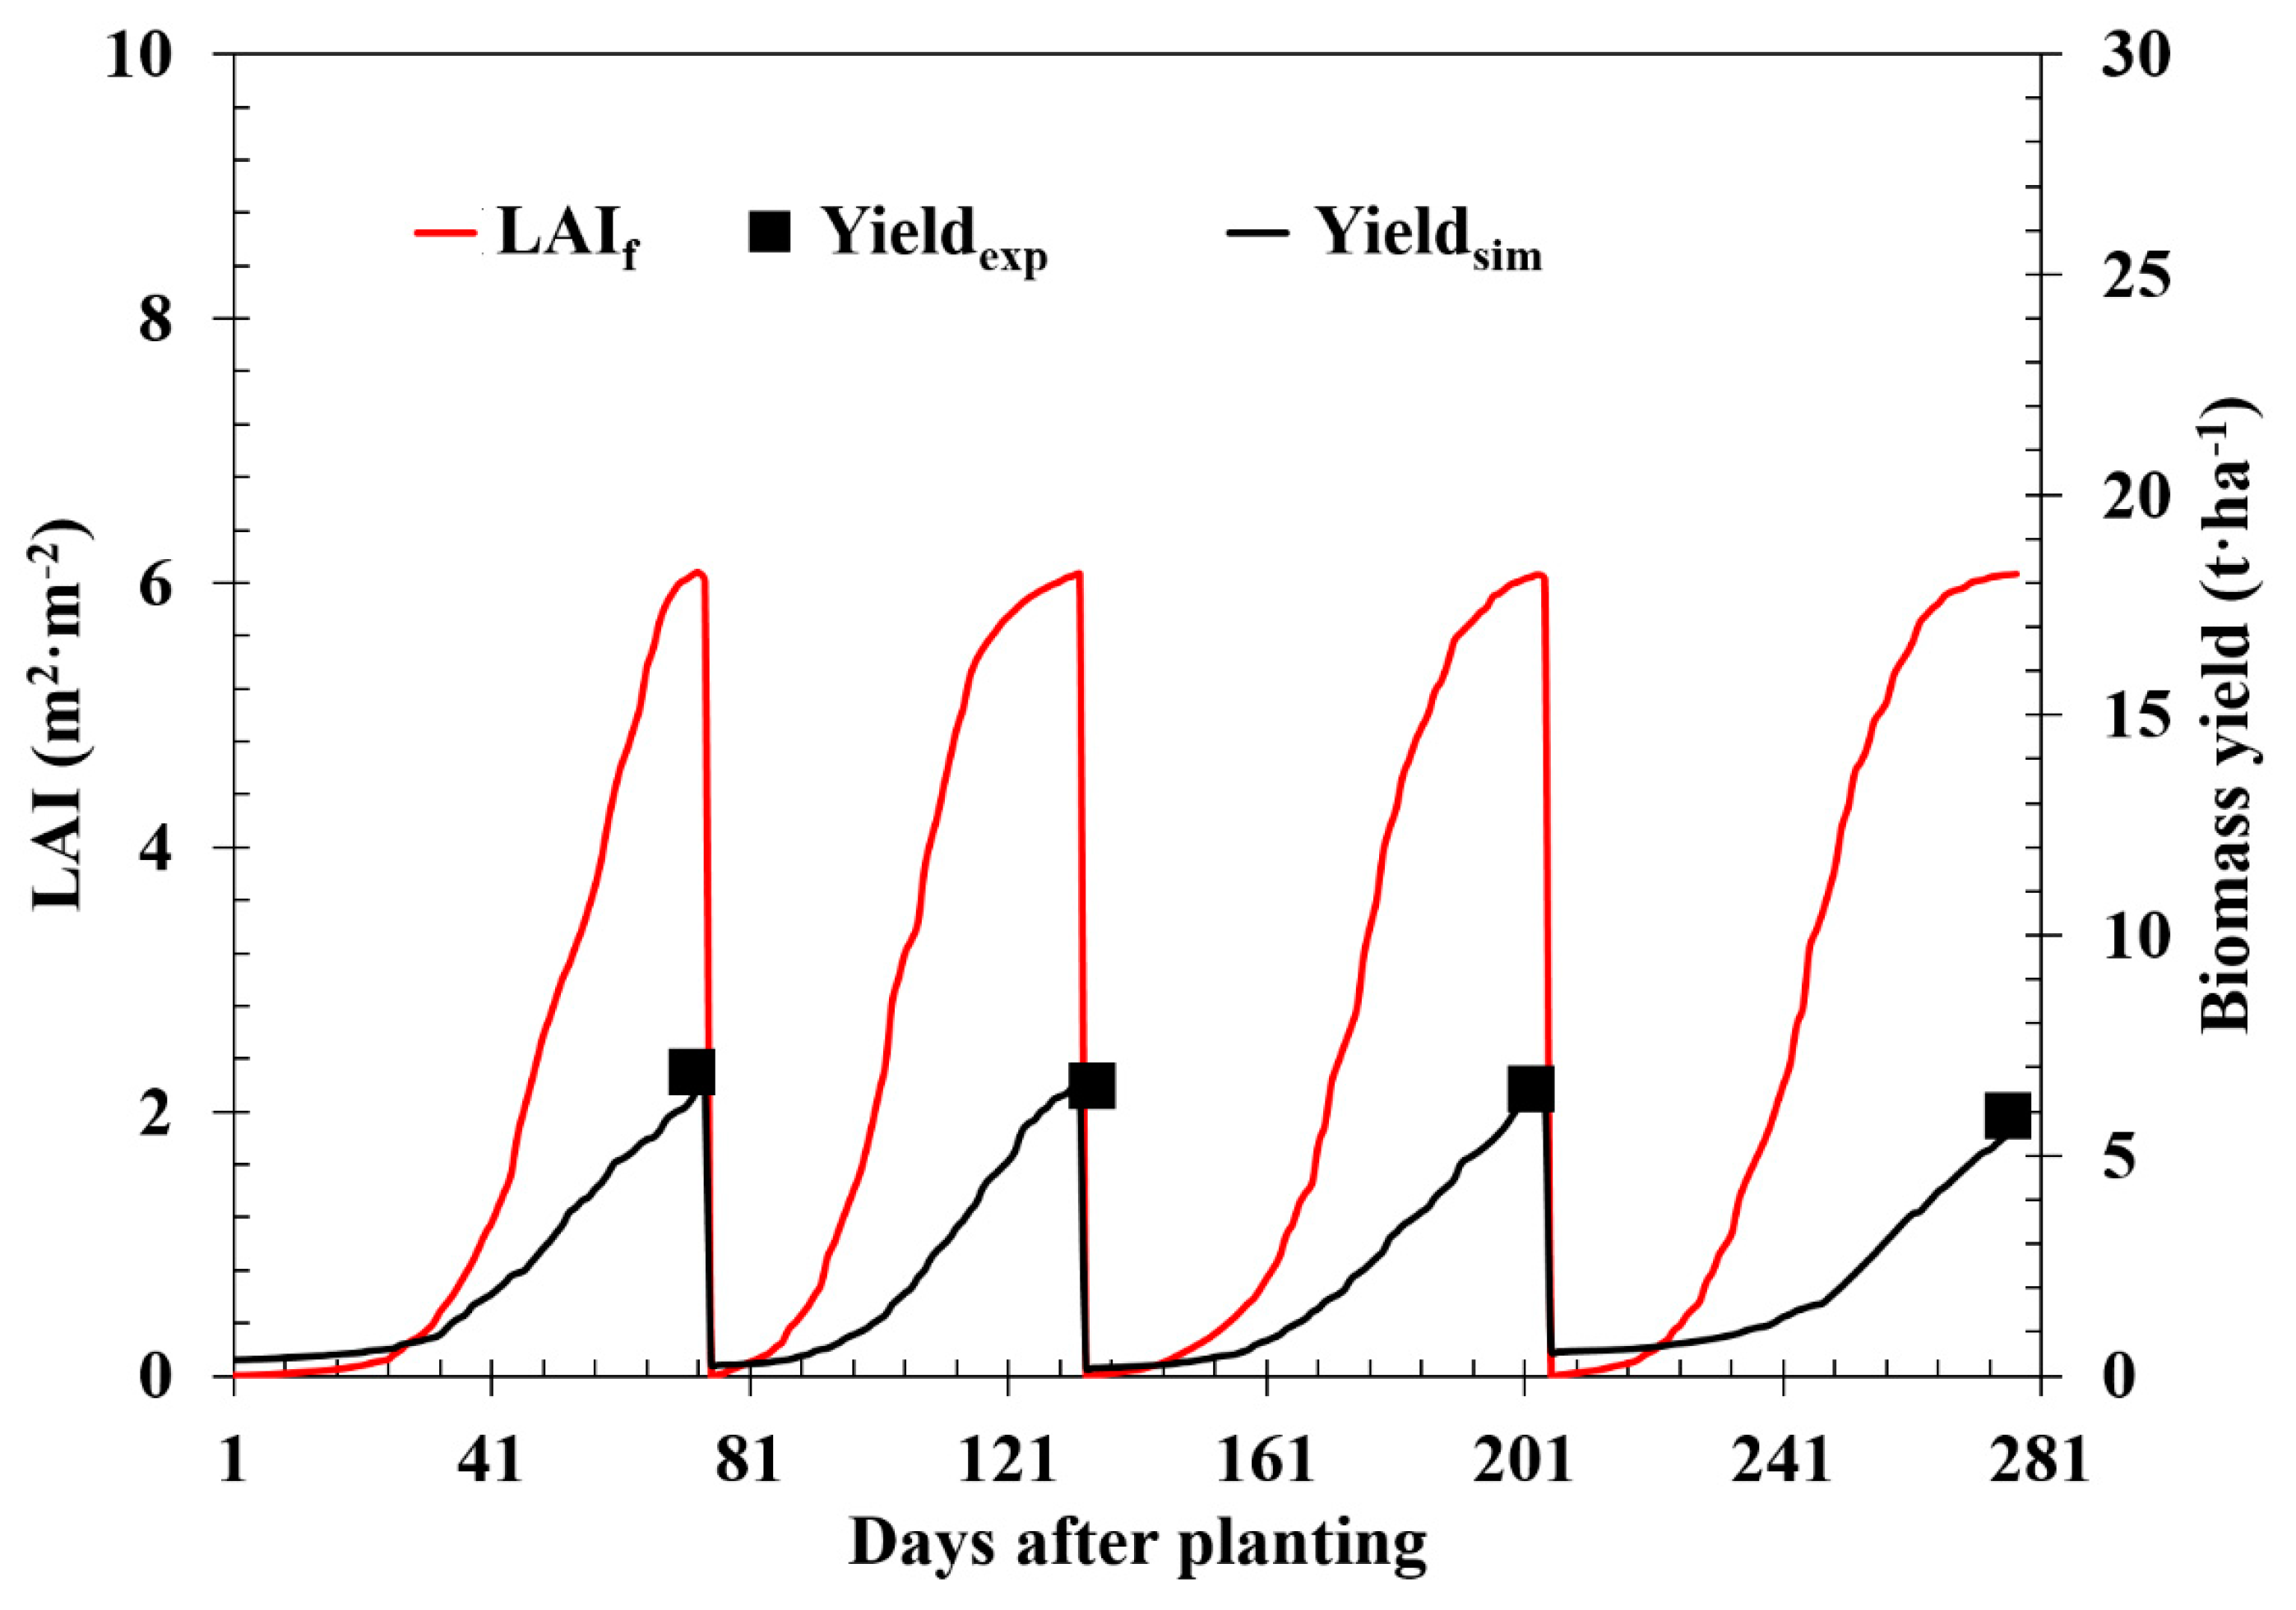
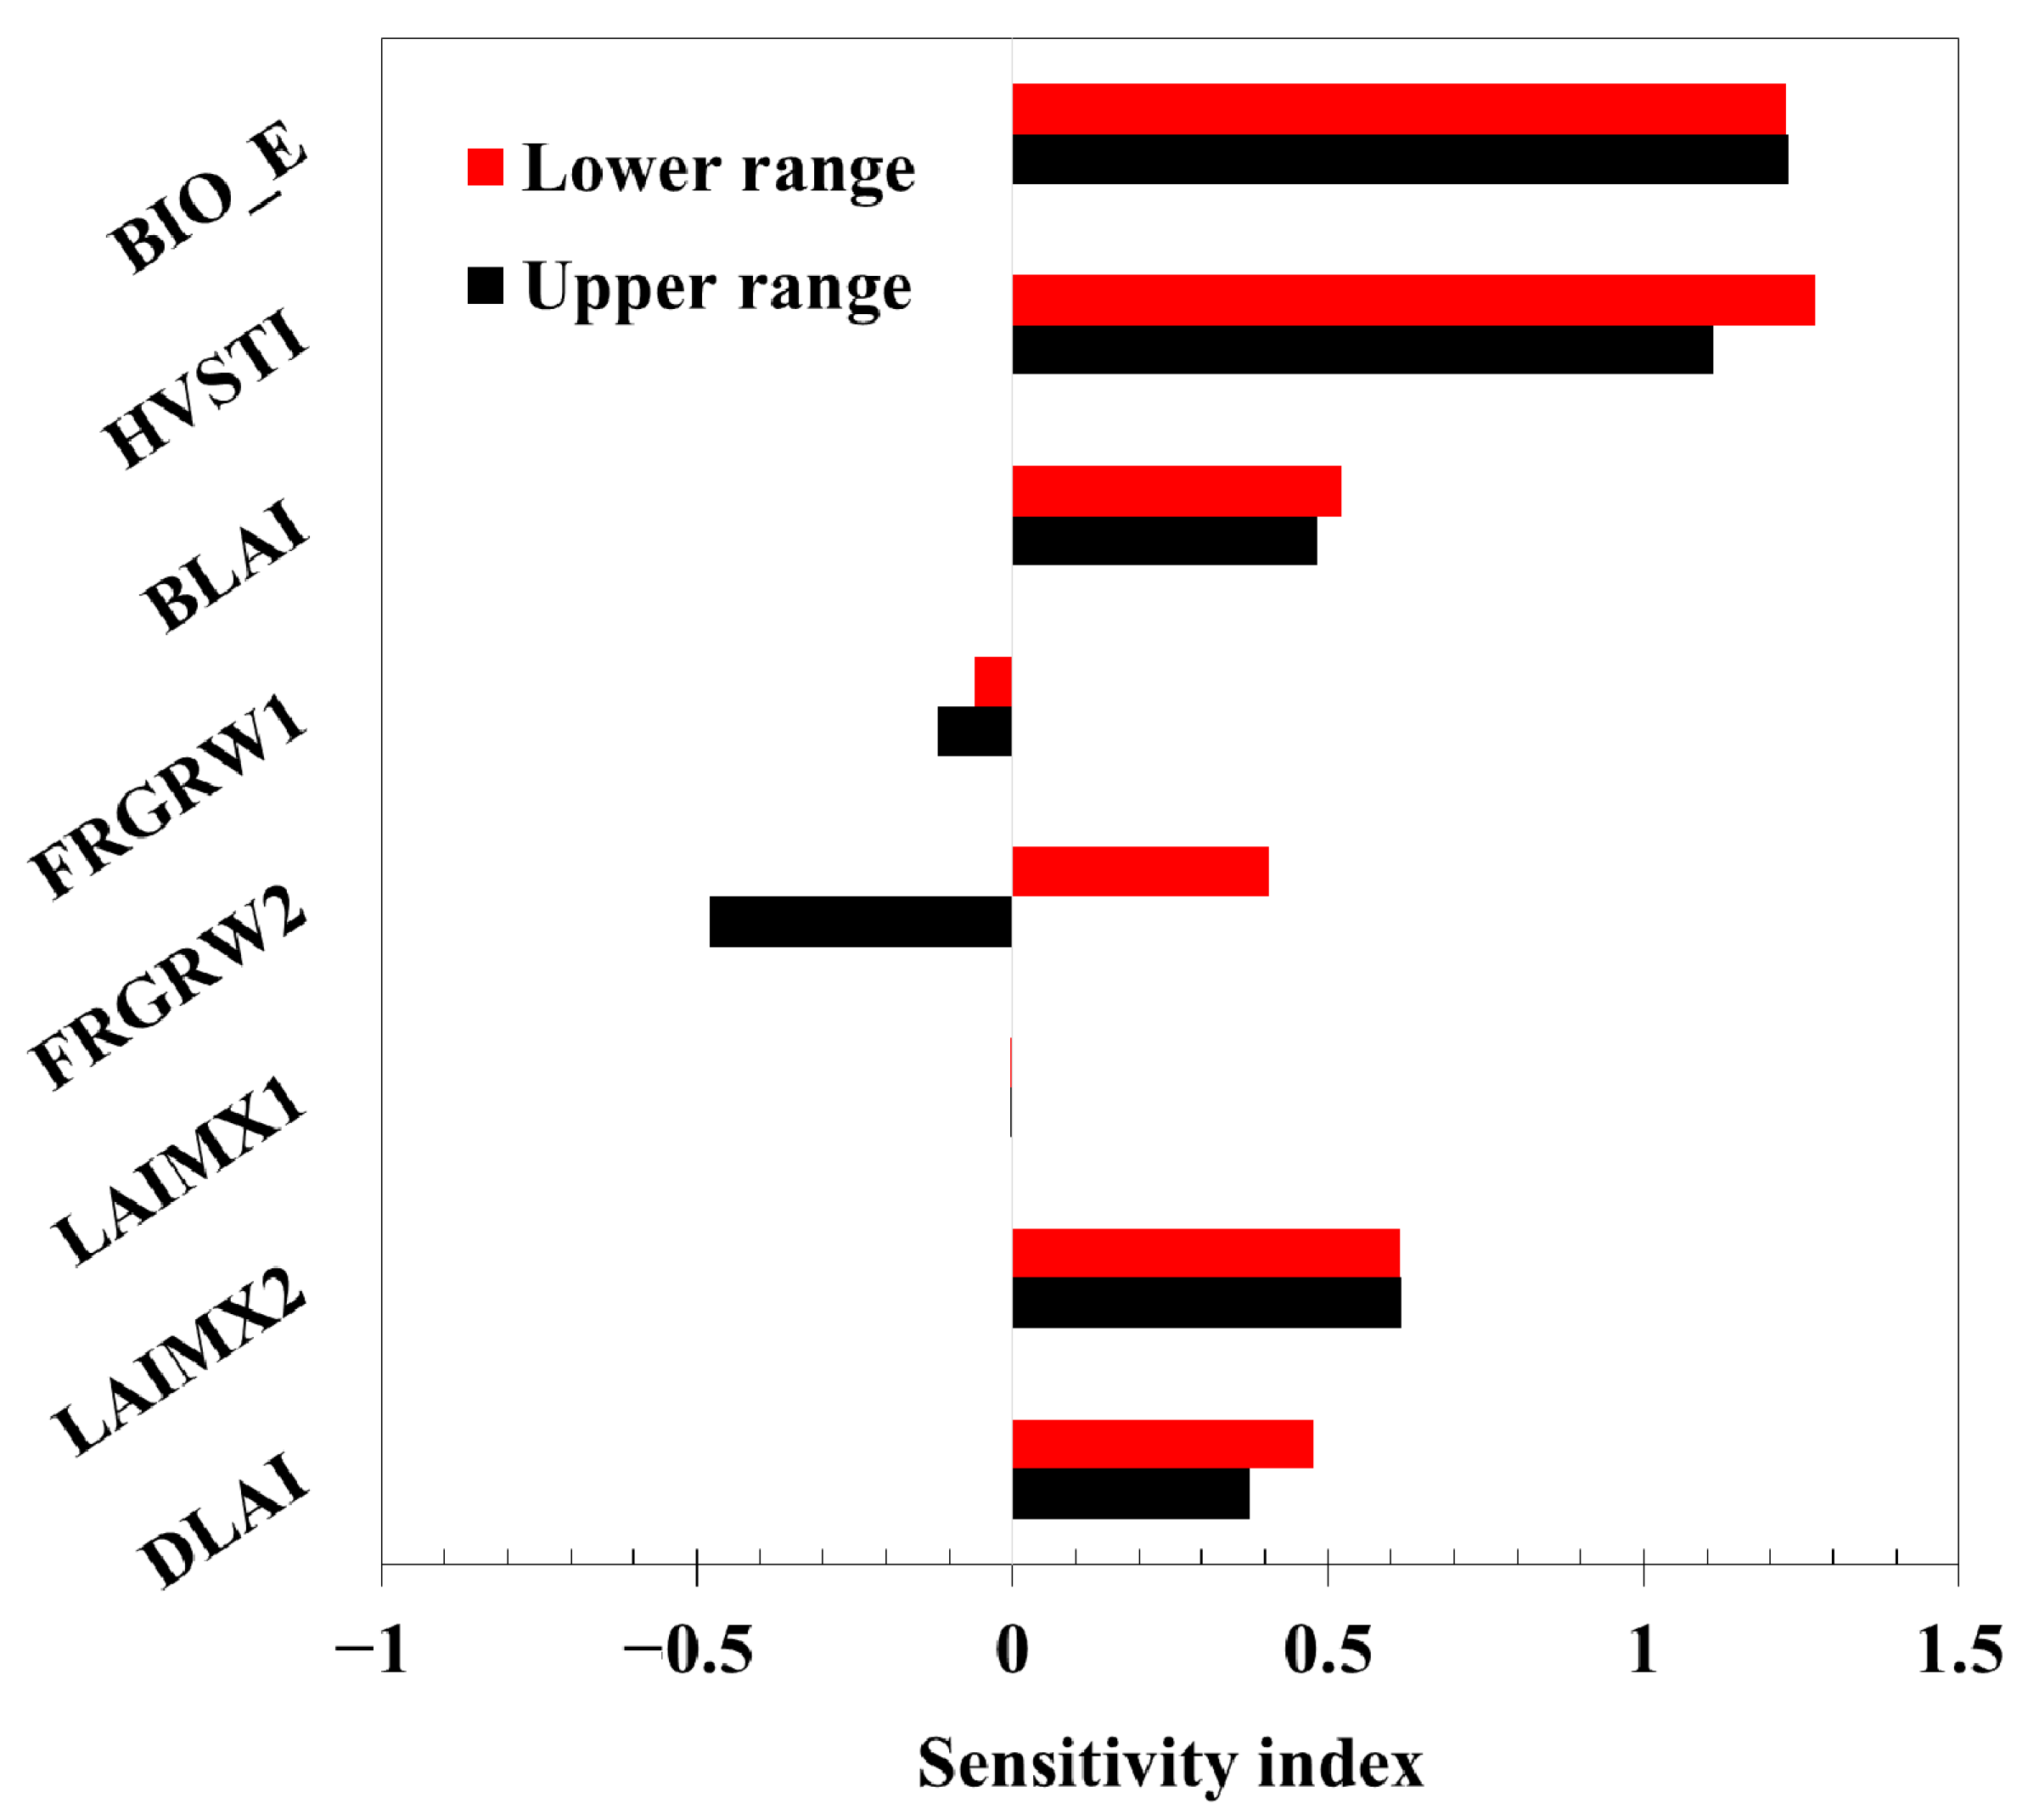
3.1. Sensitivity Analysis and Parameter Calibration

As presented in Section 2.1, eight parameters were unknown, whereas the others were obtained from previous studies [26,27,28,29,30]. These parameters are unique to Napier grass growth. The most sensitive parameter was the first to be adjusted to minimize the RMSE value, whereas the others were kept constant. Next, the second most sensitive was adjusted, and the process was repeated accordingly for the remaining parameters. The sensitivity index of each parameter is depicted in Figure 2. The analysis was performed by considering the upper and lower limits of the range shown in Table 1. These limits were obtained from previous studies to ensure that the parameters used in the present study are realistic. All parameters displayed the same direction of the sensitivity index, except FRGRW2. In FRGRW2, the lower limit value provided a positive index, whereas the upper gave a negative value. By increasing FRGRW2, which is the fraction of the growing season, to the second point on the optimal leaf area development curve, the leaf area development curve can be extended and the slope of the curve reduced. This means that a plant will take longer to grow, resulting in a negative sensitivity index. According to Beer’s law expressed by Equation (1), the amount of daily solar radiation intercepted by the leaf area of the plant H phosyn is maximized only when the LAI is large. Since the rate of biomass growth ∆bio is directly proportional to H phosyn (see Equation (2)), the biomass yield will be small if the process of developing leaf area is relatively slow.
The results of this analysis suggest that the sensitivity index of the studied parameters varies between negligible (−0.004 for LAIMX1) and very high (1.273 for HVSTI). Only two parameters, FRGRW1 and LAIMX1, demonstrated a negligible influence on simulated yield, even though, according to their definition, they are directly related to the leaf area development curve. This is unsurprising because FRGRW1 and LAIMX1 indicate the first point on the leaf area development curve.
The other parameters were classified as demonstrating medium to very high sensitivity. The most sensitive parameters are BIO_E and HVSTI with sensitivity indexes of 1.230 and 1.273, respectively. These results are consistent with existing research [49], which analyzed the sensitivity of parameters to the yield of Switchgrass and Miscanthus. DLAI, BLAI, FRGRW2, and LAIMX2 exhibit medium sensitivity.
FRGRW1 and LAIMX1 were not adjusted in the optimization process, as they were the least sensitive parameters. By calibrating the parameters, the RMSE was reduced from 10.77 to 1.38 t·ha−1. The goodness-of-fit plot for simulated yield with the initial and final parameter sets is shown in Figure 3, from which it is evident that, by minimizing the RMSE, the fit can be enhanced for the experimental yield data. In contrast, by using the initial values, the yield values were over/underpredicted by a factor of two. The final parameters for Napier grass are displayed in Table 3.

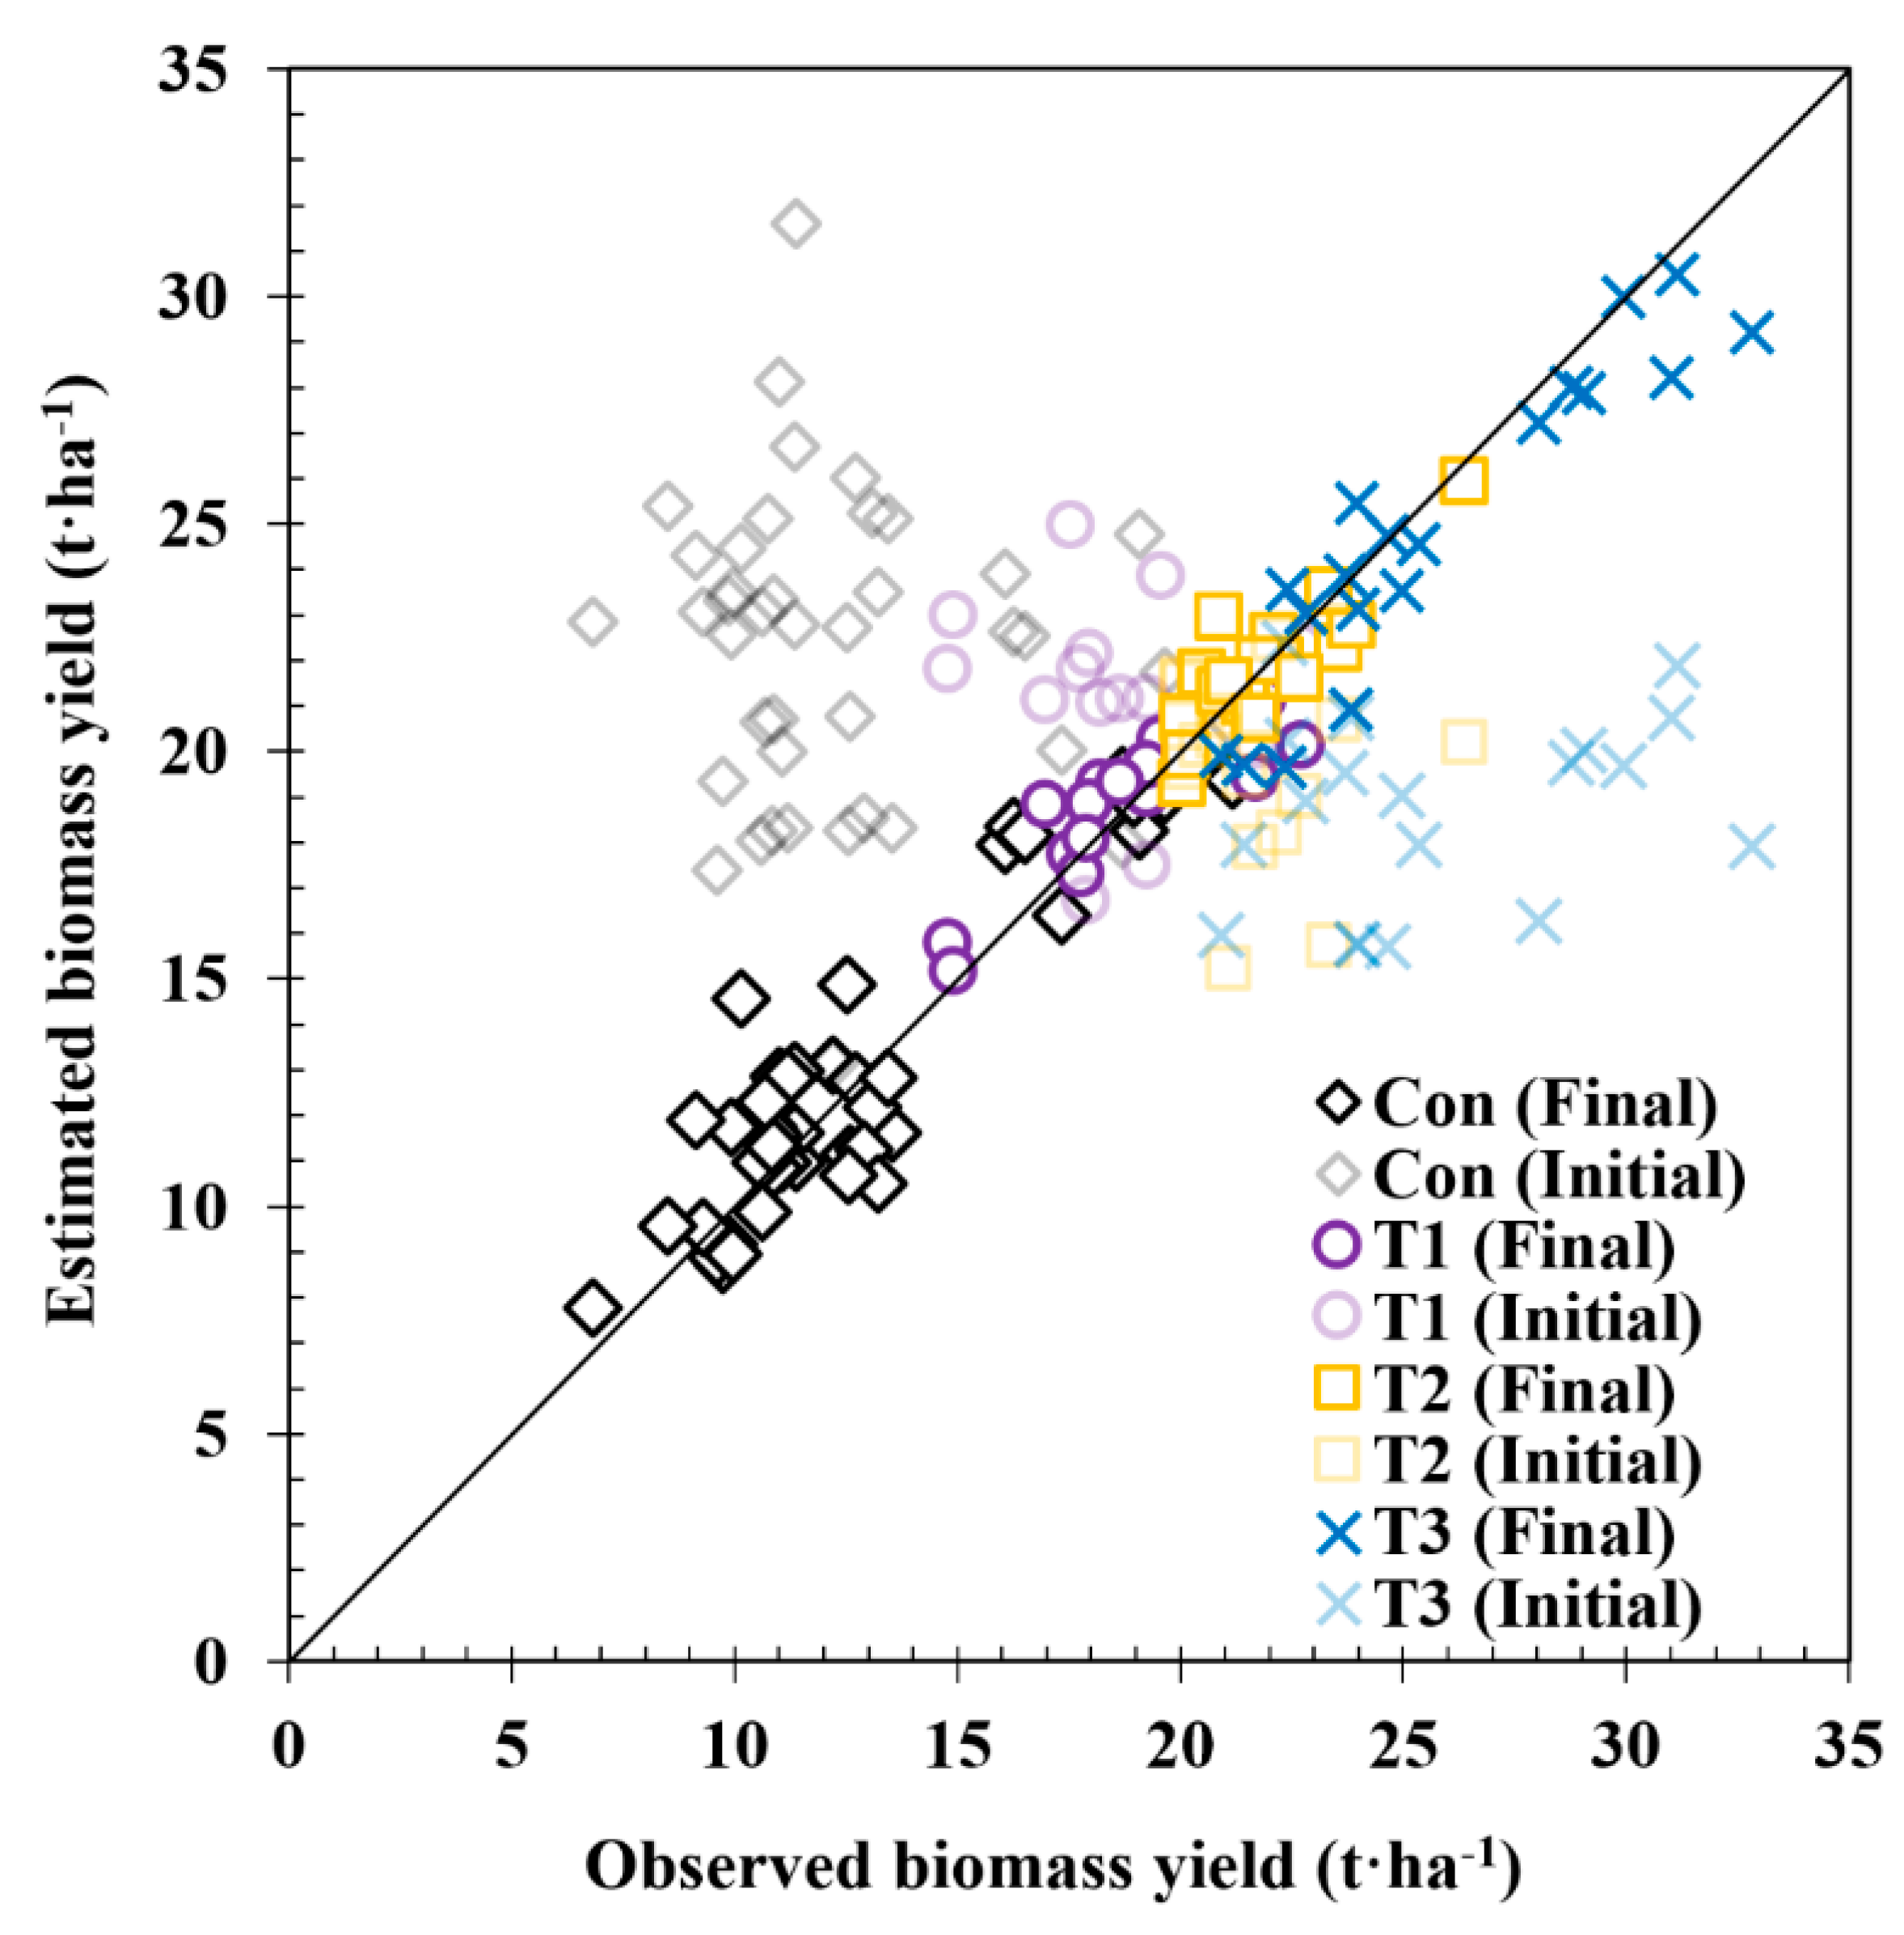
3.2. Model and Parameter Validation

The parameters obtained from the calibration process were used to confirm the model validity. Figure 4 shows the sample temporal change plot of LAI curve development, the growth of simulated biomass yield, and the Napier grass DMY obtained experimentally during yearly cultivation. The management schedule used in Figure 4 was the schedule used at Sukhothai plantation from May 2001 to April 2002 [43]. Day one of simulation was set to be the day after planting. The first harvest was made on the 75th day, and the following harvests were performed every 60 days. The parameters obtained after calibration provide results (the solid lines) that are consistent with the harvesting schedule. Since the experimental LAI data were not available, the biomass growth was used for validation instead. The black line represents the predicted biomass growth, whereas the squares represent the yield obtained experimentally. The simulation results are consistent with the experimental data.
The obtained yield outputs were statically analyzed to examine the model validity, as shown in Table 4 and Figure 3. The average simulated Napier grass DMY is consistent with the average value for all N-fertilizer levels. In summary, the average measured and simulated DMY values are 17.97 and 17.89 t·ha−1, respectively. Moreover, when the N-fertilizer level increases, R2 decreases, which can be attributed to the fact that planting conditions are highly manipulated when too much N-fertilizer is applied. Indeed, more information would help in making better predictions for cases with high N-fertilizer levels. Regardless, it is clear that the model can successfully and accurately estimate Napier grass DMY (R2 = 0.95, ME = −0.082 t·ha−1, and RMSE = 1.380 t·ha−1) Although the experimental data were collected from eight provincial pilot plants over Thailand, the proposed model exhibits no apparent biases. In other words, the model is appropriate for investigating the land potential of Napier grass plantations under different land conditions in Thailand.

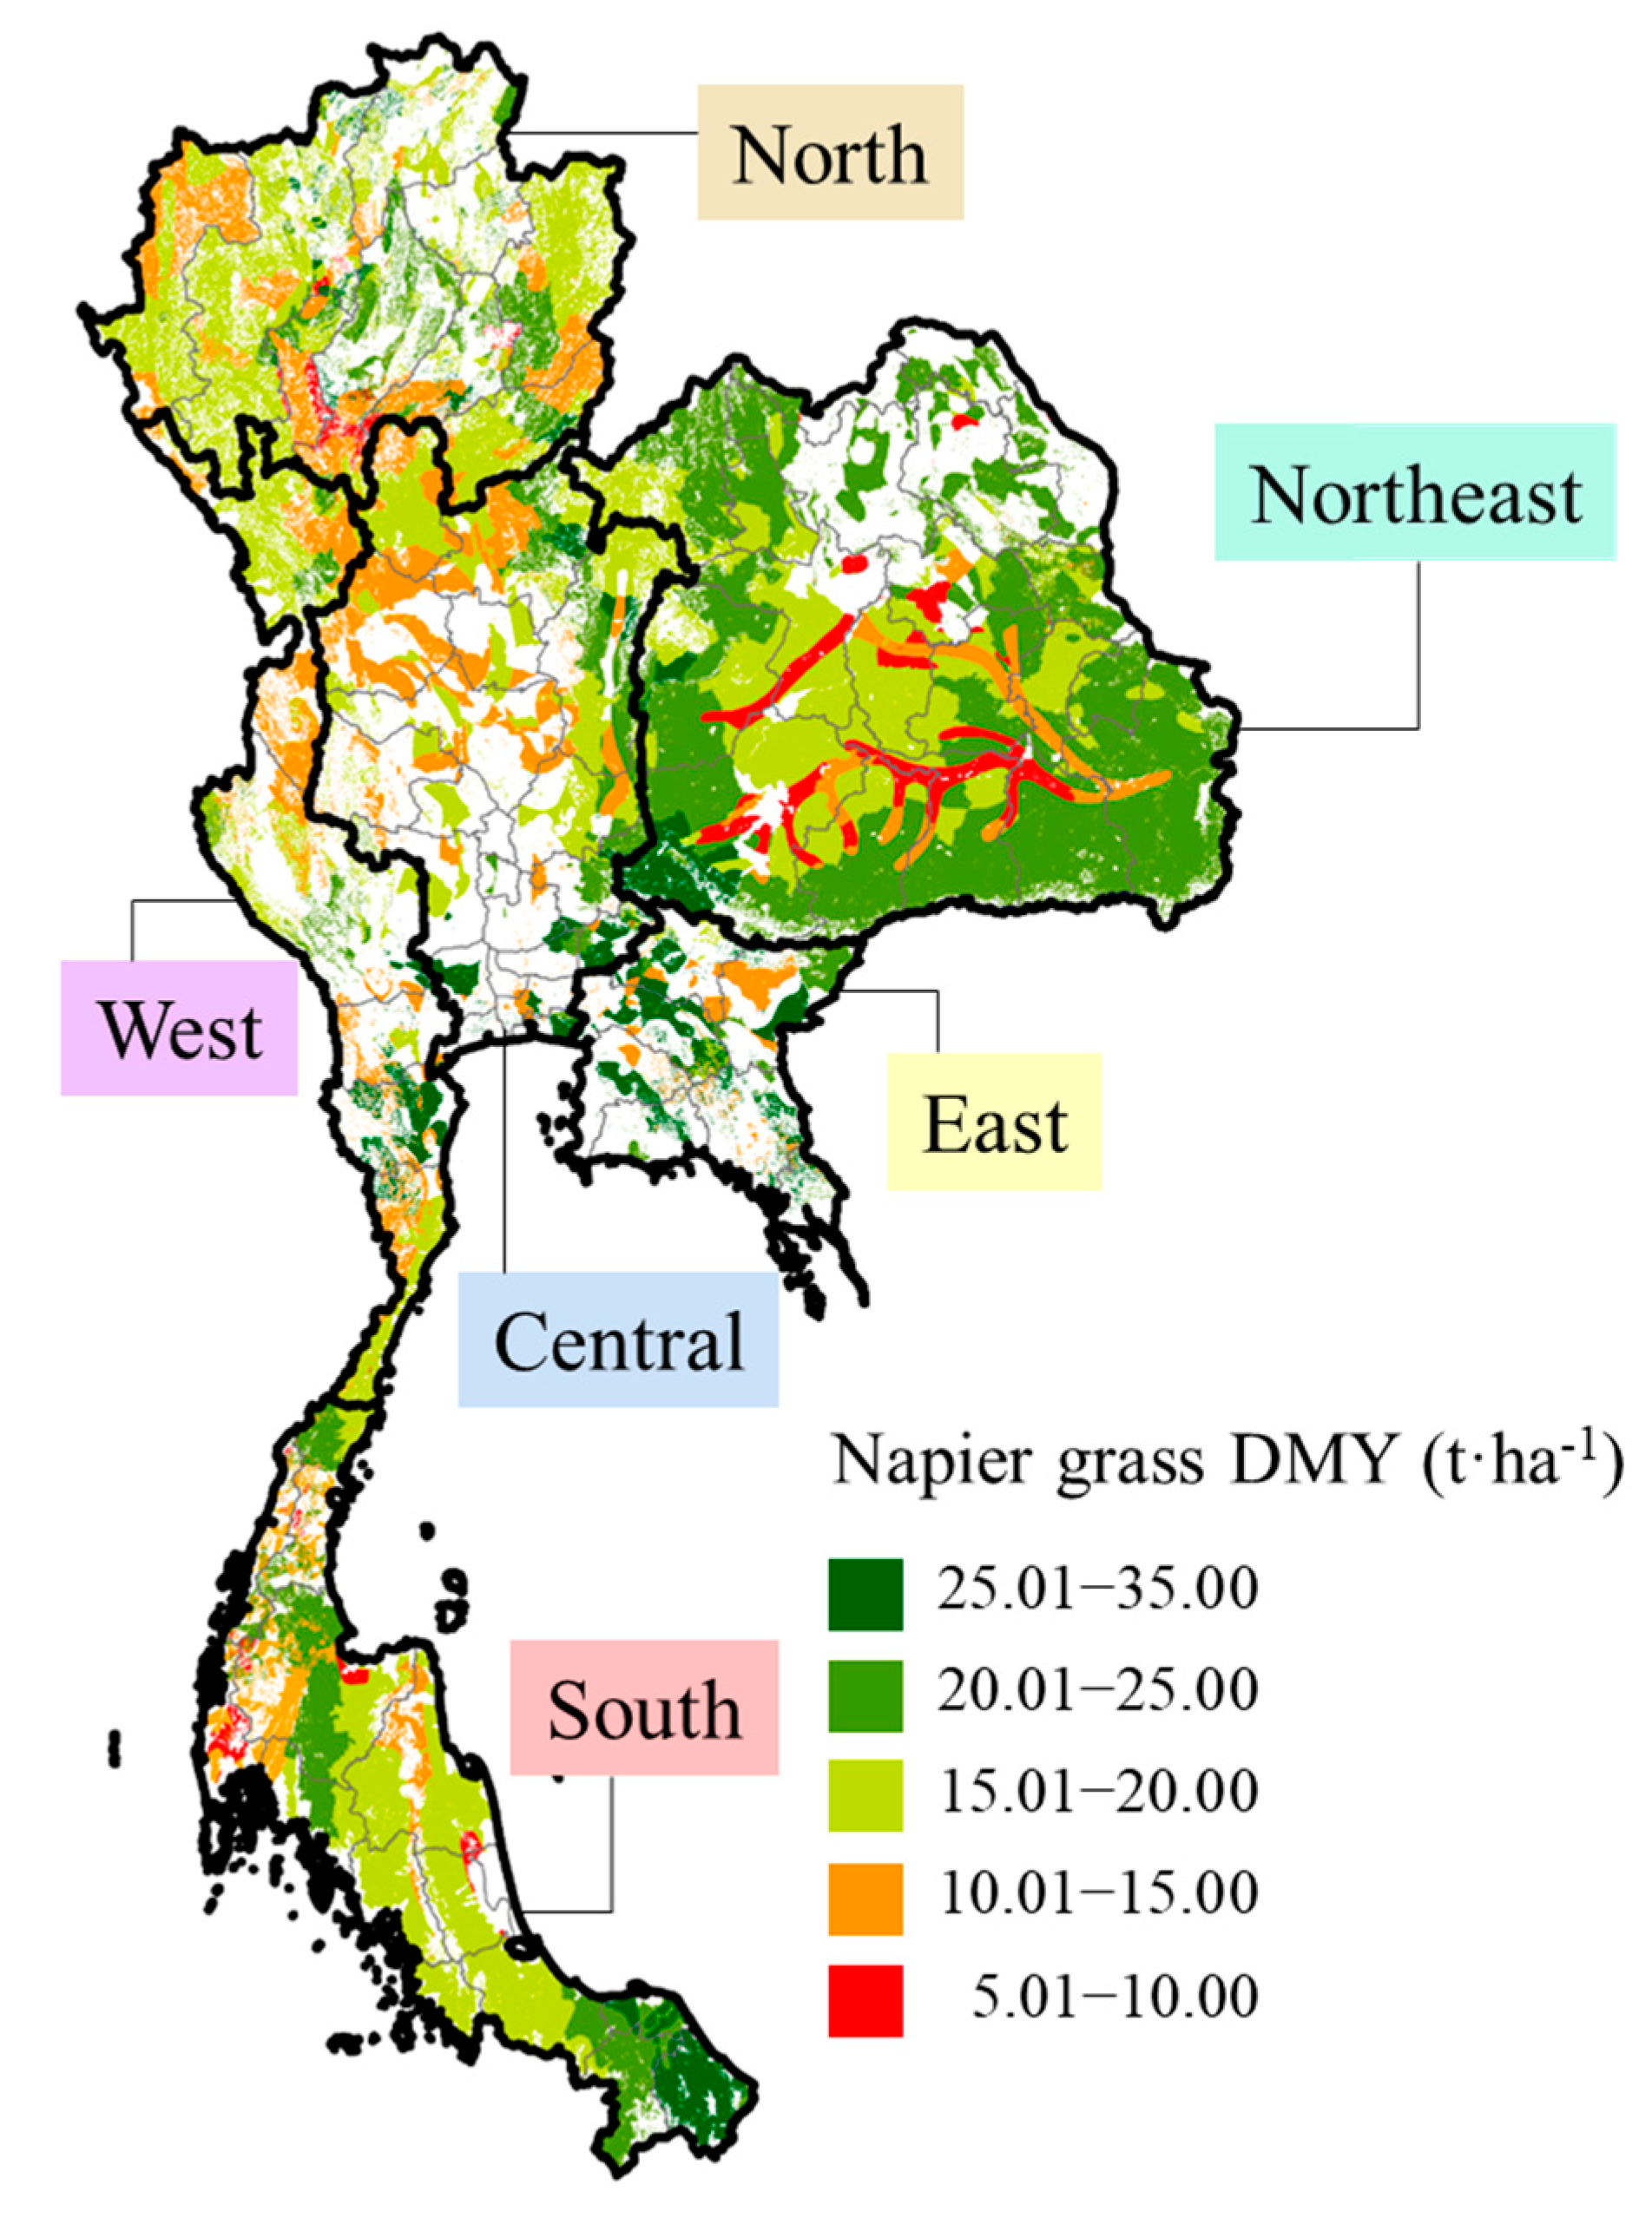
3.3. Application of Soil and Water Assessment Tool in the land Potential Evaluation of Napier Grass Plantations in Thailand

To evaluate the land potential for Napier grass DMY in Thailand, the model was applied to areas all over the country. Simulations were carried out for a 20-year timespan with two warm-up years to obtain optimal results [50]. For management practices, following Kiyothong [10], 250 kg-N·ha−1 was used for the N-fertilizer level and irrigation was applied. The areas used in the simulation included abandoned areas only. This was conducted to avoid conflicts with industrial, urban, economical, and agricultural land; moreover, abandoned areas can be found all over Thailand, and we believe they should be effectively utilized. In total, the abandoned area of Thailand is approximately 2,200,000 ha, which is roughly 4.2% of the country. It is worth noting that not all abandoned areas can be used for Napier grass plantation, and the influence of transportation distance, location size, distance from residential areas, and distance from water sources were not considered. To consider such effects, land suitability analysis should be carried out. Indeed, the results of this research could serve as the primary estimation method for Napier grass plantation in the country, and, in particular, the estimated DMY can be utilized as one of the criteria for evaluating land suitability. Without this work, performing land suitability analysis for Napier grass supply chains would be similar to locating photovoltaic sites without considering solar radiation.
Figure 5 depicts the simulation results of average Napier grass DMY values over 20 years in Thailand. Note that, for a better depiction of simulation results, all areas were included in the figure, except urban areas and the national forest reserves. Most of the abandoned areas can provide Napier grass DMY values in the range of 15–25 t·ha−1·year−1, which is a high output [10]. Low outputs are associated with areas dominated by clay soil, represented by the red area in Figure 5. These results are consistent with the experimental results of Wijitphan and Lowilai [51], which suggest that grass prefers soil with good drainage ability.

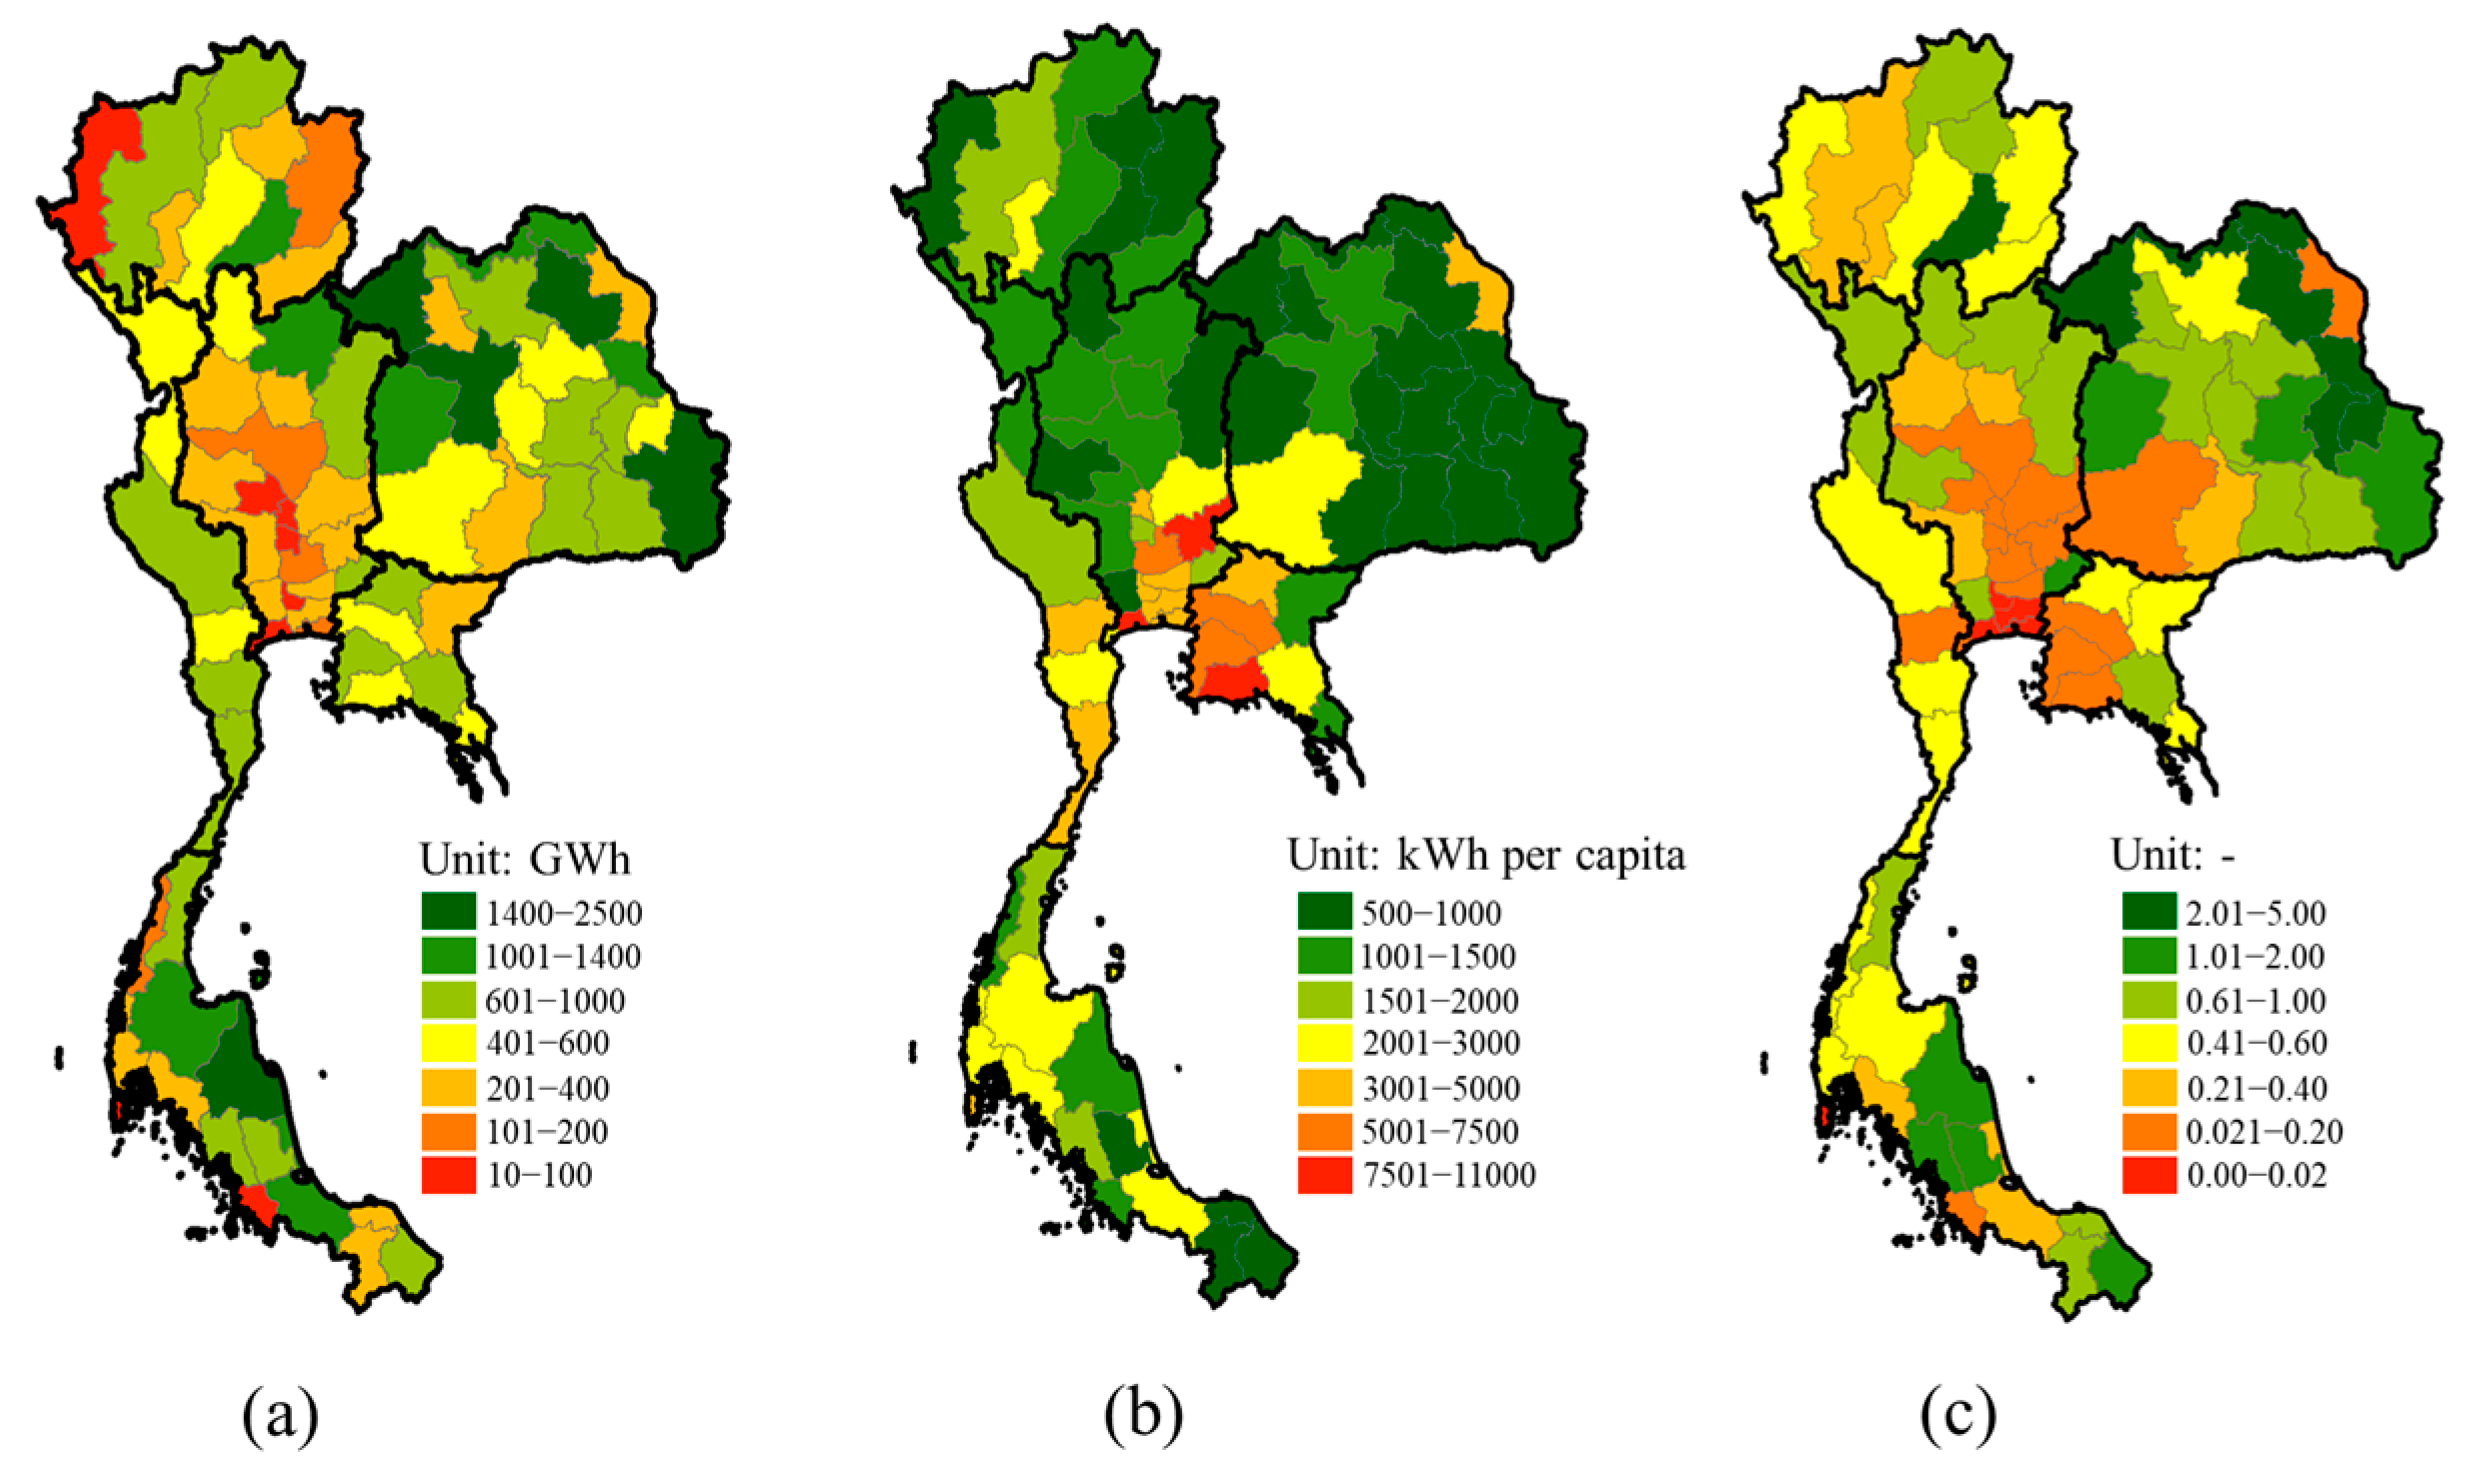
3.4. Potential of Power Supply Generated by Napier Grass in Thailand

Since the SWAT model, together with ArcMAP 10.1, provides the spatial distribution of Napier grass potential, it allows researchers and energy-related policymakers to assess the potential of power supply generated by Napier grass. Table 5 summarizes the regional data used in the potential assessment, e.g., electric consumption, estimated DMY, and Napier grass-derived electric supply potential. Average DMY obtained from the southern part of Thailand was found to be the highest. The southern region can provide an average yield of 22.3 t·ha−1, whereas the western region provides the lowest average yield (16.0 t·ha−1). Considering the supply–demand ratio of each region, Napier grass could supply roughly 80% of the total energy demand for the northeastern region and approximately 56% for the northern and southern regions. However, a low ratio was found in the eastern and central regions, as these are mostly industrial and urban areas.
Figure 6 depicts the provincial distribution of Napier grass-derived electric supply potential, total electric consumption per capita, and the supply–demand ratio. Although the spatial distribution in Figure 5 reveals that the south-northeastern region shows potential for Napier grass plantation, low electricity generation can be observed for this area in Figure 6a. This can be attributed to the availability of land. In Figure 6b, in addition to the central and east regions, which possess a high electric consumption per capita due to industry, it is evident that southern Thailand also demands a lot of electricity.
Note that, for the southern region, the number of power plants is smaller by a factor of six compared with the central region, and power demand per person is smaller by a factor of two. It is the only region in Thailand that exhibits a consumption demand that is higher than its production capability. Since the region consumes more electricity than it can produce, electricity transmission from the central region is necessary. However, the southern region is long and narrow, and transporting electricity from other regions is not possible. When the central region fails to contribute sufficient electricity, blackouts occur for all 14 provinces of the southern region. This last occurred on 22 May 2013 [52], and it took more than 9 h to restore everything. Since the electric situation in southern Thailand is unstable, the government was working on an appropriate energy plan based on a coal-fired power plant; it was abandoned because the local people were concerned about the environmental impact [53]. As the average yield was found to be highest in the southern region, we should encourage people to plant Napier grass in this area. This will not only provide clean energy generation but will also help in creating jobs for local people. Figure 6c reveals that Napier grass can provide a satisfactorily supply of electricity to provinces in the region.
Considering only abandoned areas, the results suggest that Thailand demonstrates good potential with respect to providing sufficient amounts of Napier grass DMY (approximately 42 megatons per year). Several approaches exist to utilize the DMY for electric production, one of which is anaerobic digestion, which converts the DMY into methane. According to Janejadkarn and Chavalparit [54], this approach could provide methane yields as high as 242 m3 per ton of Napier grass DMY. Assuming the energy density of methane is 40 MJm−3 [55] and that thermal power plants based on combustion boilers and stream turbines with an efficiency of approximately 30–40% are used to generate electricity, Napier grass DMY from abandoned areas can generate roughly 33,600–44,900 GWh of electricity every year, which is equivalent to 20–26% of Thailand’s total energy demand.
Although this is a rough estimation, it is clear that Napier grass can help Thailand move toward renewable energy generation. By substituting conventional fossil fuels with Napier grass-derived natural gas for electric generation, CO2 emissions can be also be reduced from 1080 to 450 kg-CO2·MWh−1 [56]. Moreover, if all abandoned areas are utilized, the CO2 emissions from power plants could be reduced by approximately 21.2–28.3 Mt-CO2. It is worth noting that, although the combustion of Napier grass-derived natural gas also produces CO2, the process is carbon neutral and does not require additional CO2 to be added to the system.
This study considered an ideal situation, where all abandoned areas could be utilized. However, in reality, not all abandoned areas can be utilized, and, as such, a number of factors must be considered, such as biogas plant locations, the capacity levels of biogas plants, the amount of biomass to be transported from the feedstock region to the biogas plants, and the biogas production volume of each plant. Regardless, this study is valuable for energy-related policymakers, and further studies should be conducted concerning the land suitability of biogas plants based on Napier grass supply chains in Thailand.

4. Conclusions

In this work, Napier grass crop growth parameters were successfully calibrated for different management conditions. BIO_E, HVSTI, BLAI, FRGRW1, FRGRW2, LAIMX1, LAIMX2, and DLAI were analyzed using a sensitivity index to identify their sensitivity with respect to DMY. The results reveal that FRGRW1 and LAIMX1 are the least sensitive, whereas BIO_E and HVSTI are the most sensitive. In the calibration process, the parameters were ranked according to their sensitivity levels, where the most sensitive was the first to be adjusted. The parameters were calibrated one at a time by considering the RMSE of yield. By minimizing the RMSE, optimal values were obtained. To ensure that the calibrated values were realistic, the parameters were not adjusted beyond the range limits collected from previous studies. Model validation was successfully performed using the obtained parameters, and good agreement was found between the estimated yields and the experimental data. In addition, the application of the model in predicting Napier grass DMY was presented. The model confirmed that utilizing Napier grass as a new feedstock for power generation in Thailand is possible; however, only abandoned areas were utilized in the model. The results also suggest that the southern region of Thailand is the most promising, since it demonstrates the highest average DMY.
The approach presented in this study was found to be supportive since it provides a method for a modeler to properly utilize SWAT model. This is important because parameters can differ from area to area. By using the SWAT method, accurate parameters were obtained for the simulations, which consequently resulted in the optimal out predictions, such as crop yield, soil water content, and soil nutrient content. Indeed, the results of this work can be further utilized as criteria for obtaining suitable areas for Napier grass plantations, anaerobic digesters, and biogas power plants in Thailand.

Author Contributions

Conceptualization, K.N. and T.M.; methodology, K.N.; software, K.N.; validation, K.N.; formal analysis, K.N. and T.M.; investigation, K.N. and P.C.-A.; resources, K.N.; data curation, K.N.; writing—original draft preparation, K.N.; writing—review and editing, P.C.-A. and T.M.; visualization, P.C.-A.; and supervision, T.M. All authors have read and agreed to the published version of the manuscript.

Funding

This research received no external funding.

Data Availability Statement

Not applicable.

Acknowledgments

The authors would like to acknowledge the technical support from the developers of EPIC model who helped by providing essential information for conducting this research. The authors would like to express our appreciation to the ESA GlobCover 2009 Project for providing the land cover data used in this study.

Conflicts of Interest

The authors declare no conflict of interest.

References

  1. Bova, S.; Rosenthal, Y.; Liu, Z.; Godad, S.P.; Yan, M. Seasonal origin of the thermal maxima at the Holocene and the last interglacial. Nature 2021, 589, 548–553. [Google Scholar] [CrossRef]
  2. Limjeerajarus, N.; Charoen-Amornkitt, P. Effect of different flow field designs and number of channels on performance of a small PEFC. Int. J. Hydrog. Energy 2015, 40, 7144–7158. [Google Scholar] [CrossRef]
  3. Yaqoob, H.; Teoh, Y.H.; Jamil, M.A.; Rasheed, T.; Sher, F. An Experimental Investigation on Tribological Behaviour of Tire-Derived Pyrolysis Oil Blended with Biodiesel Fuel. Sustainability 2020, 12, 9975. [Google Scholar] [CrossRef]
  4. Razzaq, L.; Farooq, M.; Mujtaba, M.A.; Sher, F.; Farhan, M.; Hassan, M.T.; Soudagar, M.E.M.; Atabani, A.E.; Kalam, M.A.; Imran, M. Modeling Viscosity and Density of Ethanol-Diesel-Biodiesel Ternary Blends for Sustainable Environment. Sustainability 2020, 12, 5186. [Google Scholar] [CrossRef]
  5. Charoen-Amornkitt, P.; Suzuki, T.; Tsushima, S. Ohmic resistance and constant phase element effects on cyclic voltammograms using a combined model of mass transport and equivalent circuits. Electrochim. Acta 2017, 258, 433–441. [Google Scholar] [CrossRef]
  6. Charoen-Amornkitt, P.; Suzuki, T.; Tsushima, S. Determination of Constant Phase Element Parameters under Cyclic Voltam-metry Conditions Using a Semi-theoretical Equation. Electrochemistry 2019, 87, 204–213. [Google Scholar] [CrossRef]
  7. Charoen-Amornkitt, P.; Suzuki, T.; Tsushima, S. Effects of Voltage-Dependence of the Constant Phase Element and Ohmic Parameters in the Modeling and Simulation of Cyclic Voltammograms. J. Electrochem. Soc. 2020, 167, 166506. [Google Scholar] [CrossRef]
  8. EGAT Overview. Available online: https://www.egat.co.th/en/images/publication/EGAT-Overview-2020/EGAT-Overview-2020.pdf (accessed on 10 July 2020).
  9. Napier Grass. Available online: http://weben.dede.go.th/webmax/content/napier-grass (accessed on 5 July 2020).
  10. Kiyothong, K. Handbook of Napier Grass CV. Pakchong 1 Plantation; Mittrapap Printing Ltd.: Nakhonratchasima, Thailand, 2011. [Google Scholar]
  11. Nair, S.S.; Kang, S.; Zhang, X.; Miguez, F.E.; Izaurralde, R.C.; Post, W.M.; Dietze, M.C.; Lynd, L.R.; Wullschleger, S.D. Bio-energy crop models: Descriptions, data requirements, and future challenges. Glob. Chang. Biol. Bioenergy 2012, 4, 620–633. [Google Scholar] [CrossRef]
  12. Arnold, J.G.; Srinivasan, R.; Muttiah, R.S.; Williams, J.R. Large Area Hydrologic Modeling and Assessment Part I: Model Development. J. Am. Water Resour. Assoc. 1998, 34, 73–89. [Google Scholar] [CrossRef]
  13. Dumont, B.; Leemans, V.; Mansouri, M.; Bodson, B.; Destain, J.-P.; Destain, M.-F. Parameter identification of the STICS crop model, using an accelerated formal MCMC approach. Environ. Model. Softw. 2014, 52, 121–135. [Google Scholar] [CrossRef] [Green Version]
  14. Srinivasan, R.; Zhang, X.; Arnold, J. SWAT Ungauged: Hydrological Budgetand Crop Yield Predictions in the Upper Mississippi River Basin. Trans. ASABE 2010, 53, 1533–1546. [Google Scholar] [CrossRef]
  15. Gassman, P.W.; Reyes, M.R.; Green, C.H.; Arnold, J.G. The Soil and Water Assessment Tool: Historical Development, Applications, and Future Research Directions. Trans. ASABE 2007, 50, 1211–1250. [Google Scholar] [CrossRef] [Green Version]
  16. Refsgaard, J.C.; Storm, B.; Clausen, T. Système Hydrologique Europeén (SHE): Review and perspectives after 30 years de-velopment in distributed physically-based hydrological modelling. Hydrol. Res. 2010, 41, 355–377. [Google Scholar] [CrossRef]
  17. White, K.L.; Chaubey, I. Sensitivity Analysis, Calibration, and Validations for A Multisite and Multivariable Swat Model. J. Am. Water Resour. Assoc. 2005, 41, 1077–1089. [Google Scholar] [CrossRef]
  18. Paruggia, M. Sensitivity Analysis in Practice: A Guide to Assessing Scientific Models. J. Am. Stat. Assoc. 2006, 101, 398–399. [Google Scholar] [CrossRef]
  19. Mohammed, I.Y.; Abakr, Y.A.; Kazi, F.K.; Yusup, S.; Alshareef, I.; Chin, S.A. Comprehensive Characterization of Napier Grass as a Feedstock for Thermochemical Conversion. Energies 2015, 8, 3403–3417. [Google Scholar] [CrossRef] [Green Version]
  20. Guo, J.; Su, X. Parameter sensitivity analysis of SWAT model for streamflow simulation with multisource precipitation datasets. Hydrol. Res. 2019, 50, 861–877. [Google Scholar] [CrossRef] [Green Version]
  21. Khanal, S.; Parajuli, P.B. Sensitivity Analysis and Evaluation of Forest Biomass Production Potential Using SWAT Model. J. Sustain. Bioenergy Syst. 2014, 4, 136–147. [Google Scholar] [CrossRef] [Green Version]
  22. Sane, M.L.; Sambou, S.; Leye, I.; Ndione, D.M.; Diatta, S.; Ndiaye, I.; Badji, M.L.; Kane, S. Calibration and Validation of the SWAT Model on the Watershed of Bafing River, Main Upstream Tributary of Senegal River: Checking for the Influence of the Period of Study. Open J. Mod. Hydrol. 2020, 10, 81–104. [Google Scholar] [CrossRef]
  23. Shawul, A.A.; Alamirew, T.; Dinka, M.O. Calibration and validation of SWAT model and estimation of water balance com-ponents of Shaya mountainous watershed, Southeastern Ethiopia. Hydrol. Earth Syst. Sci. Discuss. 2013, 10, 13955–13978. [Google Scholar]
  24. Soil and Water Assessment Tool SWAT, Theoretical Documentation. Available online: https://swat.tamu.edu/media/1292/SWAT2005theory.pdf (accessed on 3 January 2020).
  25. Williams, J.R.; Jones, C.A.; Kiniry, J.R.; Spanel, D.A. The EPIC Crop Growth Model. Trans. ASAE 1989, 32, 497–511. [Google Scholar] [CrossRef]
  26. Gil, J.U.; Escudero, R.J.; Benirez, E.T.; Aguirrre, H.D.I.; Quiroz, J.F.E. Mapping King-Grass (Pennisetum purpureum) Biomass Yield for Cellulosic Ethanol Production in Veracruz, Mexico. In Proceedings of the International SWAT Conference, University of Castilla La Mancha, Toledo, Spain, 15–17 June 2011. [Google Scholar]
  27. Kiniry, J.R.; Sanderson, M.A.; Williams, J.R.; Tischler, C.R.; Hussey, M.A.; Ocumpaugh, W.R.; Read, J.C.; Van Esbroeck, G.; Reed, R.L. Simulating Alamo Switchgrass with the ALMANAC Model. Agron. J. 1996, 88, 602–606. [Google Scholar] [CrossRef]
  28. Gaiser, T.; De Barros, I.; Sereke, F.; Lange, F.-M. Validation and reliability of the EPIC model to simulate maize production in small-holder farming systems in tropical sub-humid West Africa and semi-arid Brazil. Agric. Ecosyst. Environ. 2010, 135, 318–327. [Google Scholar] [CrossRef]
  29. Arundale, R.A.; Dohleman, F.G.; Heaton, E.A.; Mcgrath, J.M.; Voigt, T.B.; Long, S.P. Yields of Miscanthus × giganteusand Panicum virgatum decline with stand age in the Midwestern USA. Glob. Chang. Biol. Bioenergy 2013, 6, 1–13. [Google Scholar] [CrossRef]
  30. Trybula, E.M.; Cibin, R.; Burks, J.L.; Chaubey, I.; Brouder, S.M.; Volenec, J.J. Perennial rhizomatous grasses as bioenergy feedstock in SWAT: Parameter development and model improvement. GCB Bioenergy 2014, 7, 1185–1202. [Google Scholar] [CrossRef] [Green Version]
  31. Phaikeaw, C.; Phunphiphat, W.; Phunpiphat, R.; Kulna, S. Effect of Rate and Application time of Nitrogen Fertilizer on Forage Yield and Chemical Composition of Dwarf Napier Grass in Sukhothai Province. In Annual Report of Bereau Animal Nutrition Development 2004; Thai National AGRIS Centre: Bangkok, Thailand, 2004; pp. 45–54. [Google Scholar]
  32. Hole-Filled SRTM for the Globe. Version CGIAR-CSI SRTM 90m Database. Available online: http://srtm.csi.cgiar.org (accessed on 10 March 2020).
  33. Arino, O.; Ramos Peres, J.; Kalogirou, V.; Bontemps, S.; Defourny, P.; Van Bogaert, E. Global Land Cover Map for 2009; European Space Agency; Université Catholique de Louvain (UCL); PANGAEA: Bremen, Germany, 2010. [Google Scholar]
  34. NCEP Climate Forecast System Reanalysis (CFRS). Available online: http://globalweather.tamu.edu/ (accessed on 23 March 2020).
  35. Fischer, G.; Nachtergaele, F.O.; Prieler, S.; Teixeira, E.; Tóth, G.; van Velthuizen, H.; Verelst, L.; Wiberg, D. Global Agro-Ecological Zones (GAEZ v3.0): Model Documentation; IIASA; FAO: Laxenburg, Austria, 2012; p. 179. [Google Scholar]
  36. Vuthiprachumpai, L.; Nakamanee, G.; Punpipat, W.; Monchaikul, S. Effect of Plant Spacings on Yield and Chemical Com-position of Napier Grass (Pennisetum purpureum), Dwarf Elephant Grass (P. purpureum cv. Mott) and King Grass (P. pur-pureum x P. americanum) at Chainat Province. In Annual Report of Bureau Animal Nutrition Development 1998; Thai National AGRIS Centre: Bangkok, Thailand, 1998; pp. 194–228. [Google Scholar]
  37. Suksaran, W.; Nuntachomchoun, P.; Vongpipatana, C. Yield and Cheimcal Compositions of Napier Grass in Various locations II Effect of Cutting Interval on Yield and Chemical Compositions of Three Varieties of Napier Grass (2.4) in Petchabun Province. In Annual Report of Bureau Animal Nutrition Development 1991; Thai National AGRIS Centre: Bangkok, Thailand, 1991; pp. 41–53. [Google Scholar]
  38. Klum-Em, K.; Pojun, S.; Thammasal, P. Effect of Rate and Application Period of Nitrogen Fertilizer on Yield and Chemical Composition of Dwarf Napier Grass in Sa Kaeo Province. In Annual Report of Bureau Animal Nutrition Development 2002; Thai National AGRIS Centre: Bangkok, Thailand, 2002; pp. 159–174. [Google Scholar]
  39. Waipanya, S.; Kulna, S.; Suriyachaiwatana, I.; Srichoo, C. Effect of Plant Spacing on Yield and Chemical Composition of 3 Varieties of Napier Grass in Nakhonpanom Province. In Annual Report of Bureau Animal Nutrition Development 2003; Thai National AGRIS Centre: Bangkok, Thailand, 2003; pp. 32–42. [Google Scholar]
  40. Chainosaeng, W.; Nuntachomchoun, P.; Suksaran, W. Yield and Chemical Compositions of Napier Grass in Various Locations Effect of Plant Spacing on Yield and Chemical Compositions of Three Varieties of Napier Grass (1.4) In Petchabun Province. In Annual Report of Bureau of Animal Nutrition Development 2004; Thai National AGRIS Centre: Bangkok, Thailand, 2004; pp. 26–40. [Google Scholar]
  41. Chubisaeng, W.; Bhokasawat, K.; Intarit, S.; Wongpipat, C. Effect of Rate and Application Time of Nitrogen Fertilizaer on Yield and Chemical Composition of Dwarf Napier Grass in Renu Soil Series. In Annual Report of Bureau Animal Nutrition Development 2004; Thai National AGRIS Centre: Bangkok, Thailand, 2004; pp. 55–78. [Google Scholar]
  42. Yuthavoravit, C.; Suksaran, W.; Paotong, S. Effect of Rate and Application Time of Nitrogen Fertilizer on Yield and Chemical Composition of Dwarf Napier Grass in Hub-Kapong Soil Series. In Annual Report of Bureau Animal Nutrition Development 2004; Thai National AGRIS Centre: Bangkok, Thailand, 2004; pp. 79–102. [Google Scholar]
  43. Phunphiphat, W.; Phunphiphat, R.; Kulna, S. Study on cost of production and forage yield of Dwarf Napeir Under Intensive Management. In Annual Report of Bureau Animal Nutrition Development 2005; Thai National AGRIS Centre: Bangkok, Thailand, 2005; pp. 87–99. [Google Scholar]
  44. Thorsen, M.; Refsgaard, J.C.; Hansen, S.; Pebesma, E.; Jensen, J.; Kleeschulte, S. Assessment of uncertainty in simulation of nitrate leaching to aquifers at catchment scale. J. Hydrol. 2001, 242, 210–227. [Google Scholar] [CrossRef]
  45. Wang, X.; He, X.; Williams, J.R.; Izaurralde, R.C.; Atwood, J.D. Sensitivity And Uncertainty Analyses Of Crop Yields And Soil Organic Carbon Simulated With Epic. Trans. ASAE 2005, 48, 1041–1054. [Google Scholar] [CrossRef]
  46. Jesiek, J.B.; Wolf, D.D. Sensitivity Analysis of the Virginia Phosphorus Index Management Tool. Trans ASAE 2005, 48, 1773–1781. [Google Scholar] [CrossRef] [Green Version]
  47. Saltelli, A.; Tarantola, S.; Campolongo, F.; Ratto, M. Sensitivity Analysis in Practice: A Guide to Assessing Scientific Models, 1st ed.; John Wiley and Sons Ltd.: Hoboken, NJ, USA, 2004. [Google Scholar]
  48. Lenhart, T.; Eckhardt, K.; Fohrer, N.; Frede, H.-G. Comparison of two different approaches of sensitivity analysis. Phys. Chem. Earth 2002, 27, 645–654. [Google Scholar] [CrossRef]
  49. Chaubey, I.; Raj, C.; Trybula, E.; Frakenberger, J.; Brouder, S.; Volencec, J. Improving the Simulation of Biofuel Crop Sustain-ability Assessment Using SWAT Model. In Proceedings of the International SWAT Conference, University of Castilla La Mancha, Toledo, Spain, 15–17 June 2011. [Google Scholar]
  50. Zhang, X.; Srinivasan, R.; Hao, F. Predicting Hydrologic Response to Climate Change in the Luohe River Basin Using the SWAT Model. Trans. ASABE 2007, 50, 901–910. [Google Scholar] [CrossRef]
  51. Wijitphan, S.; Lowilai, P. Effects of Cutting Interval on Yields and Nutritive Values of King Napier Grass (Pennisetum pur-pureum cv. King grass) under Irrigation Supply. KKU Res. J. 2011, 16, 215–224. [Google Scholar]
  52. South Power Restored After Thailand’s “Worst-Ever” Blackout (Updated). Available online: https://www.bangkokpost.com/learning/learning-news/351298/south-power-restored-after-thailand-s-worst-ever-blackout (accessed on 3 January 2021).
  53. Krabi Coal Plant Up in the Air. Available online: https://www.bangkokpost.com/thailand/general/1237518/krabi-coal-plant-up-in-the-air (accessed on 3 January 2021).
  54. Janejadkarn, A.; Chavalparit, O. Biogas Production from Napier Grass (Pak Chong 1) (Pennisetum purpureum × Pennisetum americanum). Adv. Mater. Res. 2013, 856, 327–332. [Google Scholar] [CrossRef]
  55. Bossel, U.; Eliasson, B.; Taylor, G. The Future of the Hydrogen Economy: Bright or Bleak? Cogener. Distrib. Gener. J. 2003, 18, 29–70. [Google Scholar] [CrossRef]
  56. Krittayakasem, P.; Patumsawad, S.; Garivait, S. Emission Inventory of Electricity Generation in Thailand. JSEE 2011, 2, 65–69. [Google Scholar]
Figure 1. Simulation results for the development of LAI (red line) of Napier grass with the set of parameters (initial parameters) obtained from Gil et al. [26], and the comparison of experimental yield at harvest (black squares) and simulated yield (black line) at Sukhothai plantation from May 2001 to April 2002 [31].
Energies 14 01326 g001
Figure 2. Comparison of the evaluations of sensitivity indices for the eight parameters within the upper (■) and lower () ranges shown in Table 1.
Energies 14 01326 g002
Figure 3. Goodness-of-fit plots with 1:1 line comparing the estimated and simulated Napier grass DMY values with parameters before and after calibration under different N-fertilizer levels, where controlled, treatment 1, treatment 2, and treatment 3 represent N-fertilizer levels of 0, 125, 250, and 500 kg·ha−1, respectively.
Energies 14 01326 g003
Figure 4. Simulation results for the LAI development (red line) of Napier grass with calibrated parameters, and the comparison of experimental yield at harvest (black squares) and simulated yield (black line) at Sukhothai plantation from May 2001 to April 2002 [43].
Energies 14 01326 g004
Figure 5. Spatial distribution of simulated mean yield per hectare of Napier grass in Thailand.
Energies 14 01326 g005
Figure 6. Provincial distribution of: (a) Napier grass-derived electric supply potential; (b) total electric consumption per capita; and (c) the supply–demand ratio.
Energies 14 01326 g006
Table 1. List of parameters for Napier grass in the SWAT2012 crop database [26,27,28,29,30].
ParameterAcronymRangeInitial ValueUnit
Radiation use efficiency in ambient CO2 BIO_E35–5347(kg/ha)·(MJ/m2)−1
Potential harvested index for the plant at maturity HVSTI0.8–1.00.9NA
Potential maximum leaf area index of the plantBLAI6.0–8.06.2(m2·m−2)
Fraction of growing season coinciding with LAIMX1FRGRW10.1–0.150.15NA
Fraction of growing season coinciding with LAIMX2FRGRW20.2–0.60.5NA
First point fraction of BLAI for optimum growth curveLAIMX10.01–0.20.01NA
Second point fraction of BLAI for optimum growth curveLAIMX20.6–0.950.9NA
Fraction of growing season when growth declinesDLAI0.45–1.00.95NA
Table 2. List of data used in this work for SWAT2012 simulation.
DataResolution/Type of DataYearSource
Digital Elevation Model (DEM), (STRM 90 m)90 m-United States Geological Surveys (USGS)
Land Use/Land Cover, (GlobCover 2009)300 m2009European Space Agency (ESA)
Land cover Polygons2009–2014Land Development Department of Thailand (LDD)
Soil data, (Harmonized World Soil Database v 1.2)30 arc-second raster-FAO-UNESCO harmonized world soil database
Weather dataWeather observing station1993–2005Thai Meteorological Department (TMD)
Weather data2.5° × 3.75°1979–2014The National Centers for Environmental Prediction (NCEP)
Table 3. Parameter setting for Napier grass in the SWAT model crop file, and the RMSE of yield by initial and final values after calibration.
BIO_E (kg/ha)/(MJ/m2)HVSTIBLAI (m2/m2)FRGRW1FRGRW2LAIMX1LAIMX2DLAIRMSE of Yield (t·ha1)
Initial value470.96.20.150.50.010.90.9510.77
Final value380.86.00.150.20.010.70.551.49
Table 4. Mean simulated and observed Napier grass DMY values in t·ha−1 according to crop site treatments and statistical analysis results (RMSE, ME, and R2).
TreatmentMean DMY (t·ha−1)RMSE (t·ha−1)ME (t·ha−1)R2
MeasuredSimulated
Con (n = 42)12.5812.831.4910.2490.81
T1 (n = 15)18.6018.681.1630.0830.74
T2 (n = 17)21.9421.870.866−0.0760.72
T3 (n = 19)25.8524.901.634−0.9490.64
All (n = 93)17.9717.891.380−0.0820.95
Table 5. The regional electric consumption, population, and electric consumption per capita collected from EGAT [8].
RegionElectric Consumption (GWh)Population (×1000)Electric Consumption per Capita (kWh·Person−1)Estimated yield (kt)Average Yield (t·ha−1)Abandoned Area (ha)Napier Grass-Derived Electric Supply Potential (GWh)Supply/Demand
North778659541308409917.4235,470440856.6%
East29,28052195611427321.5198,659459615.7%
West 743830592432294916.0184,458317142.6%
South15,04391011653790422.3354,553850156.5%
Northeast22,19018,872117616,64219.2866,37117,89980.7%
Central88,22224,5693591584218.6314,89862847.1%
Total169,96066,774254541,70919.42,154,40944,80626.4%
Publisher’s Note: MDPI stays neutral with regard to jurisdictional claims in published maps and institutional affiliations.

