Abstract
This article substantiates the need to find and implement innovative tools to improve the efficiency of the domestic system for energy sector control. The authors determined that energy policy renewal should consider Ukraine’s commitments to transition to a carbon-neutral economy. The systematization of scientific achievements shows that one of the priority tasks is to minimize the gaps in the energy efficiency of the national economy. It is established that, despite the significant scientific achievements in this area, the scientific community has not adopted a single approach to assessing energy efficiency yet. The purpose of this article is to assess the energy efficiency gaps in the national economy, in order to identify their peak values and the factors causing them, and appropriate mechanisms to minimize them. The energy efficiency gaps are assessed using frontal analysis and Shepard’s energy distance function. Analytical data from the World Bank, the Swiss Institute of Economics, and the International Energy Agency form the information base. The study applied software package Stata 14 for calculation the energy efficiency gaps for Ukraine for 2002–2019. The study applied the Shepard’s function translogarithmic, stochastic frontier analysis for the assessment of energy efficiency gaps. According to the study results, the average level of energy efficiency gaps is 0.12, and their values became the largest in 2009 and 2015. First of all, this is due to the impact of the global financial crisis and the escalation of military–political conflicts. The growing dynamics of the energy efficiency gaps level is due to the excess of the negative effect of increasing exports of primary energy resources and inefficient technologies for their processing over the positive impact of energy-efficient innovation imports. In this case, the government should provide a proactive strategy for creating a positive investment climate, in order to attract additional financial resources for extending green innovations and popularizing the green style and cultivate the energy safety behavior in society.
1. Introduction
The adoption of the concept regarding the green energy transition of the national economy necessitates the search for innovative tools to improve regulation of the domestic energy sector. At the same time, it is necessary to update energy policy considering the European Union’s (EU’s) requirements and standards. In this case, one of the priority tasks for the government is to find tools to minimize the energy efficiency gaps of the national economy through the increasing of energy efficiency of the national economy. In addition, the accepted EU vector of Ukrainian development and accepted Green Deal Policy requires the synchronization of the Ukrainian energy system and policy with the EU. Despite significant scientific achievements in this area, the scientific community has not adopted a single approach to assessing energy efficiency yet. The purpose of the article is to assess the energy efficiency gaps in the national economy, in order to identify their peak values and the factors causing them, as well as appropriate mechanisms to minimize them.
2. Literature Review
In prior papers [1], scientists have confirmed that the energy efficiency of the country is a key driver to transition into a green economy. At the end of the last century, scientists began to investigate the reasons for energy efficiency gaps. A theoretical example of this problem is the study of Jaffe and Stavins [2]. The authors try to explain the essence of the “energy efficiency gap”, and formulate the main criteria affecting optimal energy consumption. Scientists conclude that the gap in energy efficiency is the difference between the available and possible economic, technological, and social potentials of energy consumption.
The analysis of scientific investigations gives grounds to conclude that many scientists evaluate energy efficiency gaps as the difference between the potential and actual ability to generate and consume energy from a technological point of view. Thus, Lee and Lin [3] propose assessing energy efficiency gaps through technological and economic components. Gillingham and Palmer [4] follow a similar view. The authors substantiate that it is necessary to consider technological and economic indicators (labor and capital) in assessing energy efficiency gaps.
While assessing the energy efficiency gaps, scientists Zhang and Zhou [5] consider the geographical location of the China province, its economic indices, and its strategic development goals. The authors used panel data from 284 cities in China from 2003 to 2013 for empirical analysis. The obtained results showed that the regions’ economic development heterogeneity has a statistically significant impact on the volume of energy efficiency gaps. In other papers [6,7], scientists have proved that energy efficiency and energy efficiency gaps depend on economic structure, technological preconditions, and behavioral determinants.
Based on study results [8], this paper’s authors determined that the mechanism to compare the actual energy efficiency level with its previous value is the basis for assessing energy efficiency gaps. Thus, scientists [9] proposed evaluating energy efficiency using data envelopment analysis (DEA), based on data analysis of input–output energy use. The authors emphasized the expediency of combining two models: the traditional CCR (standard conventional model implication) and the extended SBM model. The results of the study show that a timely assessment of energy efficiency minimizes its gaps. Besides, there is a need to find alternative energy sources and their efficient combinations.
In their paper, Lin and Long [10] analyzed the energy efficiency of the country using the stochastic frontier analysis. Chai and Baudelaire [11], using the MOA approach, which provides an analysis of motivation, opportunities, and benefits for increasing energy efficiency, assess energy efficiency gaps. The authors focus on the first two components: “motivation” and “opportunities”. They used the data of a field survey conducted by the Institute of Energy Research of the National University of Singapore to confirm the hypotheses. Using structural modelling and the PL SM (partial least squares) method, the authors found out that the minimization of energy losses and the introduction of new technologies have a statistically significant positive impact on energy efficiency. At the same time, innovative technologies form the preconditions for raising the environmental awareness level. One should note that Chai and Baudelaire argued that compliance with the principles of the company’s corporate social responsibility and regulations does not significantly impact the volume of energy efficiency gaps at the company level.
Mier and Weisbart [12], analyzing the prospects for the development of the energy sector in the implementation of policies to decarbonize and minimize energy efficiency gaps, justify the feasibility of including demand for energy resources and the volume of attracted green investments in the energy model analysis, provided that the partial equilibrium of the energy market is achieved. Mier and Weisbart use the EU-REGEN model to describe the European electricity market. Thus, the authors determined that increasing energy efficiency in the short term reduces carbon emissions by 11% and creates the preconditions for lowering the energy efficiency gap in the long run. The authors also identified that volumes of energy generation from alternative sources have the most statistically significant impact on energy efficiency. Moreover, the development of alternative energy sources provides the maximum reduction of energy efficiency gaps. Mier and Weisbart emphasize that attracting green investment minimizes energy efficiency gaps in the long run [12].
Considering the latest trends, scientists analyze energy efficiency gaps through corporate culture and knowledge sharing [13], green entrepreneurship [14], quality of business environment [15], waste management, and energy efficiency technologies [16,17,18,19,20,21]. In addition, a huge range of the countries have started transformation process on greening in all spheres for decreasing the energy efficiency gaps: tourism [22], the transport sector [23], and the industry sector [24,25].
Scientists have proven that the magnitude of energy efficiency gaps depends on regulation efficiency with regard to climate change policy [26,27,28], extending of renewable energy [29], macroeconomic stability [30], and transparency policies [31]. Each group of indices has some sub-indices for estimating the volume of energy efficiency gaps. It is worth noting that scientists [32,33,34] have used the different approaches to estimate energy efficiency gaps to relate the core determinates. In their work [33], Palmer and Wall assess the gaps in energy efficiency using the example of the American residential complex. In this case, the main indicator is the number of energy costs in energy consumption and transportation. The authors substantiate that the isolation of regulatory policy from the real functioning of the American housing complex and the energy market has provoked an increase in energy efficiency gaps. Scientists [35,36,37,38,39,40,41,42,43] have confirmed that a country’s favorable investment climate allows attracting additional investment in green technologies that increase the country’s energy efficiency.
Thus, the authors here propose to evaluate a set of indicators within each group of drivers:
Internal drivers include
- efficiency of technologies [44,45];
- operating expenses;
- access to capital;
- organizational structure [46,47];
- the level of environmental responsibility and awareness of the company’s administration regarding energy-efficient technologies [48,49,50,51,52,53,54];
- innovativeness of energy-efficient technologies [55,56].
- External drivers include
- level of competitiveness [57,58];
- efficiency of power grids [59];
- effectiveness of energy policies and regulatory interventions [60,61,62,63,64,65,66,67].
Scientists [67,68,69,70,71,72,73,74,75,76] have confirmed that macroeconomic indicators influence a country’s energy security and energy efficiency. Simultaneously, human capital and financial development have influenced CO2 emissions and energy efficiency [67,68,71,72,73,74,75,76,77,78,79,80,81,82,83,84,85,86]. Malinauskaite et al. [87] confirmed that energy efficiency of the industry sector has influenced the achievement of the goals of the Green Deal Policy. Akram et al. [88], using the ordinary least squares and fixed-effect panel quantile regression, proved that energy efficiency has had a statistically significant impact on carbon emissions for developing countries. Yang and Lam [89] confirmed the hypothesis that energy efficiency gaps appear due to low environmental responsibility and awareness of the non-market benefits of energy-efficient technologies. The authors used the contingent valuation method and probit analysis. Arbolino et al. developed their methods of increasing energy efficiency due to decreasing gaps between the local areas in Italy [90]. They developed a local energy efficiency index and used principal component analysis.
The analysis of the scientific and methodological approaches to assess energy efficiency gaps confirmed the existence of significant differences in practices, the inconsistency of the results, and the diversity of determinants considered during the assessment of the energy efficiency gaps. Therefore, it is necessary to find an approach for assessing energy efficiency gaps. The paper aims to develop approaches to estimate the energy efficiency gap in the national economy. It would allow a country to identify its peak values and the factors causing them, and appropriate mechanisms to minimize them.
3. Materials and Methods
Considering the results of the analysis of the approaches to define energy efficiency gaps [2,3,4,5,6,7,8,9,10,11,12], the authors propose systematically combining the stochastic frontal analysis (SFA) and Shepard’s energy distance function to assess energy efficiency gaps. Traditionally, increasing efficiency theory involves optimizing the result by maximizing production and profits and minimizing costs. In general, the stochastic production frontier function can be written in the form of Formula (1):
where i = 1, …,N and t = 1, …,T; ui ≥ 0; yit is the value of the resulting indicator of the i-th product per year (dependent variable); xnit is the parameter of the resulting indicator of the i-th product for the period t (independent variables); ut is the non-negative invariant random variable caused by technical inefficiencies; vit is the random value of the i-th unit in the year t, reflecting the effect of statistical noise; ln indicates natural logarithm; and β0 … βn are the calculated parameters of the model.
Considering certain papers [2,11,12] the Cobb–Douglas function applies to estimation of the economic development of a country where the energy sources are the key driver. In the general Cobb–Douglas function [83],
where x represents the independent variable of the model, β0 … βi are the calculated parameters of the model and the output elasticity coefficient of the independent variables, i = 1…N is the number of input parameters of the model, and f(x, β) is the function of the output parameters.
The findings in previous papers [5,10,11] confirm that the translog function allowed elimination of the problem, with liner causal relationships between input and output. Thus, the translog function could be written as [83]
where x is the input parameter of the model, i = 1 … N and j = 1 … N are the numbers of production factors, ln is the natural logarithm, and β0 … βij are the calculated parameters of the model.
Using the test results of the likelihood logarithms ratio, a number of authors [2,11,12,66] have emphasized the practical advantage of using the translog function. It relates to the possibility of considering the non-monotonic dependence of the output parameters on the input ones, the linearity of the transformation of the variable, and the relatively small number of estimated parameters.
In this study, energy efficiency gaps are estimated based on Shepard’s function (Formula (4)). Shepard’s function differs from the Cobb–Douglas function, mainly because it considers the amount of energy consumed along with capital and labor.
where DE(K, L, E, Y) is the Shepard energy distance function, K represents the volume of gross fixed capital in the country, L is the size of the working population, E is the amount of energy consumed in the country, Y is the gross domestic product of the country, and PE represents the number of energy efficiency gaps in the national economy.
Taking into account the specific nature of the frontal analysis and Shepard’s energy distance function, the translogarithmic, stochastic frontier model within this study is proposed to be presented in the form of
where α0 … α9, β0 … β5, γ0, θ0 … θ2 are the model constants; K represents the volumes of gross fixed capital in the country; L is the size of the working population; E is the amount of energy consumed in the country; Y represents the gross domestic product of the country; Trade is the level of the country’s economy openness; KOF is the globalization index; U is the share of urban population in its total number; t = 1…T represents the period of the research; ϑt is a normally distributed component of statistical errors, considering statistical noise and the influence of random external factors; μt is a component that explains the reasons for inefficient energy use; and ε is the statistical error of the model.
One should note that the proposed methodological tools for assessing energy efficiency gaps in the national economy allow consideration of the random nature of endogenous determinants of energy efficiency gaps, retrospective dynamics of the changes in energy efficiency gaps in Ukraine, and identifying critical bifurcation points.
The following indicators were selected as independent exogenous variables:
- globalization index (KOF);
- level of openness of the economy (Trade);
- level of urbanization (U).
Before constructing a translogarithmic, stochastic production function, it is necessary to carry out the normalization procedure. In this paper, the logarithmation of all model variables is used for normalization. If the studied variable is negative, the time series is first increased by one, and then logarithmically.
At the next stage, the study checks the following hypothesis (H1): that greenhouse gas emissions linked with energy efficiency gaps and gross domestic product explain economic growth. In addition, the indicators of globalization index, level of openness of the economy, and level of urbanization were taken as explanatory variables. Considering the findings in previous papers [2,11,12,66], the abovementioned variables have influenced economic growth of the country. Thus, using the EKC hypothesis (7), the function for checking the link between economic growth and energy efficiency gaps was developed in (8). In this case, Pollution was explained by GHG emissions in kt of CO2 equivalent, with an output of GDP per capita.
where Pollution refers to environmental pollution, X is the output, and ξ is the control variable.
where t is the year, et is the error, α0, …, α6 represents the regression’s parameters, GHG represents greenhouse gas emissions in kt of CO2 equivalent, GDP is the GDP per capita, PE is the energy efficiency gap, KOF is the globalization index, Trade indicates the level of openness of the economy, and U is the level of urbanization.
For checking the H1 hypothesis, the ordinary least squares (OLS) method was used. A sample of time series was formed to estimate the energy efficiency gaps. The study’s information base included analytical data from the World Bank, the Swiss Institute of Economics, and the International Energy Agency. The Stata 14 software package for 2002–2019 was used to calculate energy efficiency gaps.
4. Results
Initial data for calculation are in Table 1.

Table 1.
Baseline data for estimating energy efficiency gaps in the national economy.
Descriptive baseline statistics for estimating energy efficiency gaps in the national economy and their graphical interpretation are presented in Table 2 and Figure 1.
Table 2.
Descriptive statistics and correlation matrix of initial data for estimating energy efficiency gaps in the national economy.
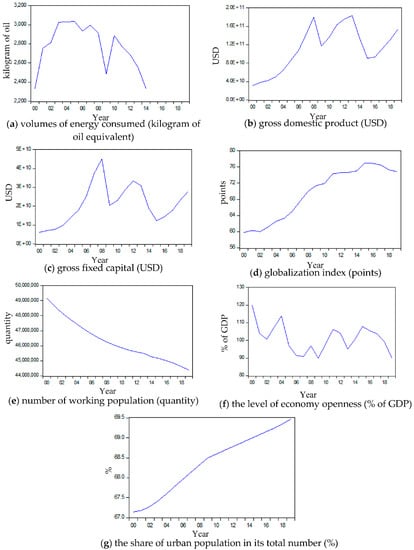
Figure 1.
Graphical interpretation of initial data for estimating energy efficiency gaps in Ukraine, 2000–2019.
At the first stage of the investigation, the descriptive statistics for selected variables was done. The findings in Table 2 confirmed that the average and standard deviation of the variables were in the minimum and maximum interval. Therefore, the highest average value of energy consumed in Ukraine was 3033.18; at the same time, the lowest level was 2334.41. Four variables—the amount of energy consumed, gross domestic product, globalization index, and the share of urban population in its total number—were negatively skewed. Only the volume of gross fixed capital in the country, the size of working population, and the level of country’s economy openness were positively skewed. In particular, the logarithm of all variables was negatively skewed. It allowed the conclusion that the average value could not adequately describe the country’s development. Besides, all variables had a positive level of kurtosis. This means that selected variables are possibly leptokurtic in form. The strong corelations were between parameters K, L, and Y, which proves the core hypothesis of the Cobb–Douglas theory (Table 2). Besides, the tendencies of the globalization process line up with the tendencies of economic development. This was confirmed by the results of the correlation matrix between variables KOF and Y, as seen in Table 2.
A graphical interpretation of descriptive statistics is presented in the Figure 1.
Results from evaluation of parameters α0…α9, β0…β5, θ0…θ2 from Equations (5) and (6) are in Table 3.
Table 3.
The results of the assessment of energy efficiency gaps in the national economy.
The study results allowed forming of the limit values of the energy efficiency gaps in the national economy. Thus, the range of fluctuations in the magnitude of energy efficiency gaps is from 1 to 0. In this case, if PE = 0, there are no energy efficiency gaps, and PE = 1 indicates a critical level of energy efficiency gaps.
A graphical interpretation of the assessment results of the energy efficiency gaps is shown in Figure 2. The bifurcation points (rapid growth in the level of energy efficiency gaps) were in the years 2010 and 2016.
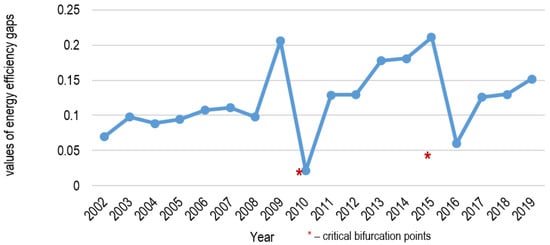
Figure 2.
Graphical interpretation of the assessment results of the energy efficiency gaps in Ukraine in 2002–2019. Source: compiled by the author.
According to the study results, in Ukraine, the average energy efficiency gaps were 0.12 during the study period. These gaps became the largest in 2009 and 2015, influenced by the global financial crisis and the escalation of military–political conflicts. The growing dynamics of the energy efficiency gaps in Ukraine is due to the excess of the negative effect of increasing exports of primary energy resources and inefficient technologies for their processing over the positive impact of energy-efficient innovations imports.
The findings in Table 4 confirm that in the model, with and without control variables, all indicators have a statistically significant impact on the decrease of GHG, excluding two variables: the level of country’s economy openness and the index of globalization. In addition, α1 = 0.00621 and α2 = −0.00741 for the model with a control variable. For the models without control variables, α1 = 0.00571 and α2 = −0.00634 for model 2; α1 = 0.00568 and α2 = −0.00624 for model 3; α1 = 0.00556 and α2 = −0.00661 for model 4; and α1 = 0.00543 and α2 = −0.00621 for model 5. Considering the findings in all models included α1 > 0 and α2 < 0, they confirmed the EKC hypothesis for Ukraine. Thus, increasing of PE by 1% led to an increase of GHG emissions by 1–2%.
Table 4.
The findings of ordinary least squares (OLS) of the analysis for GHG, GDP, PE, KOF, Trade, and U.
5. Discussion
The study used the SFA and Shepard’s function for estimating energy efficiency gaps. The findings confirmed that the average level of energy efficiency gaps was 0.12, and their values became the largest in 2009 and 2015. Such energy efficiency gaps were the consequences the global financial crisis and the escalation of military–political conflicts, the negative effect of increasing exports of primary energy resources, and inefficient technologies.
The developed methodology explains the retrospective changes of the energy efficiency gap and helps identify the bifurcation points. The findings allowed an estimation of the efficiency of government regulations for the declining of energy efficiency gaps.
It is noteworthy that contrary to some previous papers [2,4,10,11,13], this study used the endogenous variables of the energy efficiency gap: globalization index, trade openness, and urbanization. In addition, new trends justified the necessity of considering additional determinants that could increase the efficiency of energy consumption [13,14,15,16,17,18,19,20,21,22,23,24,25]. In this case, it is possible to analyze the mechanisms and instrument of extending green technologies, spreading biogas technologies among society, and implementing green innovations at companies.
6. Conclusions
Ribera et al. [91] highlighted that energy issues require the use of multi-criteria approaches to identify the options of increasing level of efficiency. Thus, governments should consider all effects (economic, social, financial, cultural, and ecological), due to the development of incentive instruments to minimize energy efficiency gaps. According to the evaluation of practical measures to minimize energy efficiency gaps, it is significant that there was a small number of gaps in 2010 and 2016, when strategies and programs for the energy sector development were ratified. Thus, in 2010 the “State Targeted Economic Program for Energy Efficiency and Development of Energy Production from Renewable Energy Sources and Alternative Fuels for 2010–2020” was implemented. Since 2015, “Sustainable Development Strategy Ukraine—2020”, “National Security Strategy of Ukraine”, and the “National Action Plan on Energy Efficiency until 2020” have also been enacted. One should note that the efficiency of fulfilling the tasks defined by these documents was relatively high at the initial stages. It led to a significant reduction in energy efficiency gaps. The findings confirmed that increasing energy efficiency gaps lead to an increase of environmental pollution. In addition, the increasing of level of urbanization leads to increasing greenhouse gas emissions. In this case, the government should provide a proactive strategy for creating a positive investment climate, to attract additional financial resources for extending the green innovations; popularizing the green lifestyle among society; and cultivating energy safety behavior. Thus, in order to decrease energy efficiency gaps, the government should increase energy efficiency by extending and implementing energy efficiency technologies and renewable energies among all sectors. In this case, the EU experience has shown that preferential credits and taxation for green technologies were the most effective incentive instruments. In addition, the Ukrainian government should develop a positive business climate for green investors. Therefore, regulation on providing transparency at all stages of implementing green projects and green investment should be developed at the government level.
Author Contributions
Conceptualization T.V. and Y.B.; methodology G.M. and T.V.; writing—review and editing T.V., V.P., Y.B., G.M. and M.R. All authors have read and agreed to the published version of the manuscript.
Funding
This research was funded by the grant from the National Research Foundation of Ukraine, “Stochastic modelling of road map for harmonizing national and European standards for energy market regulation in the transition to a circular and carbon-free economy” (ID 2020.02/0231), as well as grants from the Ministry of Education and Science of Ukraine (no. 0120U102002).
Institutional Review Board Statement
Not applicable.
Informed Consent Statement
Not applicable.
Data Availability Statement
Not applicable.
Conflicts of Interest
The authors declare no conflict of interest.
References
- Lorek, S.; Spangenberg, J.H. Sustainable consumption within a sustainable economy–beyond green growth and green economies. J. Clean. Prod. 2014, 63, 33–44. [Google Scholar] [CrossRef]
- Jaffe, A.B.; Stavins, R.N. The energy-efficiency gap What does it mean? Energy Policy 1994, 22, 804–810. [Google Scholar] [CrossRef]
- Li, K.; Lin, B. Metafroniter energy efficiency with CO2 emissions and its convergence analysis for China. Energy Econ. 2015, 48, 230–241. [Google Scholar] [CrossRef]
- Gillingham, K.; Palmer, K. Bridging the Energy Efficiency Gap: Policy Insights from Economic Theory and Empirical Evidence. Rev. Environ. Econ. Policy 2014, 8, 18–38. [Google Scholar] [CrossRef]
- Zhang, N.; Zhou, M. The inequality of city-level energy efficiency for China. J. Environ. Manag. 2020, 255, 109843. [Google Scholar] [CrossRef] [PubMed]
- Tvaronavičienė, M.; Prakapienė, D.; Garškaitė-Milvydienė, K.; Prakapas, R.; Nawrot, Ł. Energy Efficiency in the Long-Run in the Selected European Countries. Econ. Sociol. 2018, 11, 245–254. [Google Scholar] [CrossRef]
- Shindina, T.; Streimikis, J.; Sukhareva, Y.; Nawrot, Ł. Social and Economic Properties of the Energy Markets. Econ. Sociol. 2018, 11, 334–344. [Google Scholar] [CrossRef]
- Pavlyk, V. Institutional Determinants of Assessing Energy Efficiency Gaps in the National Economy. Socioecon. Chall. 2020, 4, 122–128. [Google Scholar] [CrossRef]
- Abbas, A.; Waseem, M.; Yang, M. An ensemble approach for assessment of energy efficiency of agriculture system in Pakistan. Energy Effic. 2020, 13, 683–696. [Google Scholar] [CrossRef]
- Lin, B.; Long, H. A stochastic frontier analysis of energy efficiency of china’s chemical industry. J. Clean. Prod. 2015, 87, 235–244. [Google Scholar] [CrossRef]
- Chai, K.-H.; Baudelaire, C. Understanding the energy efficiency gap in Singapore: A Motivation, Opportunity, and Ability perspective. J. Clean. Prod. 2015, 100, 224–234. [Google Scholar] [CrossRef]
- Mier, M.; Weissbart, C. Power markets in transition: Decarbonization, energy efficiency, and short-term demand response. Energy Econ. 2020, 86, 104644. [Google Scholar] [CrossRef]
- Gerarden, T.D.; Newell, R.G.; Stavins, R.N.; Stowe, R.C. An assessment of the energy-efficiency gap and its implications for climate-change policy (No. w20905). Natl. Bur. Econ. 2015. Available online: https://www.nber.org/papers/w20905 (accessed on 1 November 2020).
- Muo, I.; Azeez, A.A. Green entrepreneurship: Literature review and agenda for future research. Int. J. Entrep. Knowl. 2019, 7, 17–29. [Google Scholar] [CrossRef]
- Čepel, M. Social and Cultural Factors and their Impact on the Quality of Business Environment in the SME Segment. Int. J. Entrep. Knowl. 2019, 7, 65–73. [Google Scholar] [CrossRef]
- Jandačka, J.; Mičieta, J.; Holubčík, M.; Nosek, R. Experimental Determination of Bed Temperatures during Wood Pellet Combustion. Energy Fuel 2017, 31, 2919–2926. [Google Scholar] [CrossRef]
- Maroušek, J.; Rowland, Z.; Valášková, K.; Král, P. Techno-economic assessment of potato waste management in developing economies. Clean Technol. Environ. Policy 2020, 22, 937–944. [Google Scholar] [CrossRef]
- Lenhard, R.; Malcho, M.; Jandačka, J. Modelling of Heat Transfer in the Evaporator and Condenser of the Working Fluid in the Heat Pipe. Heat Transf. Eng. 2018, 40, 215–226. [Google Scholar] [CrossRef]
- Maroušek, J.; Bartoš, P.; Filip, M.; Kolář, L.; Konvalina, P.; Maroušková, A.; Moudrý, J.; Peterka, J.; Šál, J.; Šoch, M.; et al. Advances in the agrochemical utilization of fermentation residues reduce the cost of purpose-grown phytomass for biogas production. Energy Sources Part A 2020, 1–11. [Google Scholar] [CrossRef]
- Mardoyan, A.; Braun, P. Analysis of Czech Subsidies for Solid Biofuels. Int. J. Green Energy 2015, 12, 405–408. [Google Scholar] [CrossRef]
- Maroušek, J.; Strunecký, O.; Kolář, L.; Vochozka, M.; Kopecky, M.; Maroušková, A.; Batt, J.; Poliak, M.; Šoch, M.; Bartoš, P.; et al. Advances in nutrient management make it possible to accelerate biogas production and thus improve the economy of food waste processing. Energy Sources Part A 2020, 1–10. [Google Scholar] [CrossRef]
- Vu, H.M.; Ngo, V.M. Strategy Development from Triangulated Viewpoints for a Fast Growing Destination Toward Sustainable Tourism Development–A Case Of Phu Quoc Islands in Vietnam. J. Tour. Serv. 2019, 10, 117–140. [Google Scholar] [CrossRef]
- Vatankhah, S.; Zarra-Nezhad, M.; Amirnejad, G. An empirical assessment of willingness to accept “low-cost” air transport services: Evidence from the Middle East. J. Tour. Serv. 2019, 10, 79–103. [Google Scholar] [CrossRef]
- Maroušek, J.; Maroušková, A.; Kůs, T. Shower cooler reduces pollutants release in production of competitive cement substitute at low cost. Energy Sources Part A 2020, 1–10. [Google Scholar] [CrossRef]
- Hadzima, B.; Janeček, M.; Estrin, Y.; Kim, H.S. Microstructure and corrosion properties of ultrafine-grained interstitial free steel. Mater. Sci. Eng. A 2007, 462, 243–247. [Google Scholar] [CrossRef]
- Bencsik, A.; Kosár, S.T.; Máchová, R. Corporate Culture in Service Companies that Support Knowledge Sharing. J. Tour. Serv. 2018, 9, 7–13. [Google Scholar] [CrossRef]
- Sjaifuddin, S. Environmental management prospects of industrial area: A case study on mcie, indonesia. Verslas Teor. Prakt. 2018, 19, 208–216. [Google Scholar] [CrossRef]
- Nunes, F.G.; Martins, L.M.; Mozzicafreddo, J. The influence of service climate, identity strength, and contextual ambidexterity upon the performance of public organizations. Adm. Manag. Public 2018, 31, 6–20. [Google Scholar] [CrossRef]
- Cebula, J.; Chygryn, O.; Chayen, S.V.; Pimonenko, T. Biogas as an alternative energy source in Ukraine and Israel: Current issues and benefits. Int. J. Environ. Technol. Manag. 2018, 21, 421. [Google Scholar] [CrossRef]
- Lyulyov, O.; Shvindina, H. Stabilization Pentagon Model: Application in the management at macro- and micro-levels. Probl. Perspect. Manag. 2017, 15, 42–52. [Google Scholar] [CrossRef]
- Makarenko, I.; Sirkovska, N. Transition to sustainability reporting: Evidence from EU and Ukraine. Bus. Eth. Leadersh. 2017, 1, 16–24. [Google Scholar] [CrossRef]
- Honma, S.; Hu, J.-L. A meta-stochastic frontier analysis for energy efficiency of regions in Japan. J. Econ. Struct. 2018, 7, 21. [Google Scholar] [CrossRef]
- Palmer, K.; Walls, M. Using information to close the energy efficiency gap: A review of benchmarking and disclosure ordinances. Energy Effic. 2017, 10, 673–691. [Google Scholar] [CrossRef]
- Solnørdal, M.T.; Foss, L. Closing the Energy Efficiency Gap—A Systematic Review of Empirical Articles on Drivers to Energy Efficiency in Manufacturing Firms. Energies 2018, 11, 518. [Google Scholar] [CrossRef]
- Bhowmik, D. Financial Crises and Nexus between Economic Growth and Foreign Direct Investment. Financ. Mark. Inst. Risks 2018, 2, 58–74. [Google Scholar] [CrossRef]
- Chygryn, O.; Pimonenko, T.; Luylyov, O.; Goncharova, A. Green Bonds like the Incentive Instrument for Cleaner Production at the Government and Corporate Levels: Experience from EU to Ukraine. J. Environ. Manag. Tour. 2019, 9, 1443–1456. [Google Scholar] [CrossRef]
- Smékalová, L. Evaluating the cohesion policy: Targeting of disadvantaged municipalities. Adm. Manag. Public 2018, 31, 143–154. [Google Scholar] [CrossRef]
- Lyeonov, S.; Pimonenko, T.; Bilan, Y.; Štreimikienė, D.; Mentel, G. Assessment of Green Investments’ Impact on Sustainable Development: Linking Gross Domestic Product Per Capita, Greenhouse Gas Emissions and Renewable Energy. Energies 2019, 12, 3891. [Google Scholar] [CrossRef]
- Prokopenko, O.; Chayen, S.; Cebula, J.; Pimonenko, T. Wind energy in Israel, Poland and Ukraine: Features and opportunities. Int. J. Ecol. Dev. 2017, 32, 98–107. [Google Scholar]
- Ibragimov, Z.; Lyeonov, S.; Pimonenko, T. Green investing for SDGS: EU experience for developing countries. Econo. Soc. Dev. Book Proc. 2019, 867–876. [Google Scholar]
- Vasylieva, T.A.; Leonov, S.L.; Makarenko, I.O.; Sirkovska, N. Sustainability information disclosure as an instrument of marketing communication with stakeholders: Markets, social and economic aspects. Mark. Manag. Innov. 2017, 4, 350–357. [Google Scholar] [CrossRef]
- Ibragimov, Z.; Vasylieva, T.A.; Lyulyov, O.V. The national economy competitiveness: Effect of macroeconomic stability, renewable energy on economic growth. In Socio Economic Problems of Sustainable Development: Book of Proceedings 37th International Scientific Conference on Economic an Social Development, Baku, Azerbaijan, 14–15 February 2019; Varazdin Development & Entrepreneurship Agency: Baku, Azerbaijan, 2019; pp. 878–887. [Google Scholar]
- Mentel, G.; Vasilyeva, T.; Samusevych, Y.; Pryymenko, S. Regional differentiation of electricity prices: Social-equitable approach. Int. J. Environ. Technol. Manag. 2018, 21, 354–372. [Google Scholar] [CrossRef]
- Derevianko, O. Reputation stability vs anti-crisis sustainability: Under what circumstances will innovations, media activities and CSR be in higher demand? Oeconomia Copernic. 2019, 10, 511–536. [Google Scholar] [CrossRef]
- Andrade, H.S.; Loureiro, G. A Comparative Analysis of Strategic Planning Based on a Systems Engineering Approach. Bus. Ethics Leadersh. 2020, 4, 86–95. [Google Scholar] [CrossRef]
- Visscher, I.; Beerkens, R. Organizational Identification at a Multinational Company. J. Intercult. Manag. 2020, 12, 67–98. [Google Scholar] [CrossRef]
- Mercado, M.D.P.S.R.; Vargas-Hernández, J.G. Analysis of the Determinants of Social Capital in Organizations. Bus. Ethics Leadersh. 2019, 3, 124–133. [Google Scholar] [CrossRef]
- Widiyanti, M.; Sadalia, I.; Zunaidah; Nisrul, I.; Hendrawaty, E. Determining firm’s performance: Moderating role of csr in renewable energy sector of indonesia. Pol. J. Manag. Stud. 2019, 19, 432–441. [Google Scholar] [CrossRef]
- Mačaitytė, I.; Kaunas University of Technology; Virbašiūtė, G. Volkswagen Emission Scandal and Corporate Social Responsibility–A Case Study. Bus. Ethics Leadersh. 2018, 2, 6–13. [Google Scholar] [CrossRef]
- Biewendt, M.; Blaschke, F.; Böhnert;, A. An Evaluation Of Corporate Sustainability In Context Of The Jevons. Socioecon. Chall. 2020, 4, 46–65. [Google Scholar] [CrossRef]
- Bryl, Ł. Long-term Development of National Human Capital. Evidence from China and Poland. J. Intercult. Manag. 2020, 12, 30–66. [Google Scholar] [CrossRef]
- Bilan, Y.; Lyeonov, S.; Stoyanets, N.; Vysochyna, A. The impact of environmental determinants of sustainable agriculture on country food security. Int. J. Environ. Technol. Manag. 2018, 21, 289–305. [Google Scholar] [CrossRef]
- Pavlyk, V. Assessment of green investment impact on the energy efficiency gap of the national economy. Financ. Mark. Inst. Risks 2020, 4, 117–123. [Google Scholar] [CrossRef]
- Lyulyov, O.; Pimonenko, T.; Kwilinski, A.; Dzwigol, H.; Dzwigol-Barosz, M.; Pavlyk, V.; Barosz, P. The Impact of the Government Policy on the Energy Efficient Gap: The Evidence from Ukraine. Energies 2021, 14, 373. [Google Scholar] [CrossRef]
- Zaušková, A.; Rezníčková, M. SoLoMo marketing as a global tool for enhancing awareness of eco-innovations in Slovak business environment. Equilibrium 2020, 15, 133–150. [Google Scholar] [CrossRef]
- Lipkova, L.; Braga, D. Measuring commercialization success of innovations in the EU. Mark. Manag. Innov. 2016, 4, 15–30. [Google Scholar]
- Kovacova, M.; Kliestik, T.; Valaskova, K.; Durana, P.; Juhaszova, Z. Systematic review of variables applied in bankruptcy prediction models of Visegrad group countries. Oeconomia Copernic. 2019, 10, 743–772. [Google Scholar] [CrossRef]
- Kliestik, T.; Valaskova, K.; Nica, E.; Kovacova, M.; Lazaroiu, G. Advanced methods of earnings management: Monotonic trends and change-points under spotlight in the Visegrad countries. Oeconomia Copernic. 2020, 11, 371–400. [Google Scholar] [CrossRef]
- Jonek-Kowalska, I. Transformation of energy balances with dominant coal consumption in European economies and Turkey in the years 1990–2017. Oeconomia Copernic. 2019, 10, 627–647. [Google Scholar] [CrossRef]
- Raszkowski, A.; Bartniczak, B. Towards sustainable regional development: Economy, society, environment, good governance based on the example of polish regions. Transform. Bus. Econ. 2018, 17, 225–245. [Google Scholar]
- Chygryn, O.Y.; Krasniak, V.S. Theoretical and applied aspects of the development of environmental investment in Ukraine. Mark. Manag. Innov. 2015, 3, 226–234. [Google Scholar]
- He, S. The Impact of Trade on Environmental Quality: A Business Ethics Perspective and Evidence from China. Bus. Ethics Leadersh. 2019, 3, 43–48. [Google Scholar] [CrossRef]
- Dkhili, H. Environmental performance and institutions quality: Evidence from developed and developing countries. Mark. Manag. Innov. 2018, 3, 333–344. [Google Scholar] [CrossRef]
- Bilan, Y.; Raišienė, A.G.; Vasilyeva, T.; Lyulyov, O.; Pimonenko, T. Public governance efficiency and macroeconomic stability: Examining convergence of social and political determinants. Public Policy Adm. 2019, 18, 241–255. [Google Scholar] [CrossRef]
- Salihaj, T.; Marthalen, C.O.Z.S.K.; Pryimenko, S. Modification of the International Energy Agency Model (the IEA Model of Short-term Energy Security) for Assessing the Energy Security of Ukraine. Socioecon. Chall. 2017, 1, 95–103. [Google Scholar] [CrossRef][Green Version]
- Singh, S. Regional Disparity and Sustainable Development in North-Eastern States of India: A Policy Perspective. Socioecon. Chall. 2018, 2, 41–48. [Google Scholar] [CrossRef]
- Stavytskyy, A.; Kharlamova, G.; Giedraitis, V.; Šumskis, V. Estimating the interrelation between energy security and macroeconomic factors in European countries. J. Int. Stud. 2018, 11, 217–238. [Google Scholar] [CrossRef] [PubMed]
- Bilan, Y.; Brychko, M.; Buriak, A.; Vasilyeva, T. Financial, business and trust cycles: The issues of synchronization. Zb. Rad. Ekon. Fak. Rij. 2019, 37, 113–138. [Google Scholar] [CrossRef]
- Vasylyeva, T.A.; Pryymenko, S.A. Environmental economic assessment of energy resources in the context of ukraine’s energy security. Actual Probl. Econ. 2014, 160, 252–260. [Google Scholar]
- Bilan, Y.; Vasilyeva, T.; Lyeonov, S.; Bagmet, K. Institutional complementarity for social and economic development. Verslas Teor. Prakt. 2019, 20, 103–115. [Google Scholar] [CrossRef]
- Piłatowska, M.; Włodarczyk, A. Decoupling Economic Growth from Carbon Dioxide Emissions in the EU Countries. Montenegrin J. Econ. 1992, 14, 7–26. [Google Scholar] [CrossRef]
- El Amri, A.; Boutti, R.; Rodhain, F. Sustainable Finance at the time of Institutions: Performativity through the lens of Responsible Management in Morocco. Financ. Mark. Inst. Risks 2020, 4, 52–64. [Google Scholar] [CrossRef]
- Chen, J.; Cheng, S.; Song, M.; Nikic, V. Quo vadis? Major players in global coal consumption and emissions reduction. Transform. Bus. Econ. 2018, 17, 112–132. [Google Scholar]
- Bilan, Y.; Lyeonov, S.; Lyulyov, O.; Pimonenko, T. Brand management and macroeconomic stability of the country. Pol. J. Manag. Stud. 2019, 19, 61–74. [Google Scholar] [CrossRef]
- Boutti, R. Multivariate Analysis of a Time Series EU ETS: Methods and Applications in Carbon Finance. Financ. Mark. Inst. Risks 2019, 3, 18–29. [Google Scholar] [CrossRef]
- Palienko, M.; Lyulyov, O.; Denysenko, P. Fiscal Decentralisation as a Factor of Macroeconomic Stability of the Country. Financ. Mark. Inst. Risks 2017, 1, 74–86. [Google Scholar] [CrossRef]
- Kazemilari, M.; Mohamadi, A.; Mardani, A.; Streimikiene, D. Network Topology of Renewable Energy Sector in Stock Exchange. Montenegrin J. Econ. 2018, 14, 167–174. [Google Scholar] [CrossRef]
- Karakasis, V.P. The impact of “policy paradigms” on energy security issues in protracted conflict environments: The case of Cyprus. Socioecon. Chall. 2017, 1, 5–18. [Google Scholar] [CrossRef]
- Chovancová, J.; Tej, J. Decoupling economic growth from greenhouse gas emissions: The case of the energy sector in V4 countries. Equilibrium 2020, 15, 235–251. [Google Scholar] [CrossRef]
- Djalilov, K.; Lyeonov, S.; Buriak, A. Comparative studies of risk, concentration and efficiency in transition economies. Risk Gov. Control. Financ. Mark. Inst. 2015, 5, 177–186. [Google Scholar] [CrossRef]
- Kendiukhov, I.; Tvaronavičienė, M. Managing innovations in sustainable economic growth. Mark. Manag. Innov. 2017, 3, 33–42. [Google Scholar] [CrossRef]
- Li, P.; Ouyang, Y. The dynamic impacts of financial development and human capital on co2 emission intensity in china: An ardl approach. J. Bus. Econ. Manag. 2019, 20, 939–957. [Google Scholar] [CrossRef]
- Leonov, S.V.; Vasilieva, T.A.; Buryak, A.V. Performance of Ukrainian banking business: Stochastic frontier analysis. Visnyk Natl. Bank Ukr. 2013, 6, 19–25. [Google Scholar]
- Kasperowicz, R. Economic growth and CO2 emissions: The ECM analysis. J. Int. Stud. 2015, 8, 91–98. [Google Scholar] [CrossRef]
- Kasperowicz, R.; Štreimikienė, D. Economic growth and energy consumption: A comparison of comparative analysis of V4 and “old” EU countries. J. Int. Stud. 2016, 9, 181–194. [Google Scholar] [CrossRef]
- Bilan, Y.; Streimikiene, D.; Vasylieva, T.; Lyulyov, O.; Pimonenko, T.; Pavlyk, A. Linking between Renewable Energy, CO2 Emissions, and Economic Growth: Challenges for Candidates and Potential Candidates for the EU Membership. Sustainability 2019, 11, 1528. [Google Scholar] [CrossRef]
- Malinauskaite, J.; Jouhara, H.; Egilegor, B.; Al-Mansour, F.; Ahmad, L.; Pusnik, M. Energy efficiency in the industrial sector in the EU, Slovenia, and Spain. Energy 2020, 208, 118398. [Google Scholar] [CrossRef] [PubMed]
- Akram, R.; Chen, F.; Khalid, F.; Ye, Z.; Majeed, M.T. Heterogeneous effects of energy efficiency and renewable energy on carbon emissions: Evidence from developing countries. J. Clean. Prod. 2020, 247, 119122. [Google Scholar] [CrossRef]
- Yang, W.; Lam, P.T. Non-market valuation of consumer benefits towards the assessment of energy efficiency gap. Energy Build. 2019, 184, 264–274. [Google Scholar] [CrossRef]
- Arbolino, R.; Boffardi, R.; De Simone, L.; Ioppolo, G. Who achieves the efficiency? A new approach to measure “local energy efficiency”. Ecol. Indic. 2020, 110, 105875. [Google Scholar] [CrossRef]
- Ribera, F.; Nesticò, A.; Cucco, P.; Maselli, G. A multicriteria approach to identify the Highest and Best Use for historical buildings. J. Cult. Herit. 2020, 41, 166–177. [Google Scholar] [CrossRef]


Publisher’s Note: MDPI stays neutral with regard to jurisdictional claims in published maps and institutional affiliations. |
© 2021 by the authors. Licensee MDPI, Basel, Switzerland. This article is an open access article distributed under the terms and conditions of the Creative Commons Attribution (CC BY) license (http://creativecommons.org/licenses/by/4.0/).