
Use of Time-Series NDWI to Monitor Emerging Archaeological Sites: Case Studies from Iraqi Artificial Reservoirs


Abstract
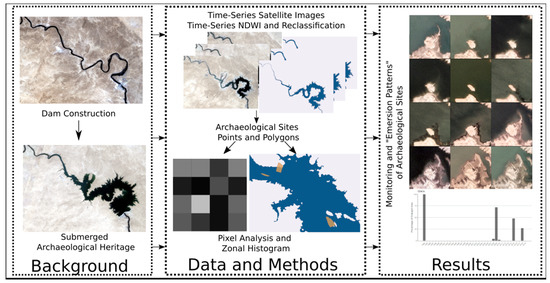
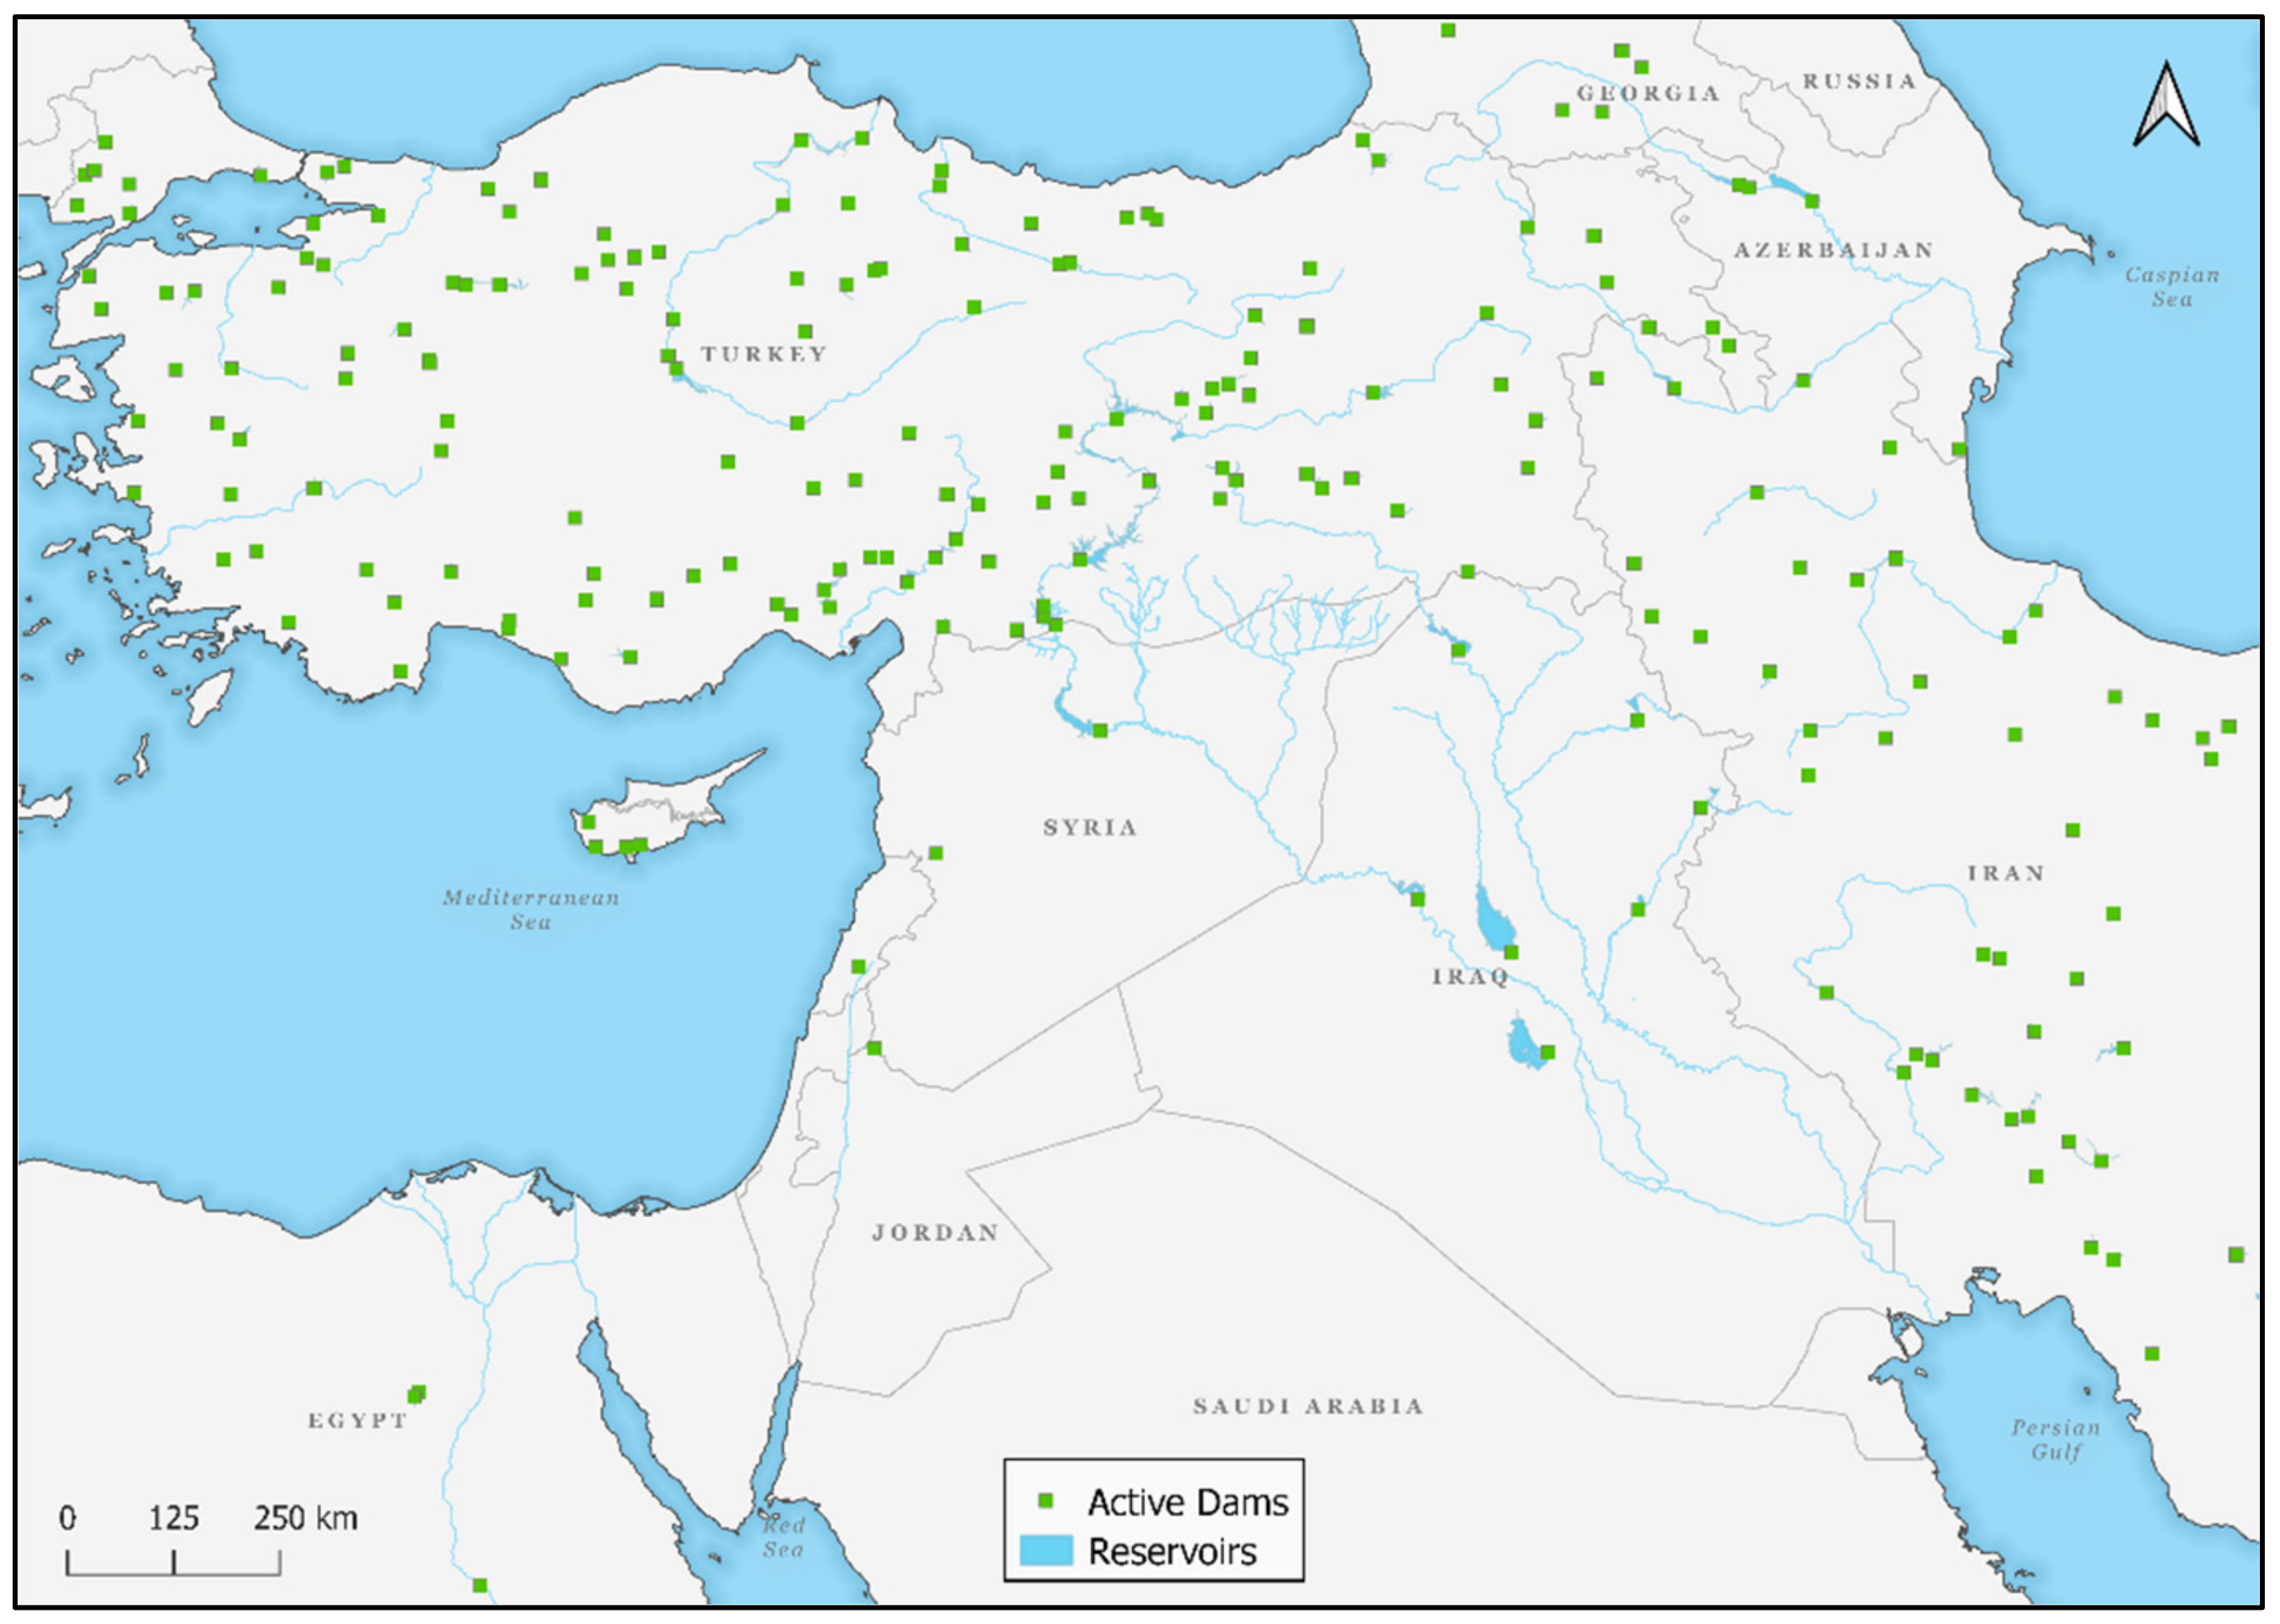
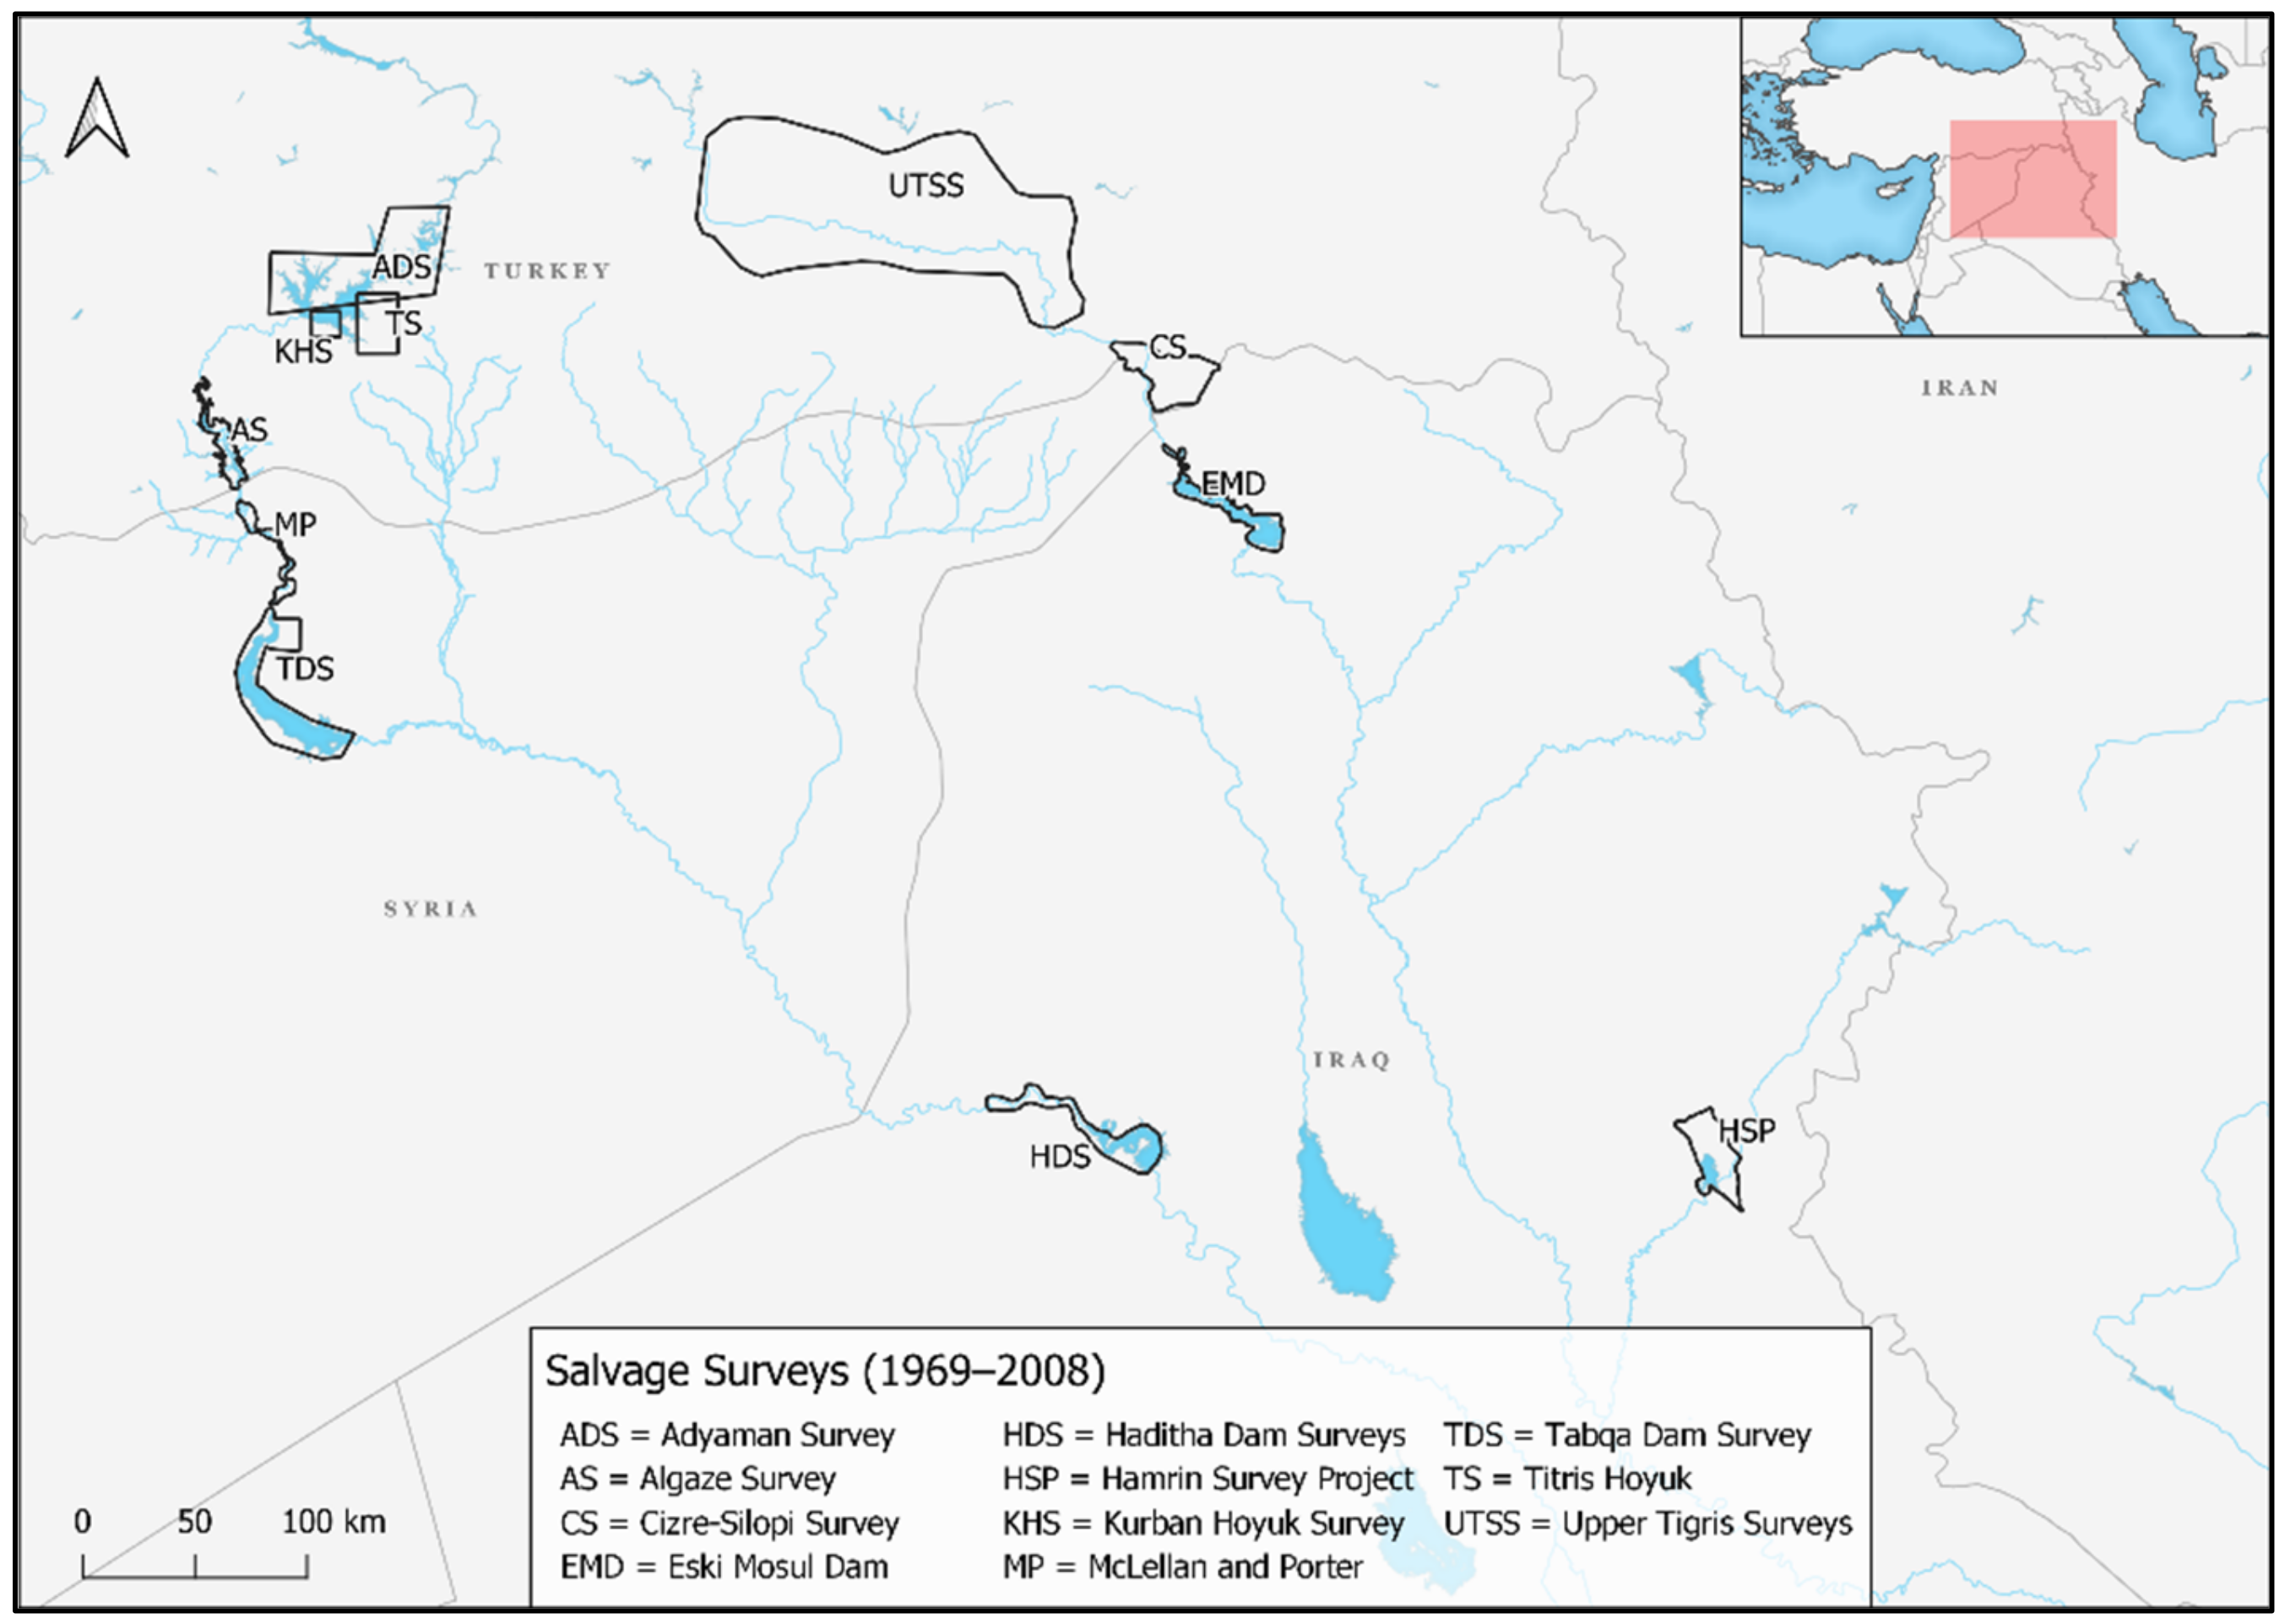
1. Introduction
- To evaluate whether more archaeological sites than the two mentioned before are affected by the cycles of water retraction;
- To establish a systematic and easy-to-reproduce methodology for the mapping and monitoring of these events over a long time span, on an annual basis. The selected time span will cover from the completion of the dams to the present day, but the method could be adapted to different situations;
- To evaluate the impact of the interannual variability of the water level and its impact on the archaeological sites, by monitoring, monthly, over a single year.
2. Materials and Methods
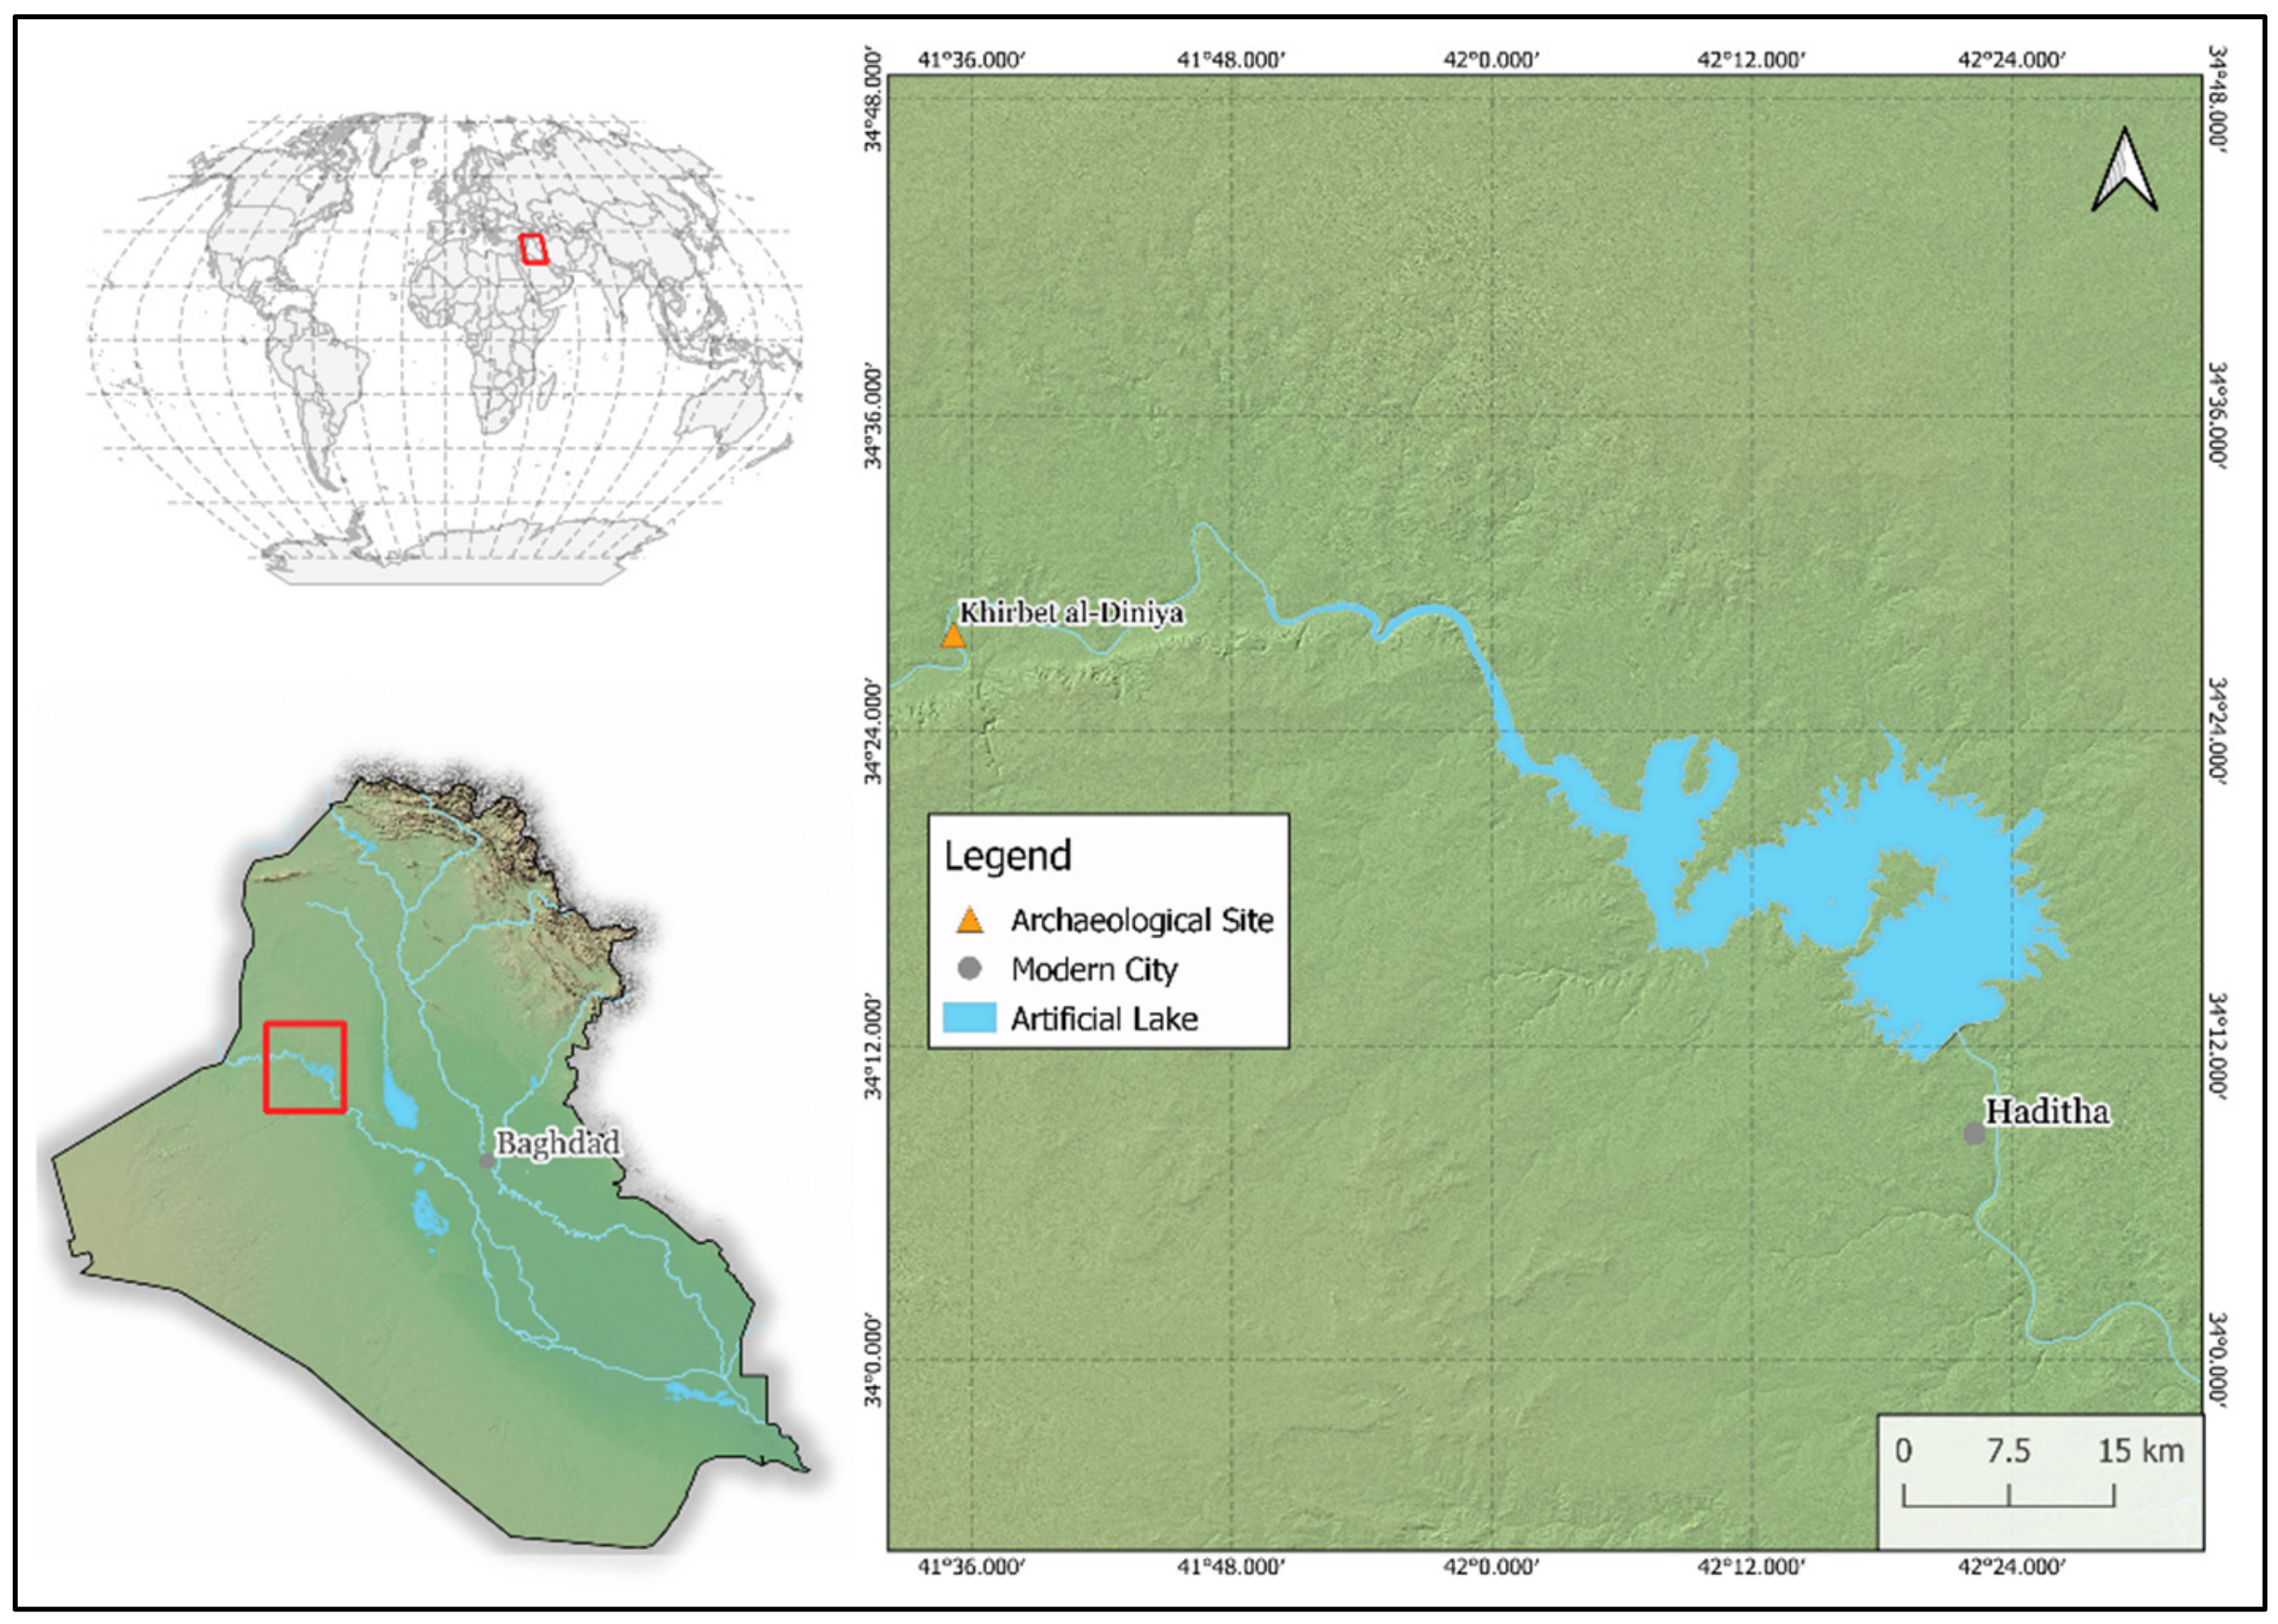
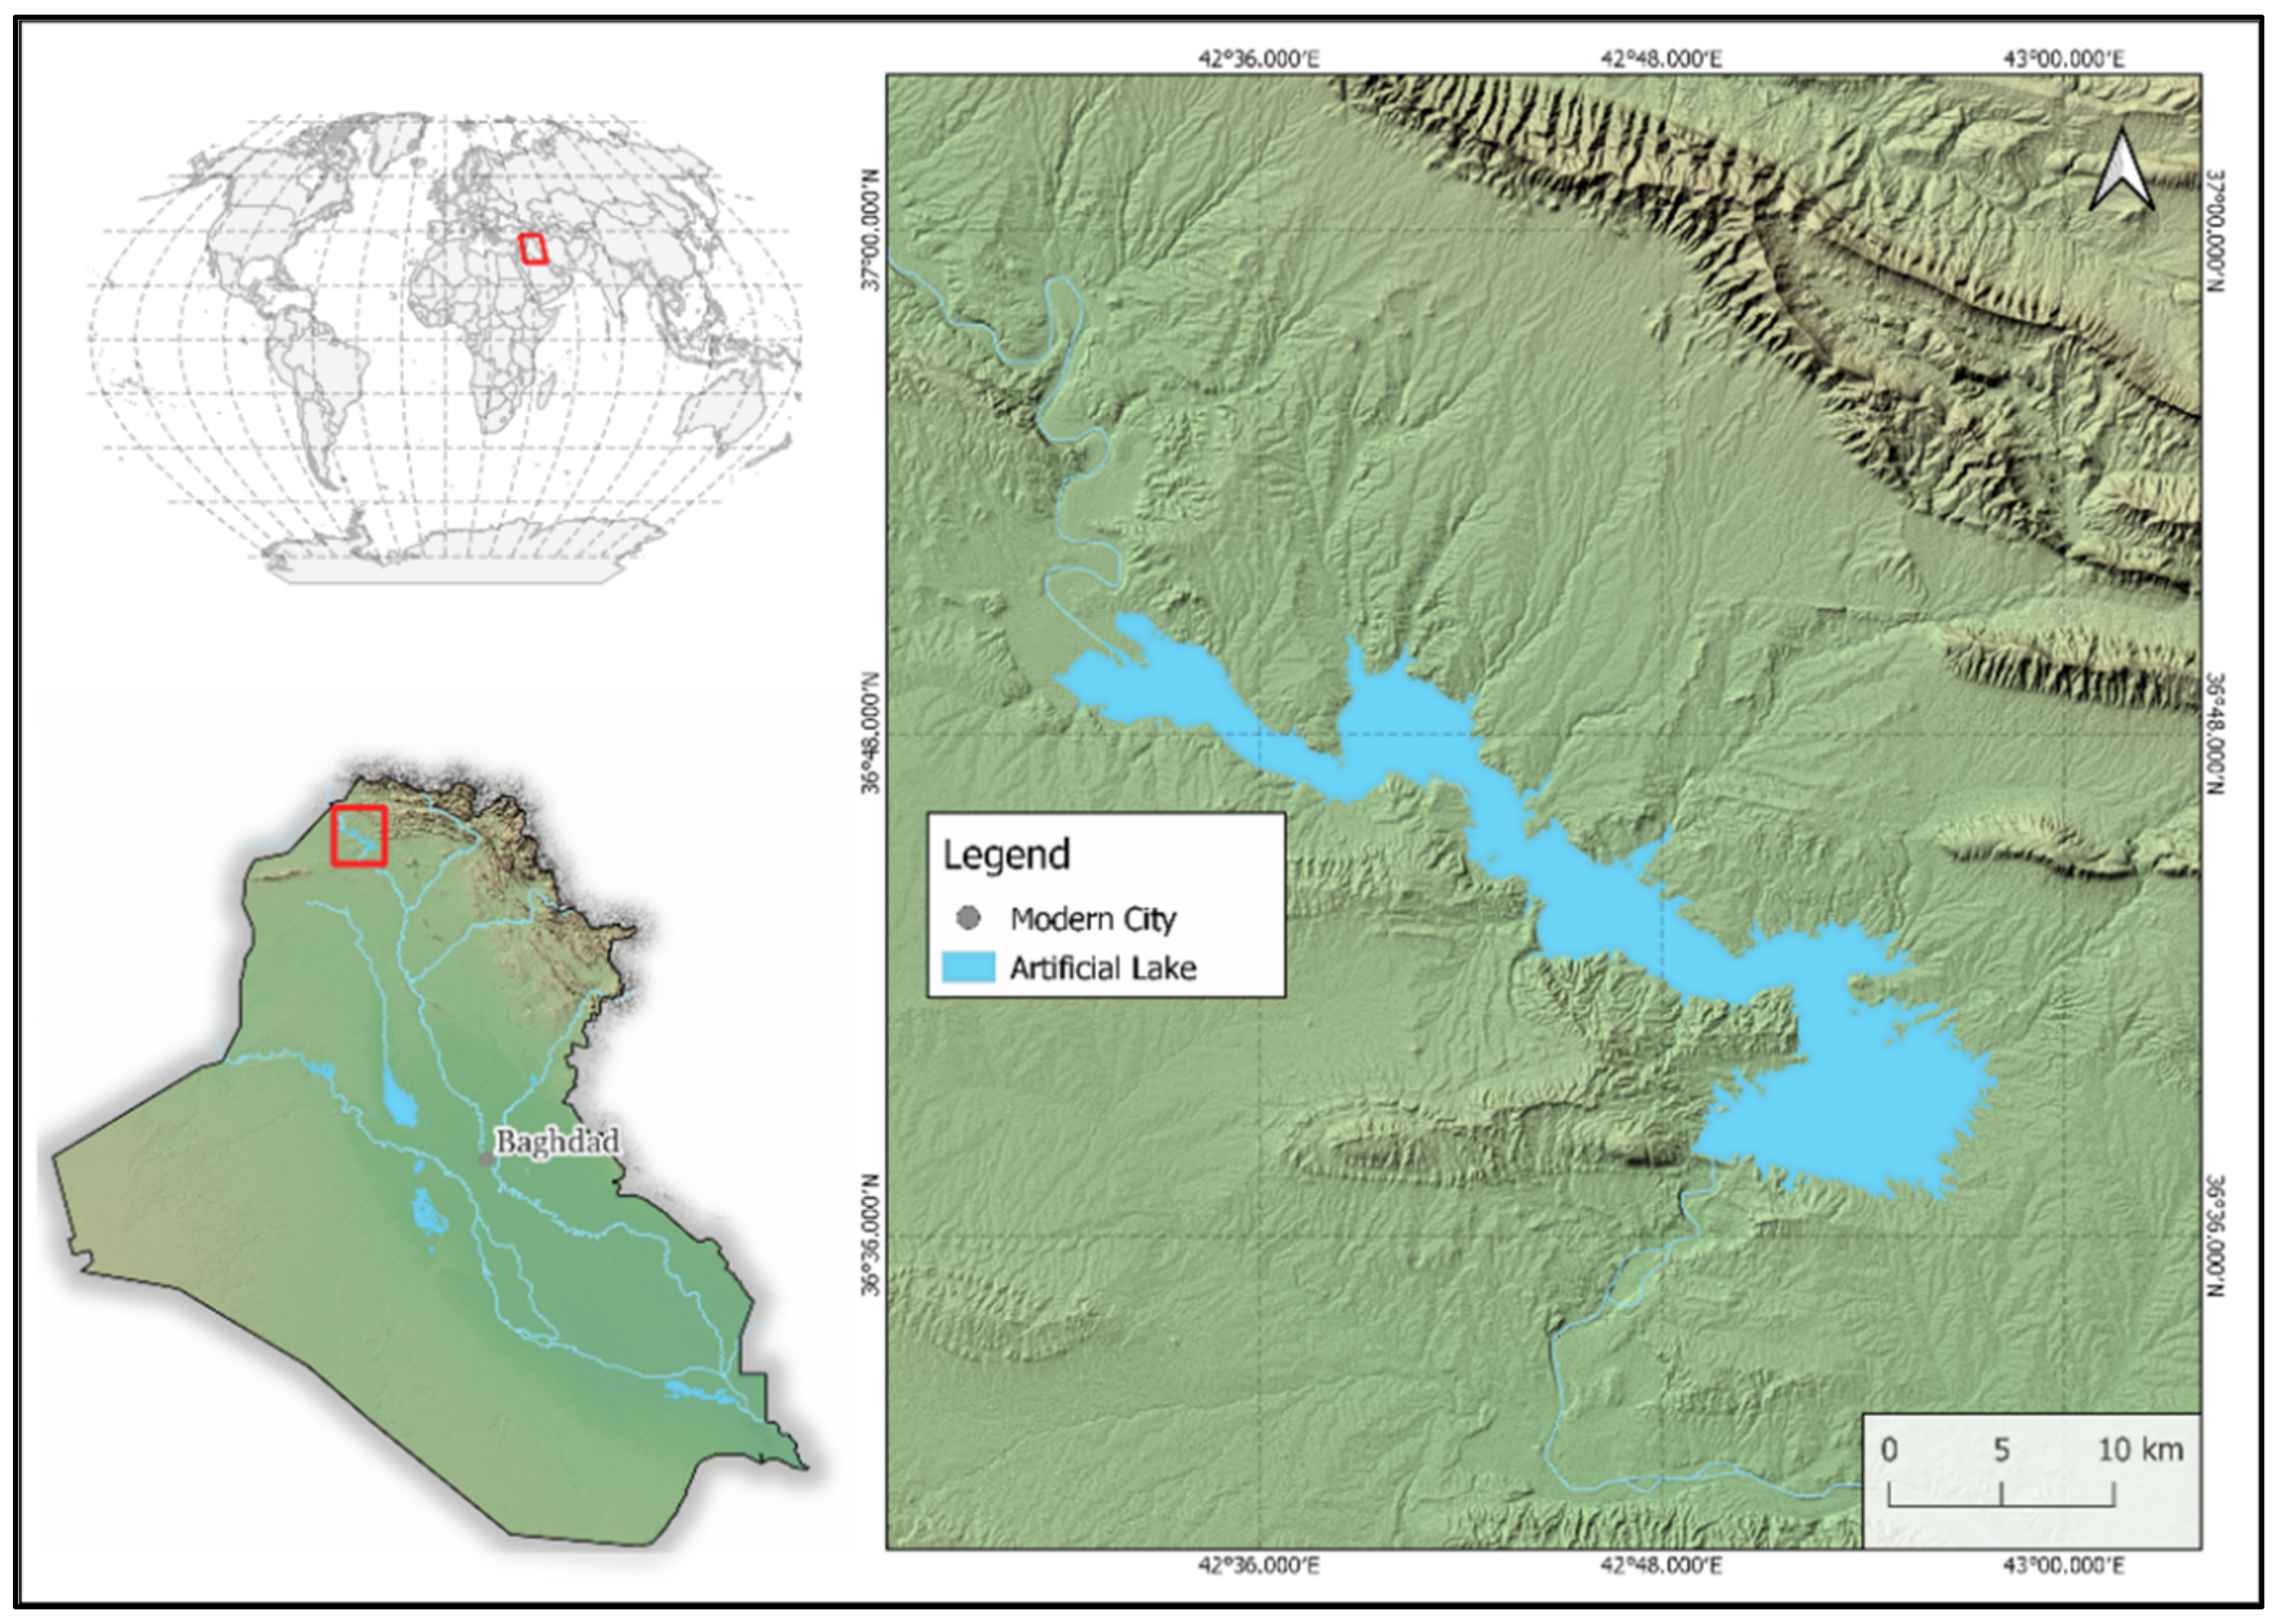
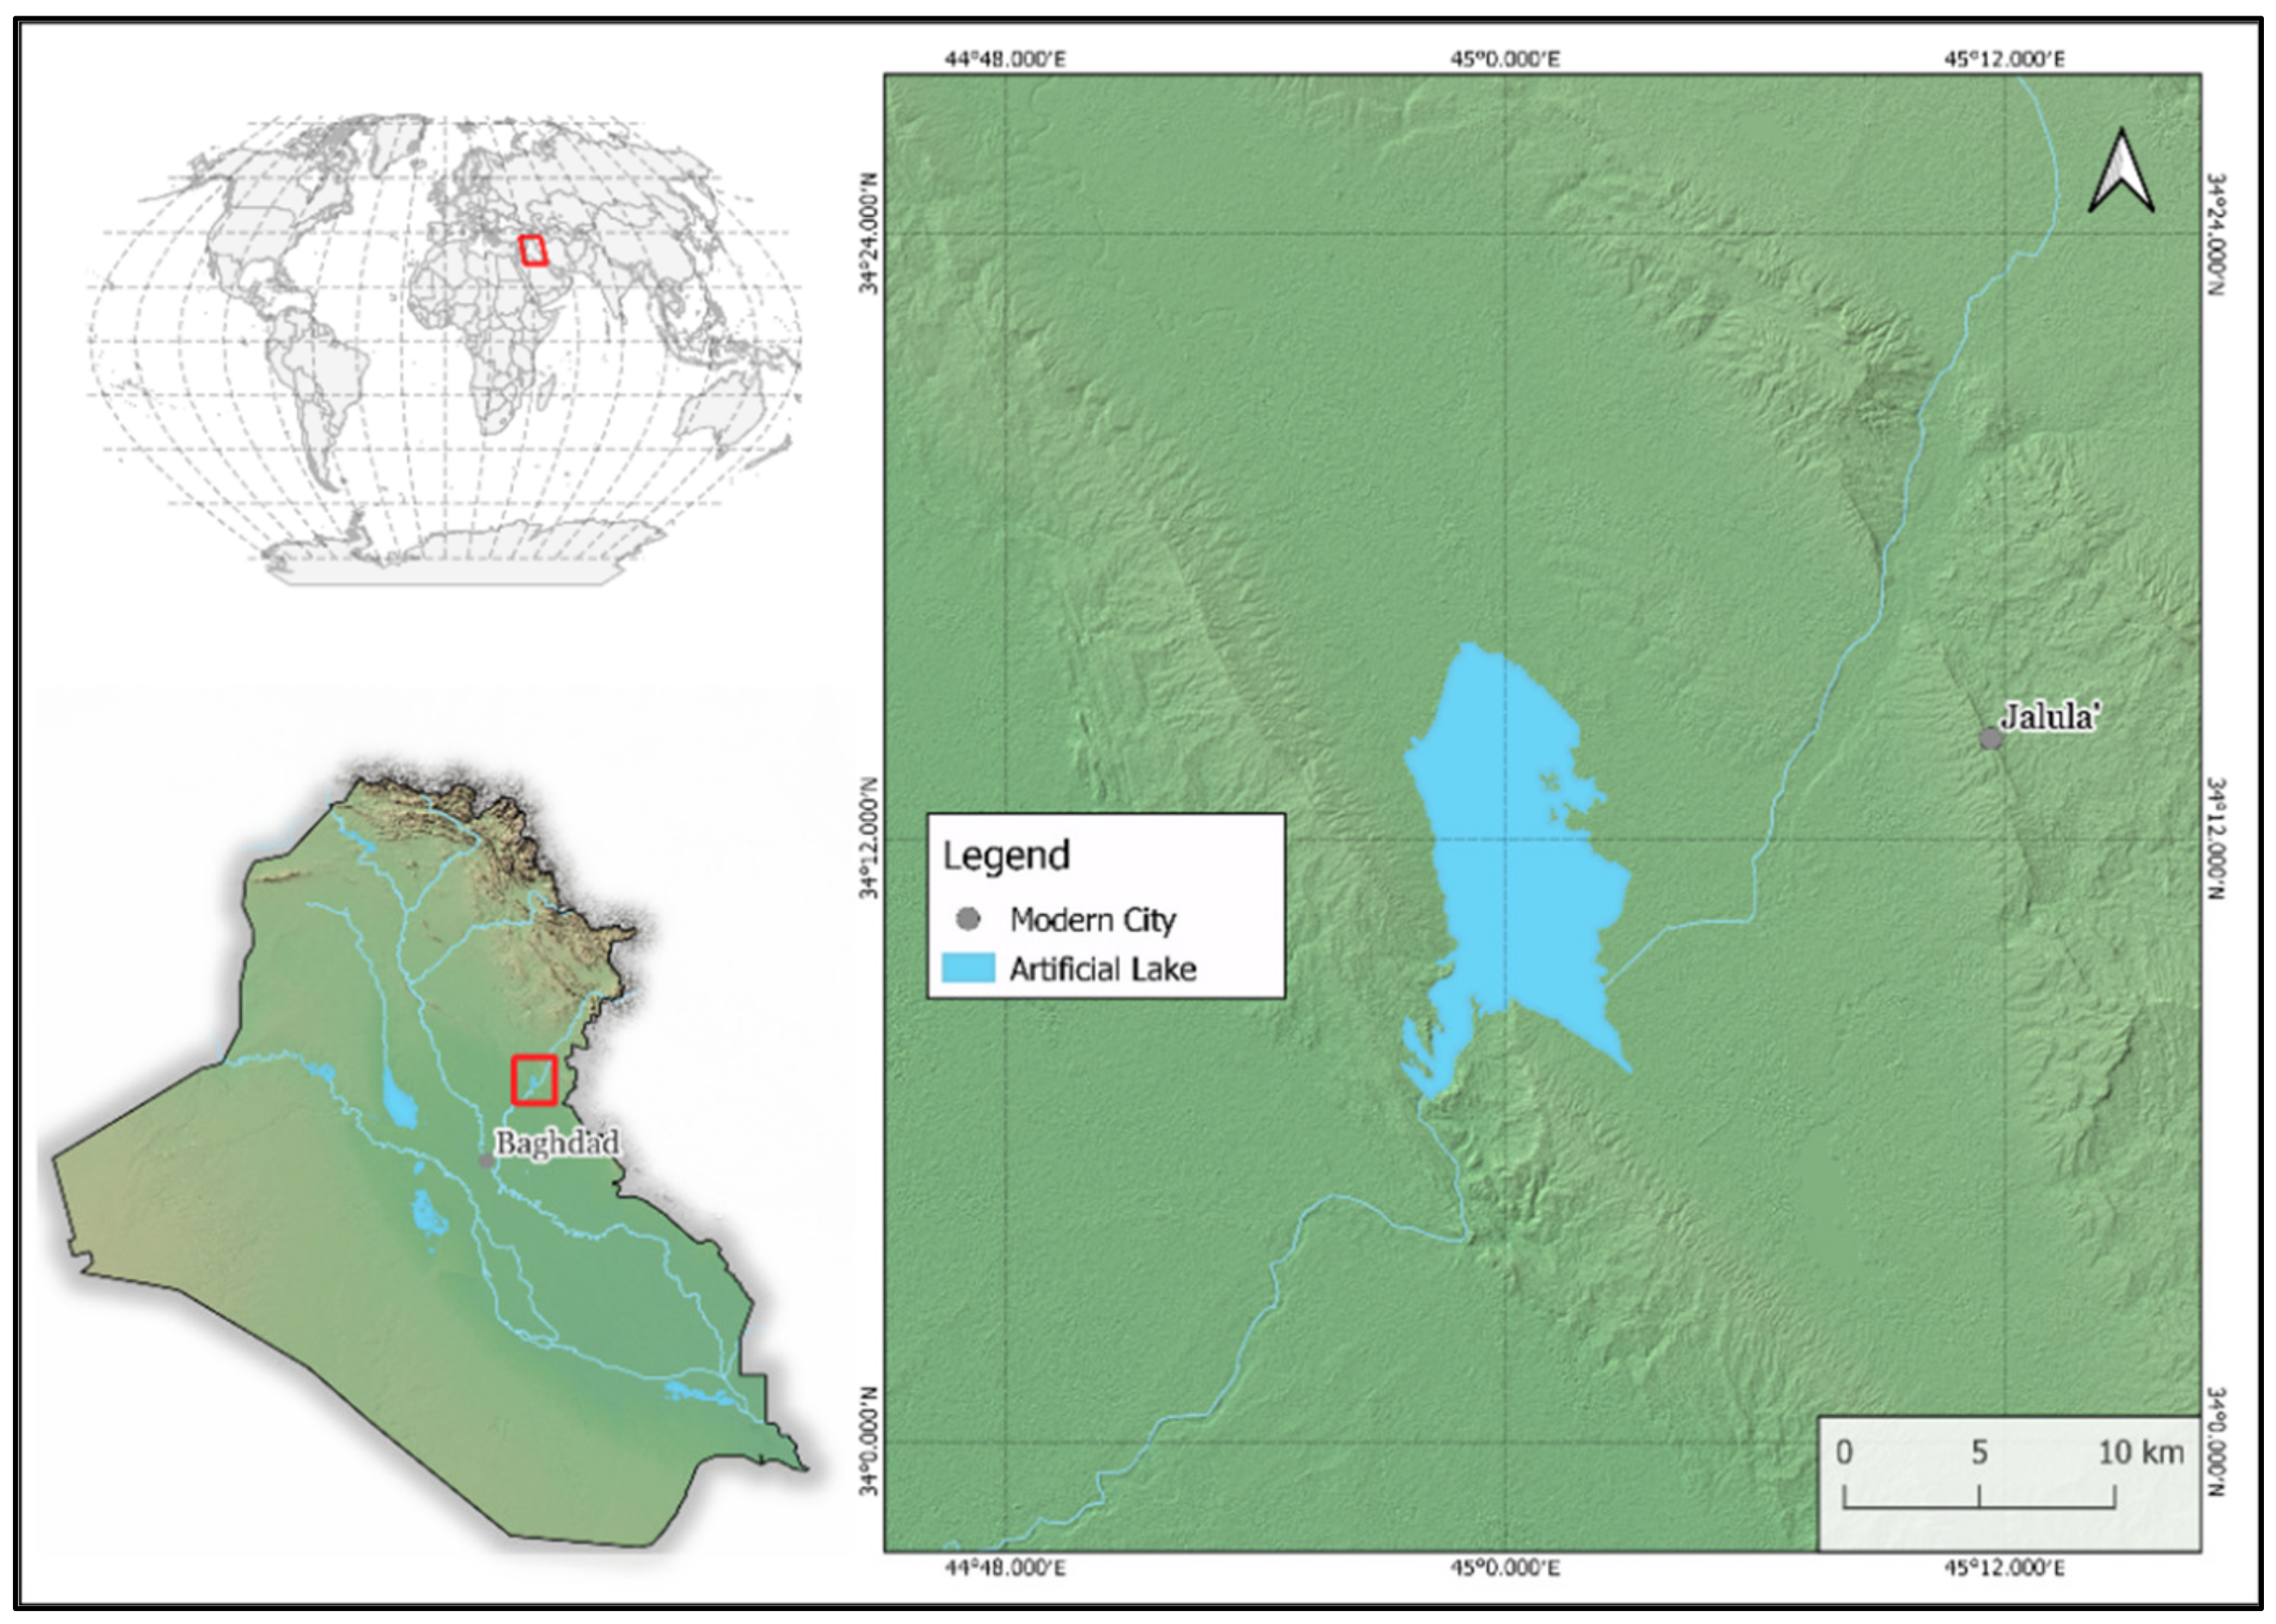
2.1. Study Areas
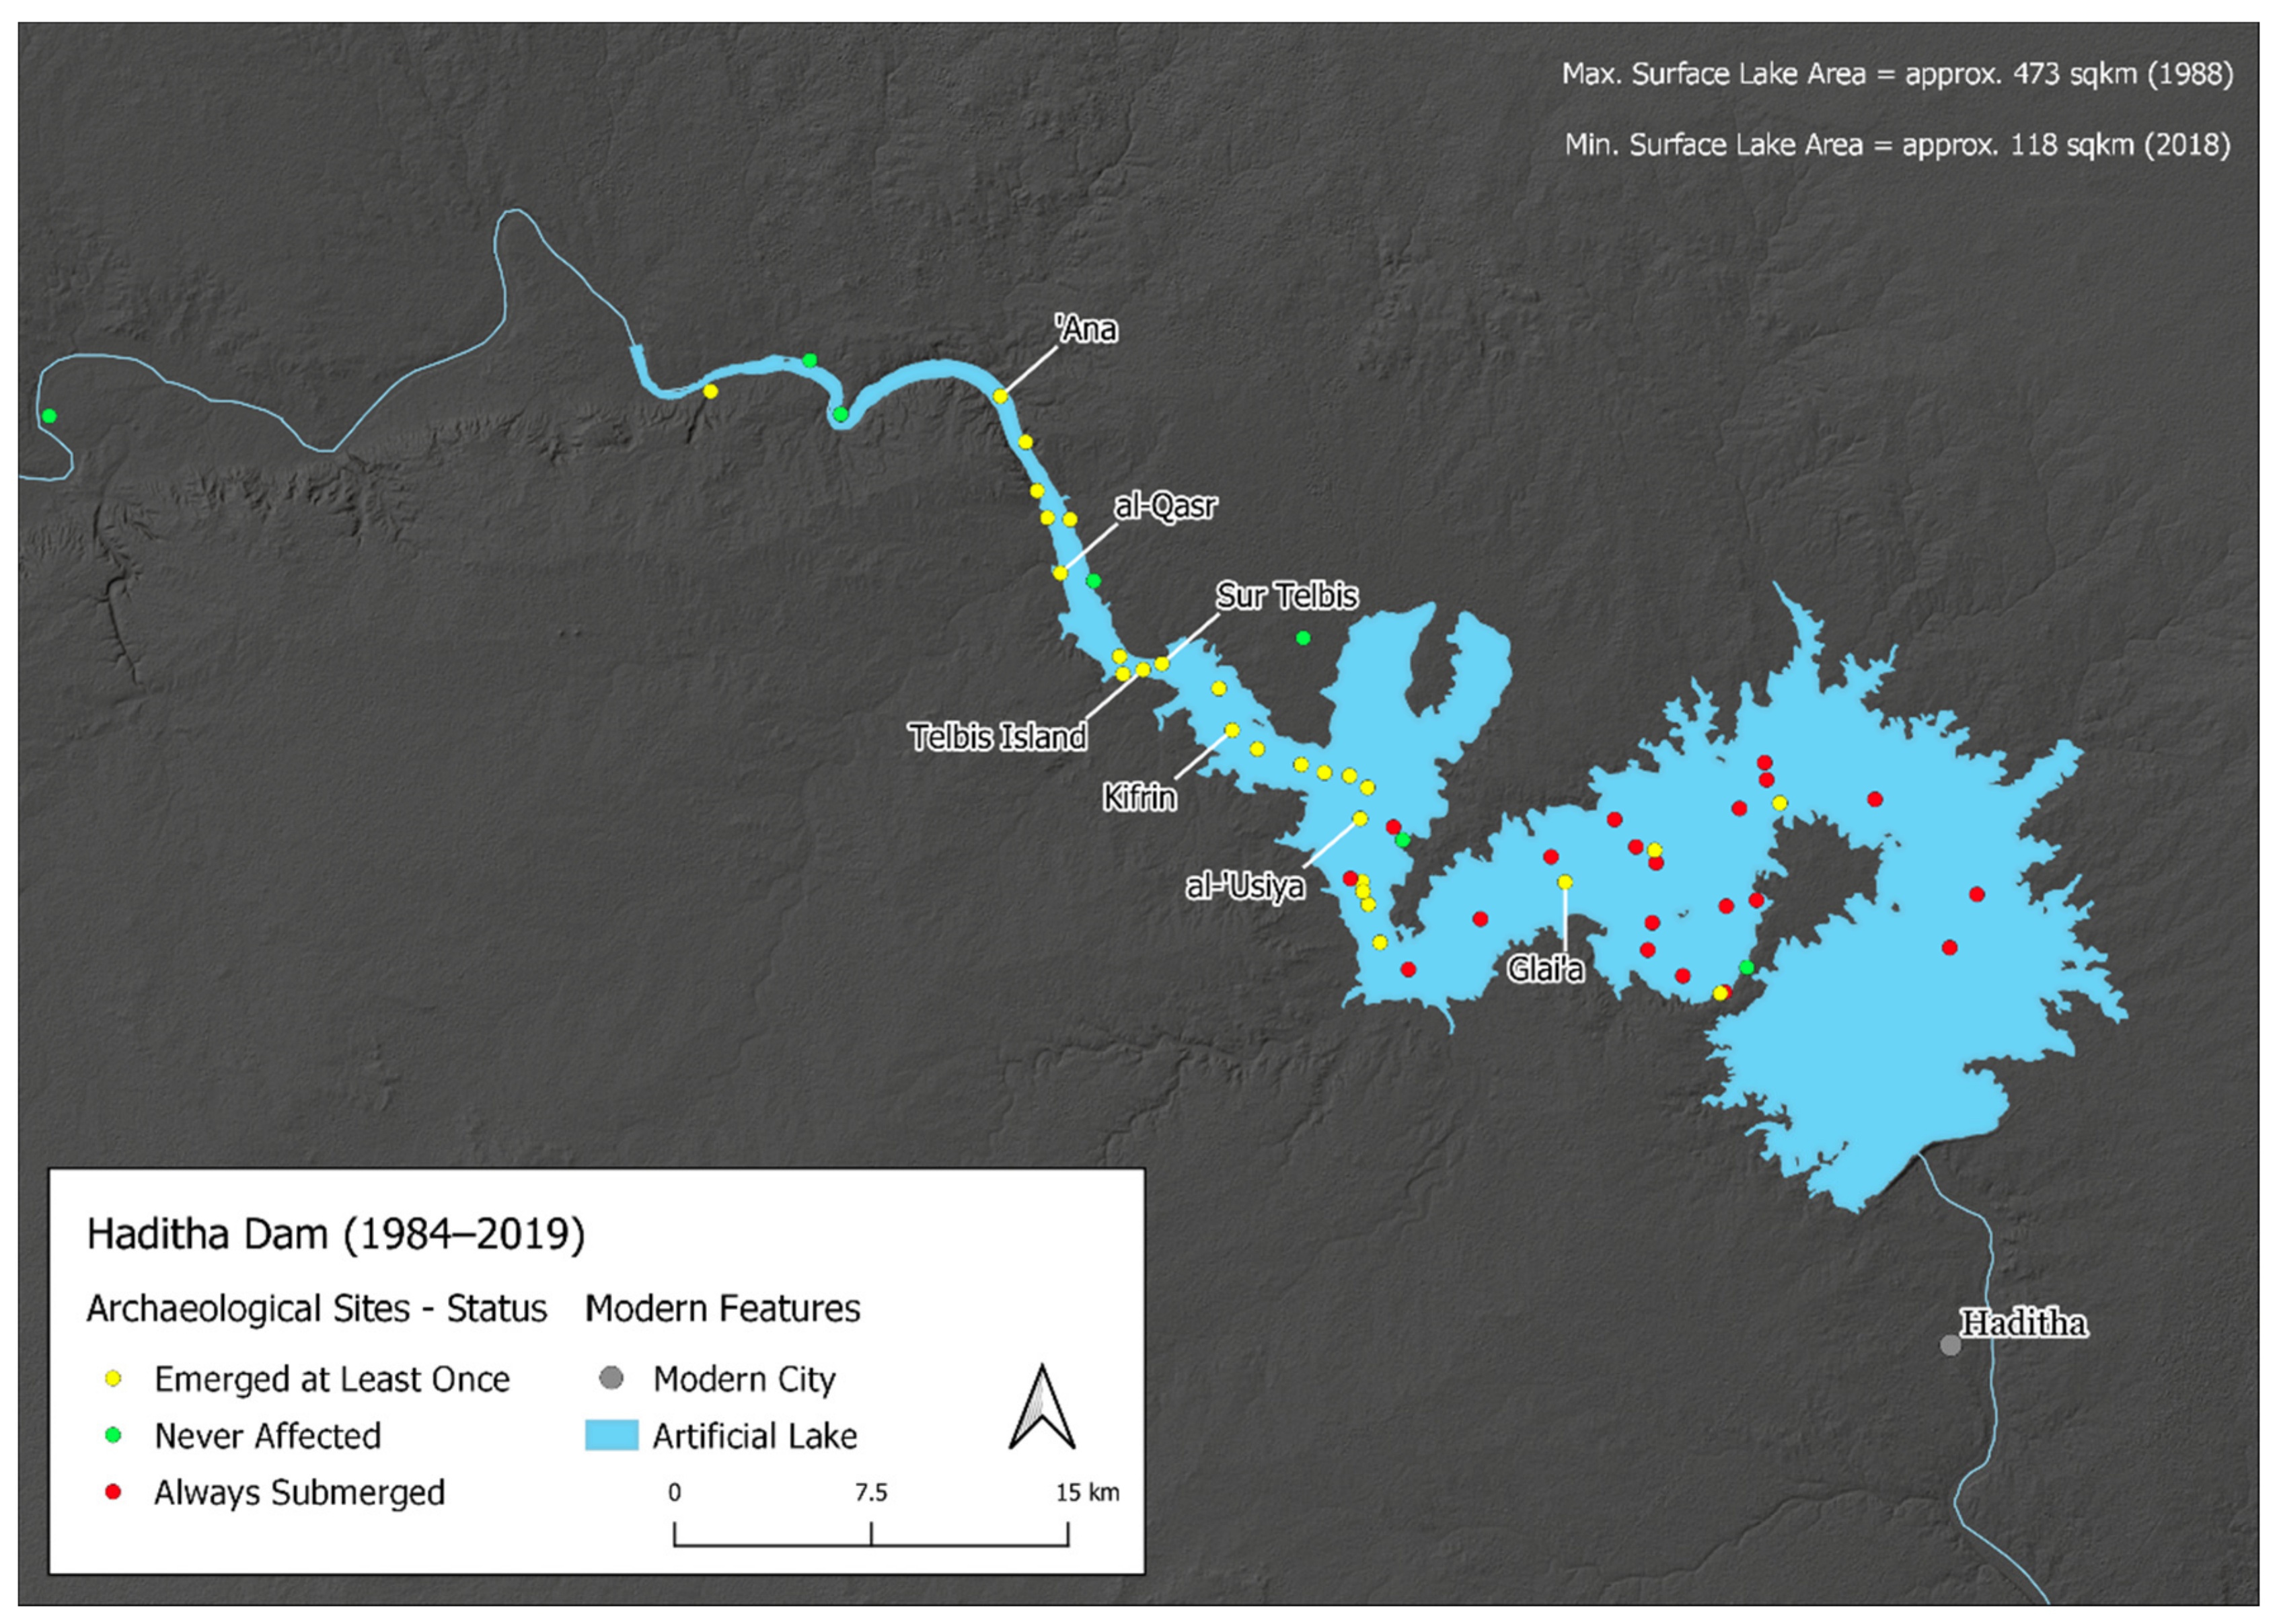
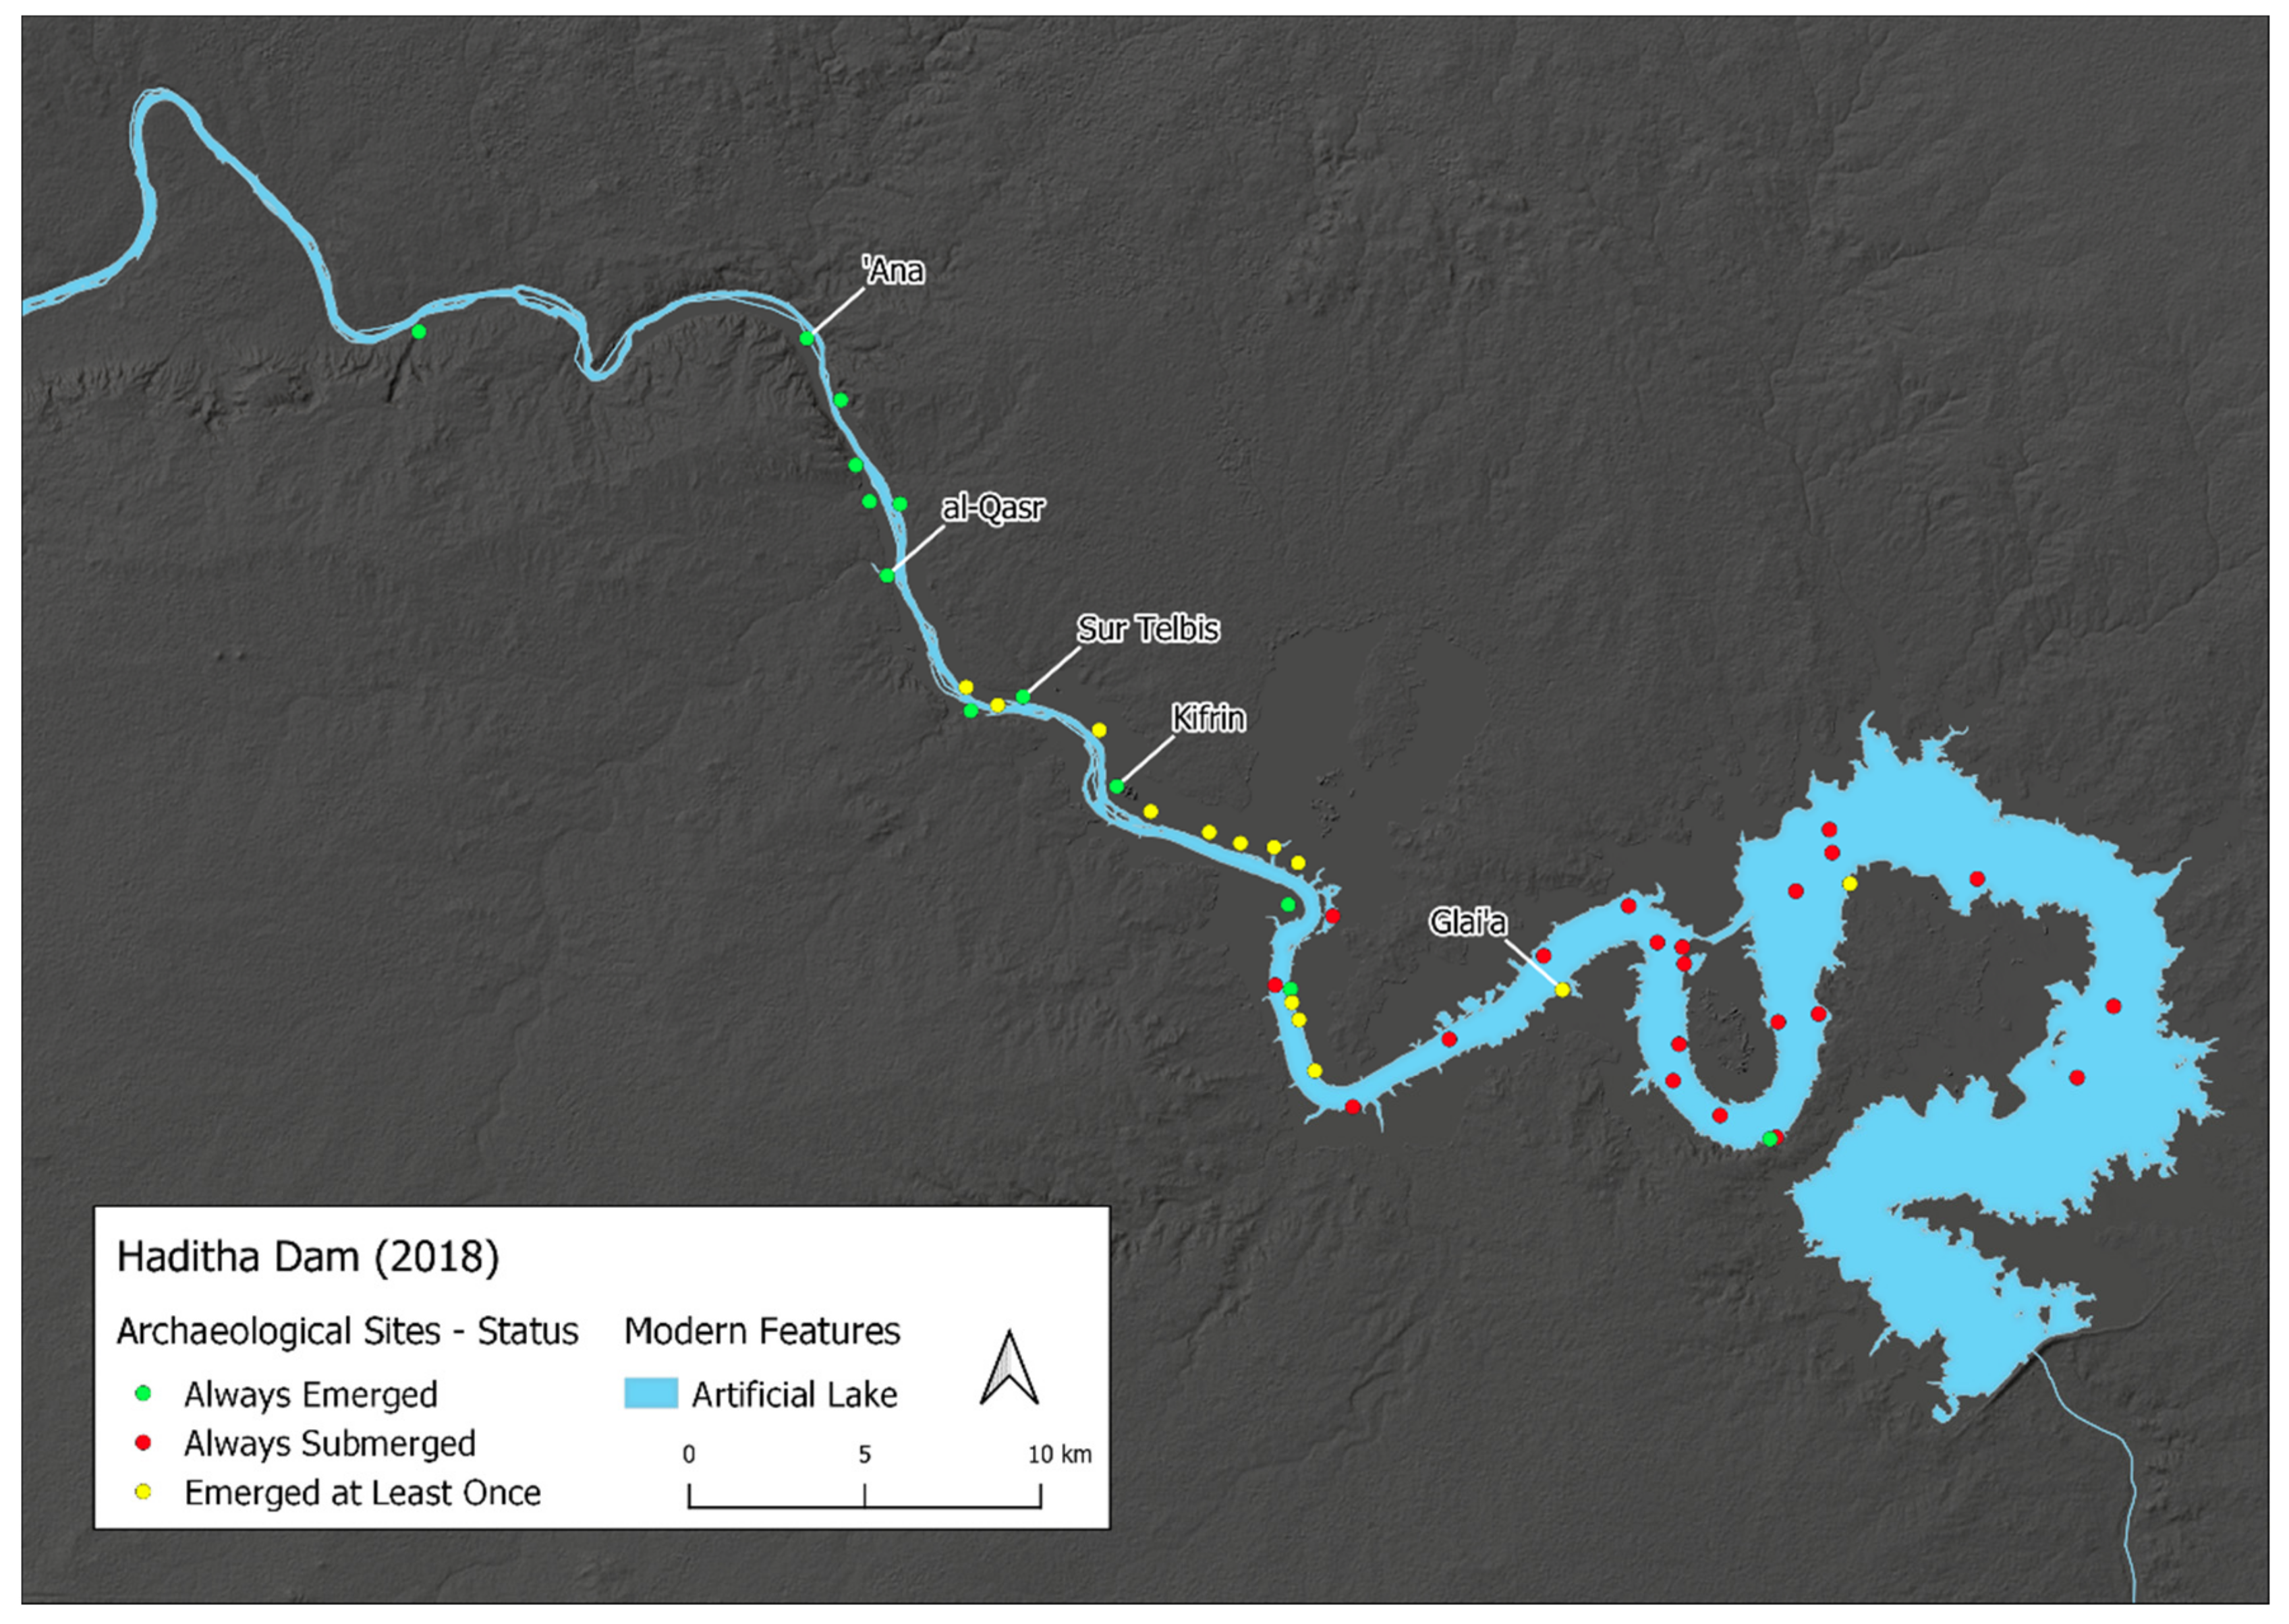
2.1.1. Haditha Dam
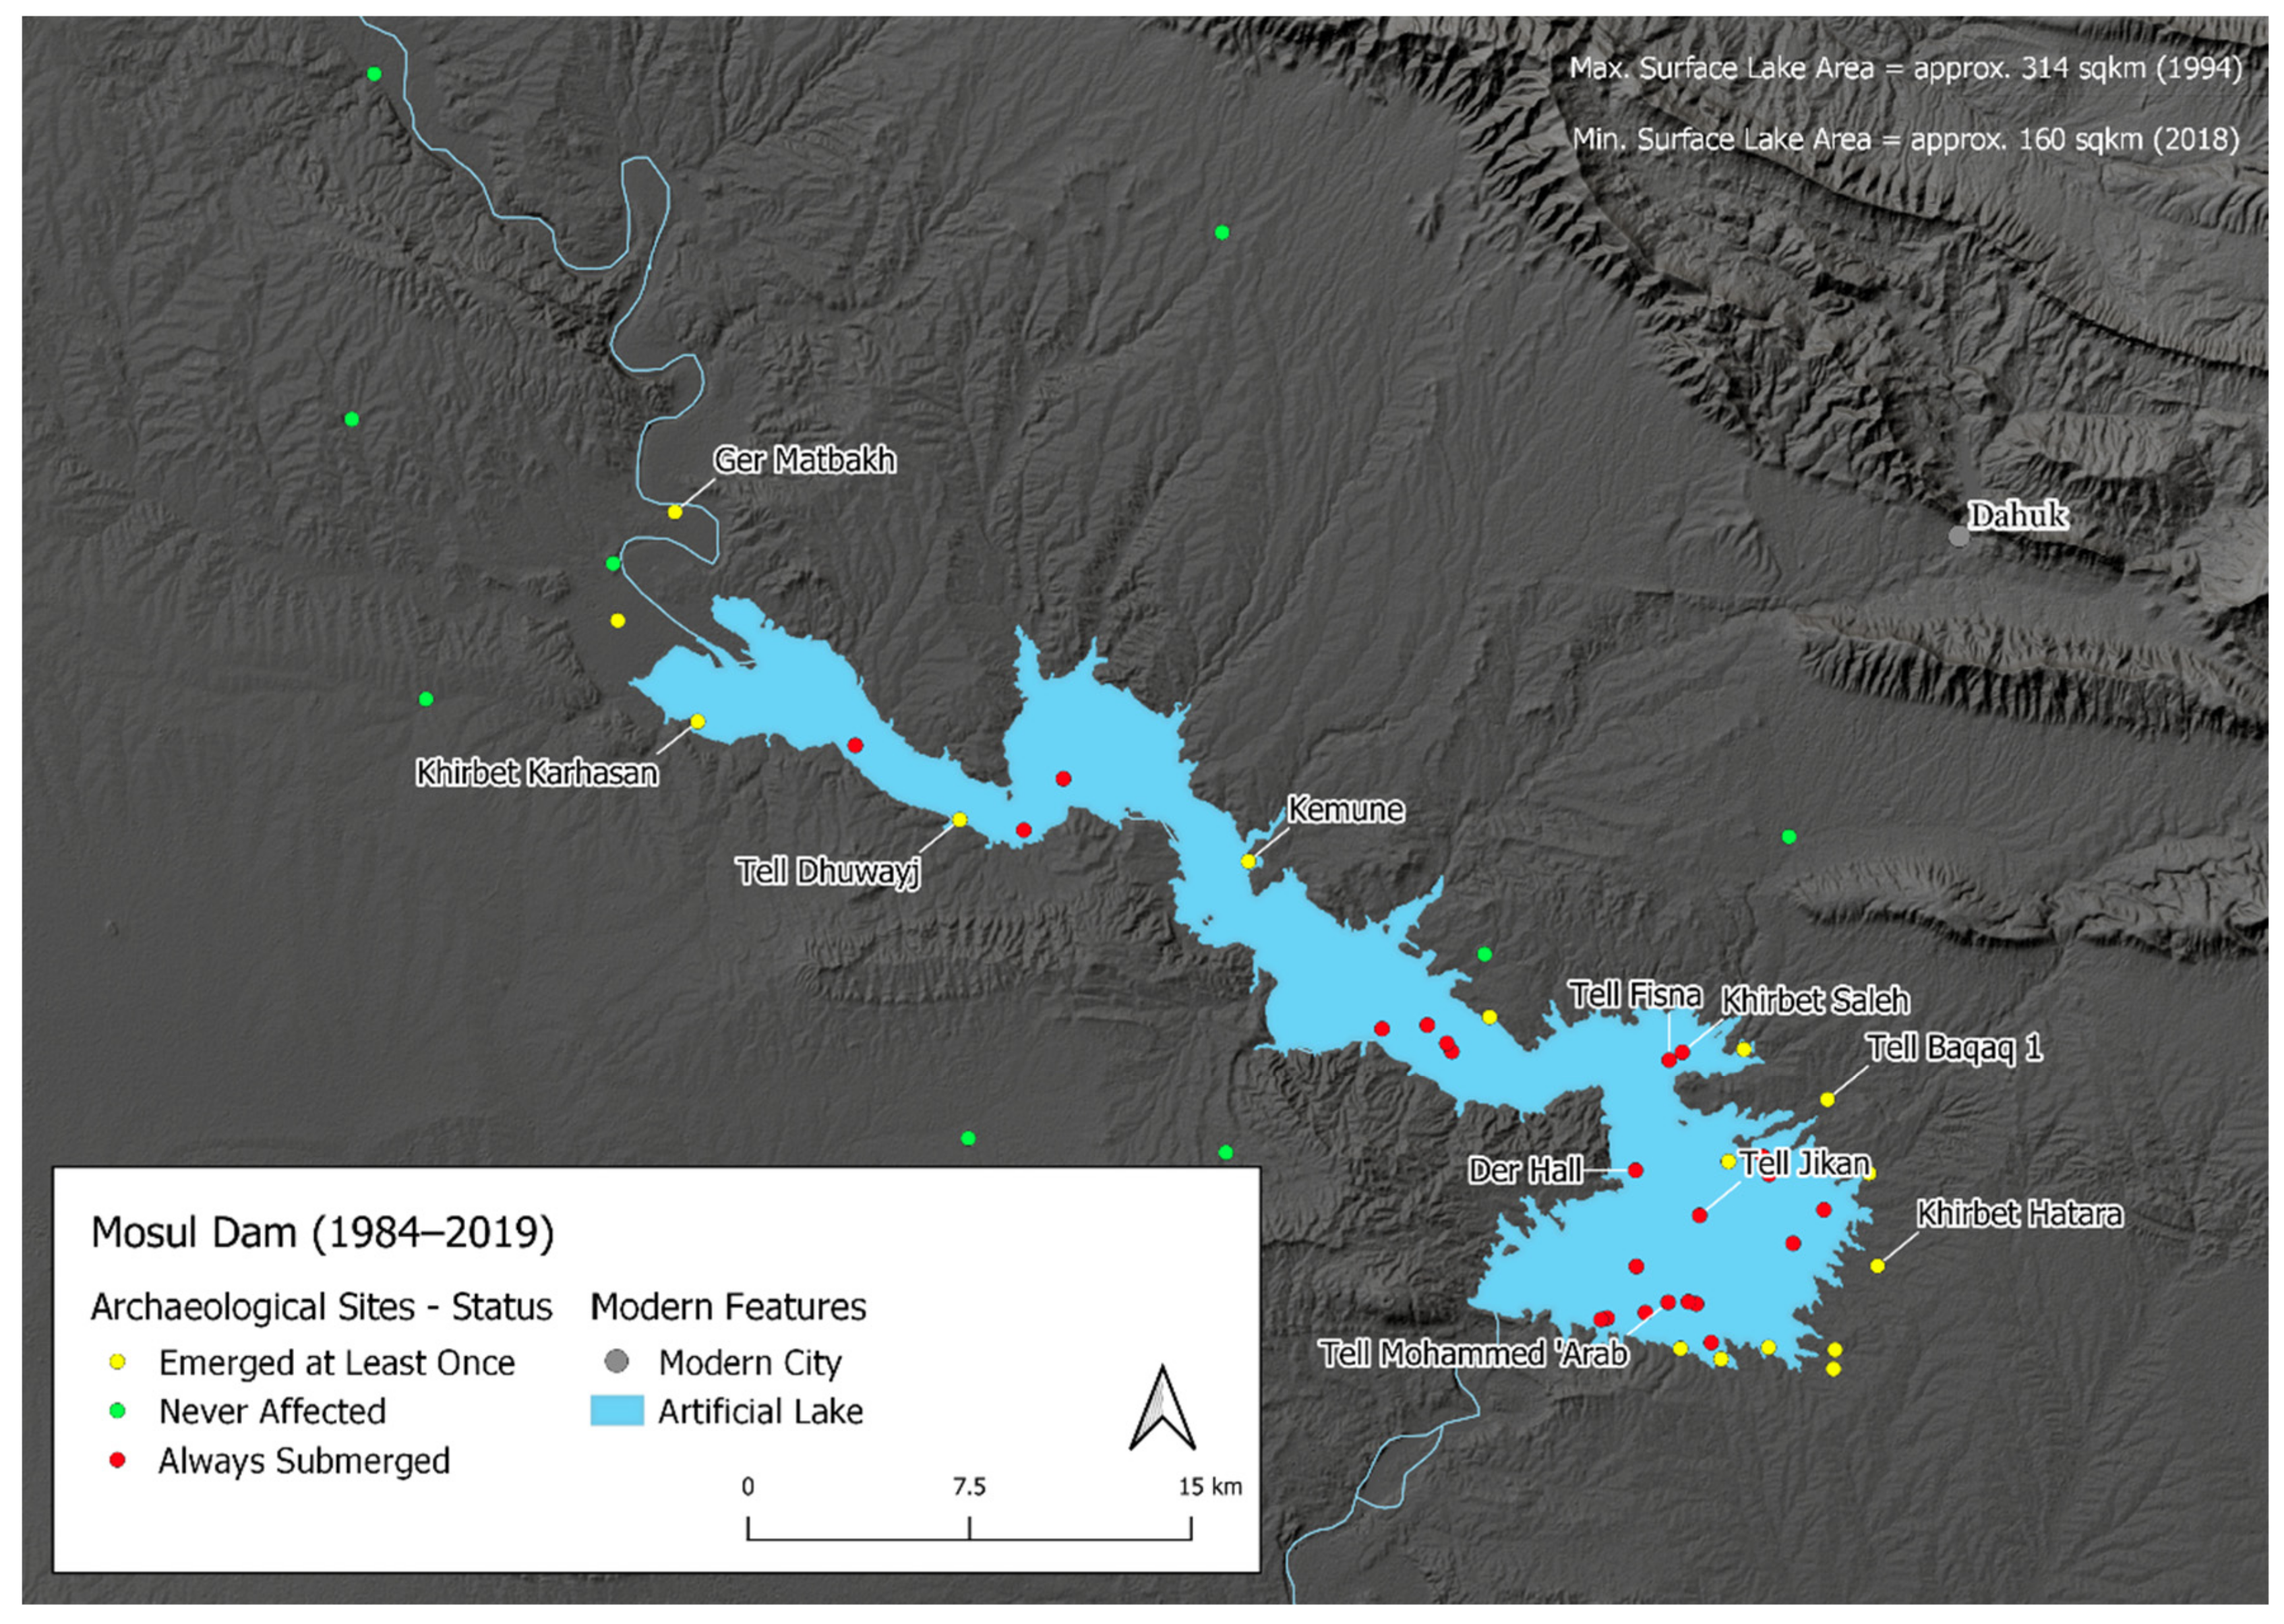
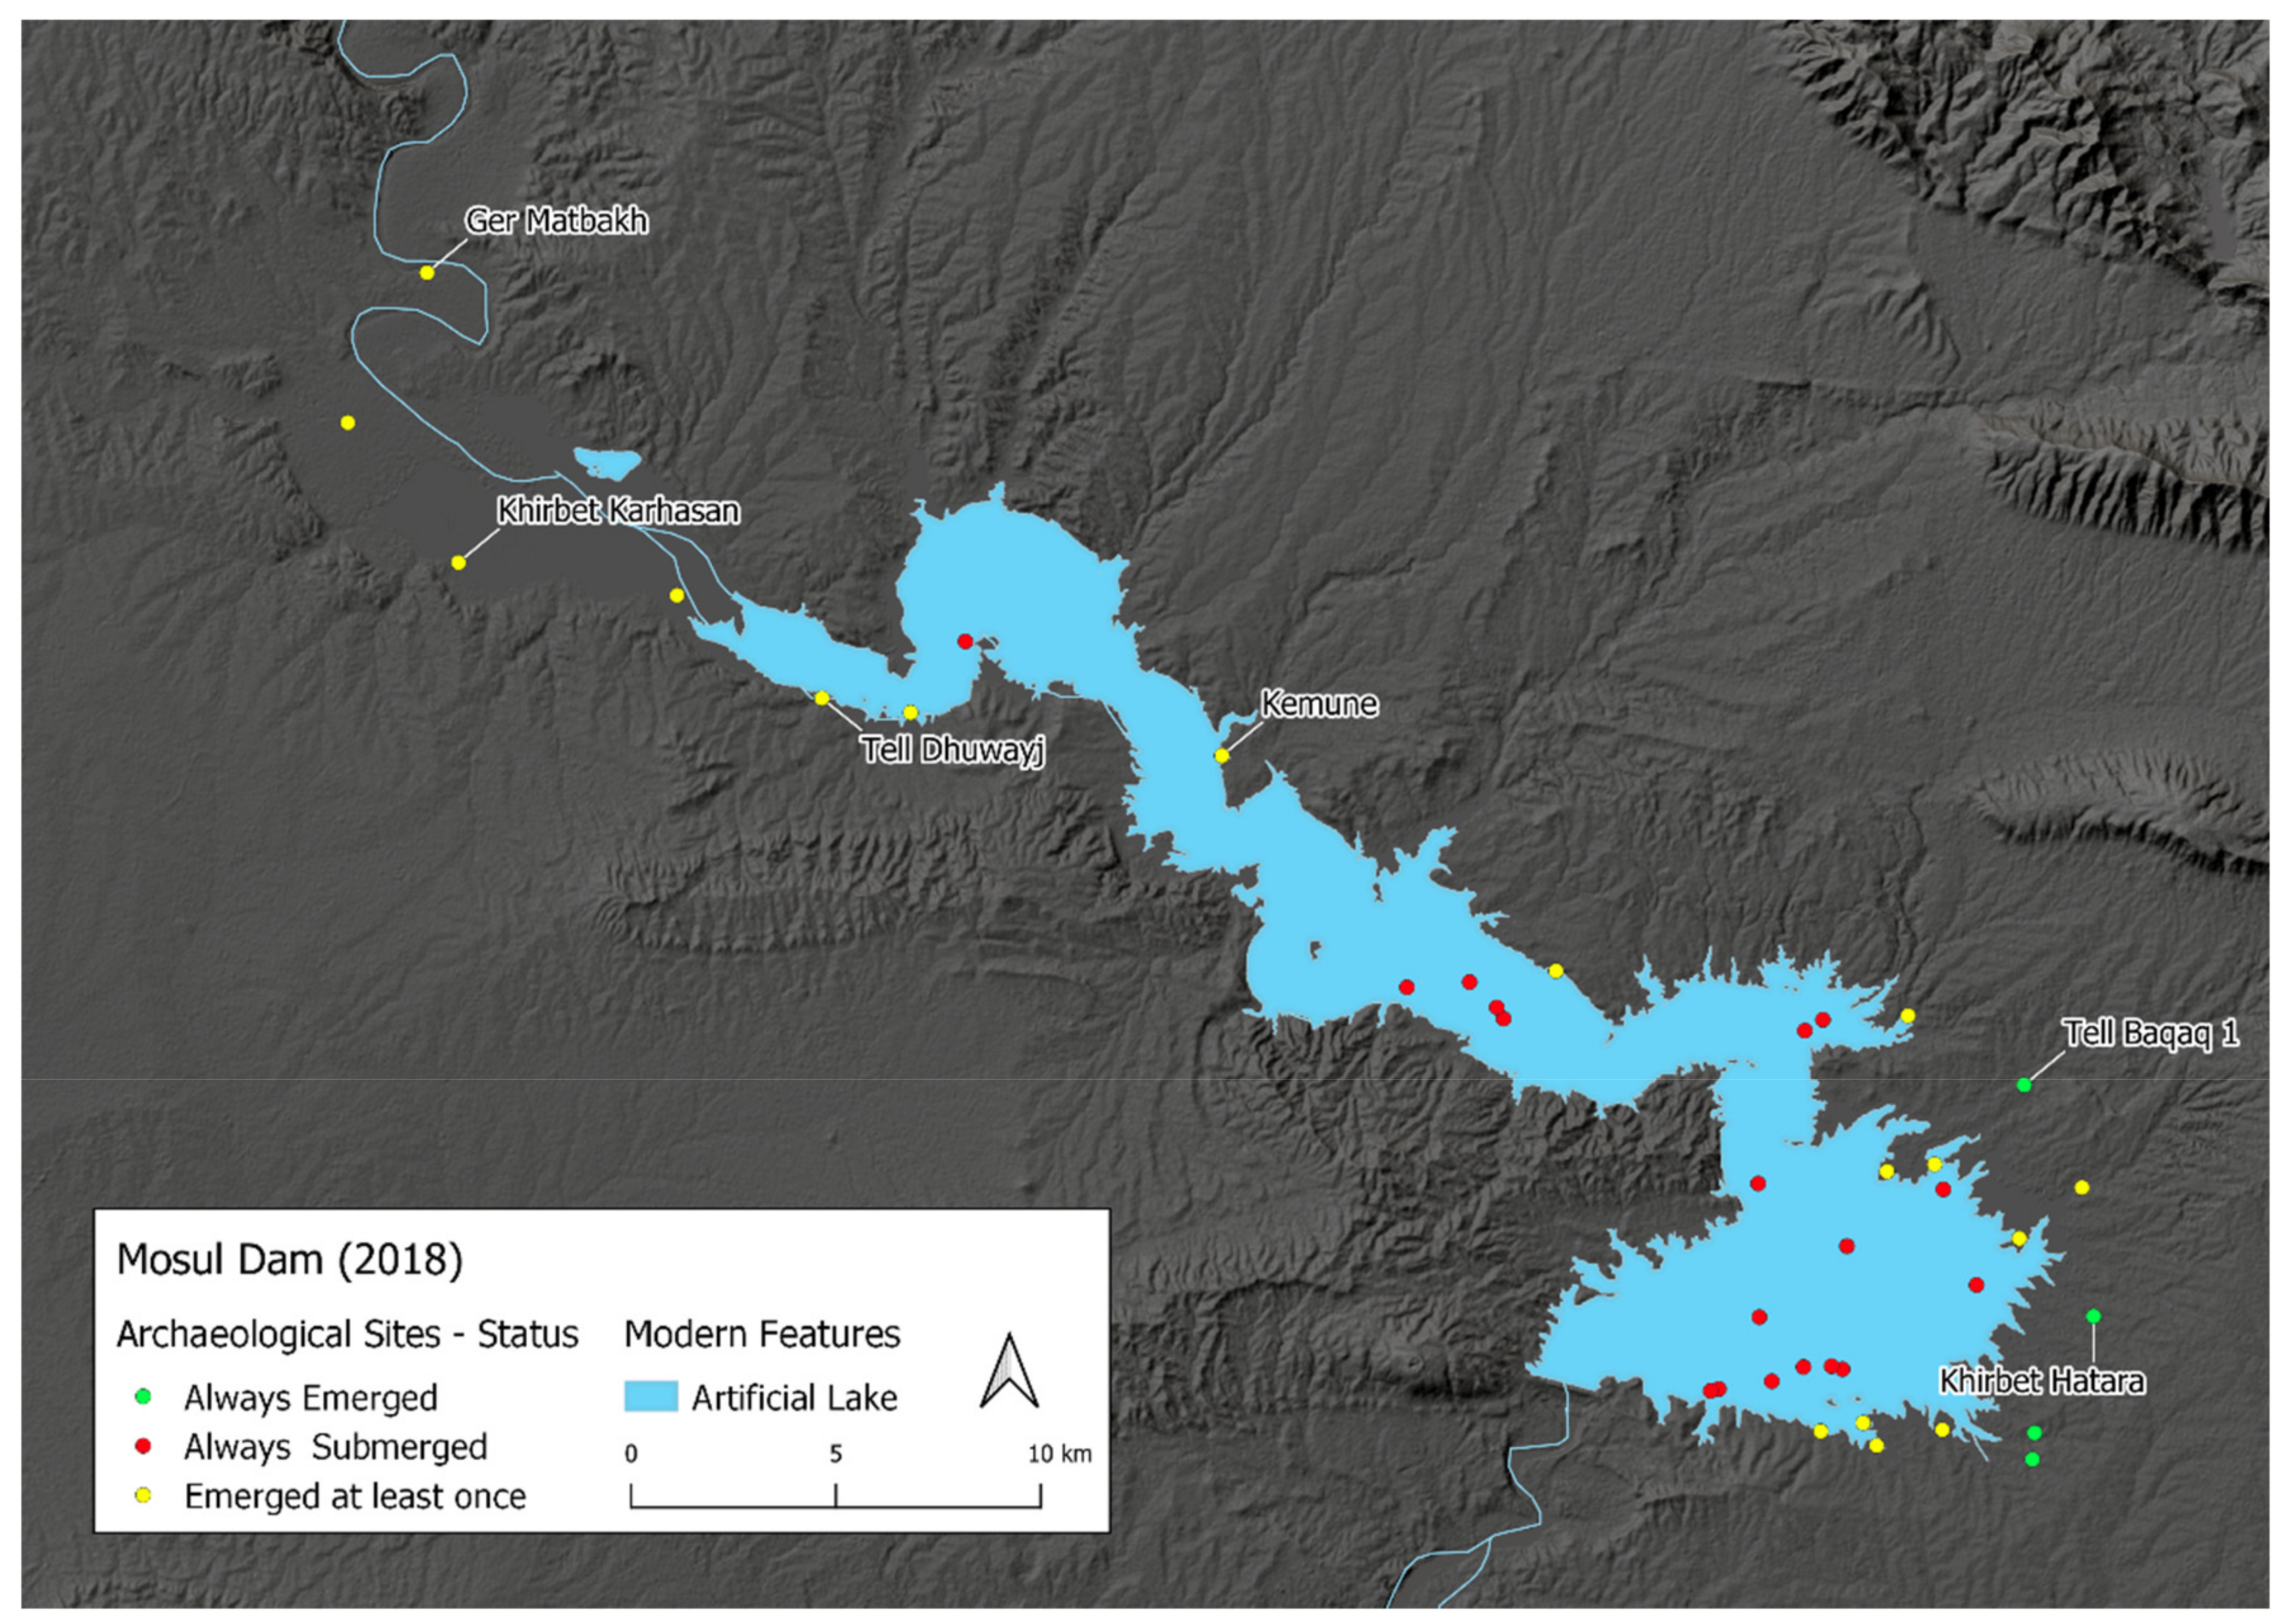
2.1.2. Mosul Dam
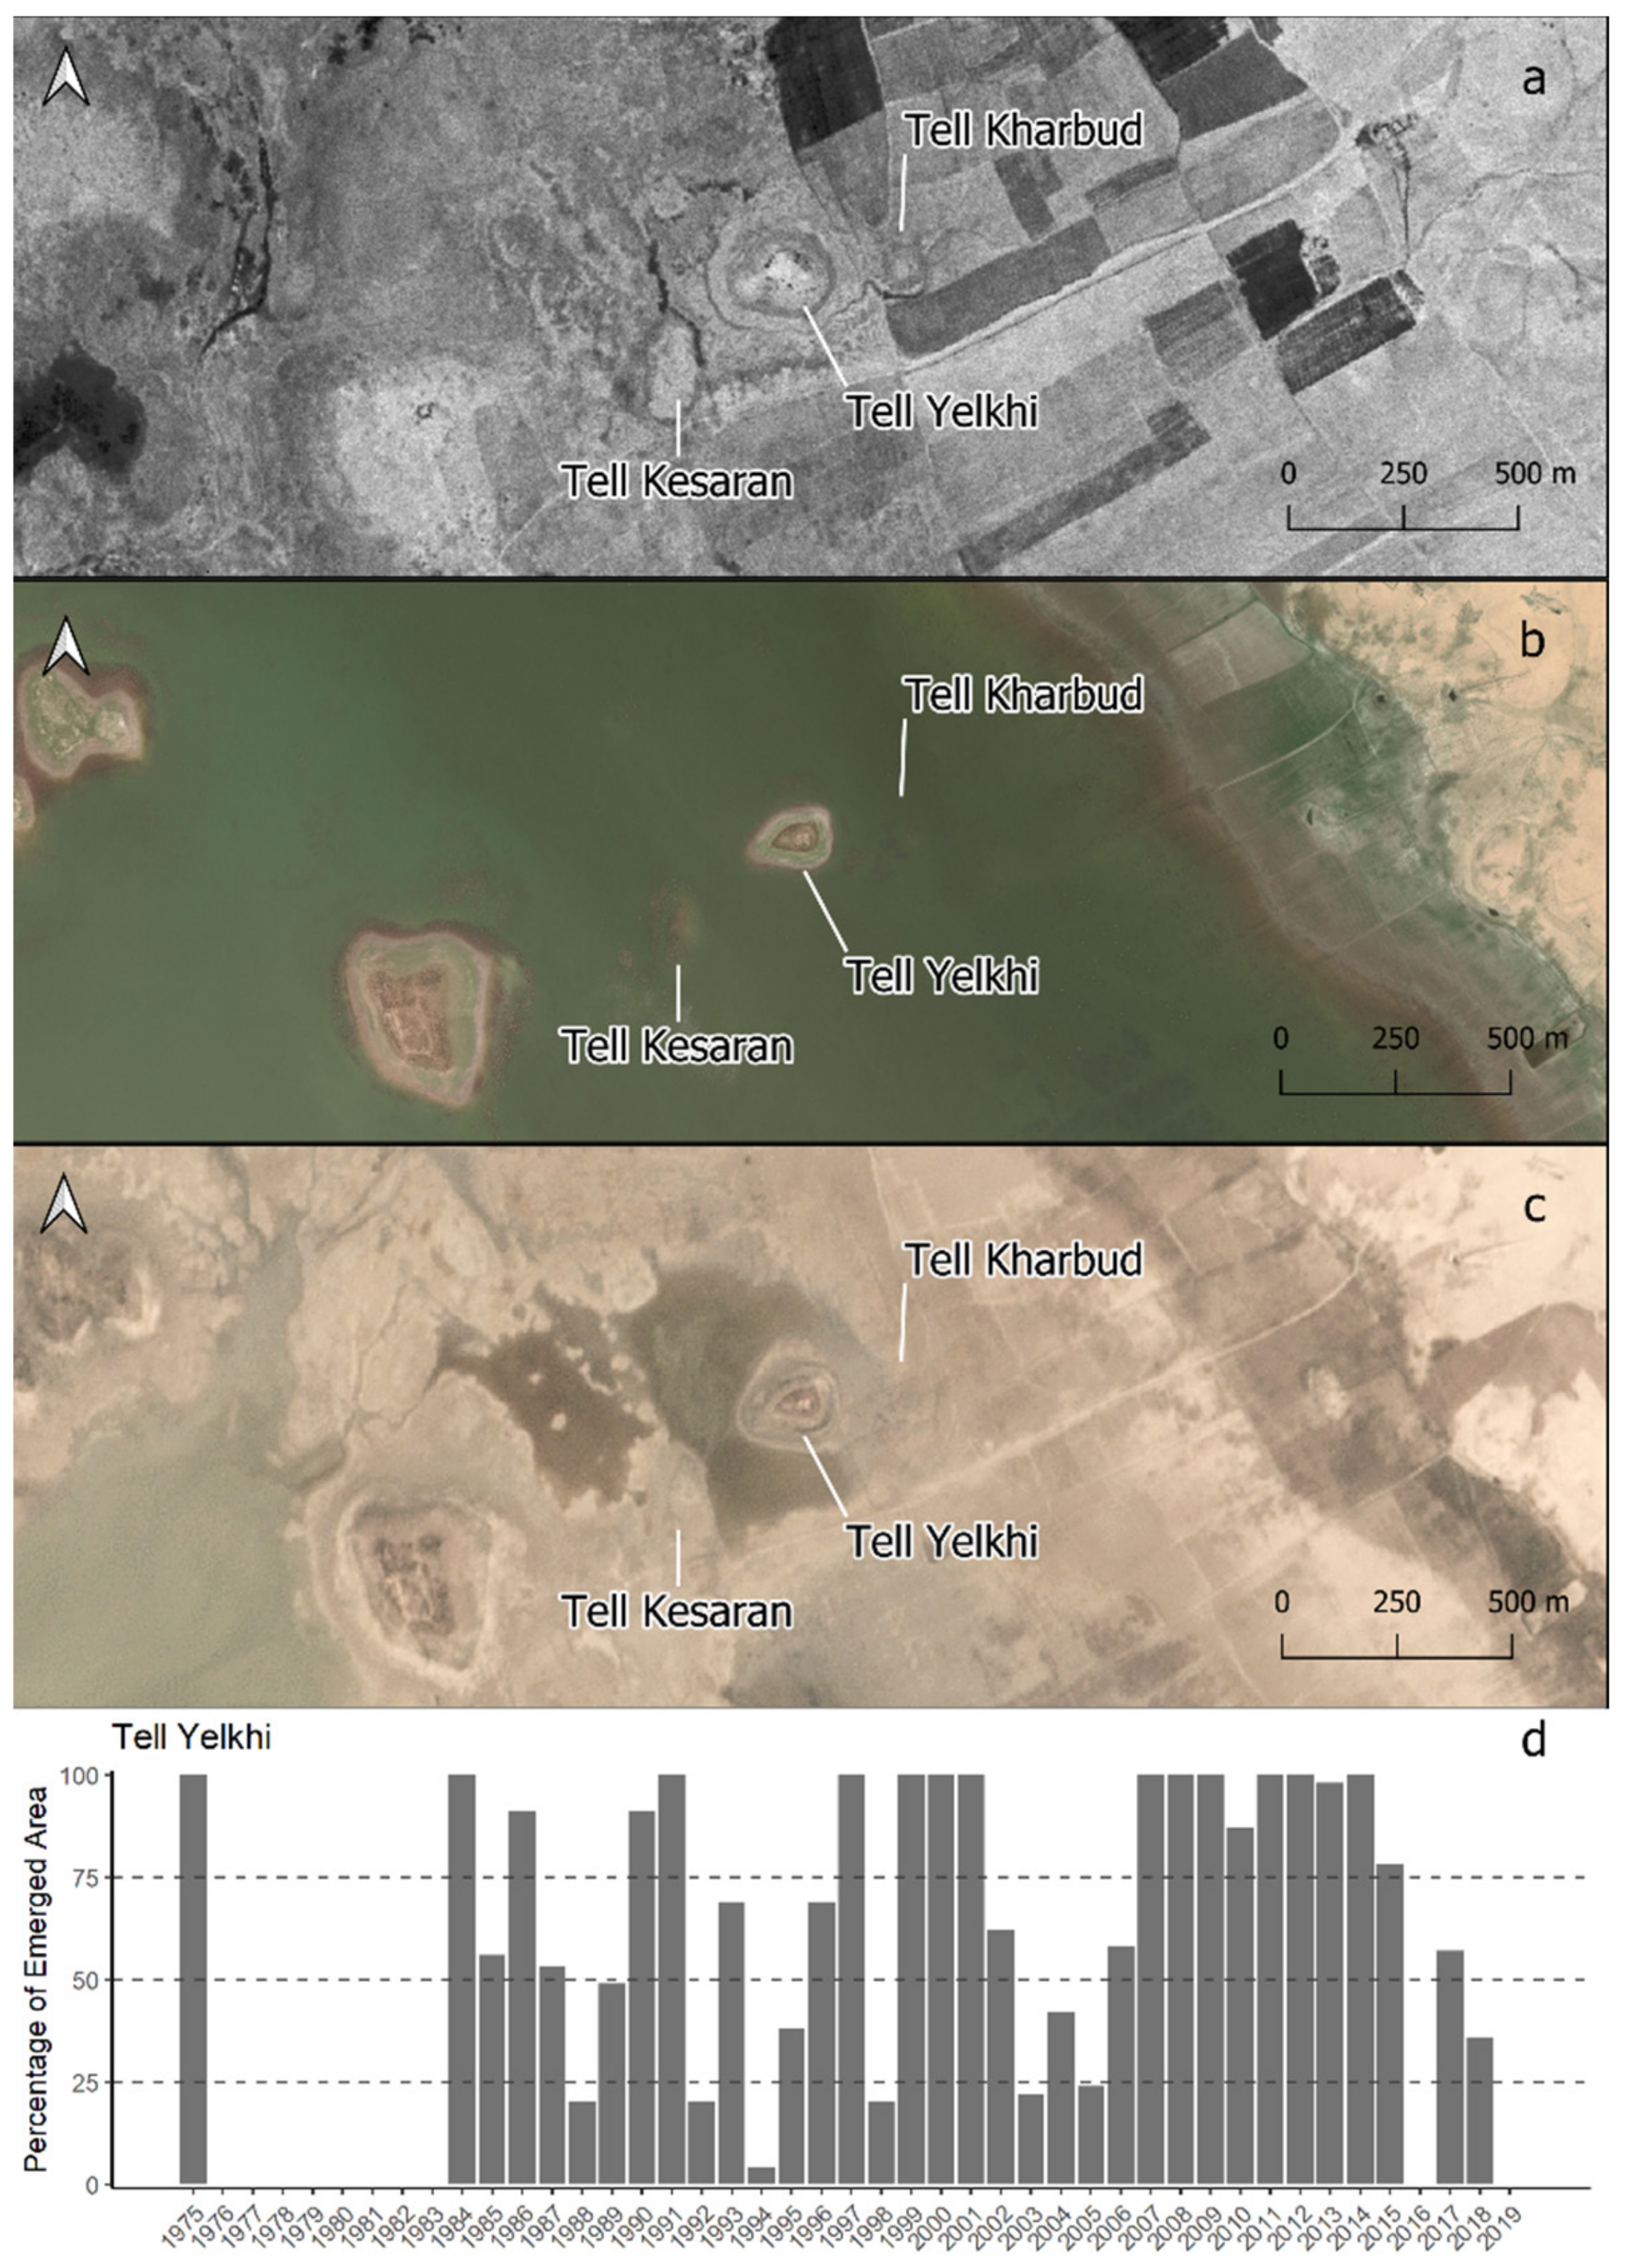
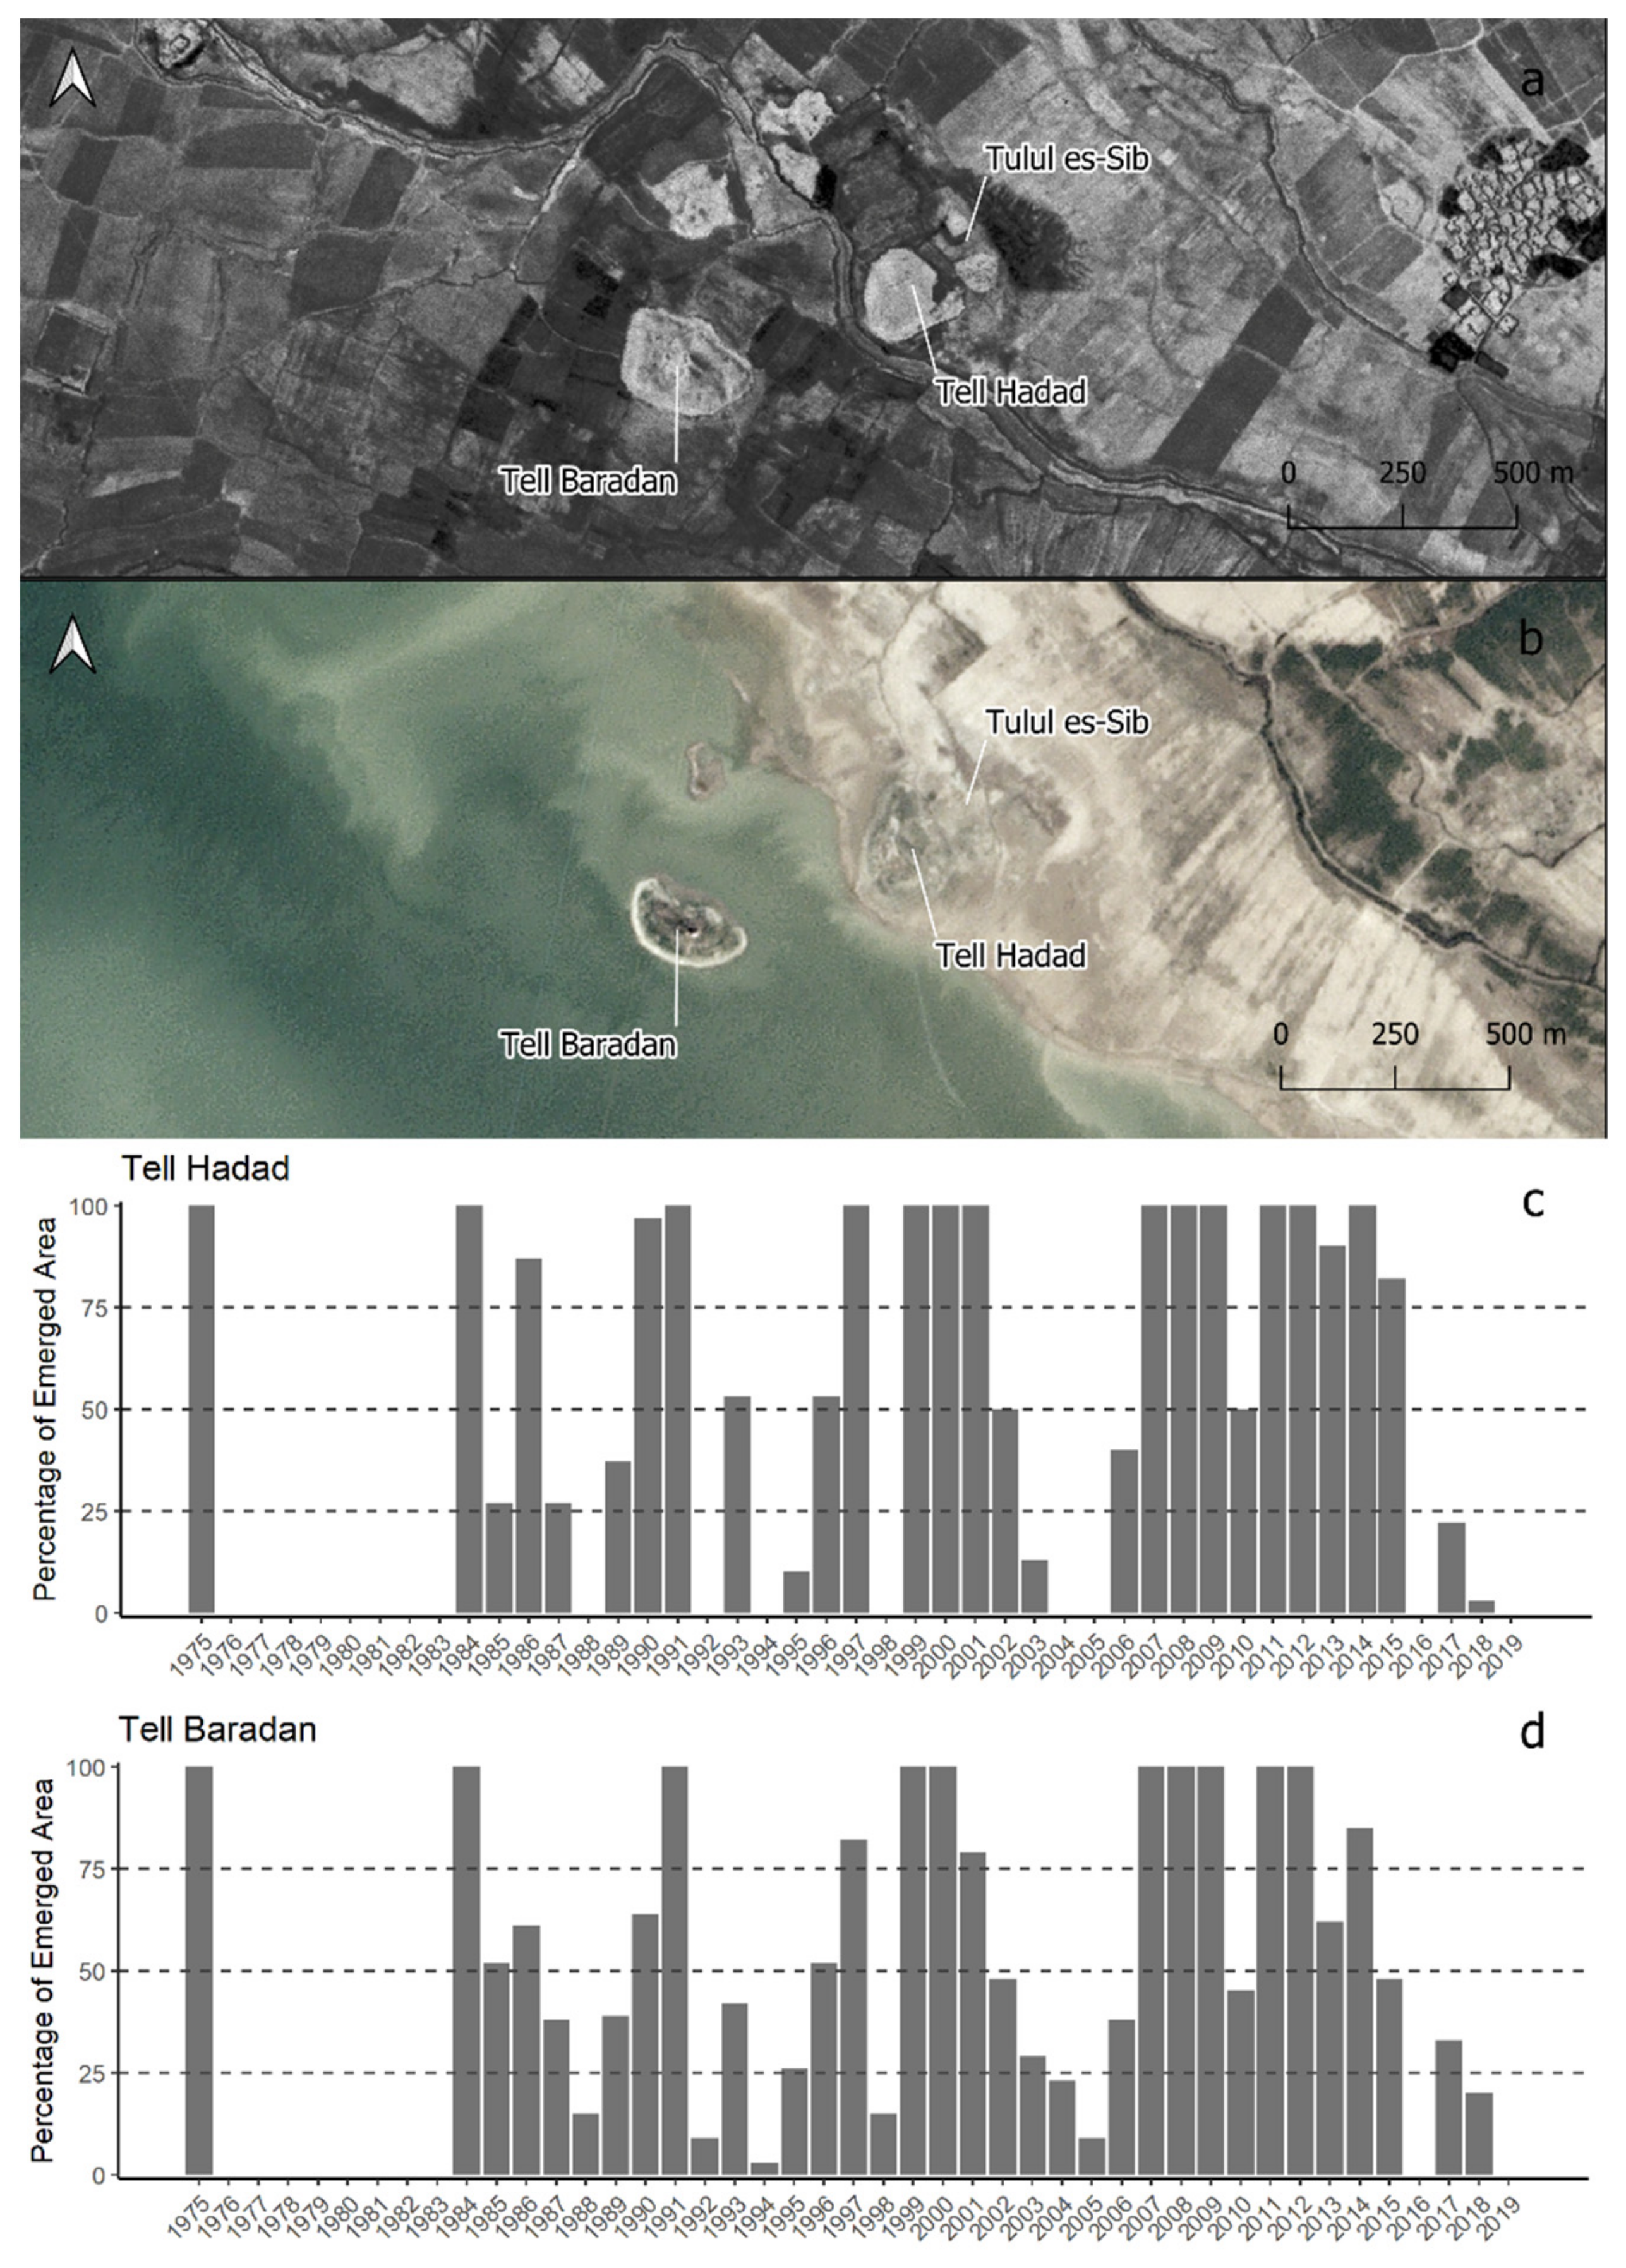
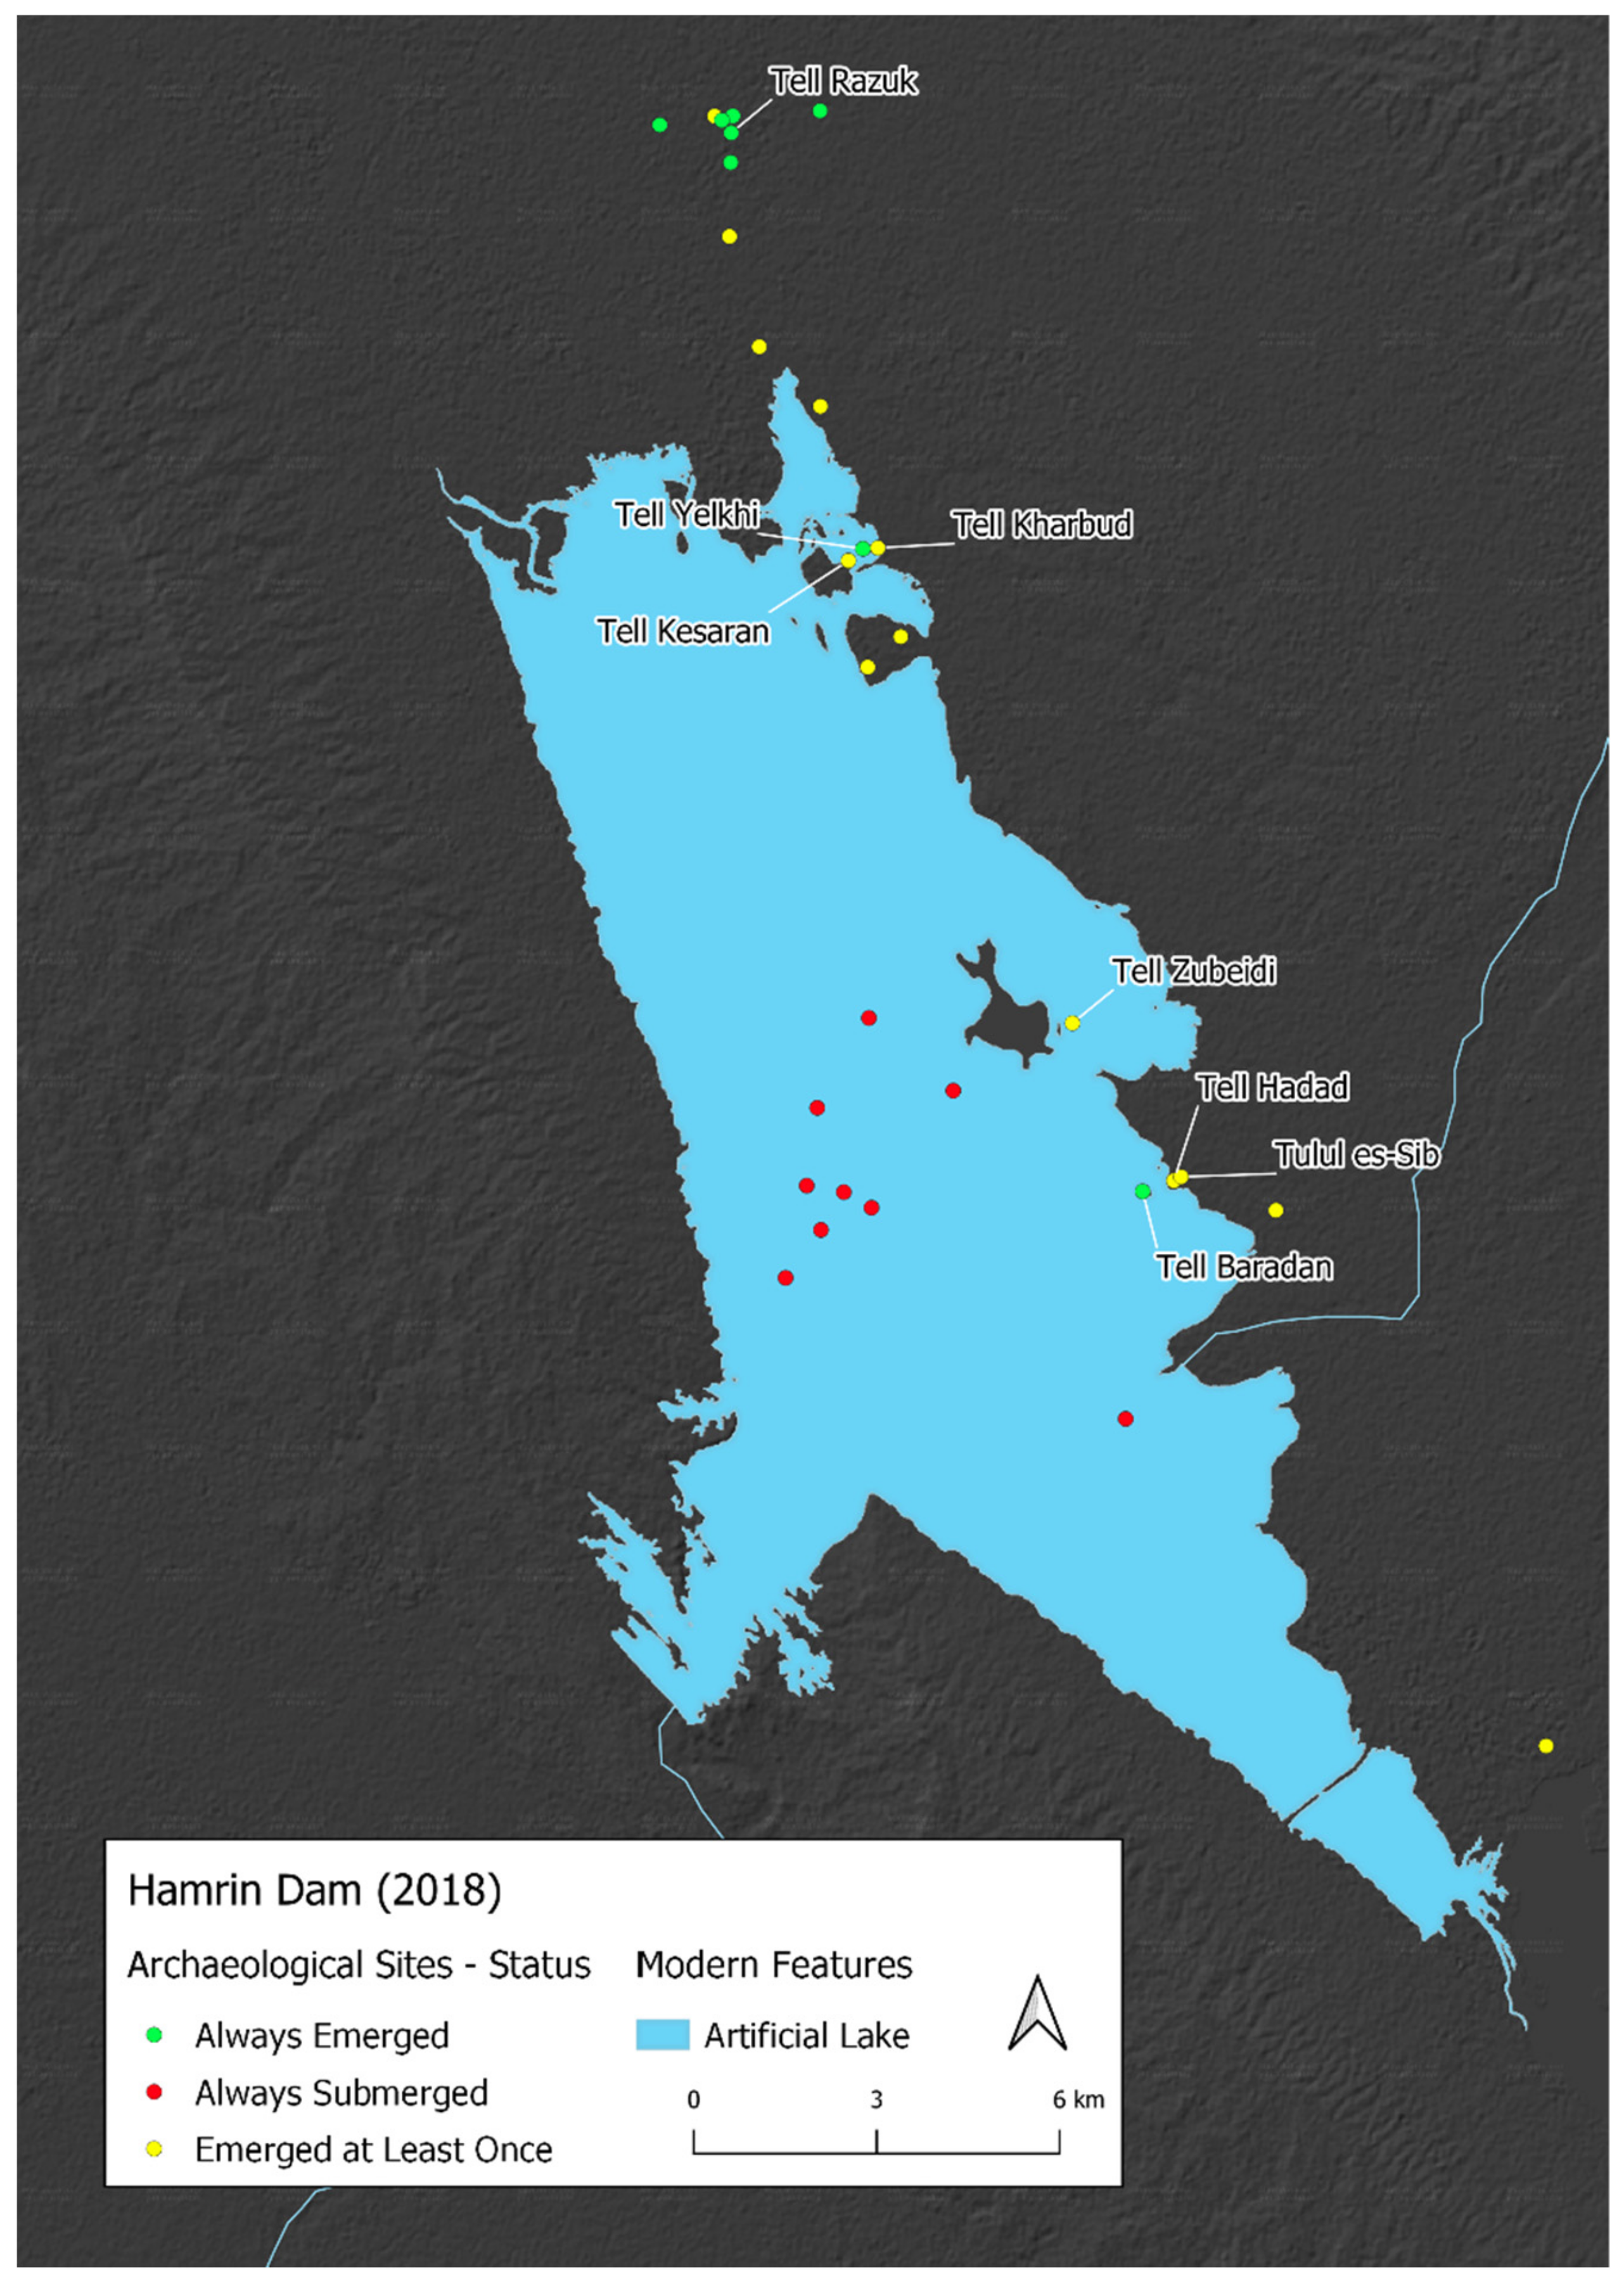
2.1.3. Hamrin Dam
2.2. Archaeological Sites
- An open, and freely available dataset of Google Earth placemarks, available as a .kmz file named “ANE.kmz”, which stores name and location of more than 2500 archaeological sites across Egypt and the Near East [54];
- On satellite images, the site shows evident features such as walls that delimit its extension;
- Visible topographic features (e.g., a Tell) that was taken as minimum site extent.
2.3. Satellite Images
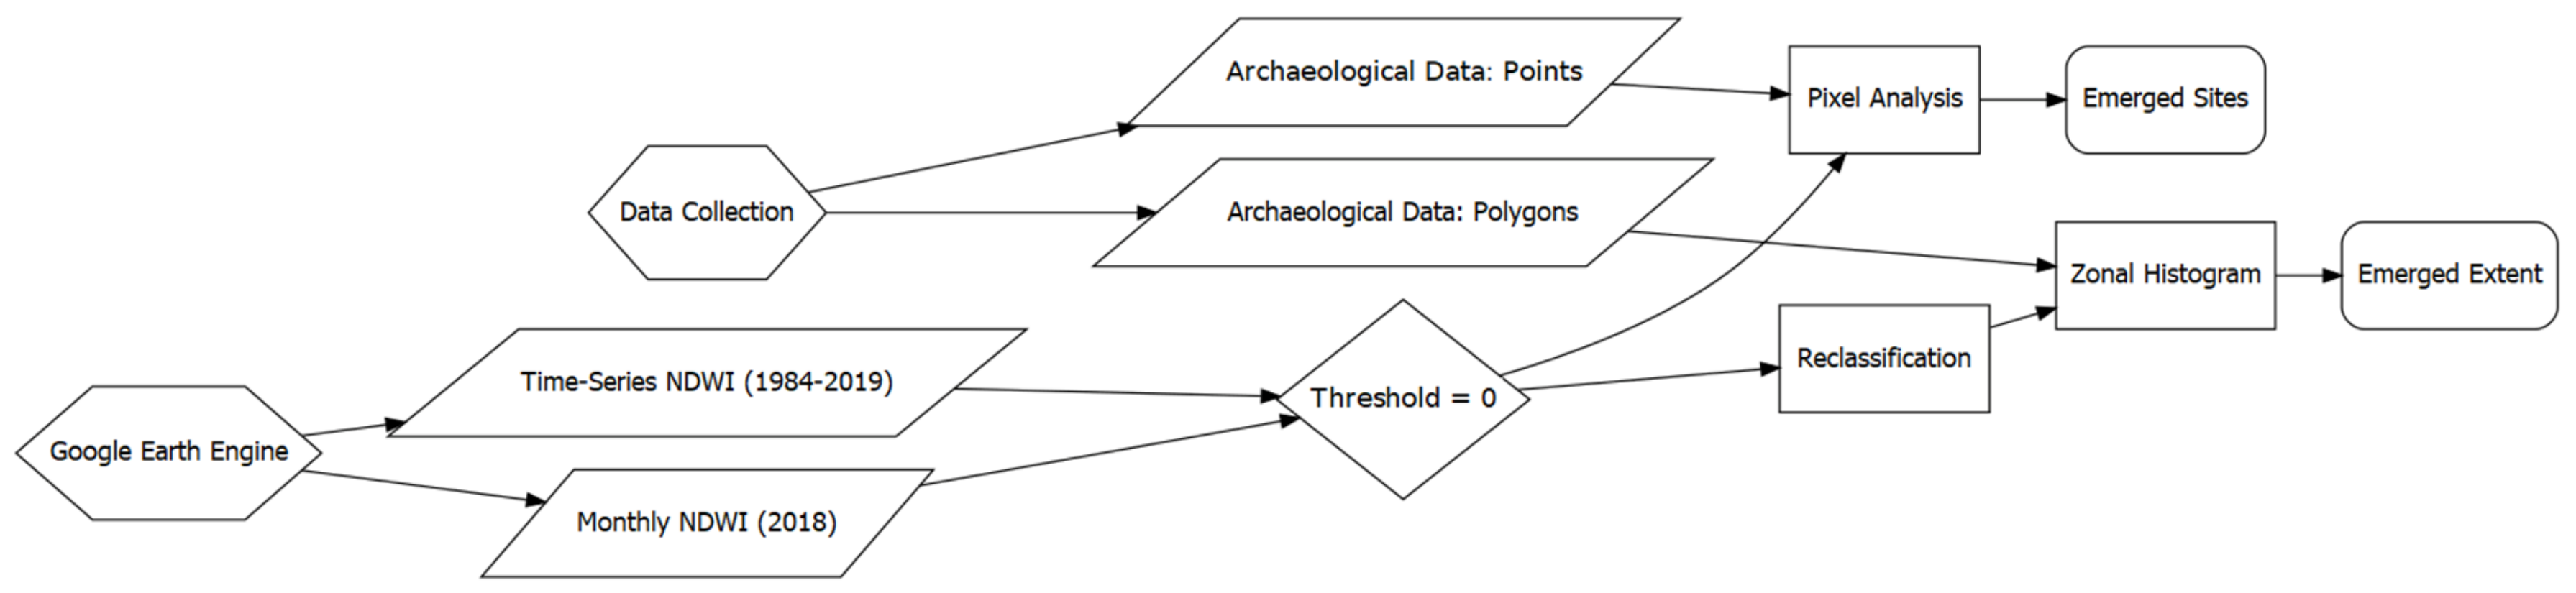
2.4. Processing Methods
2.4.1. NDWI
2.4.2. Google Earth Engine
2.4.3. Pixel Analysis and Zonal Histogram
3. Results
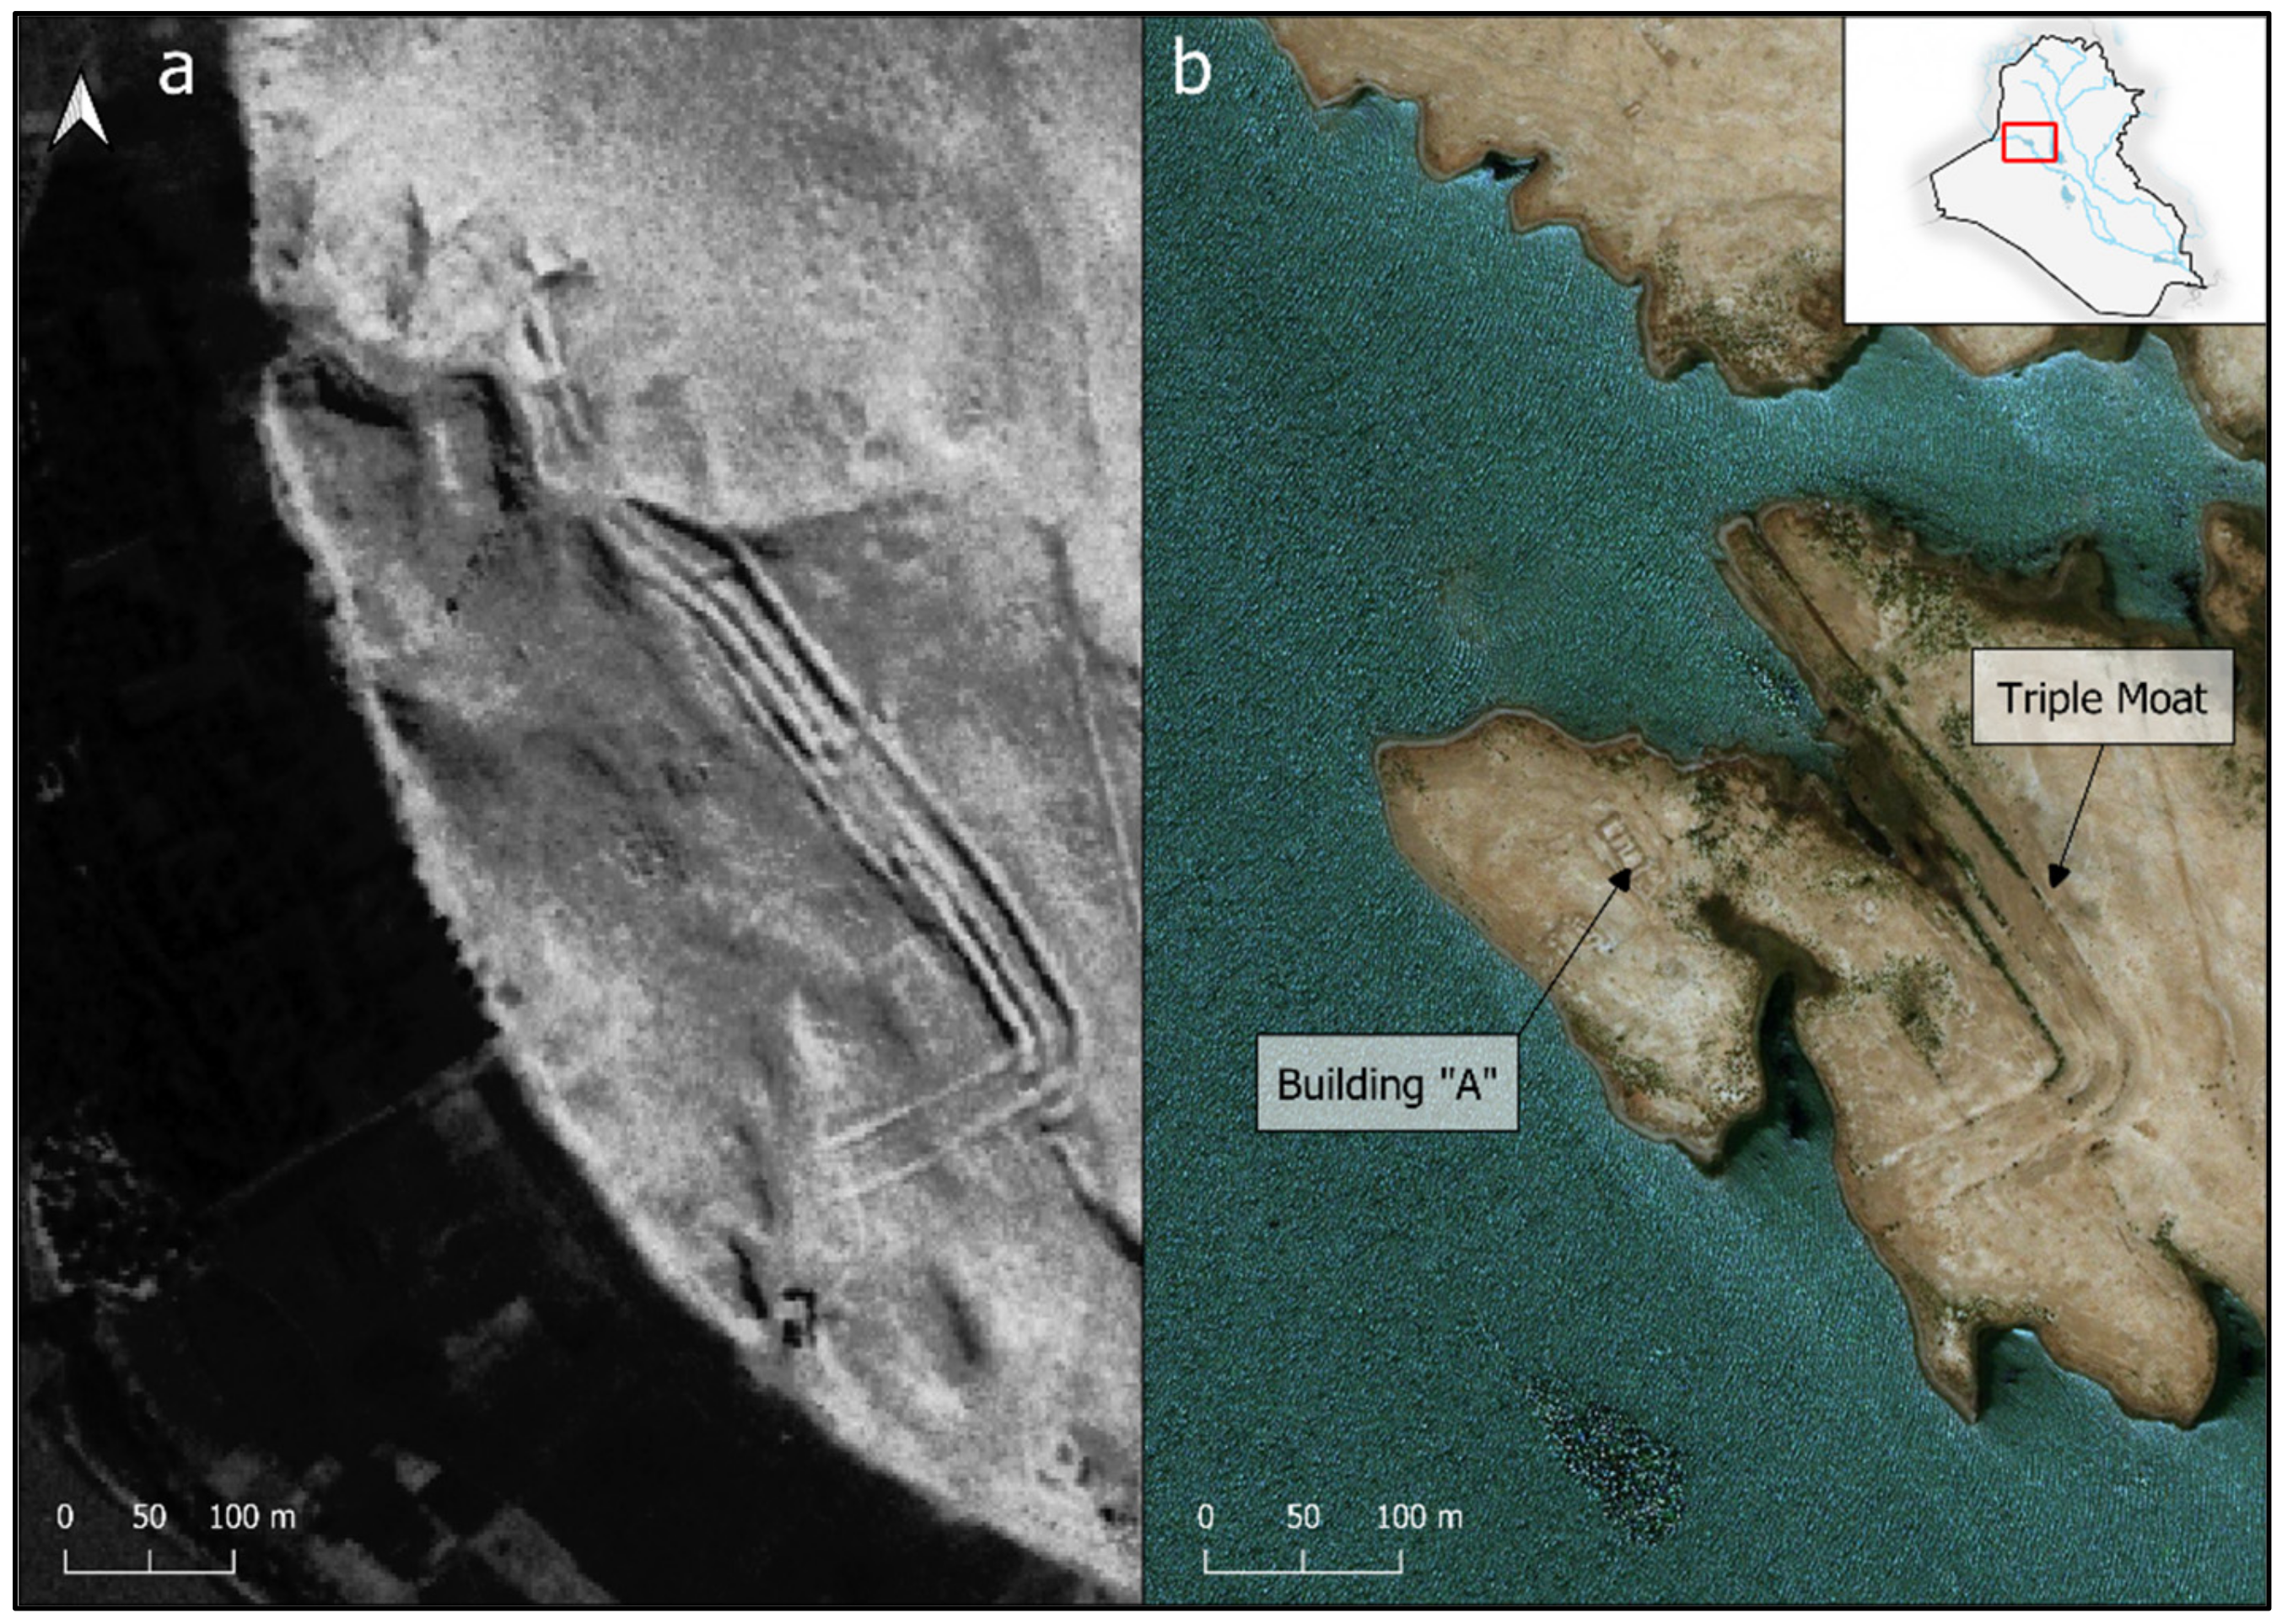
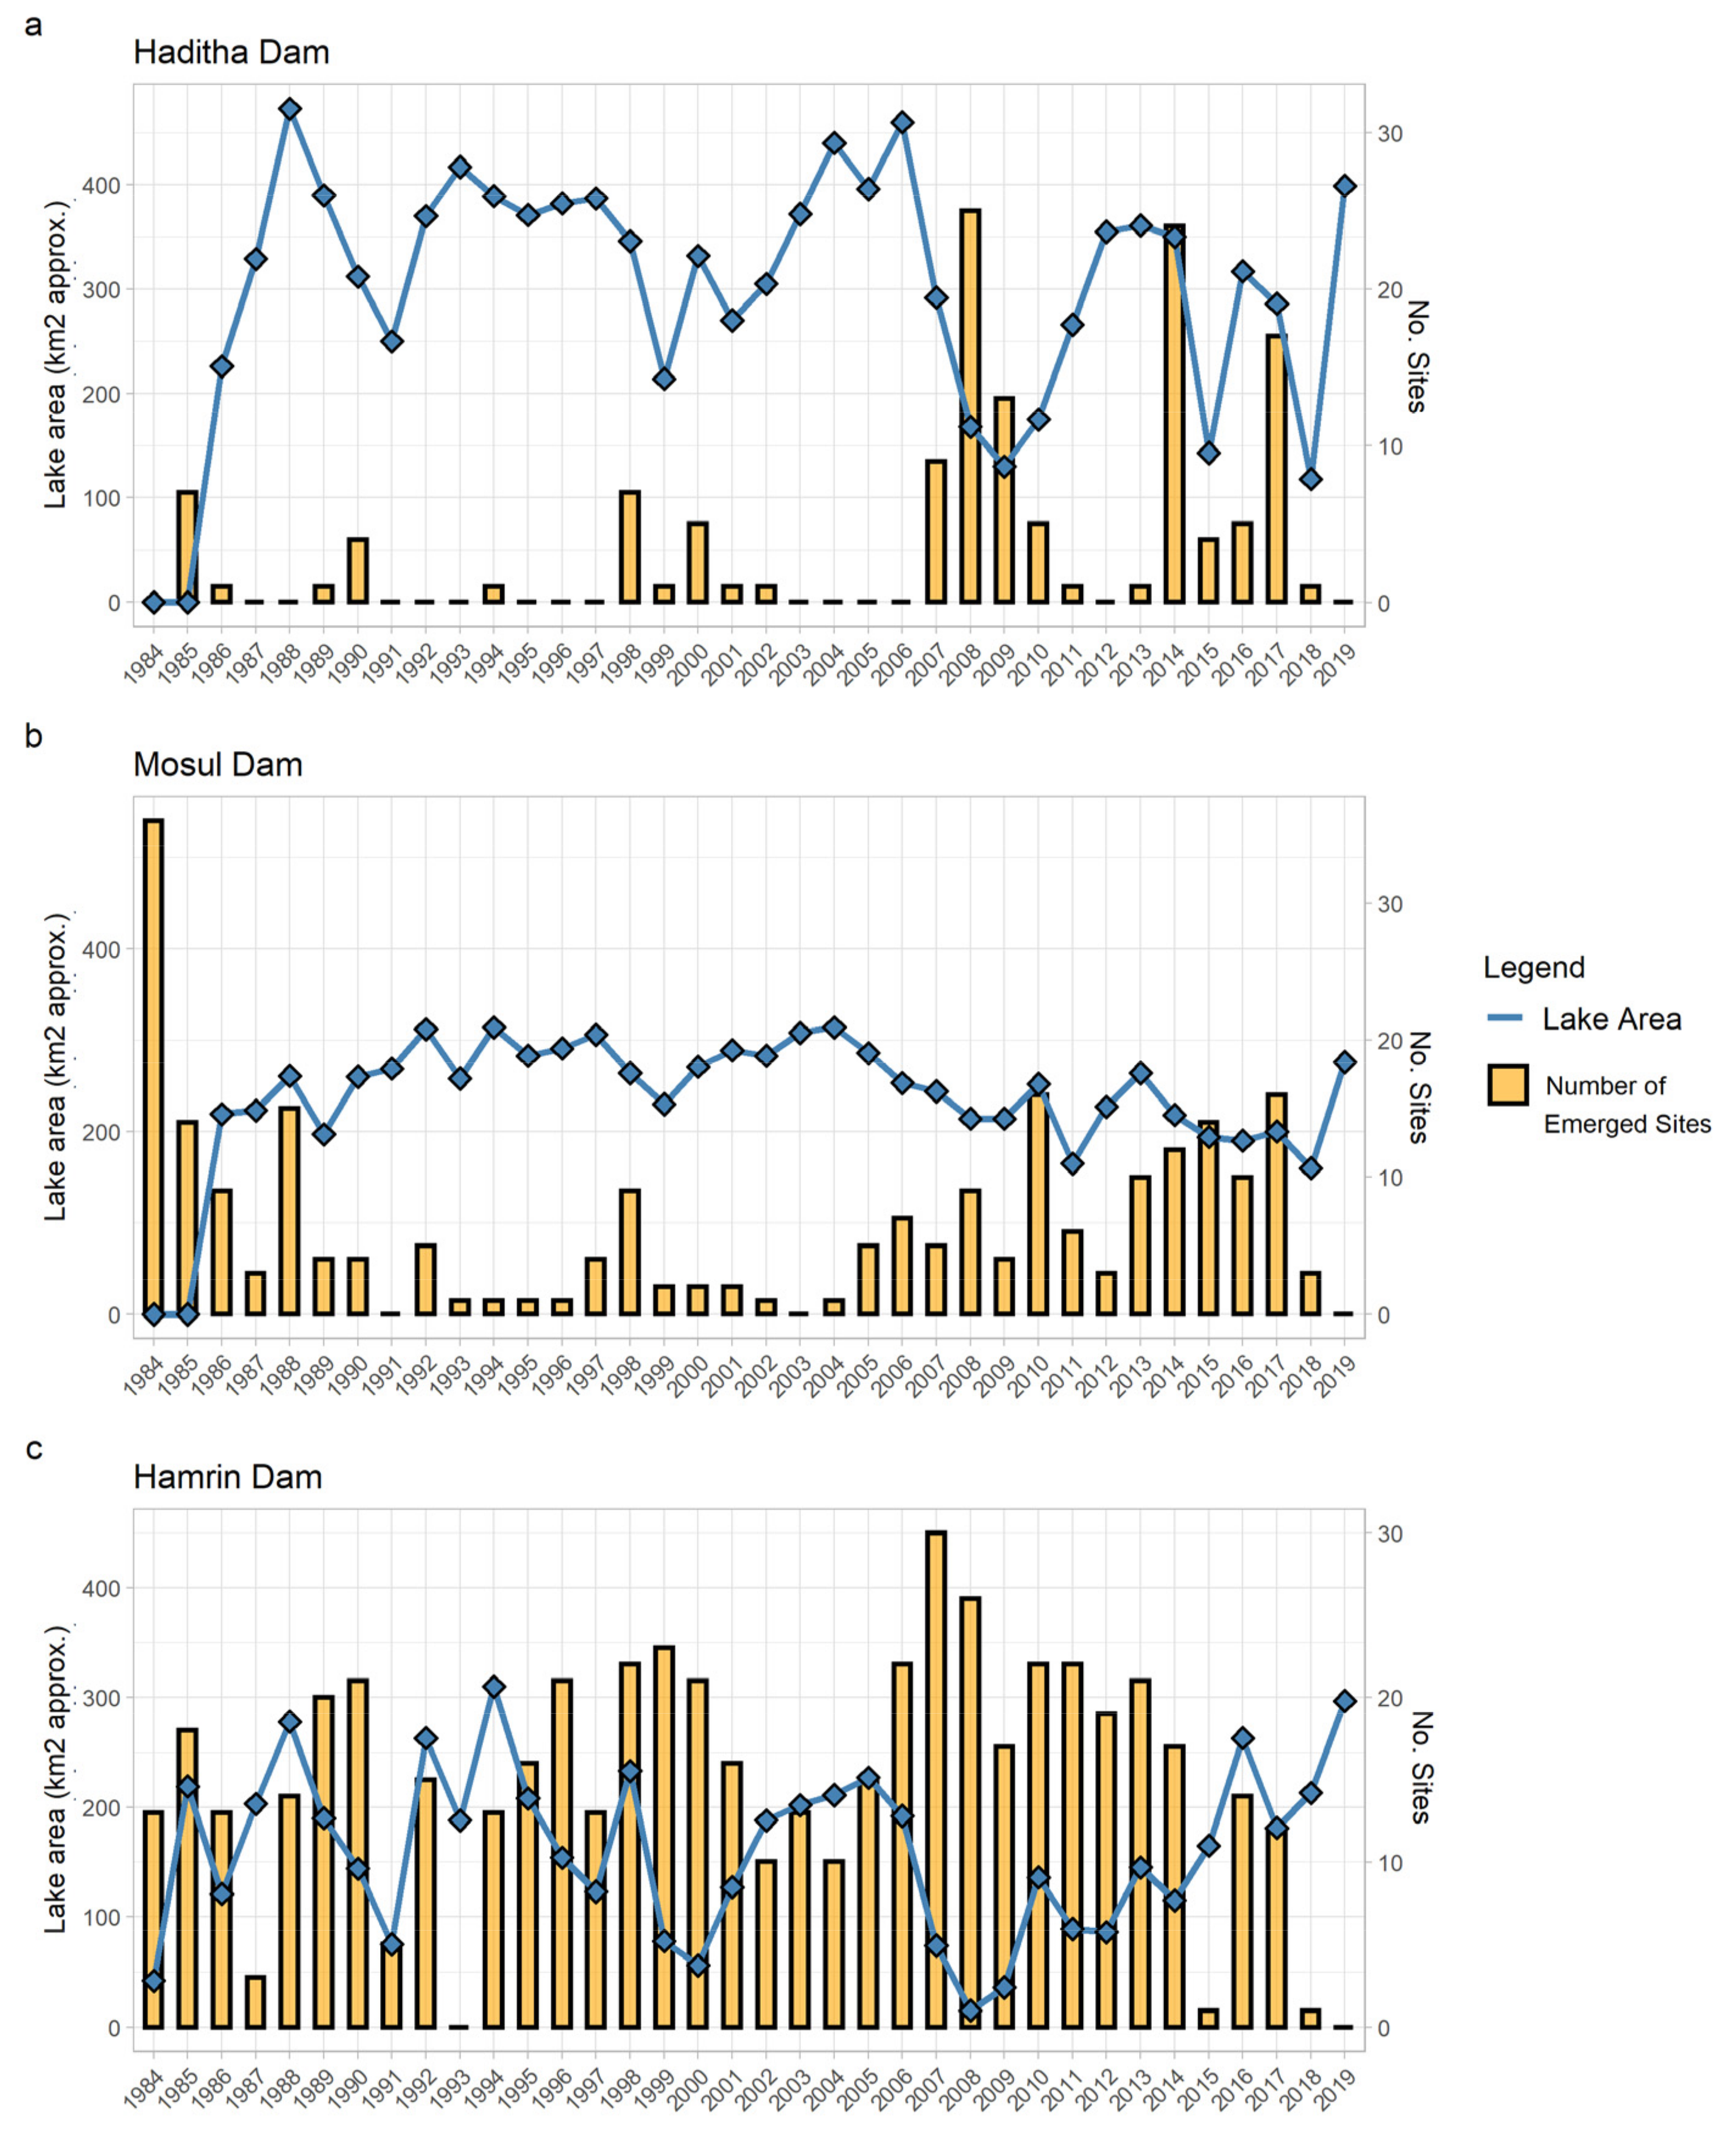
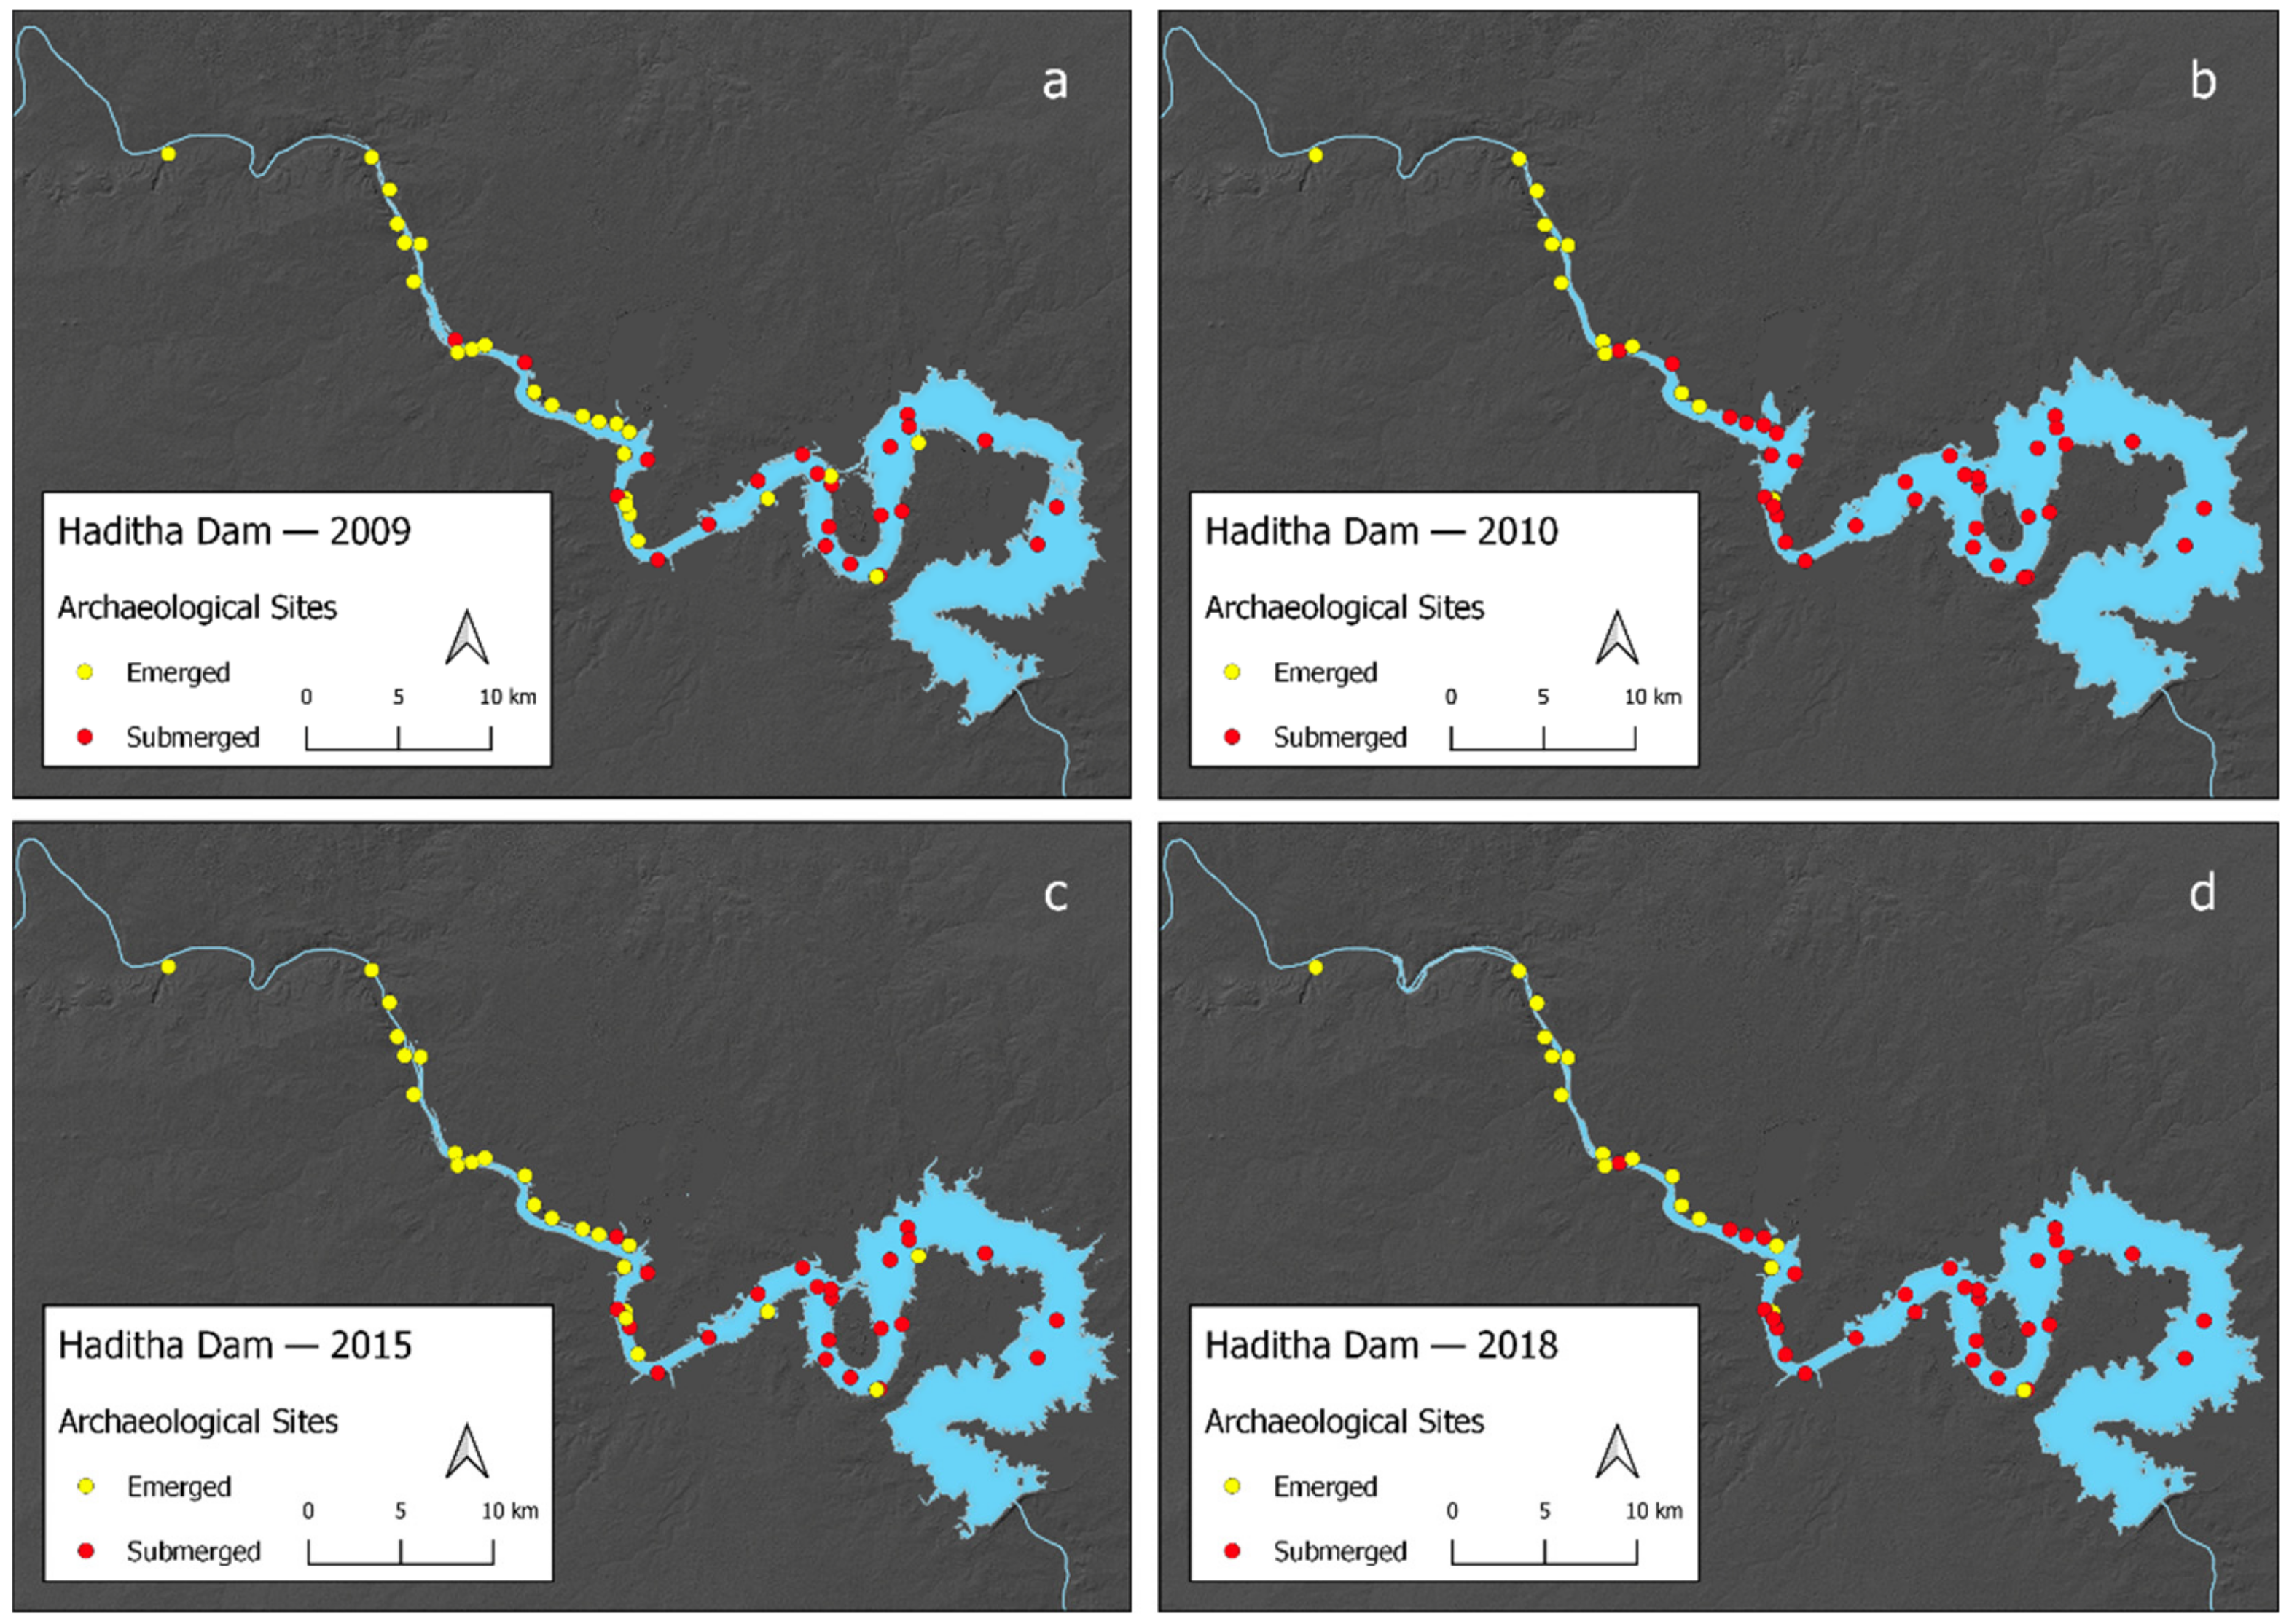
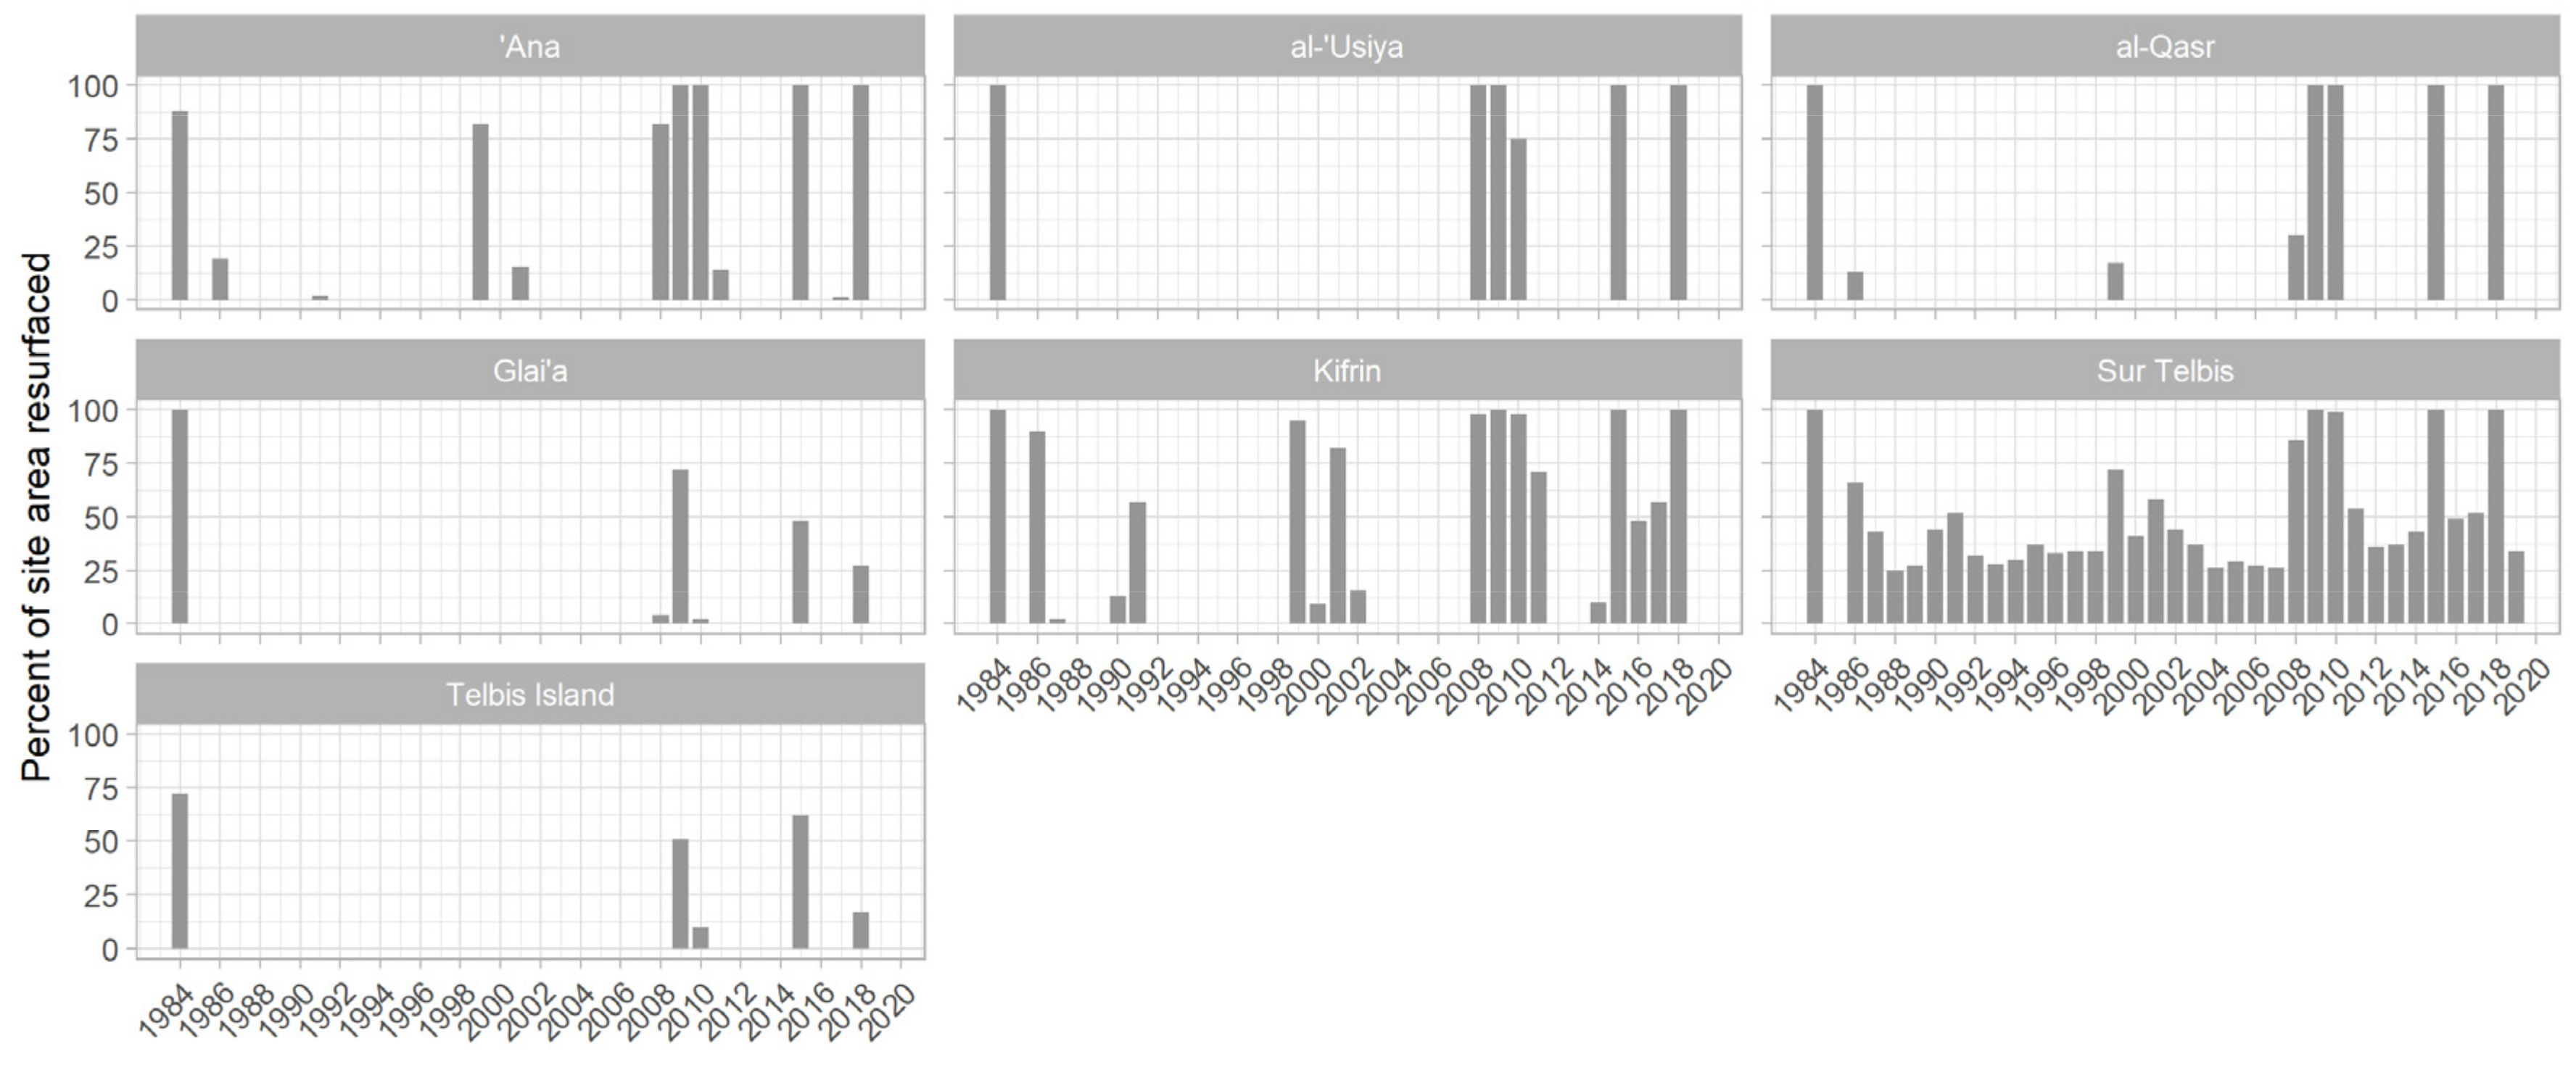
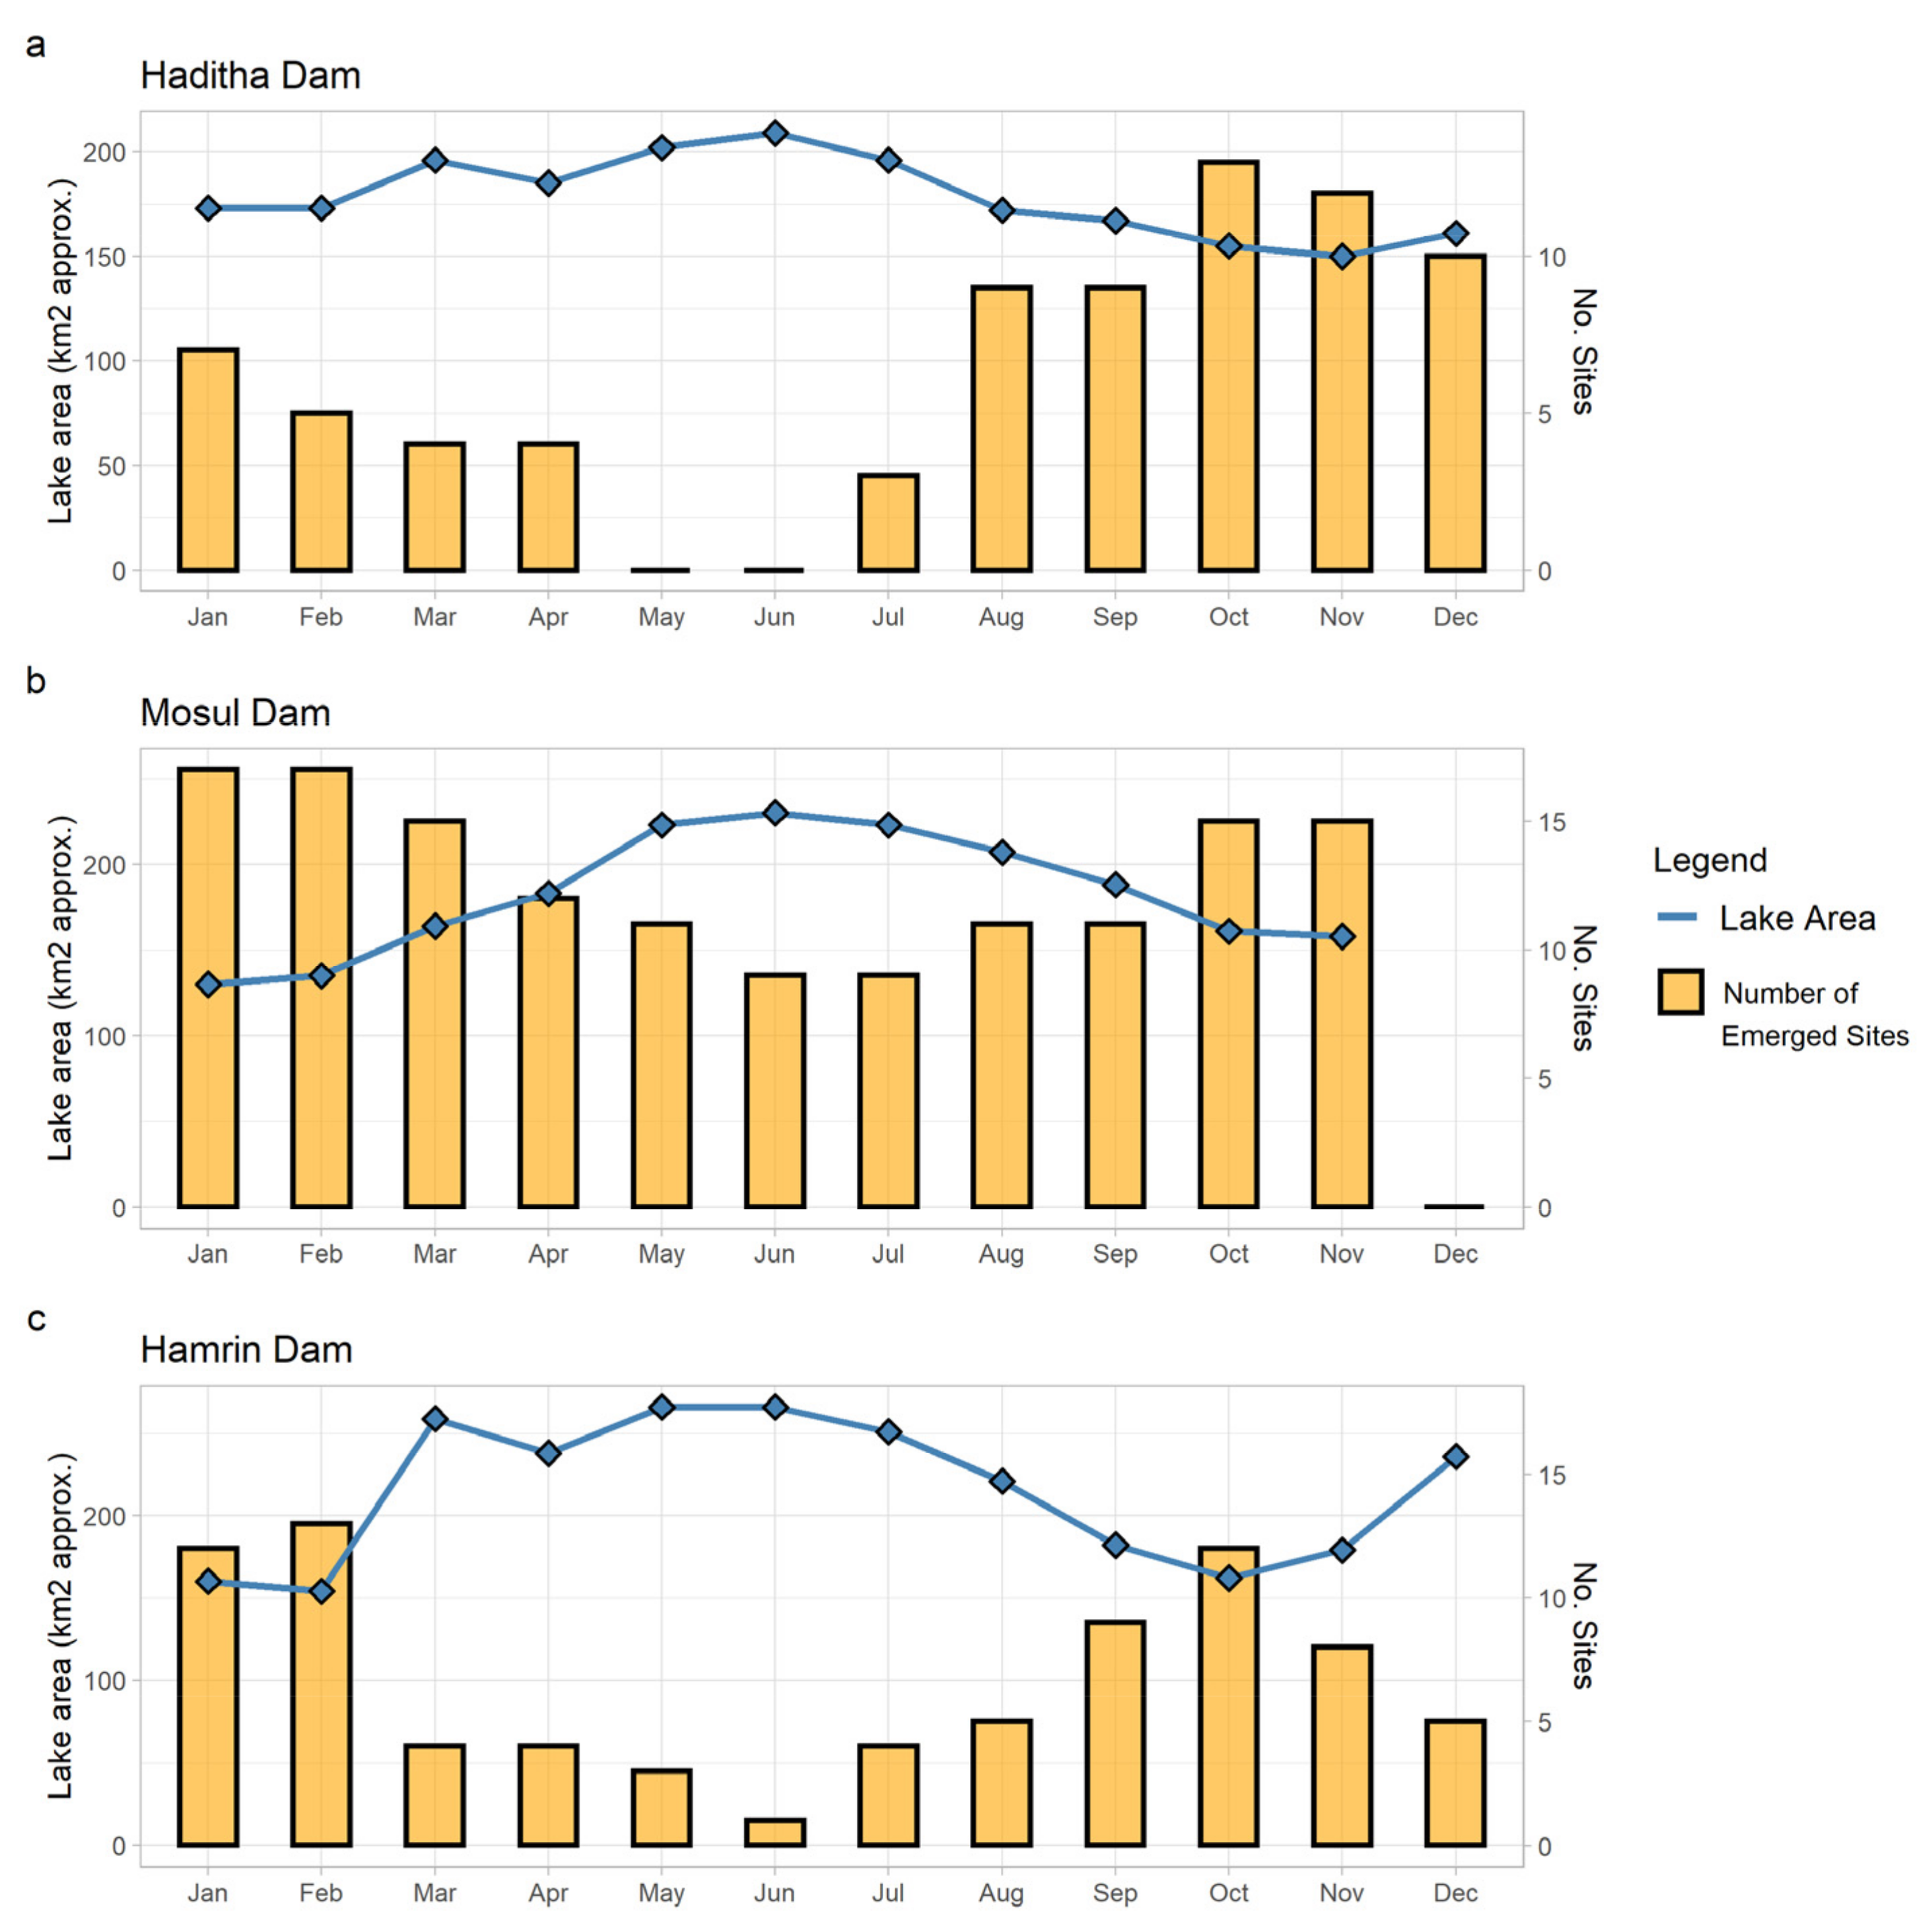
3.1. Haditha Dam
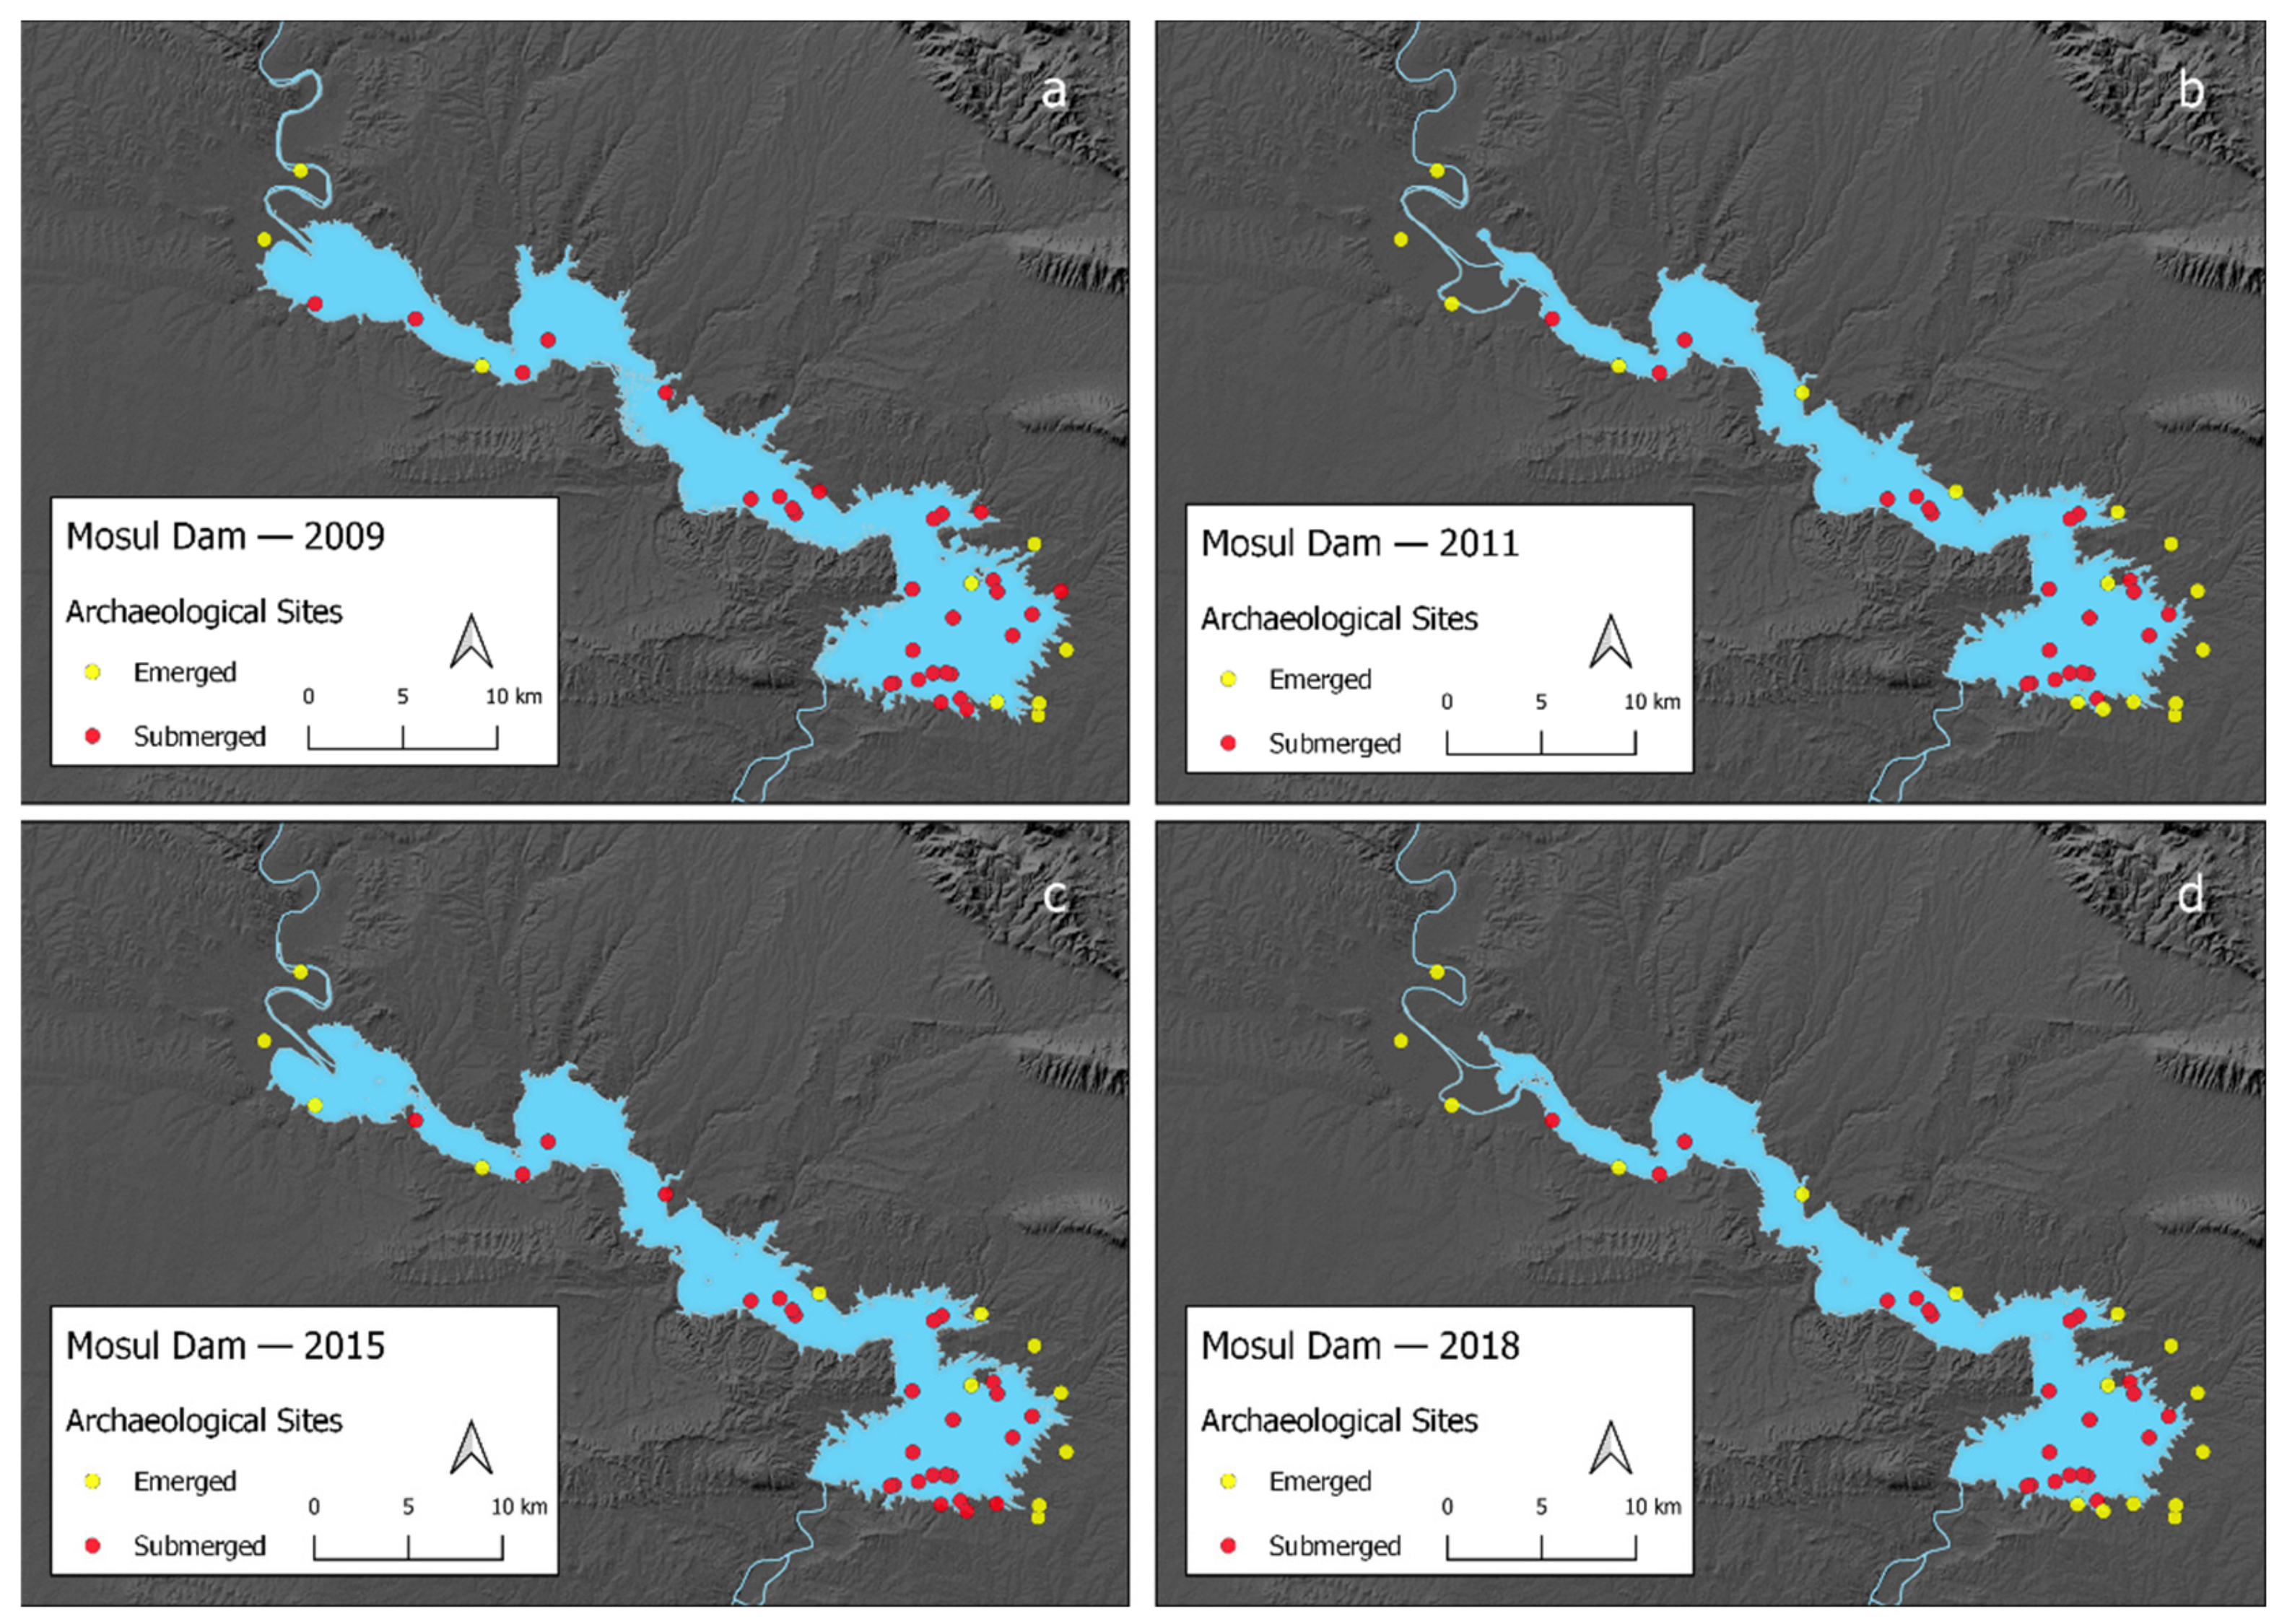
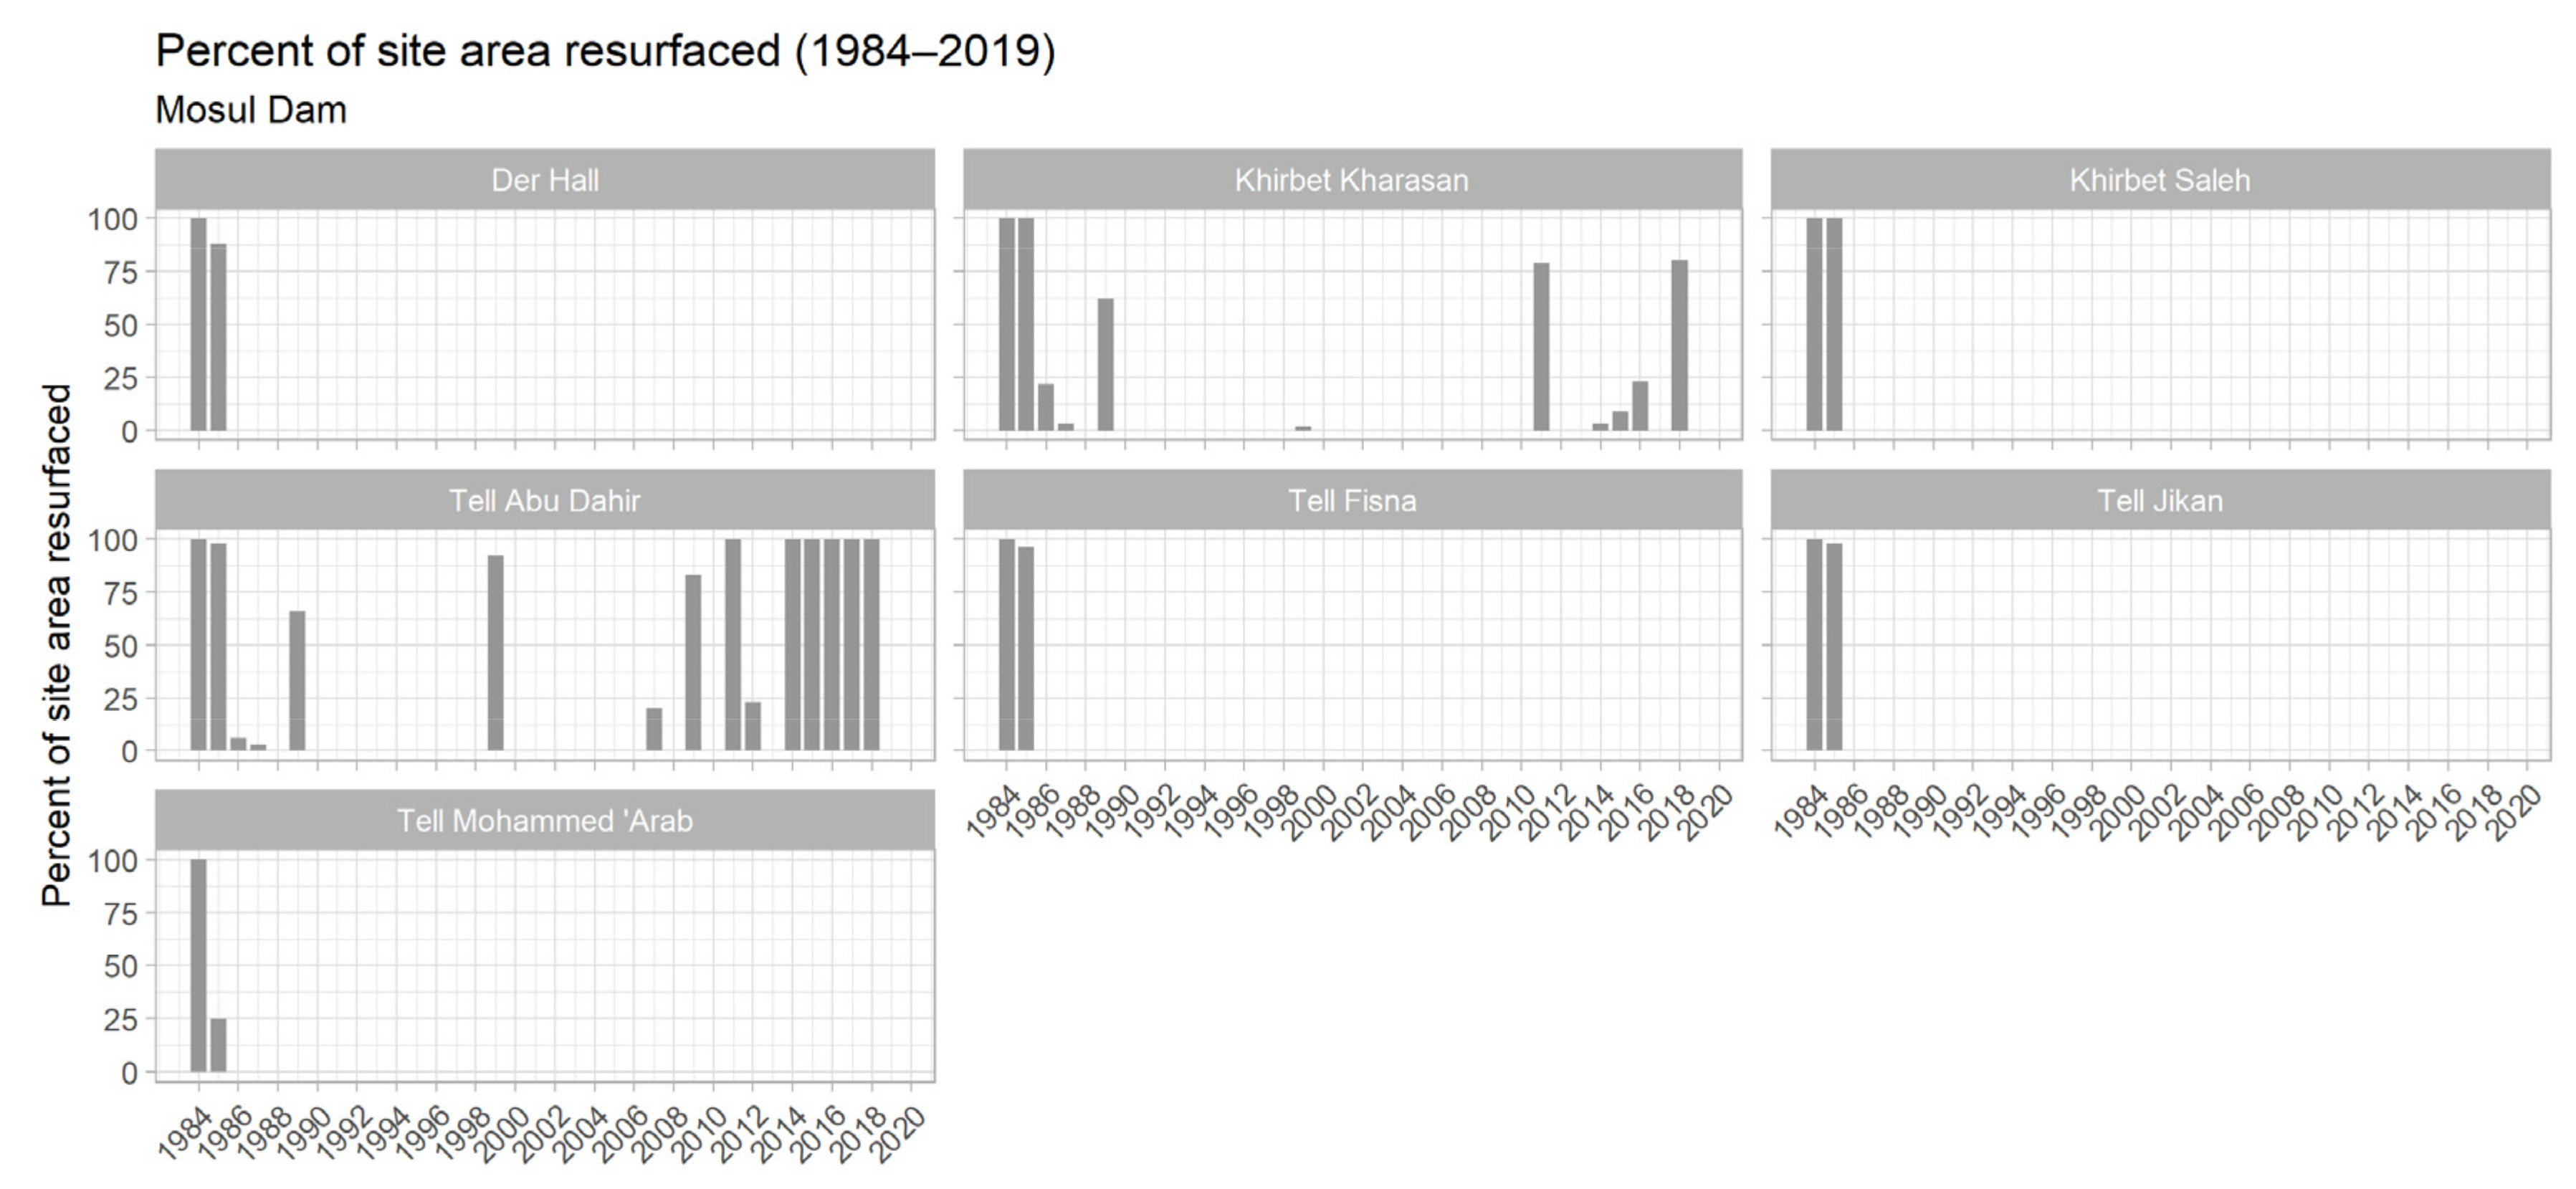
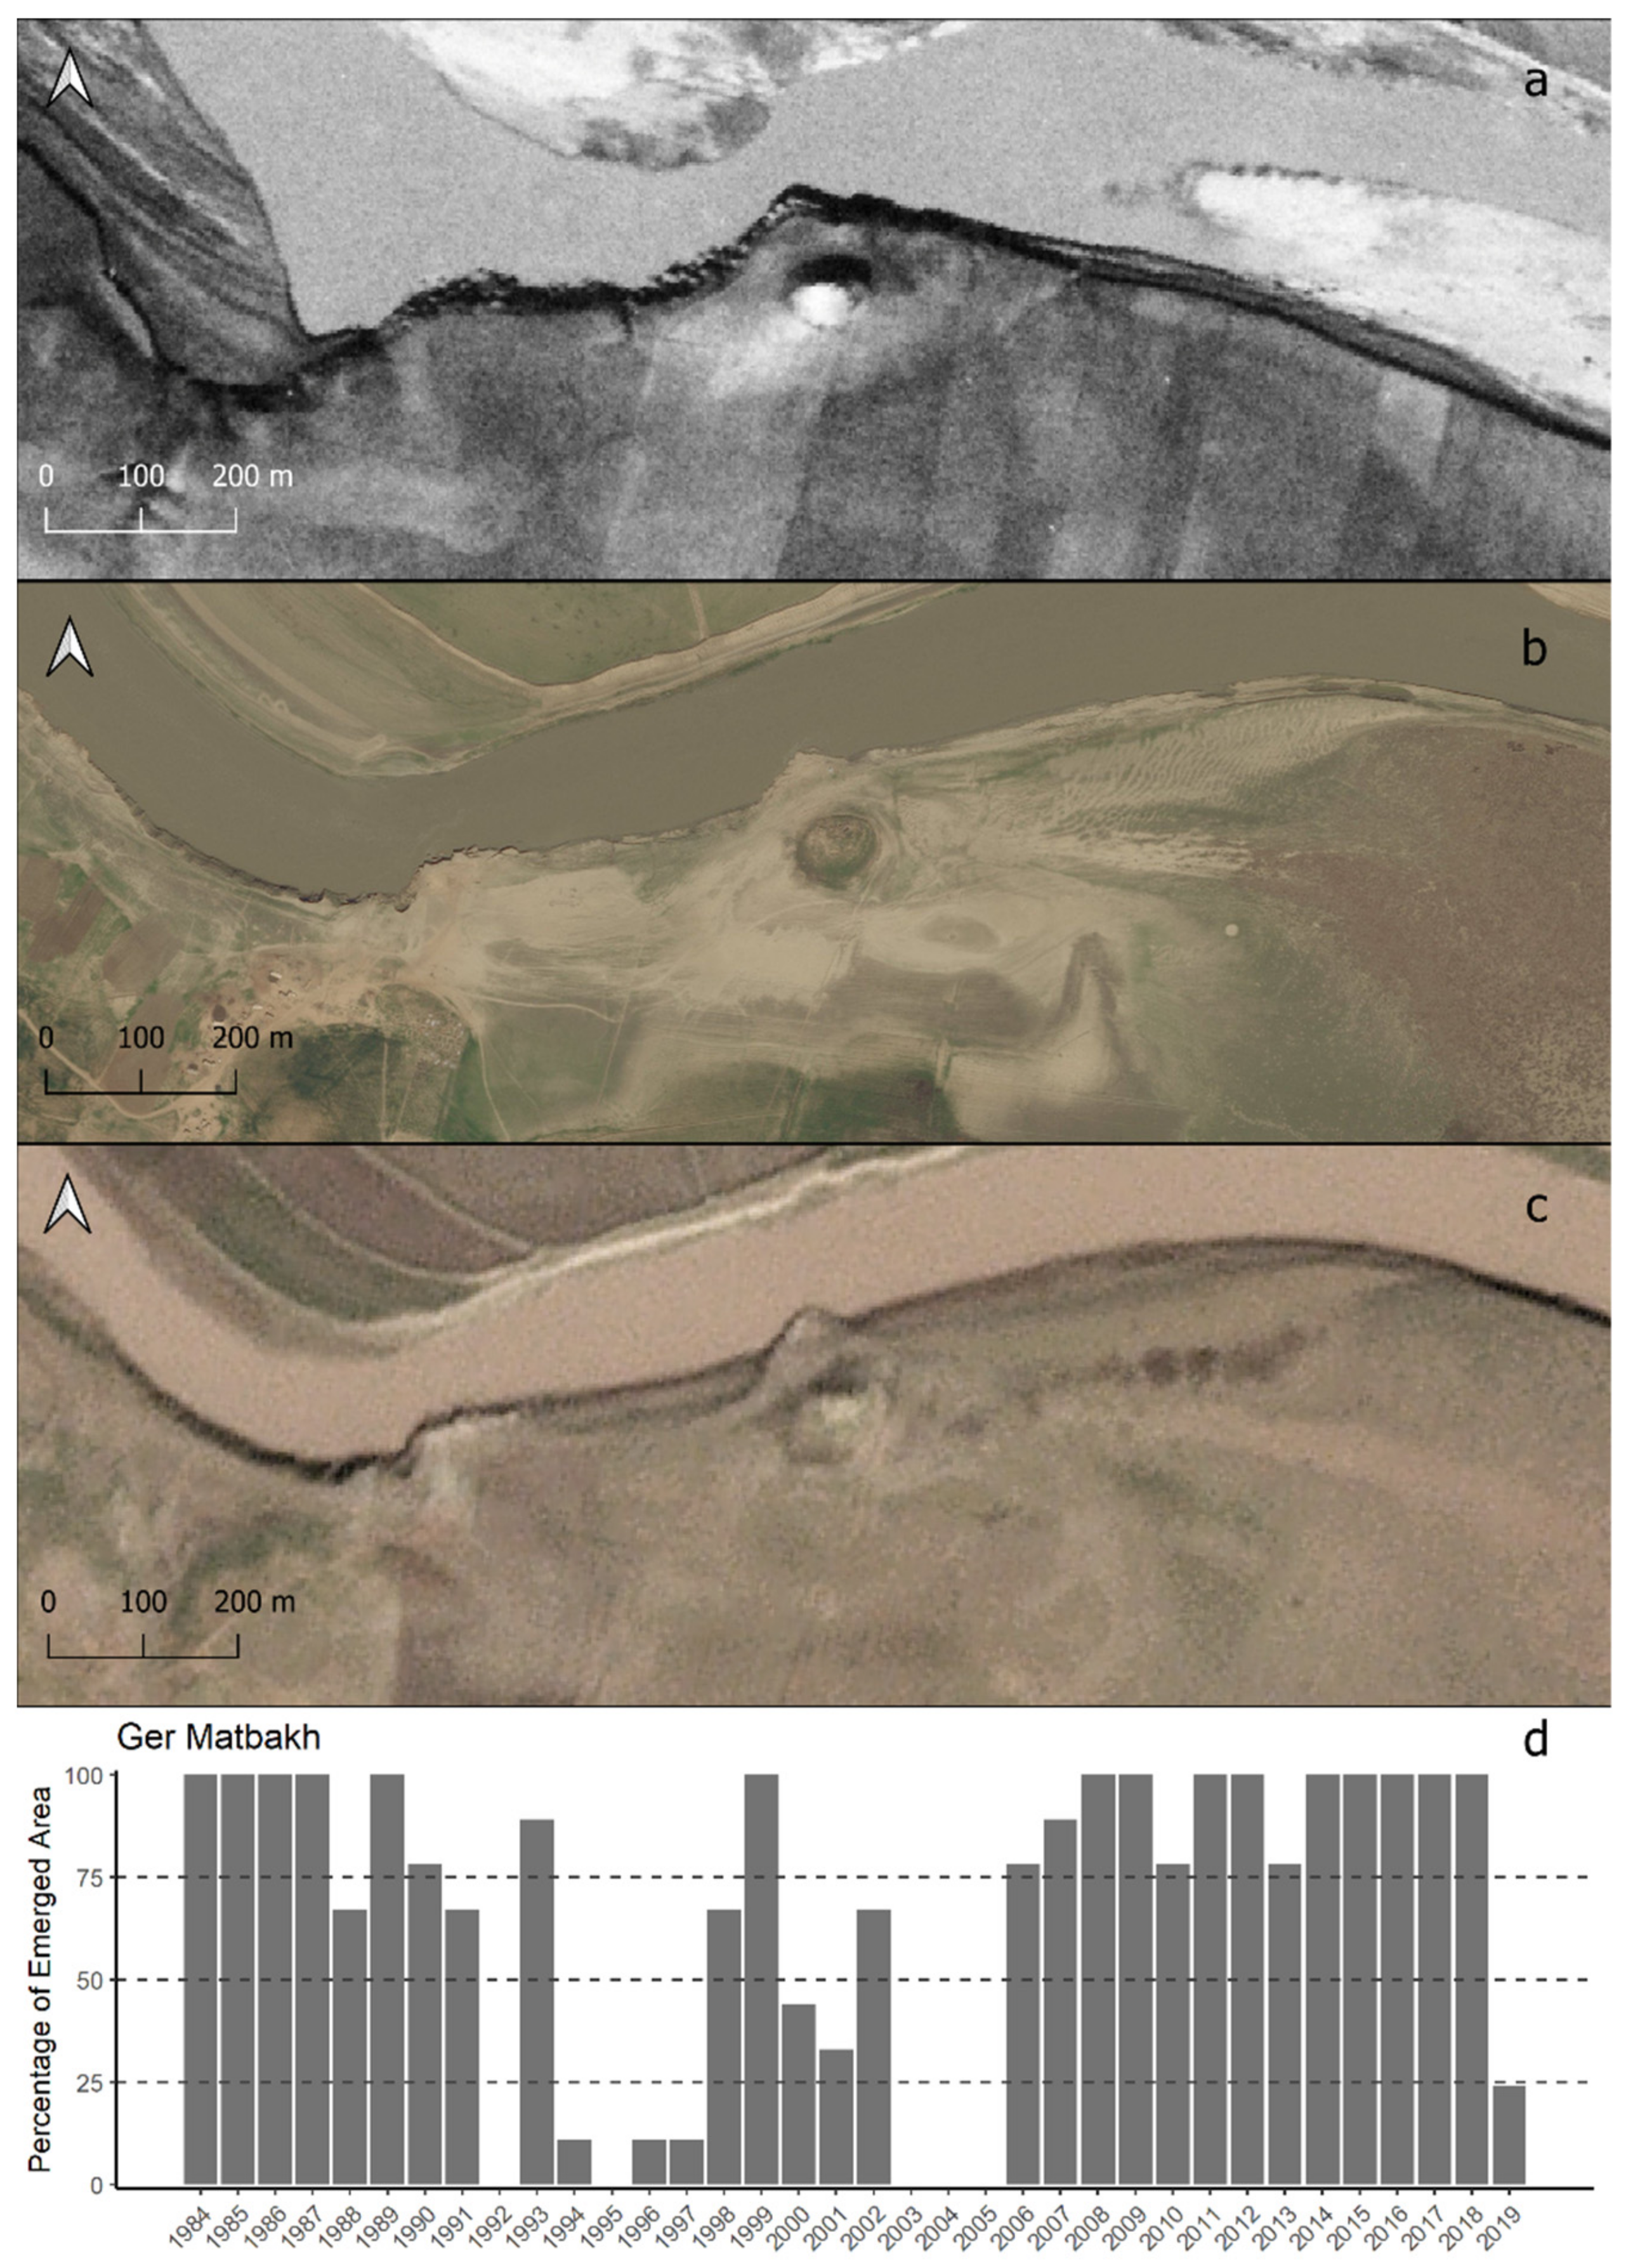
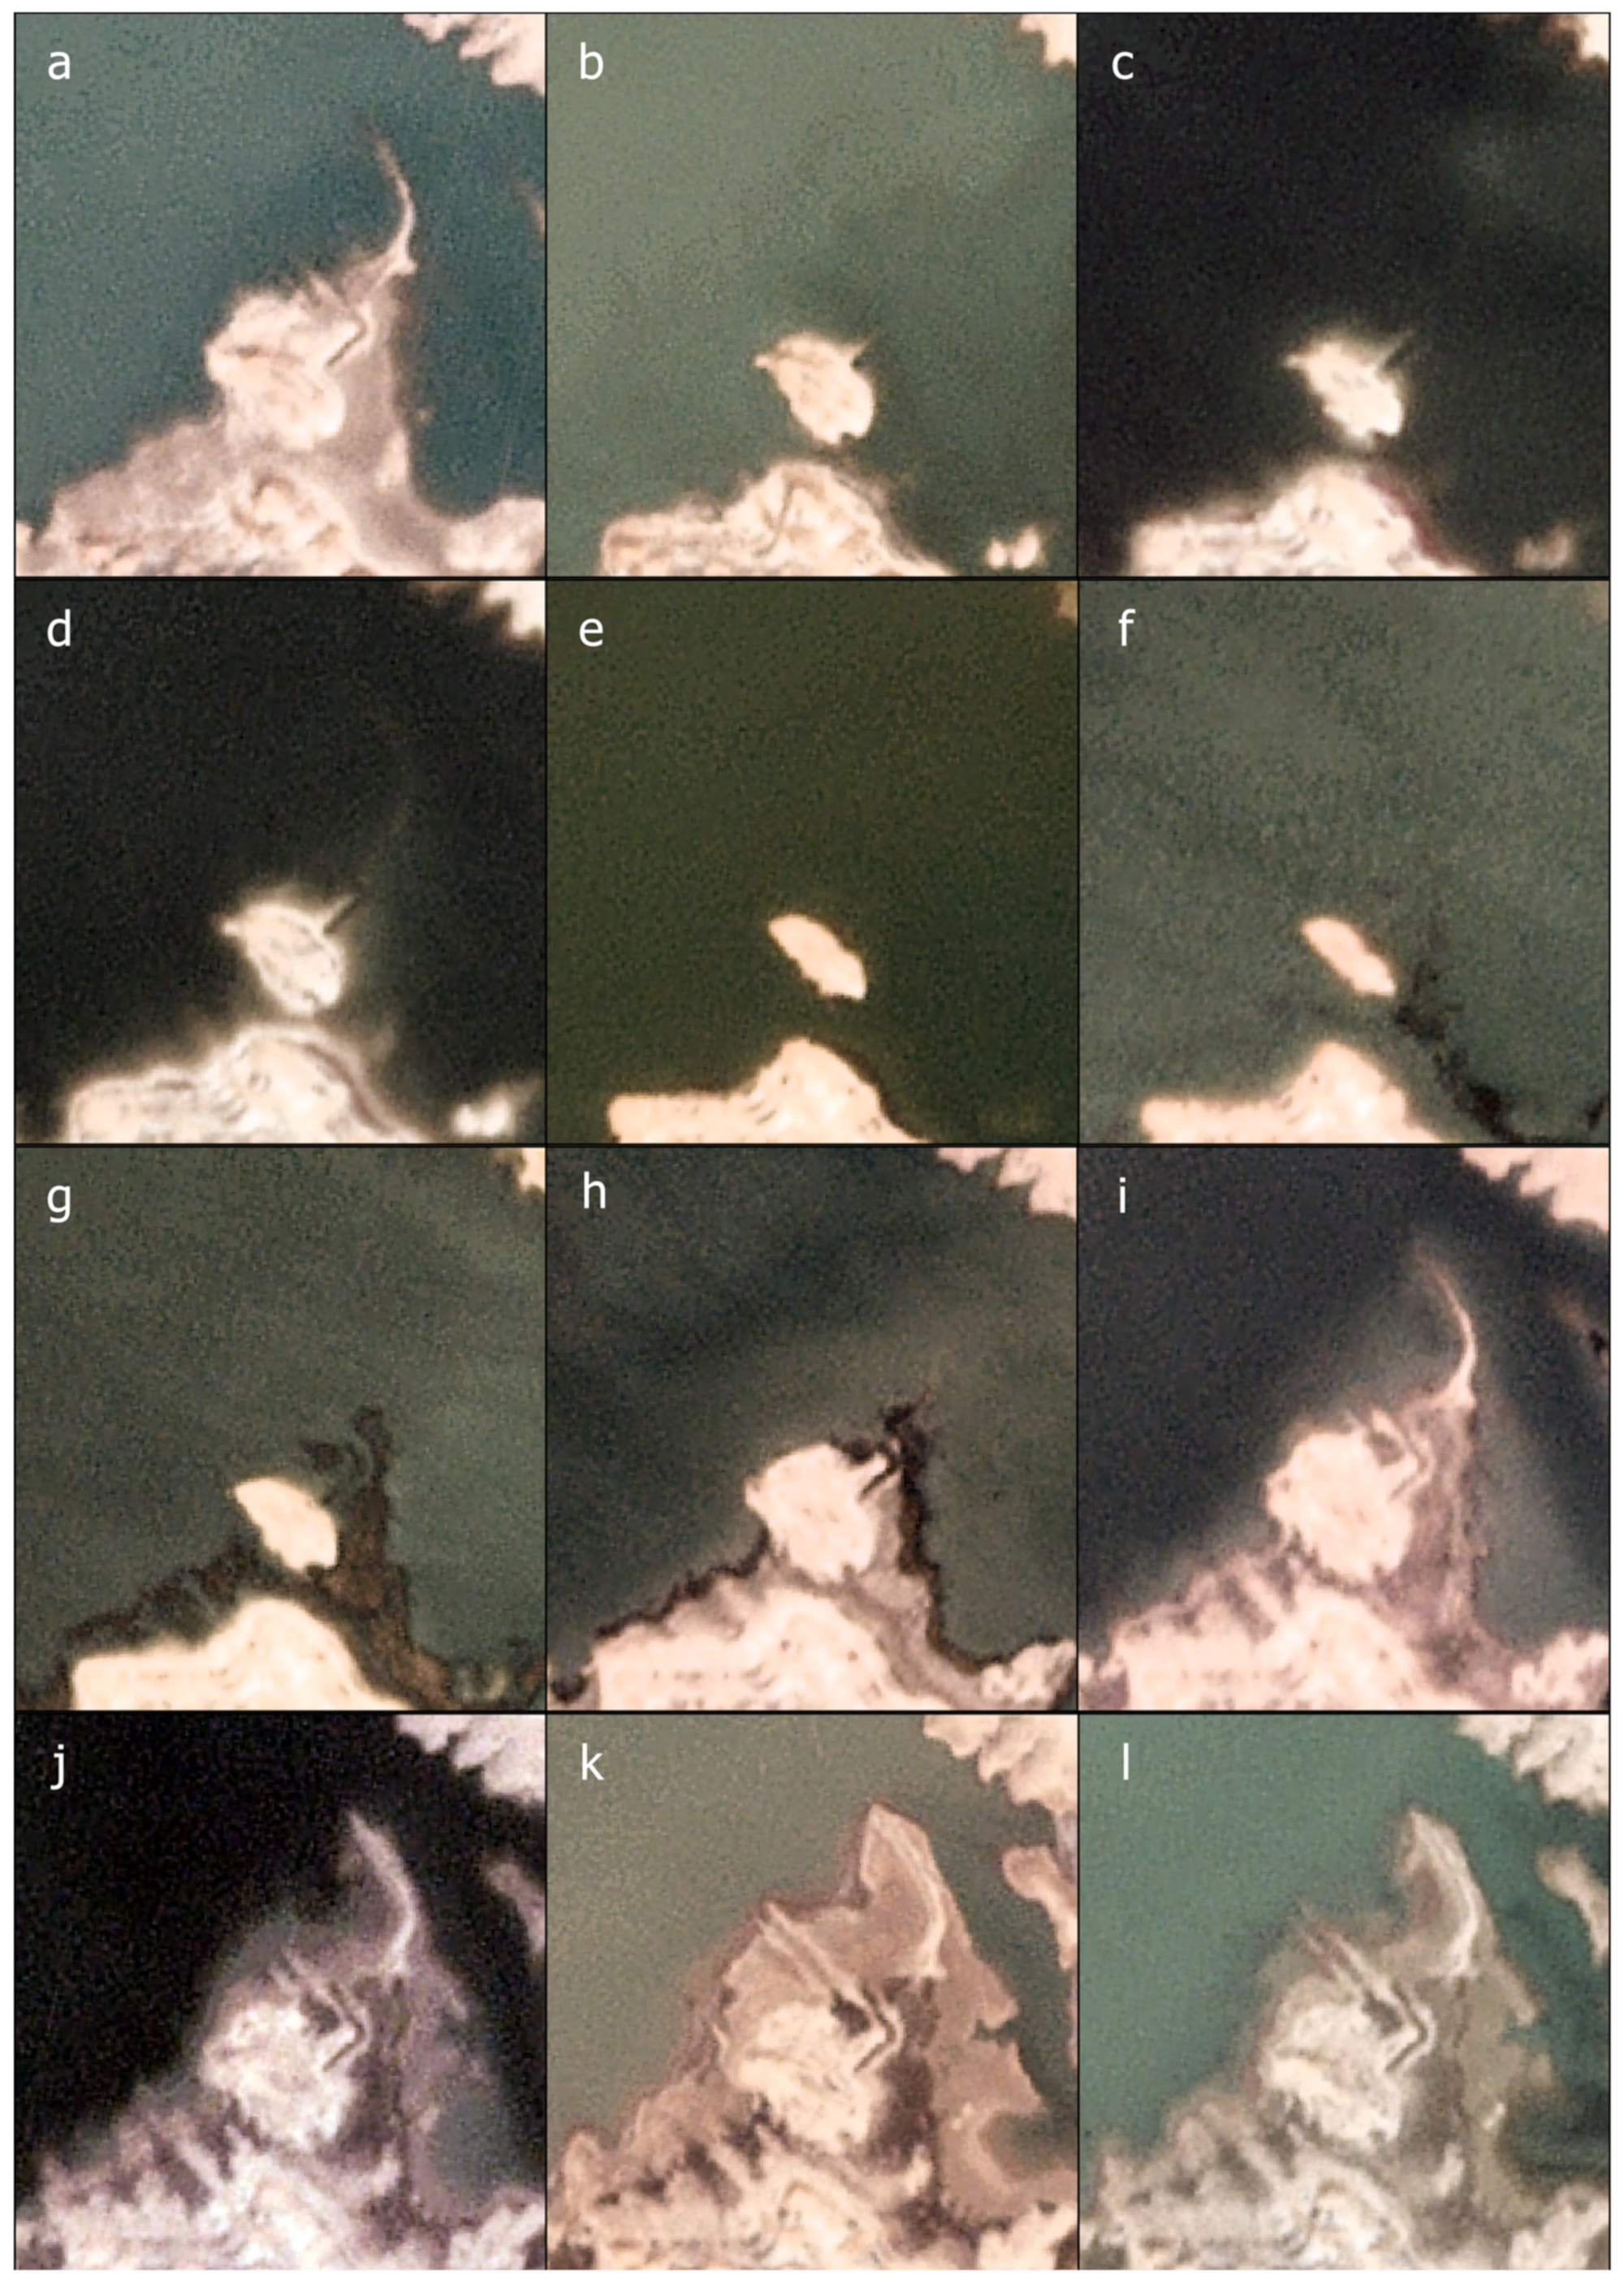
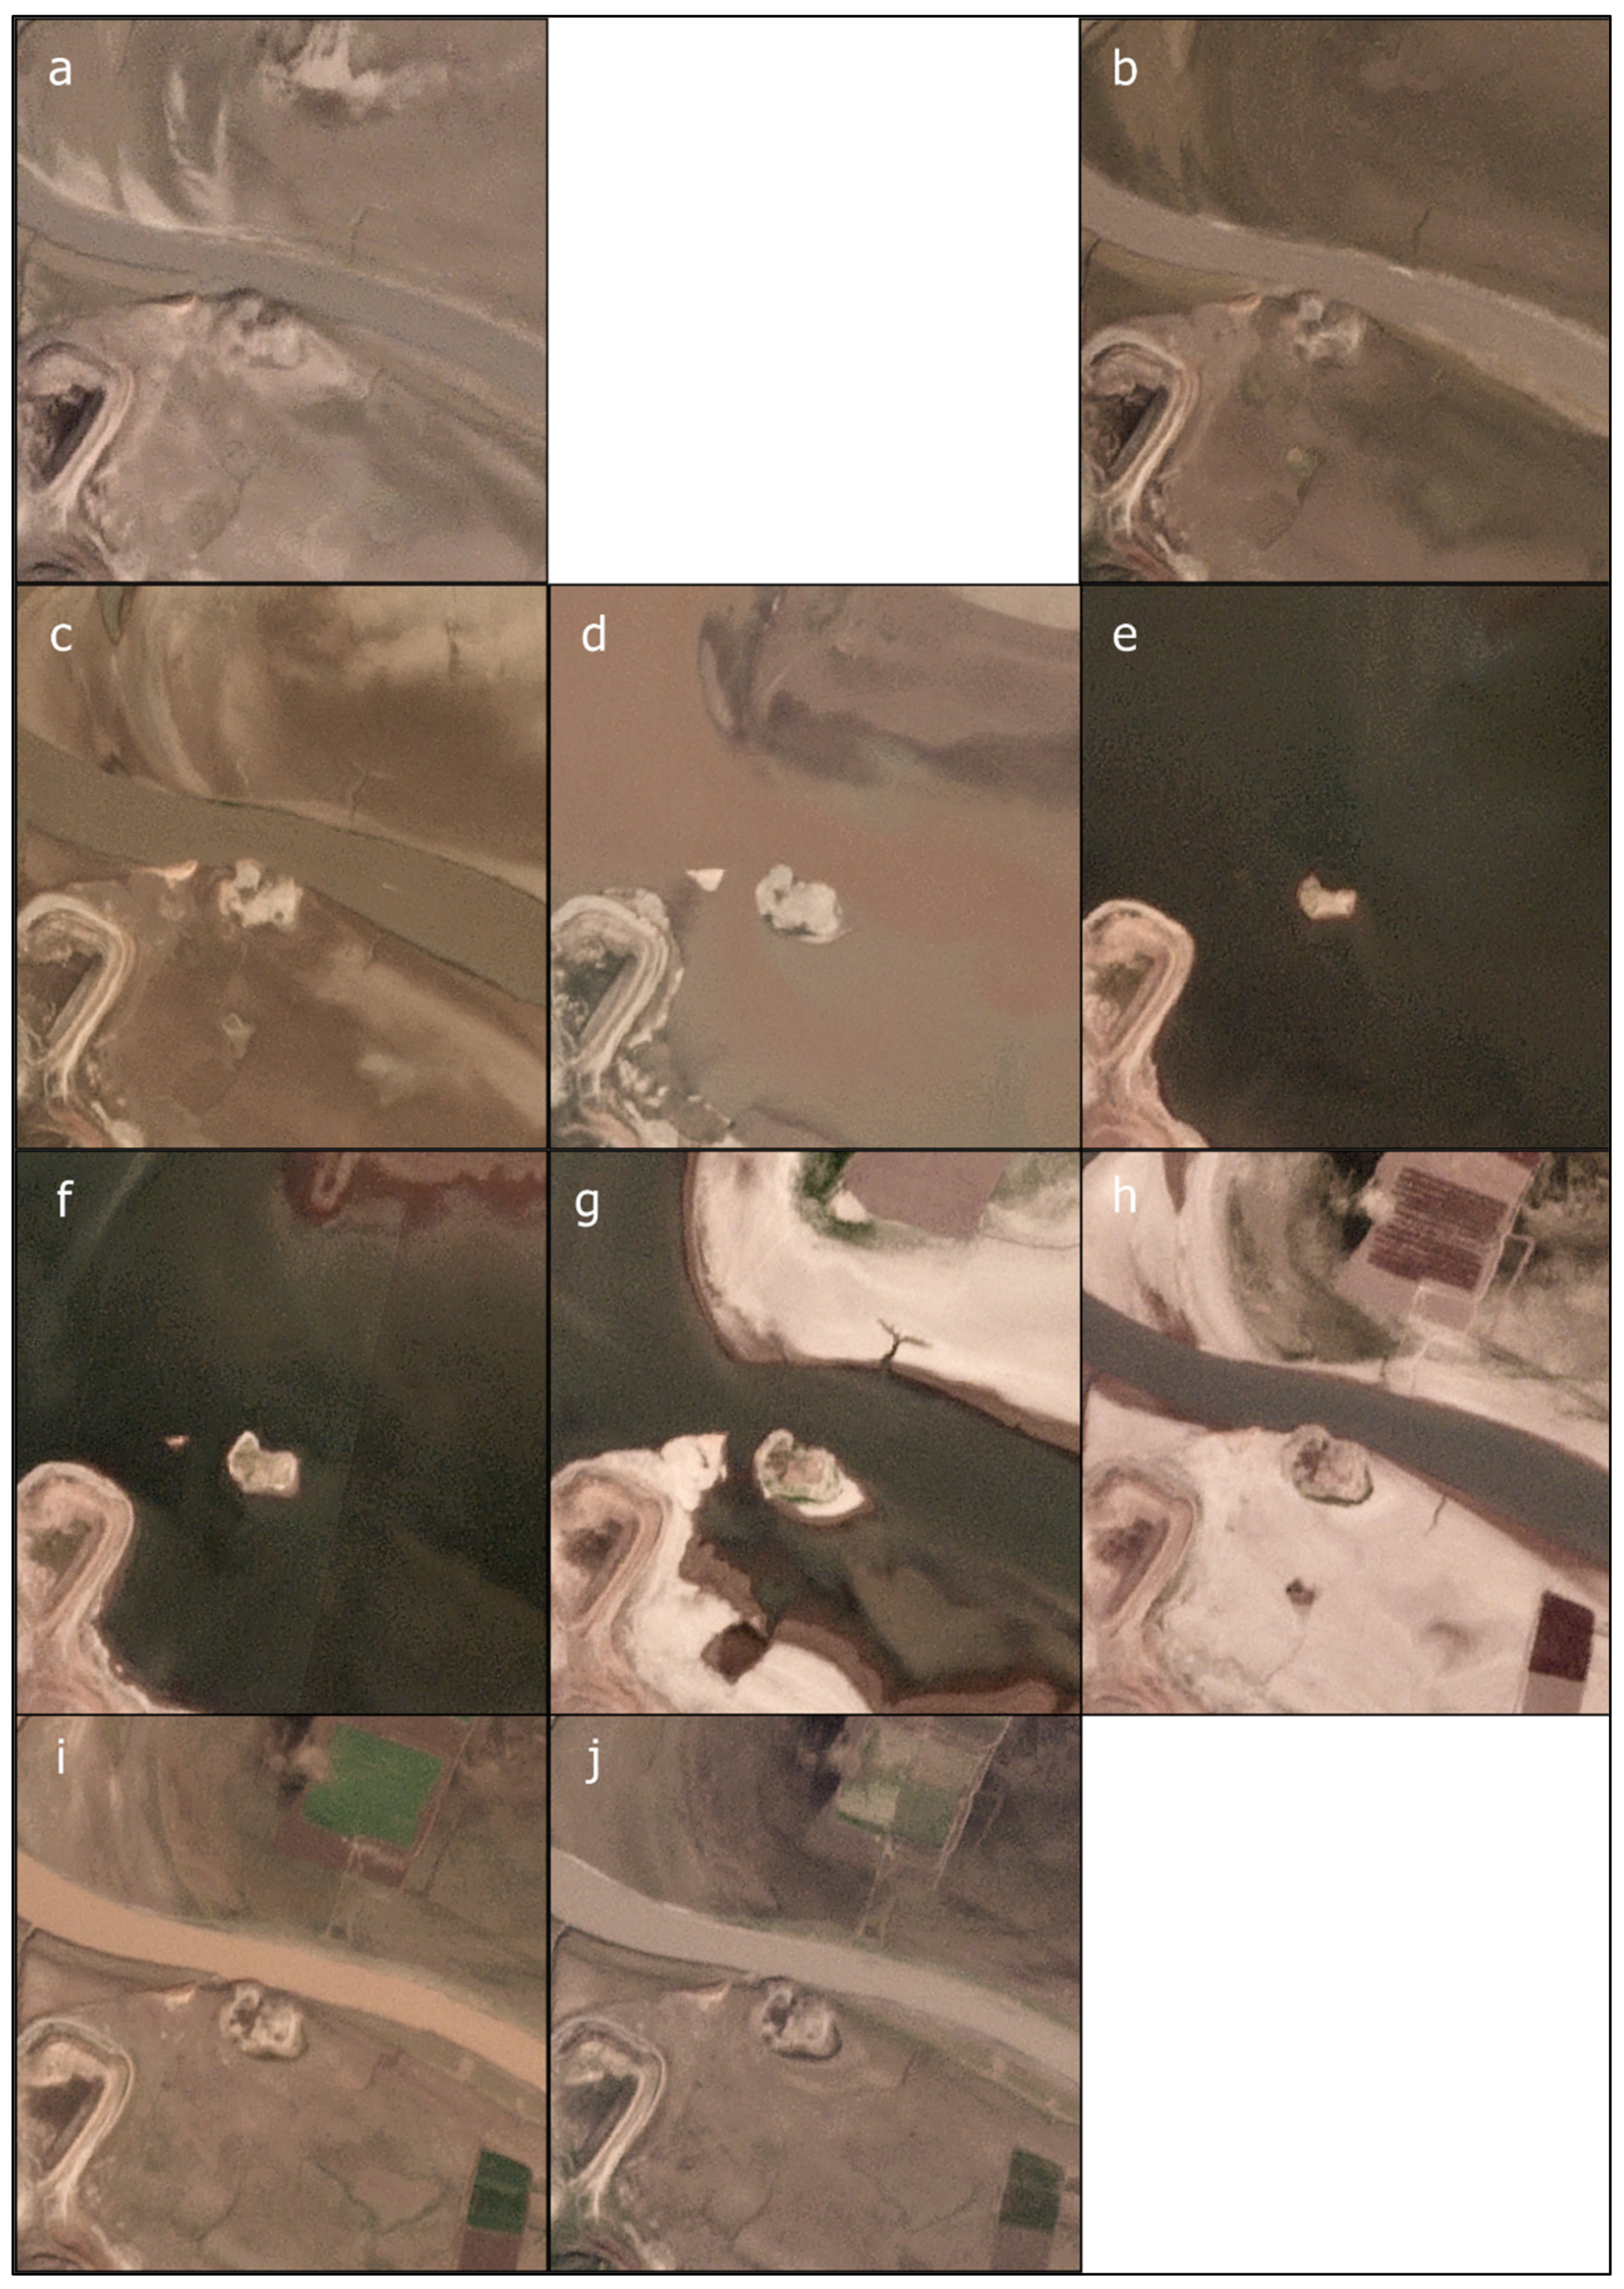
3.2. Mosul Dam
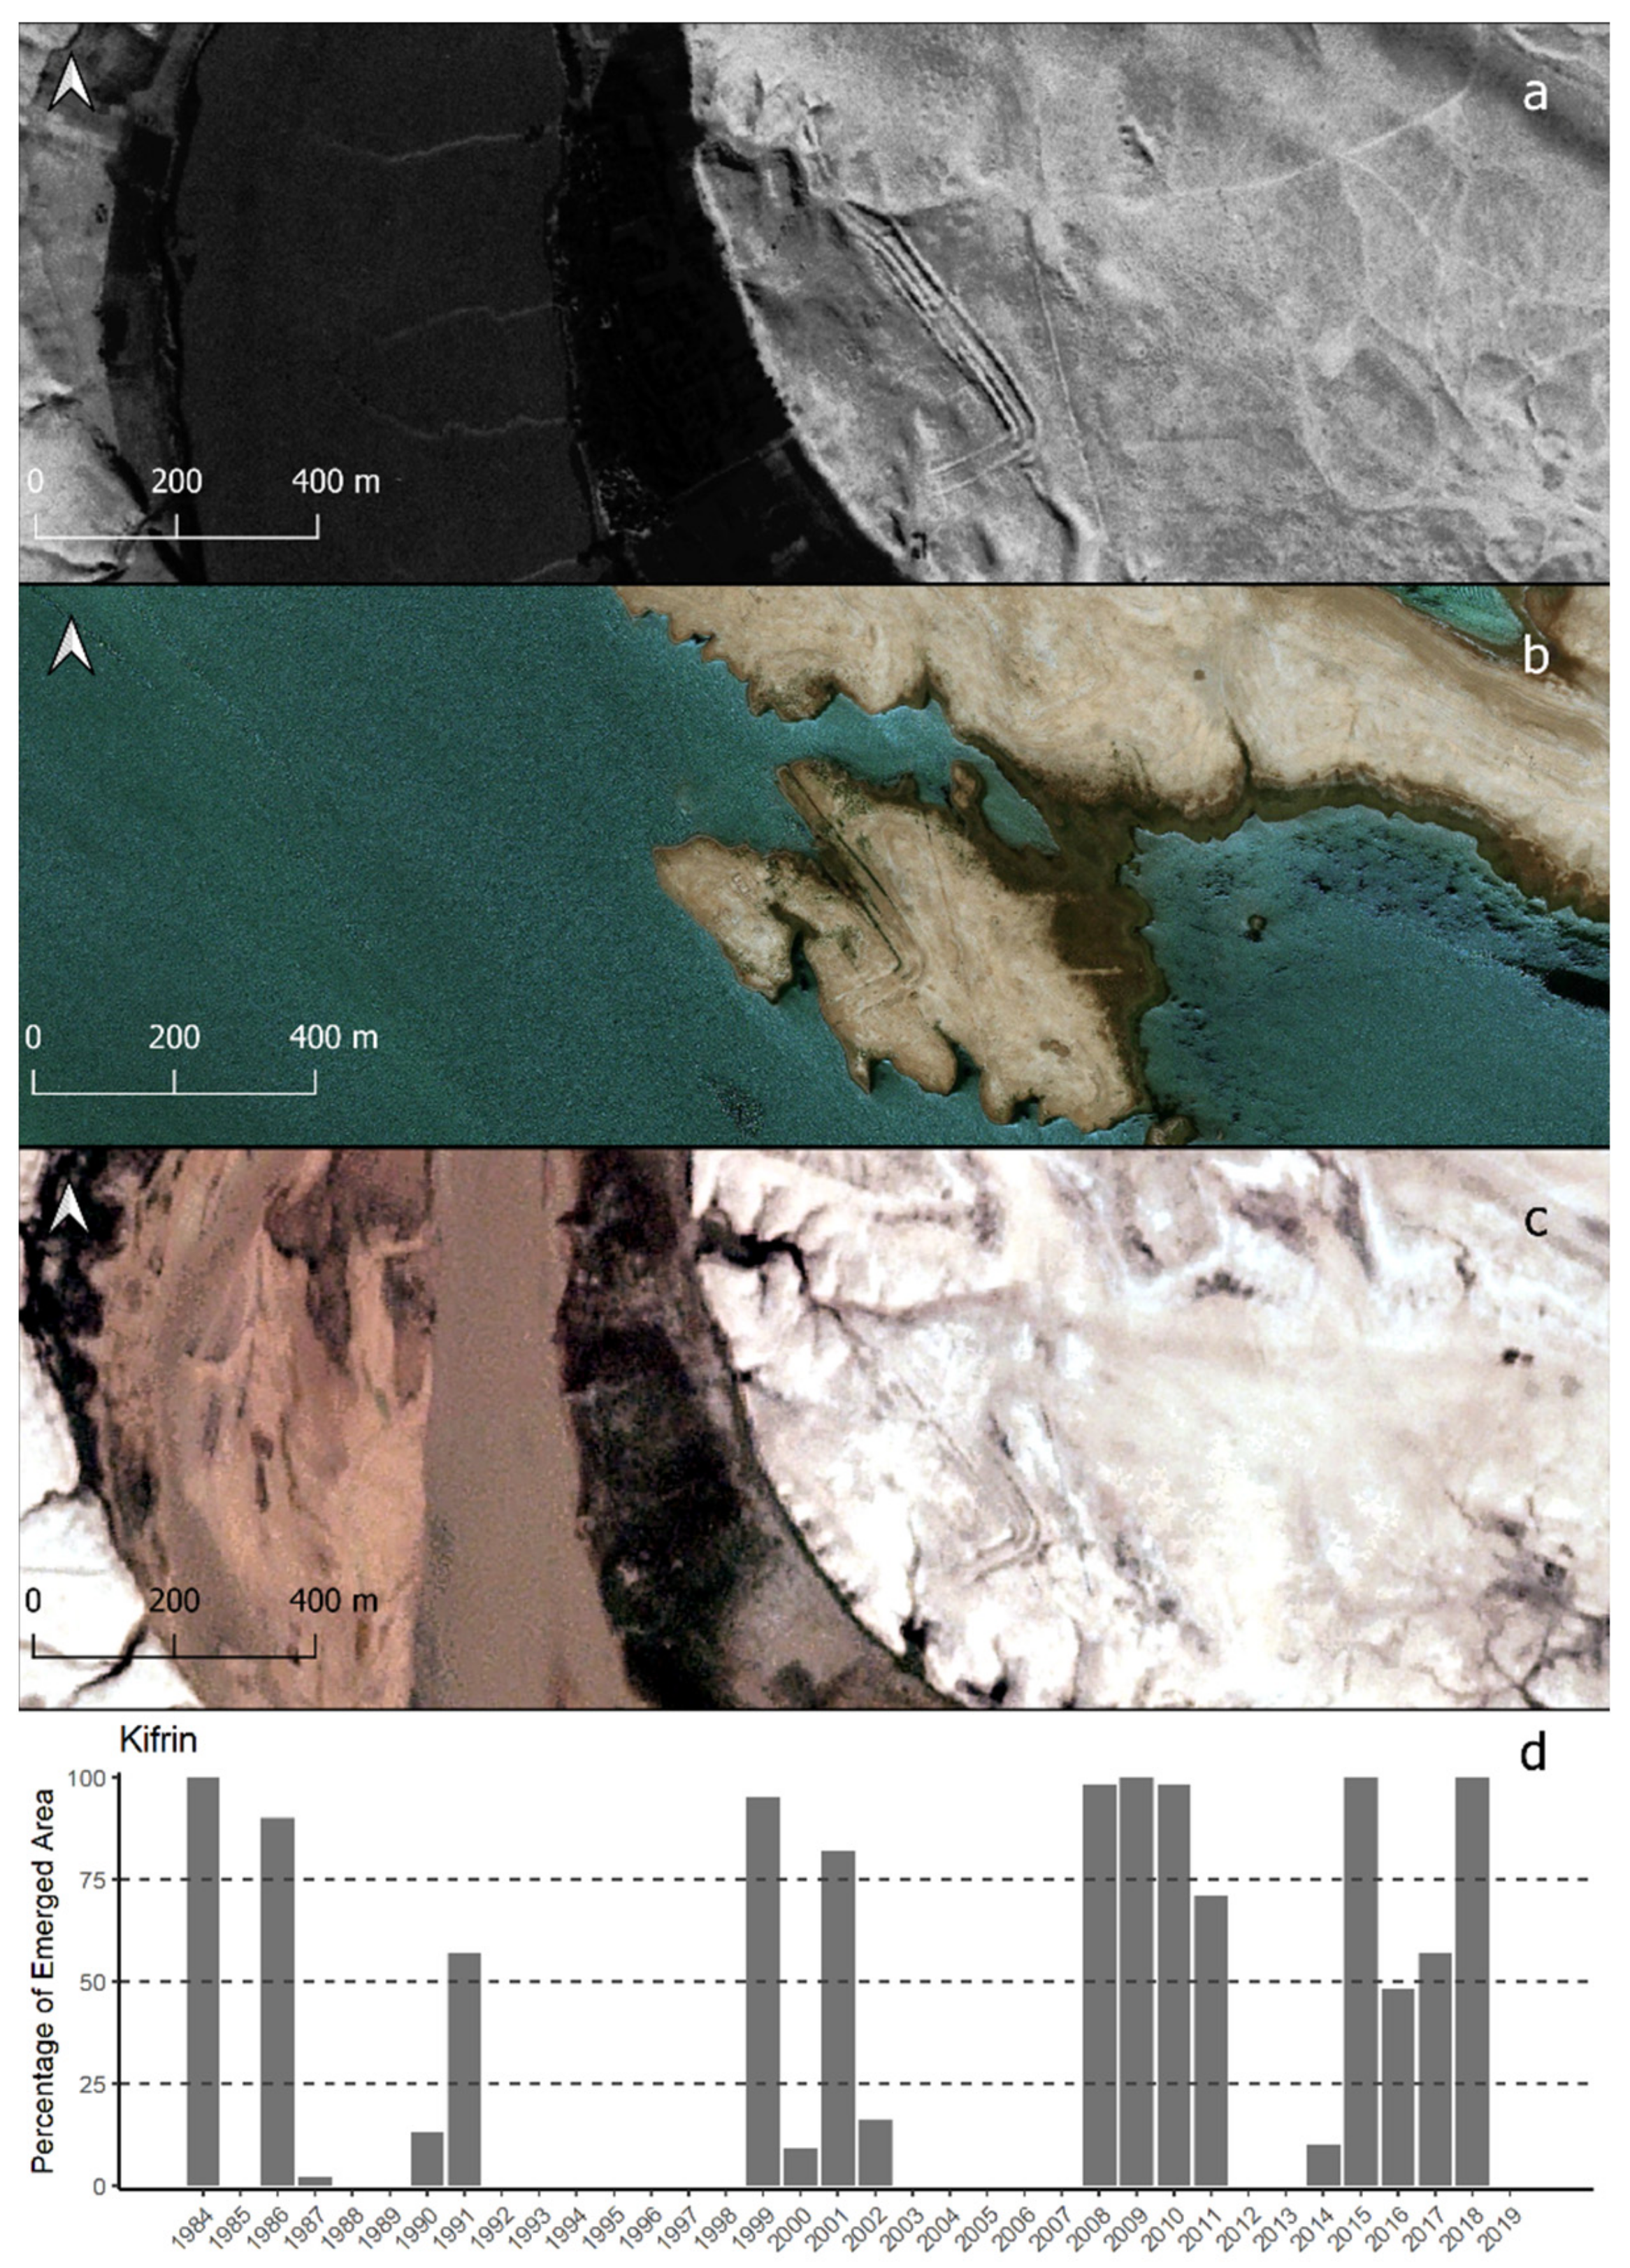
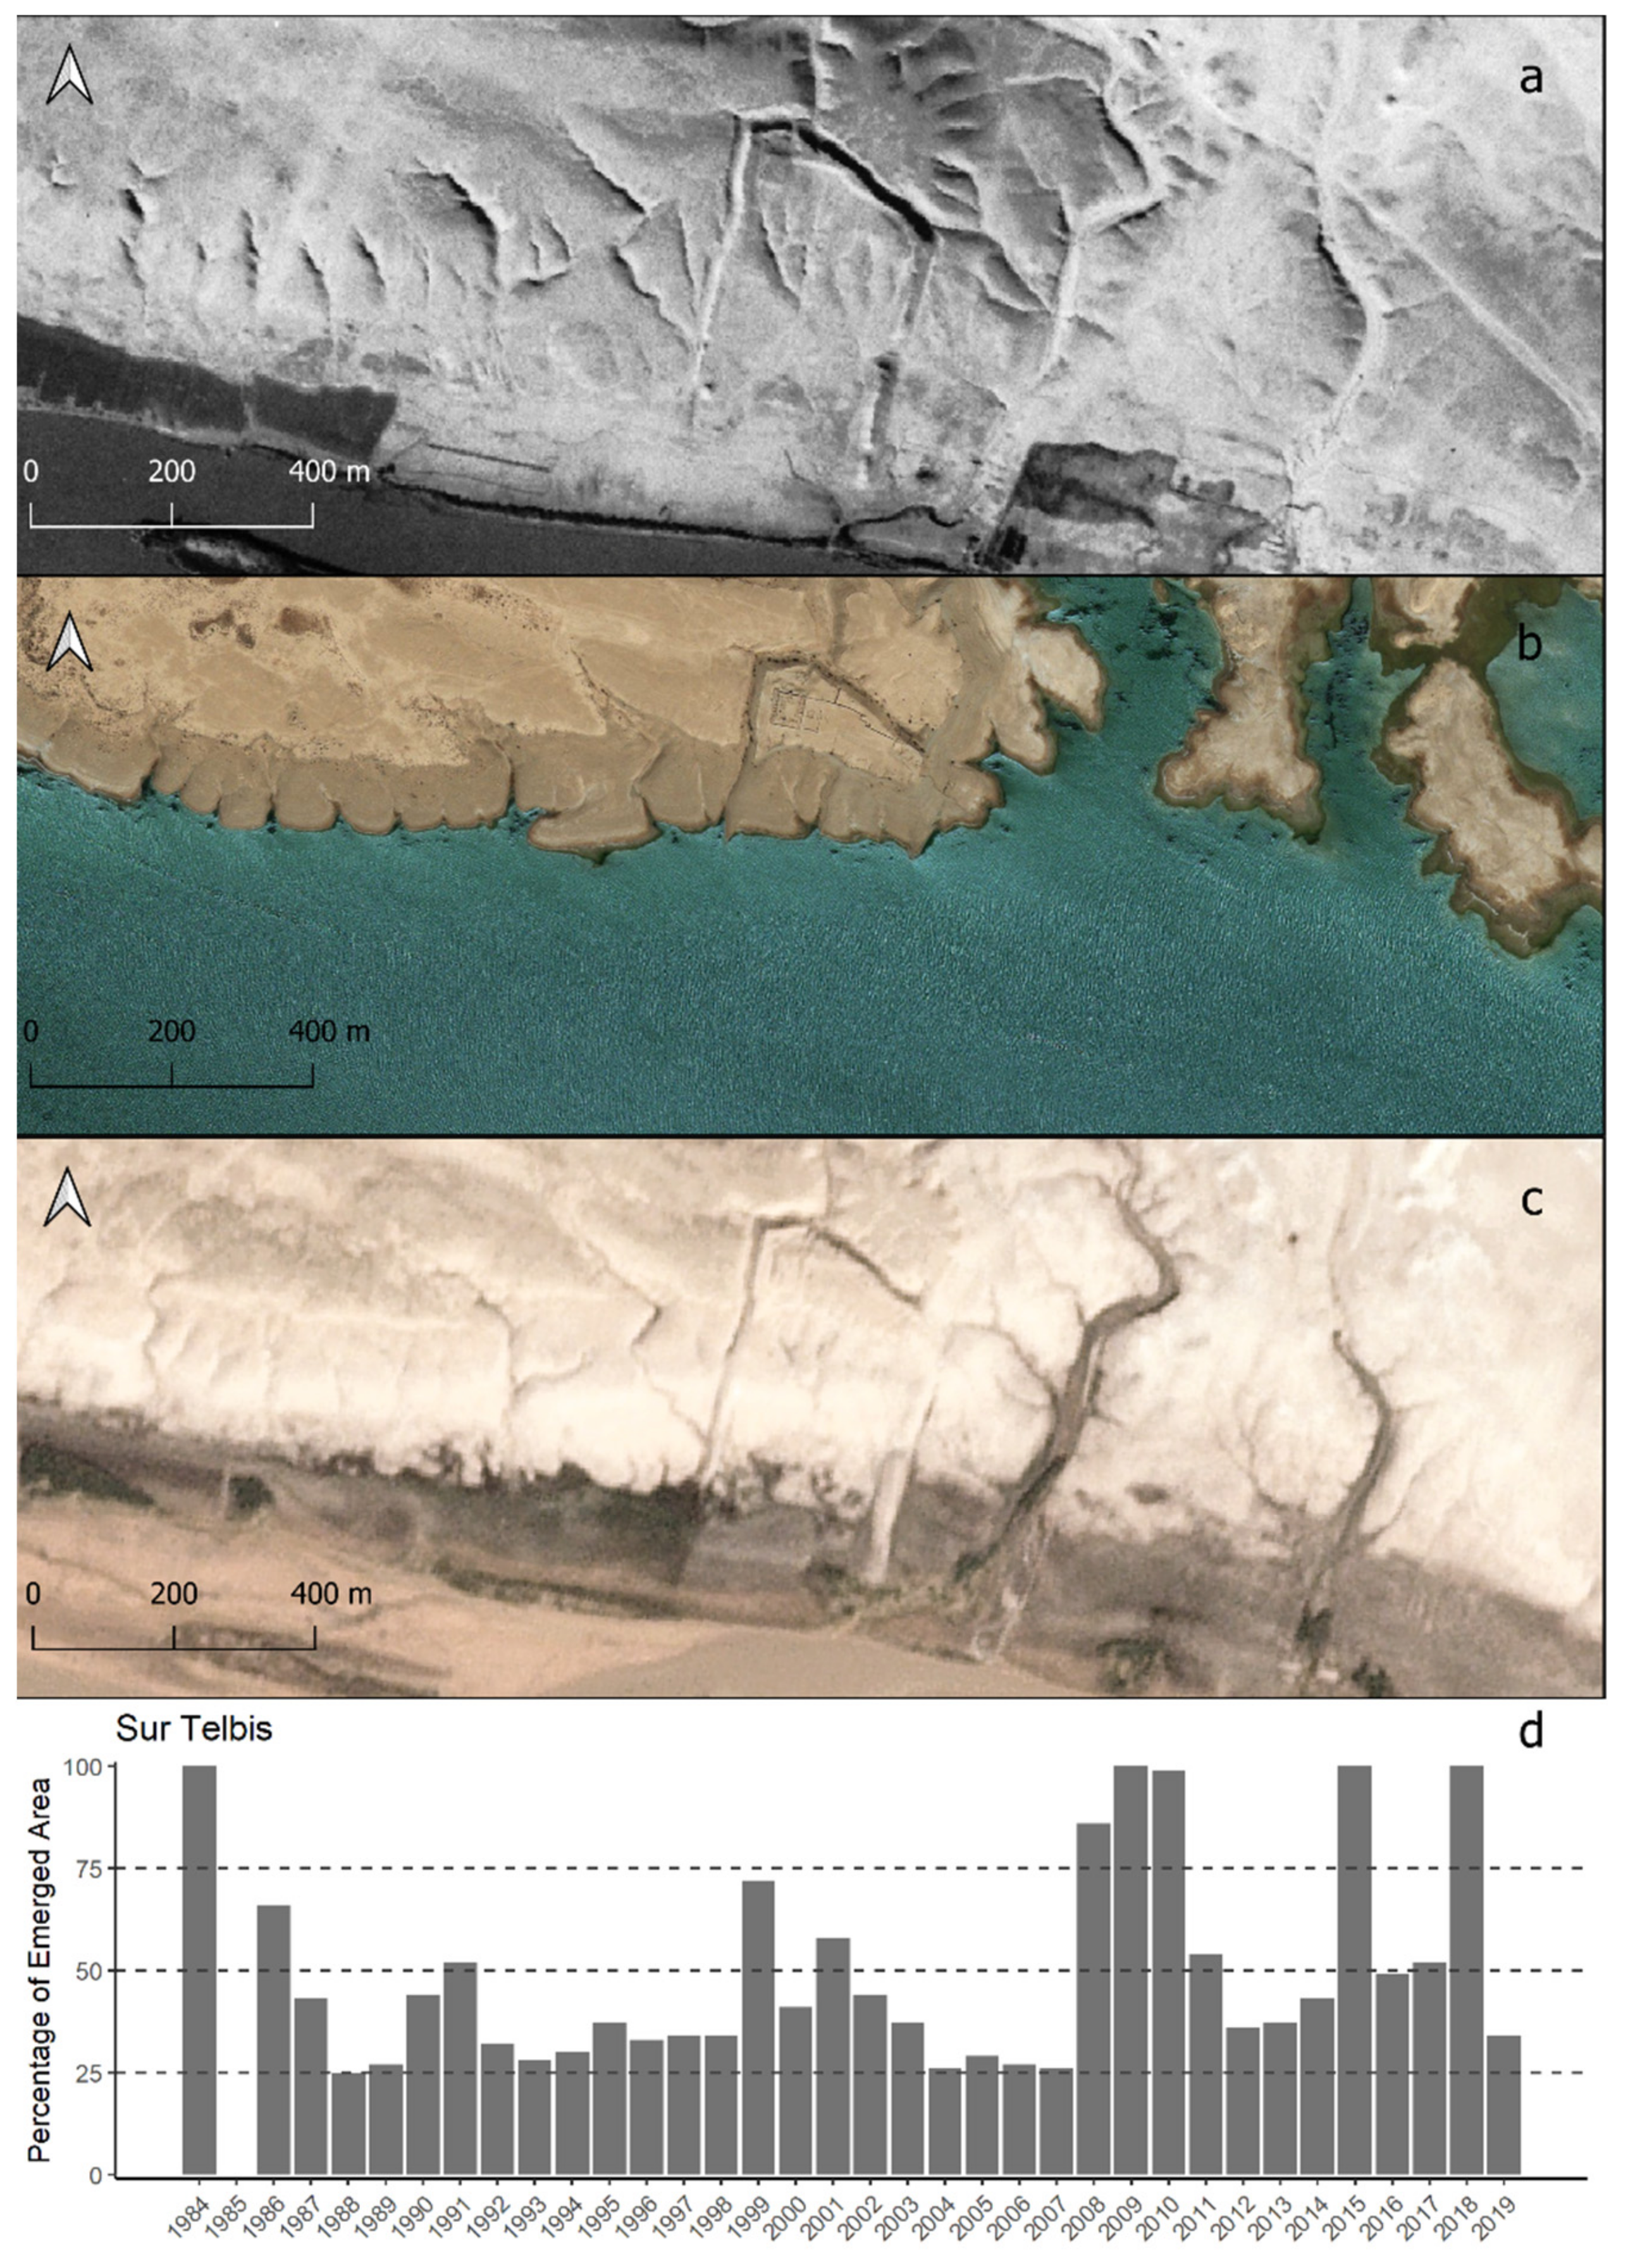
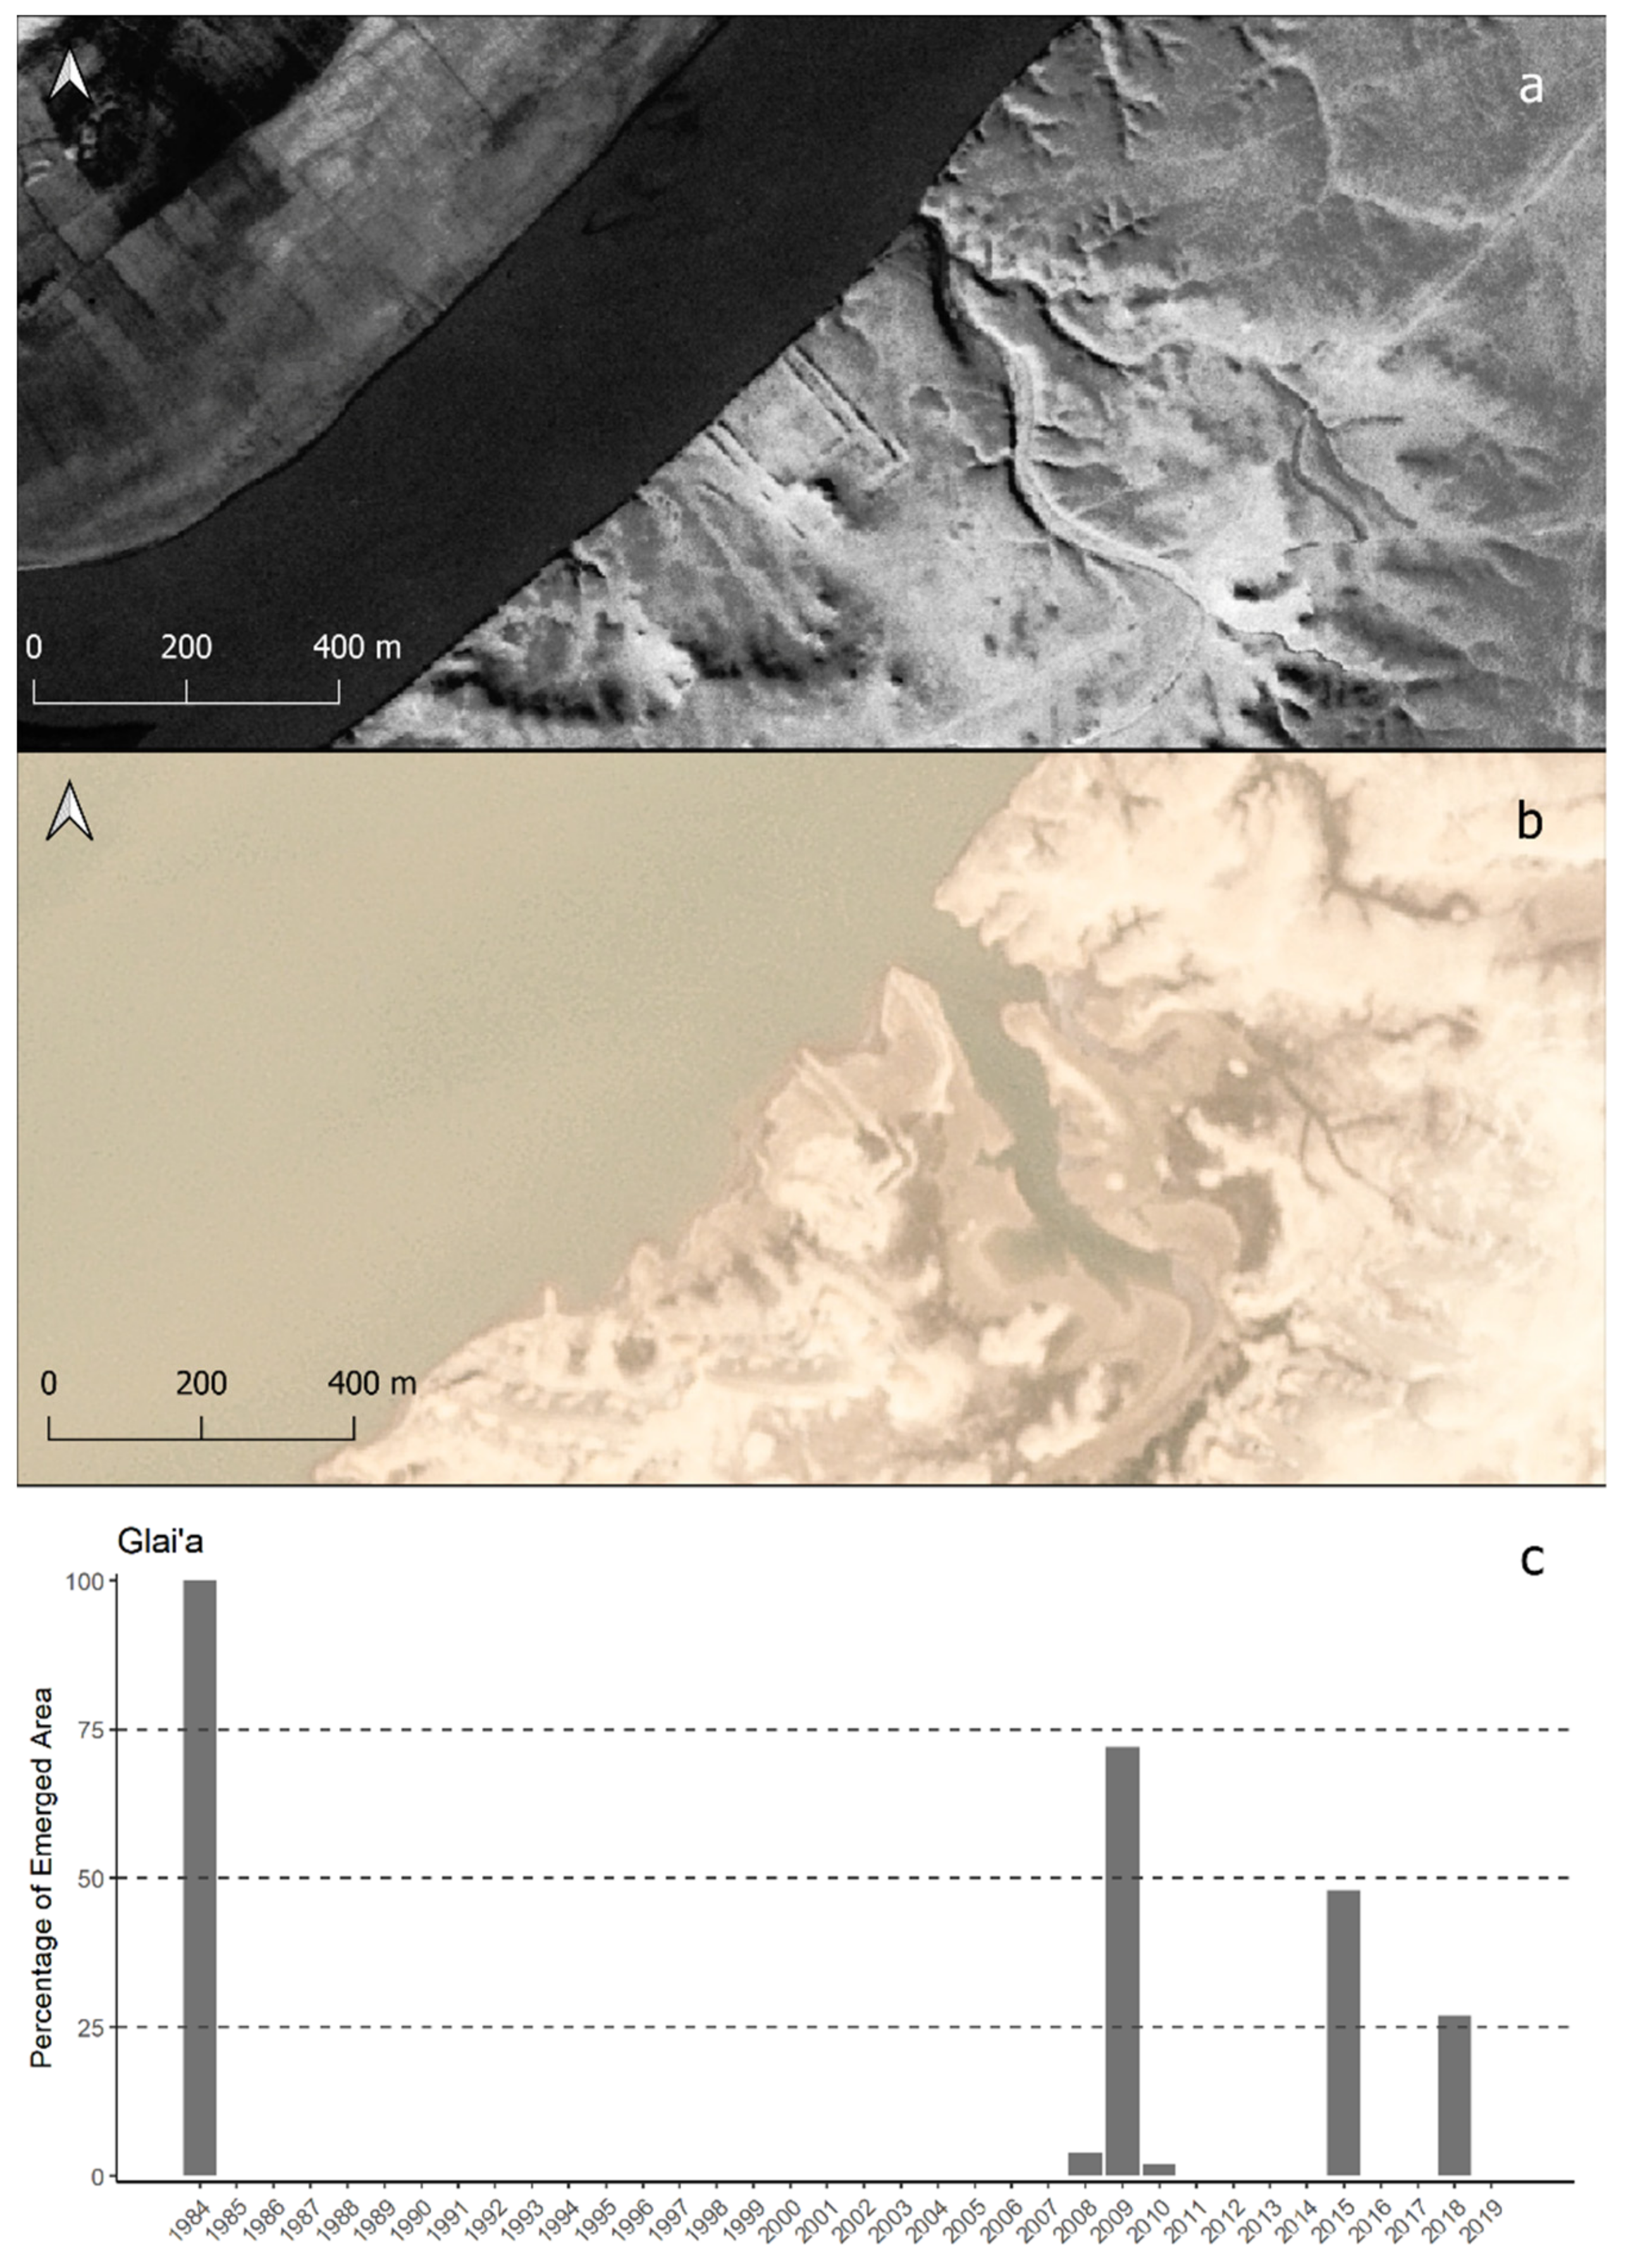
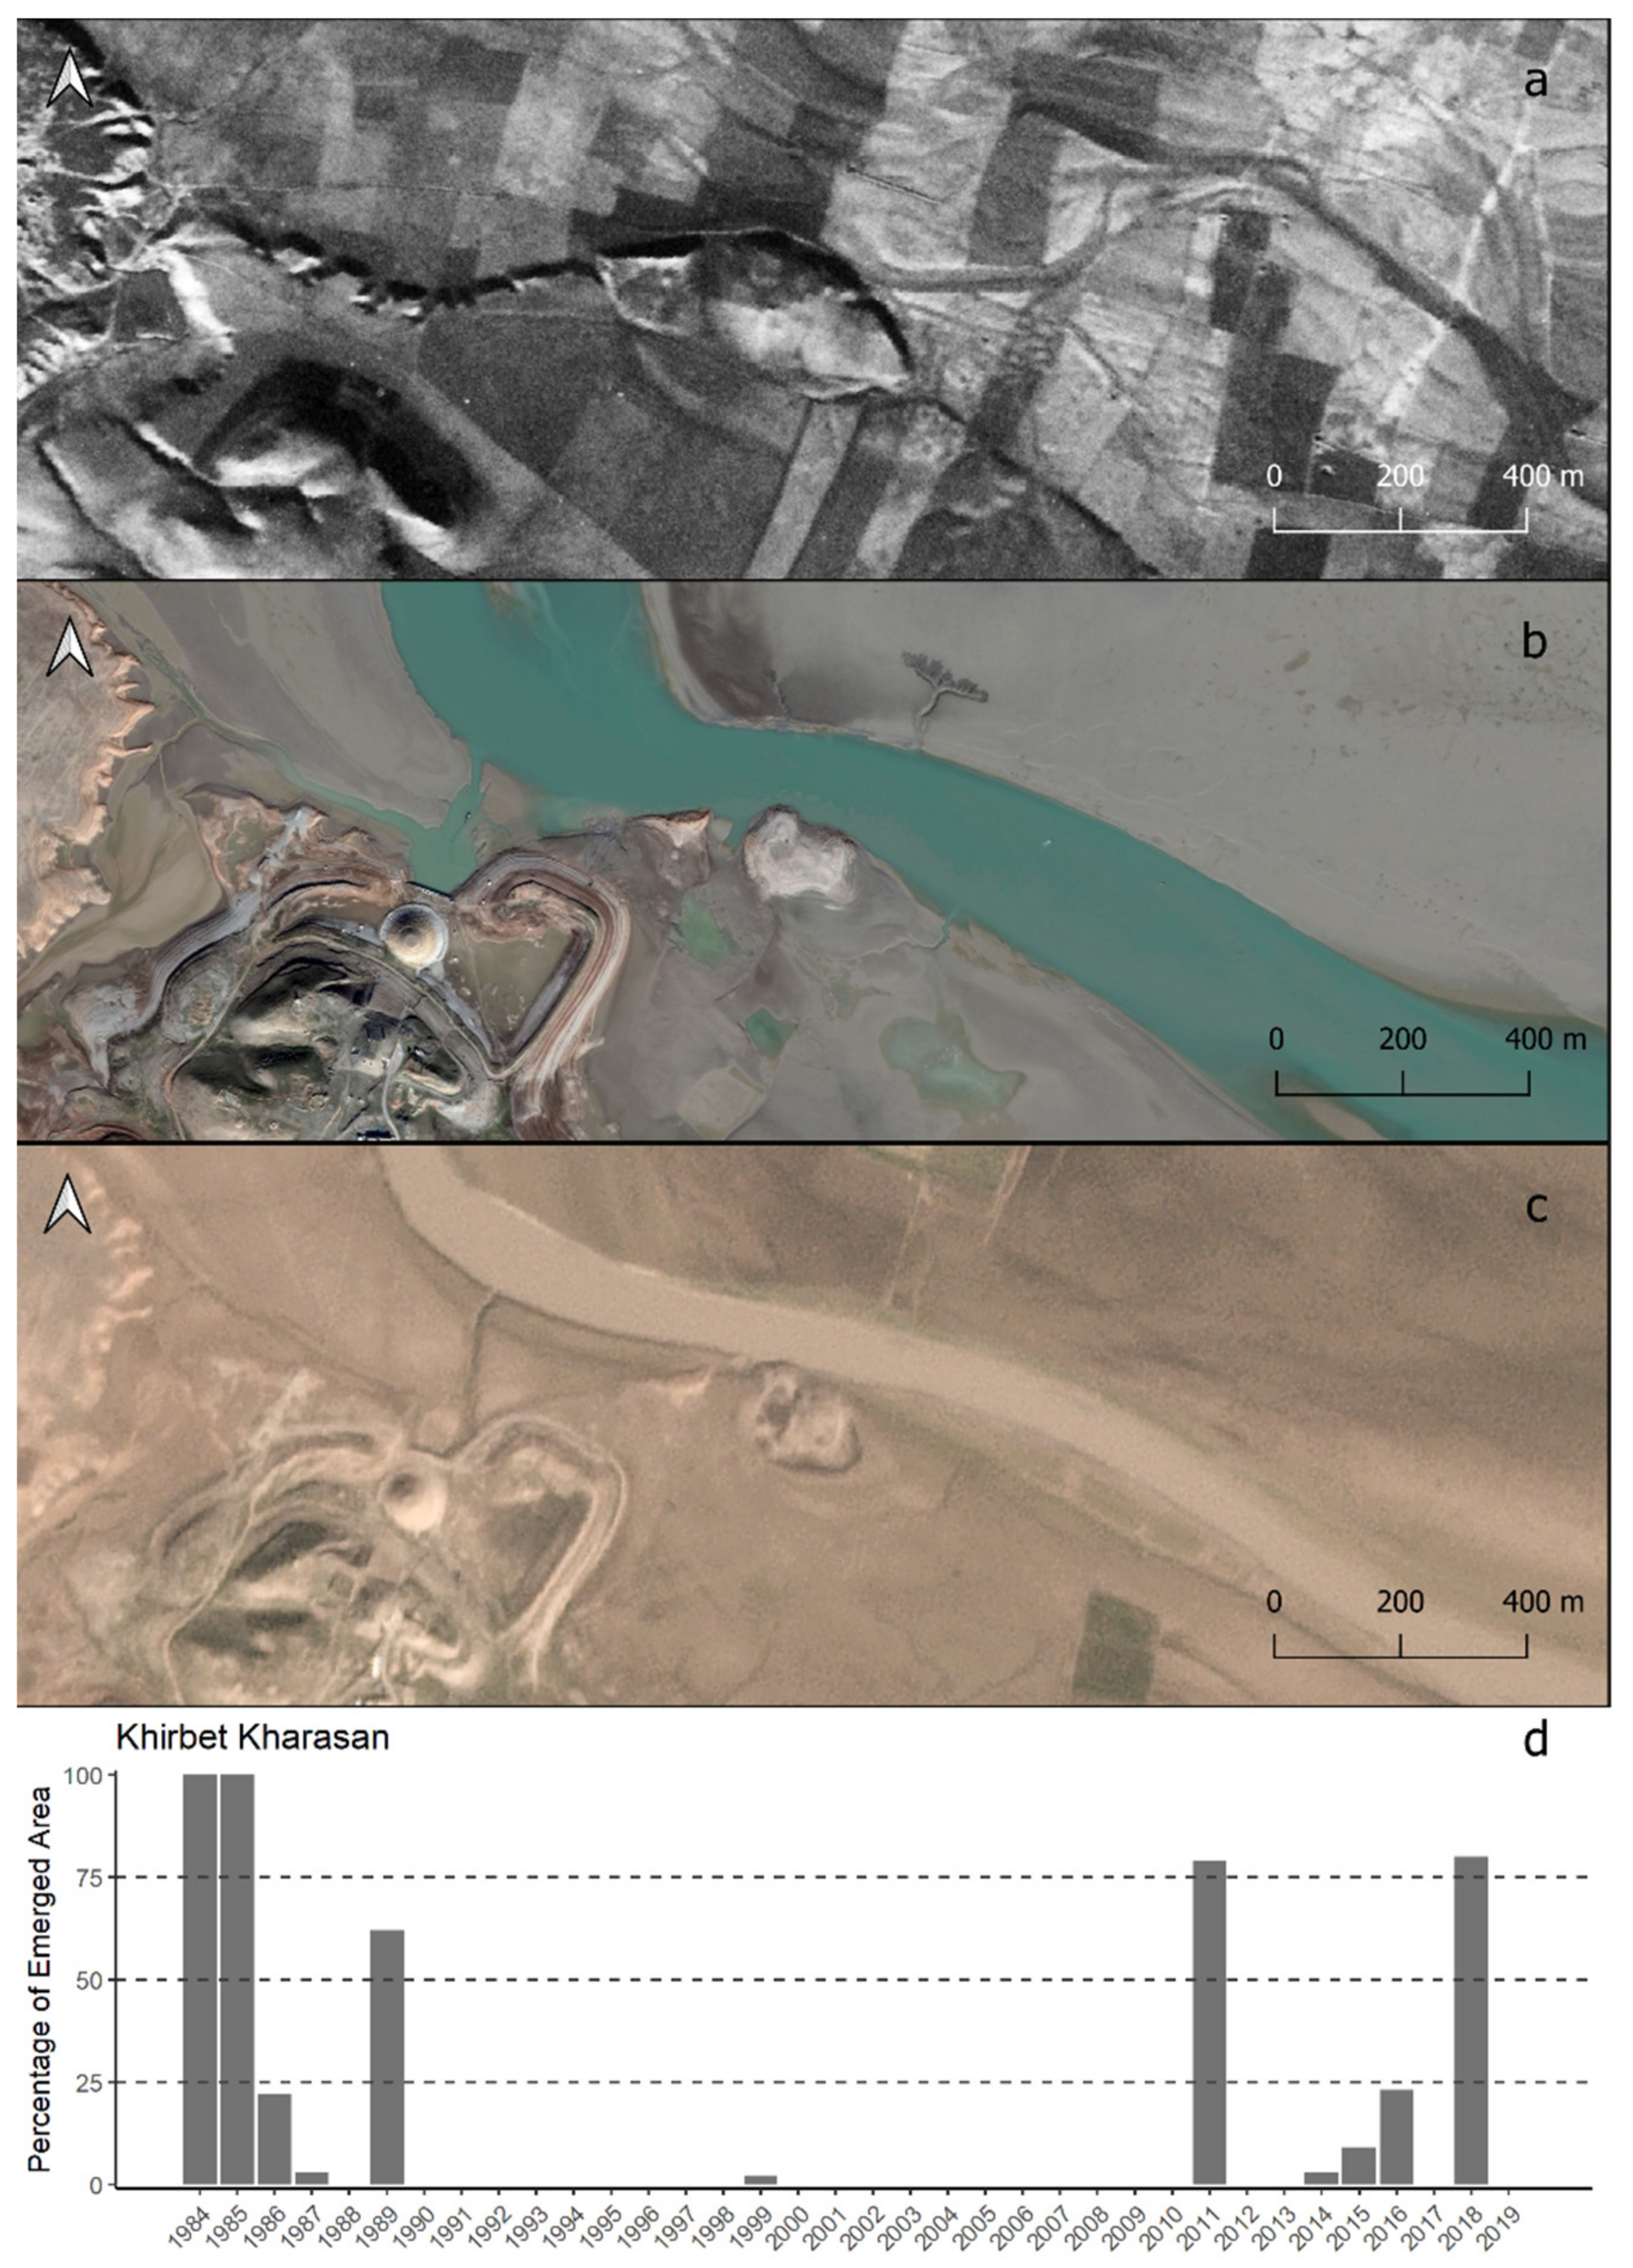
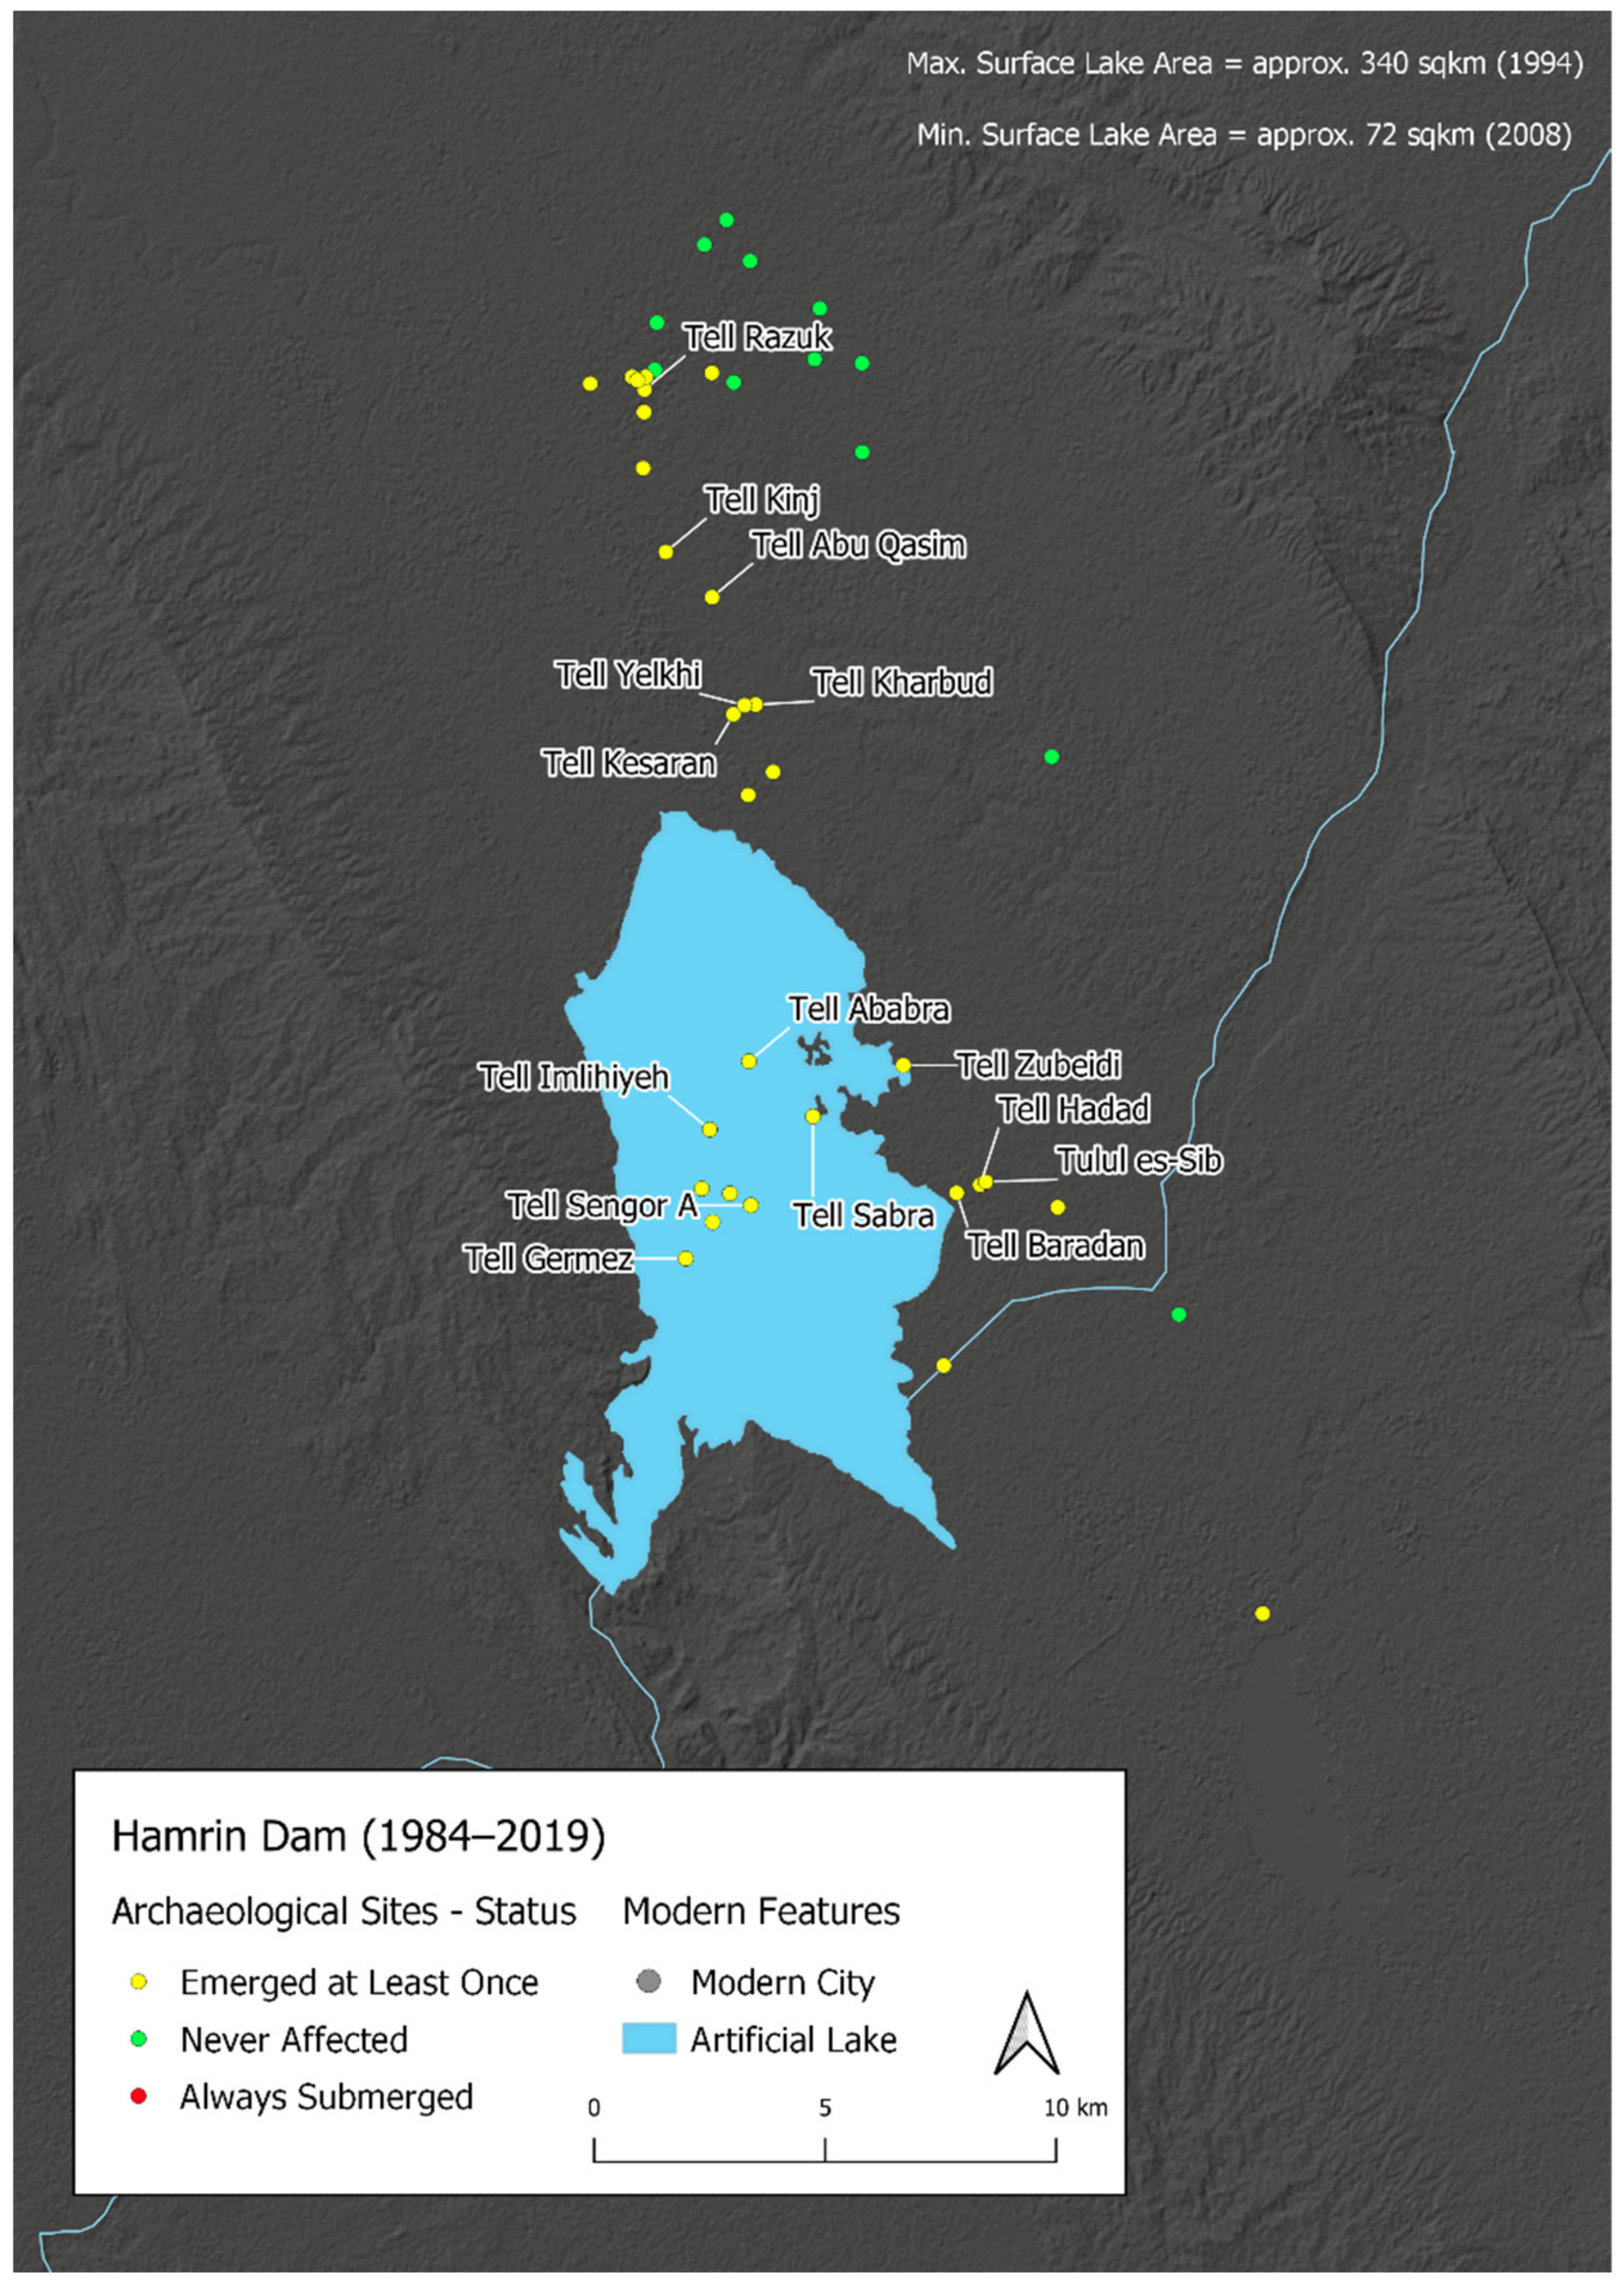
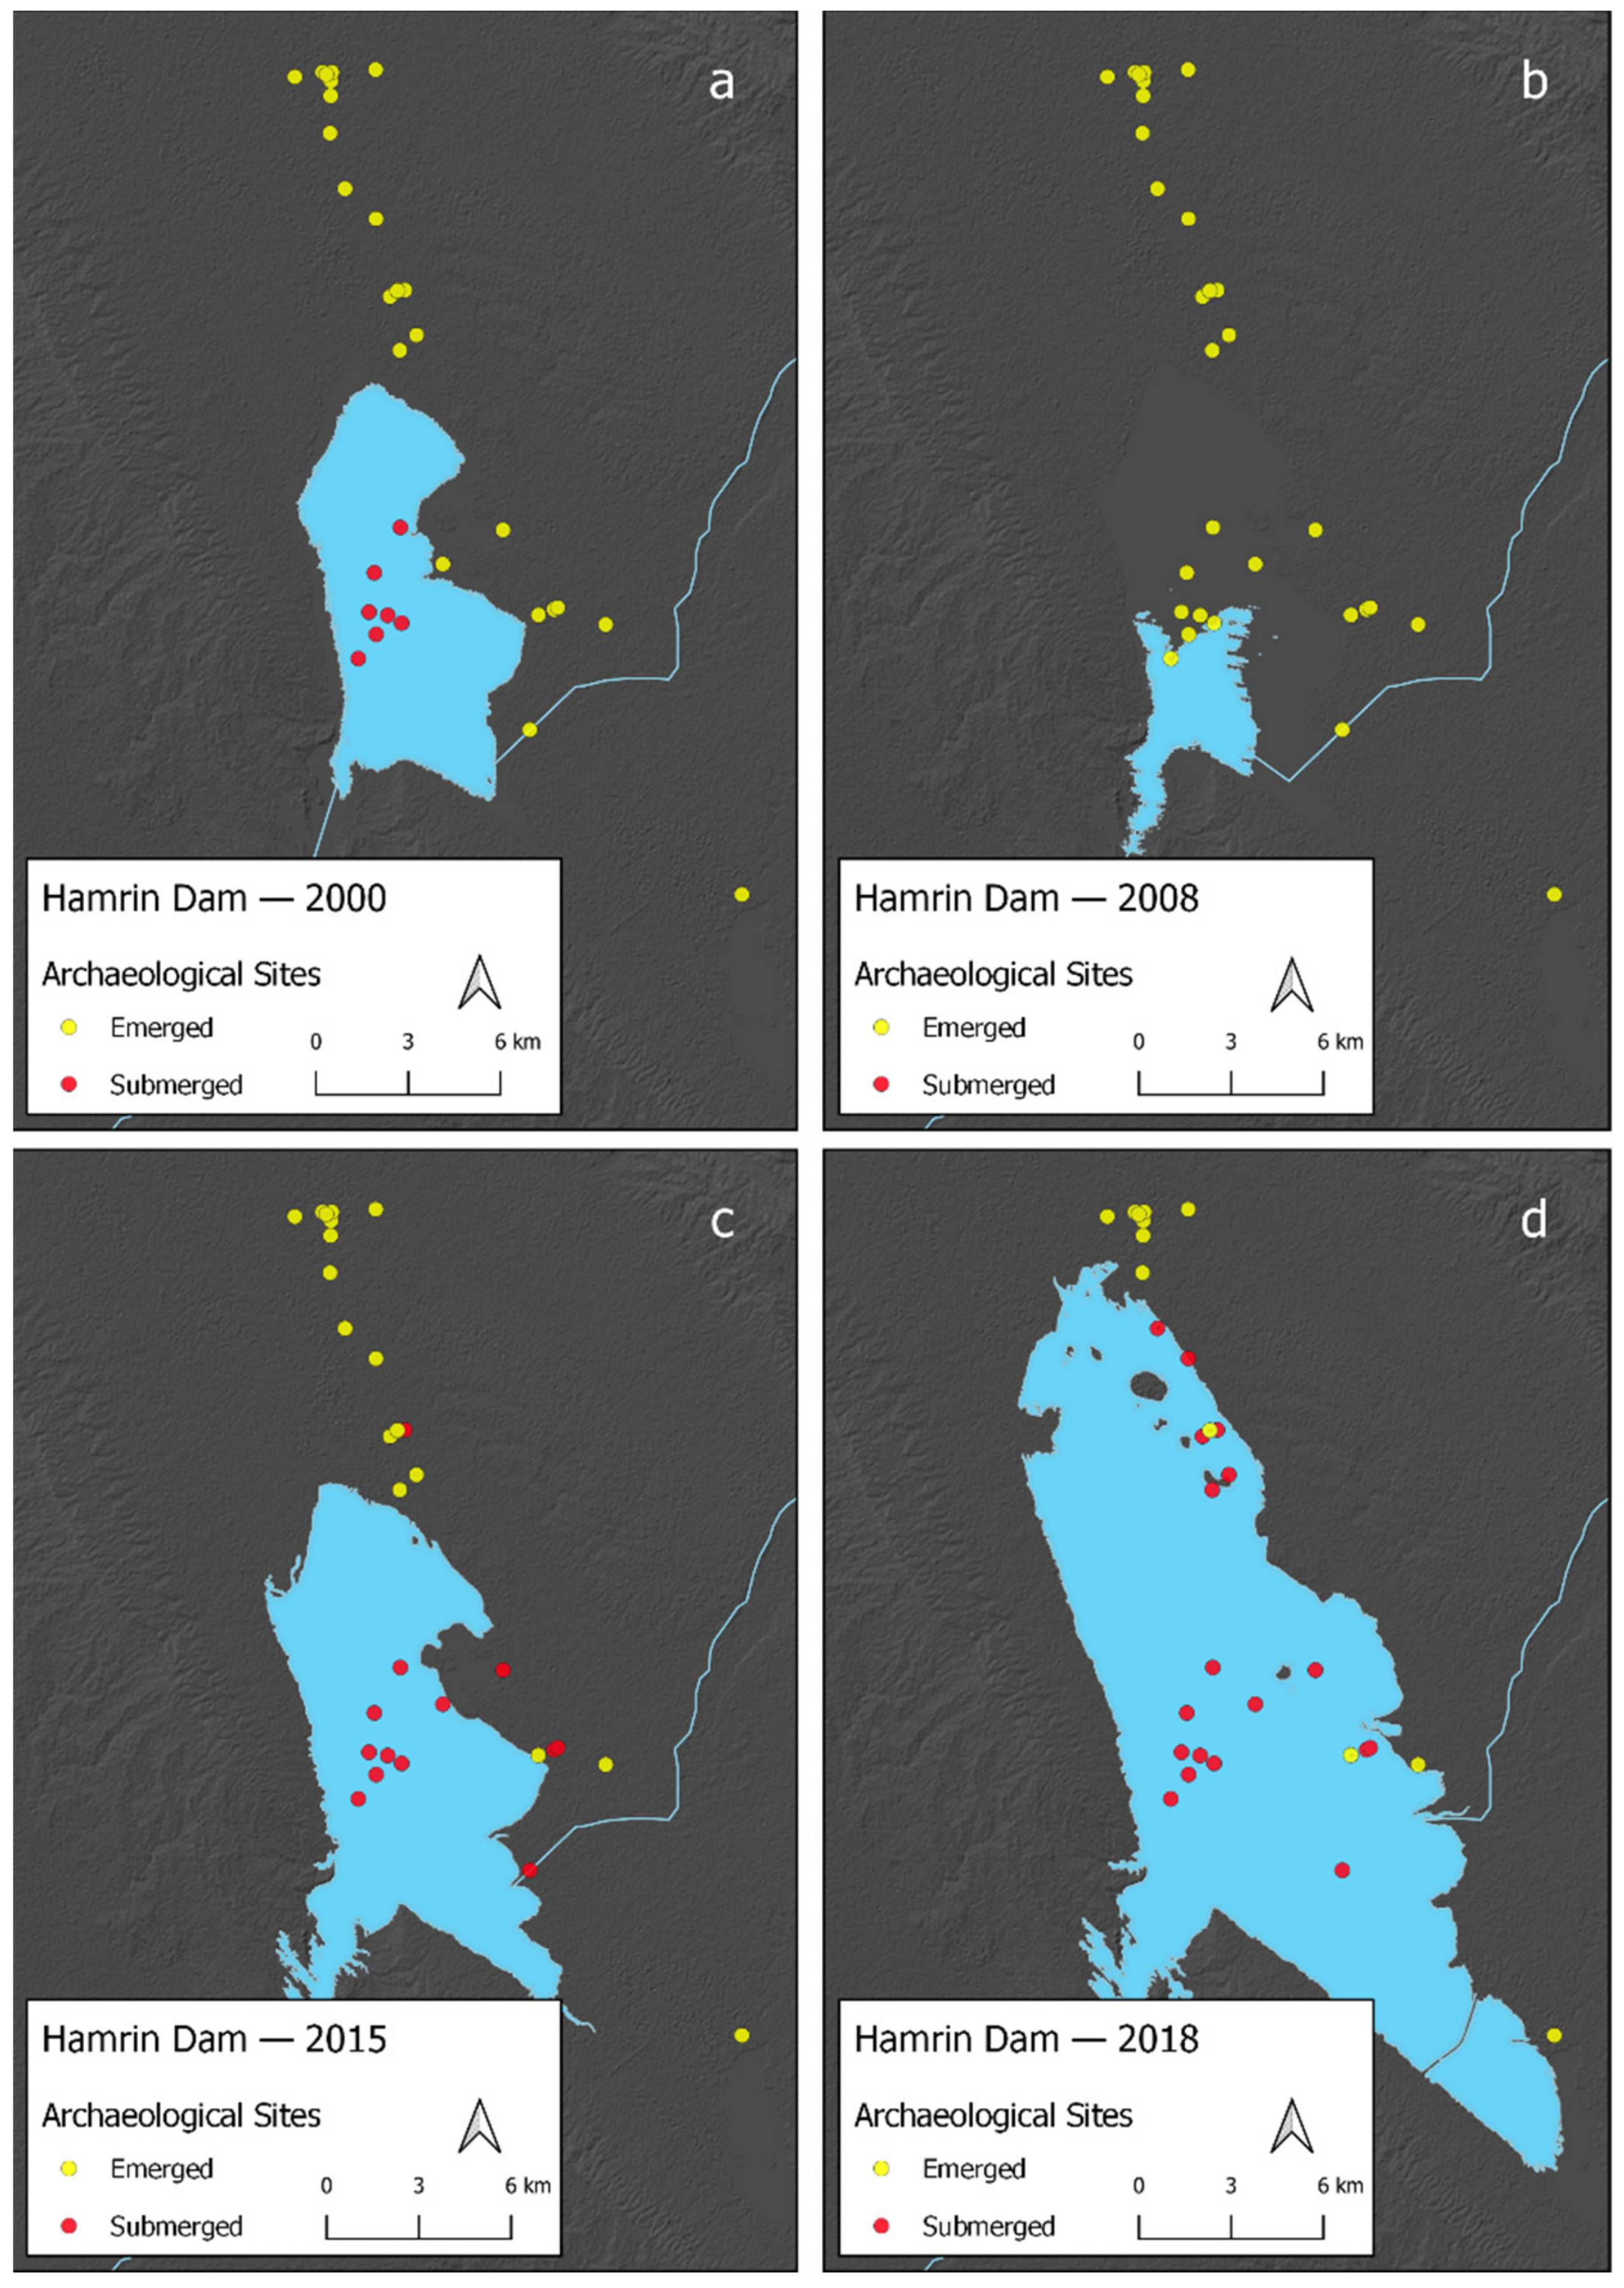
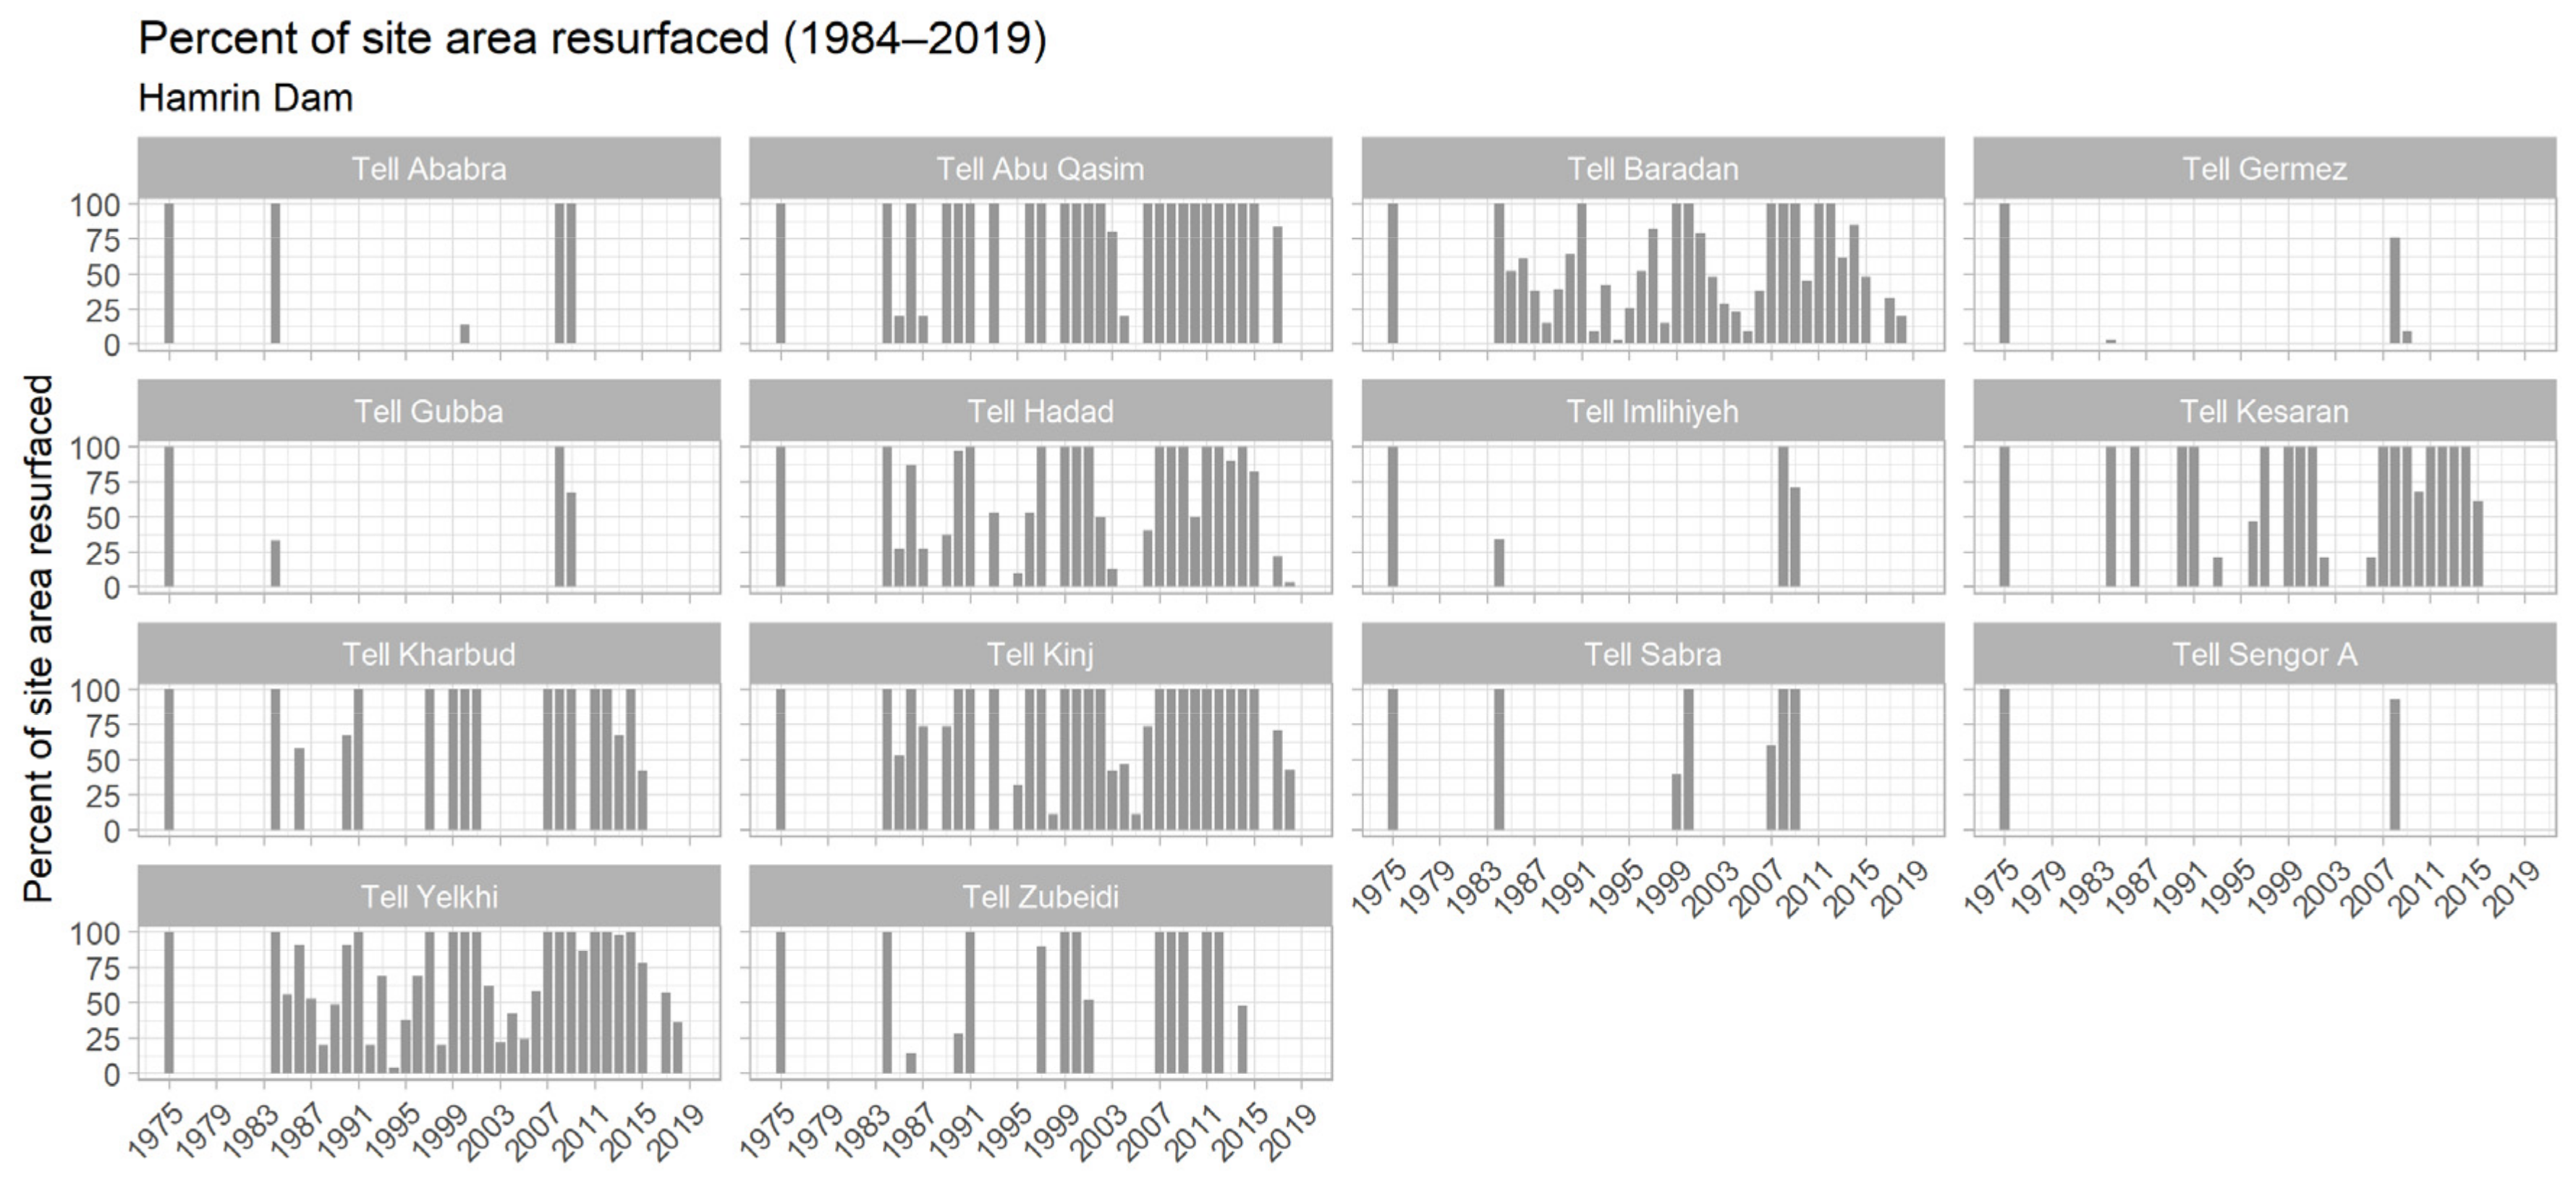
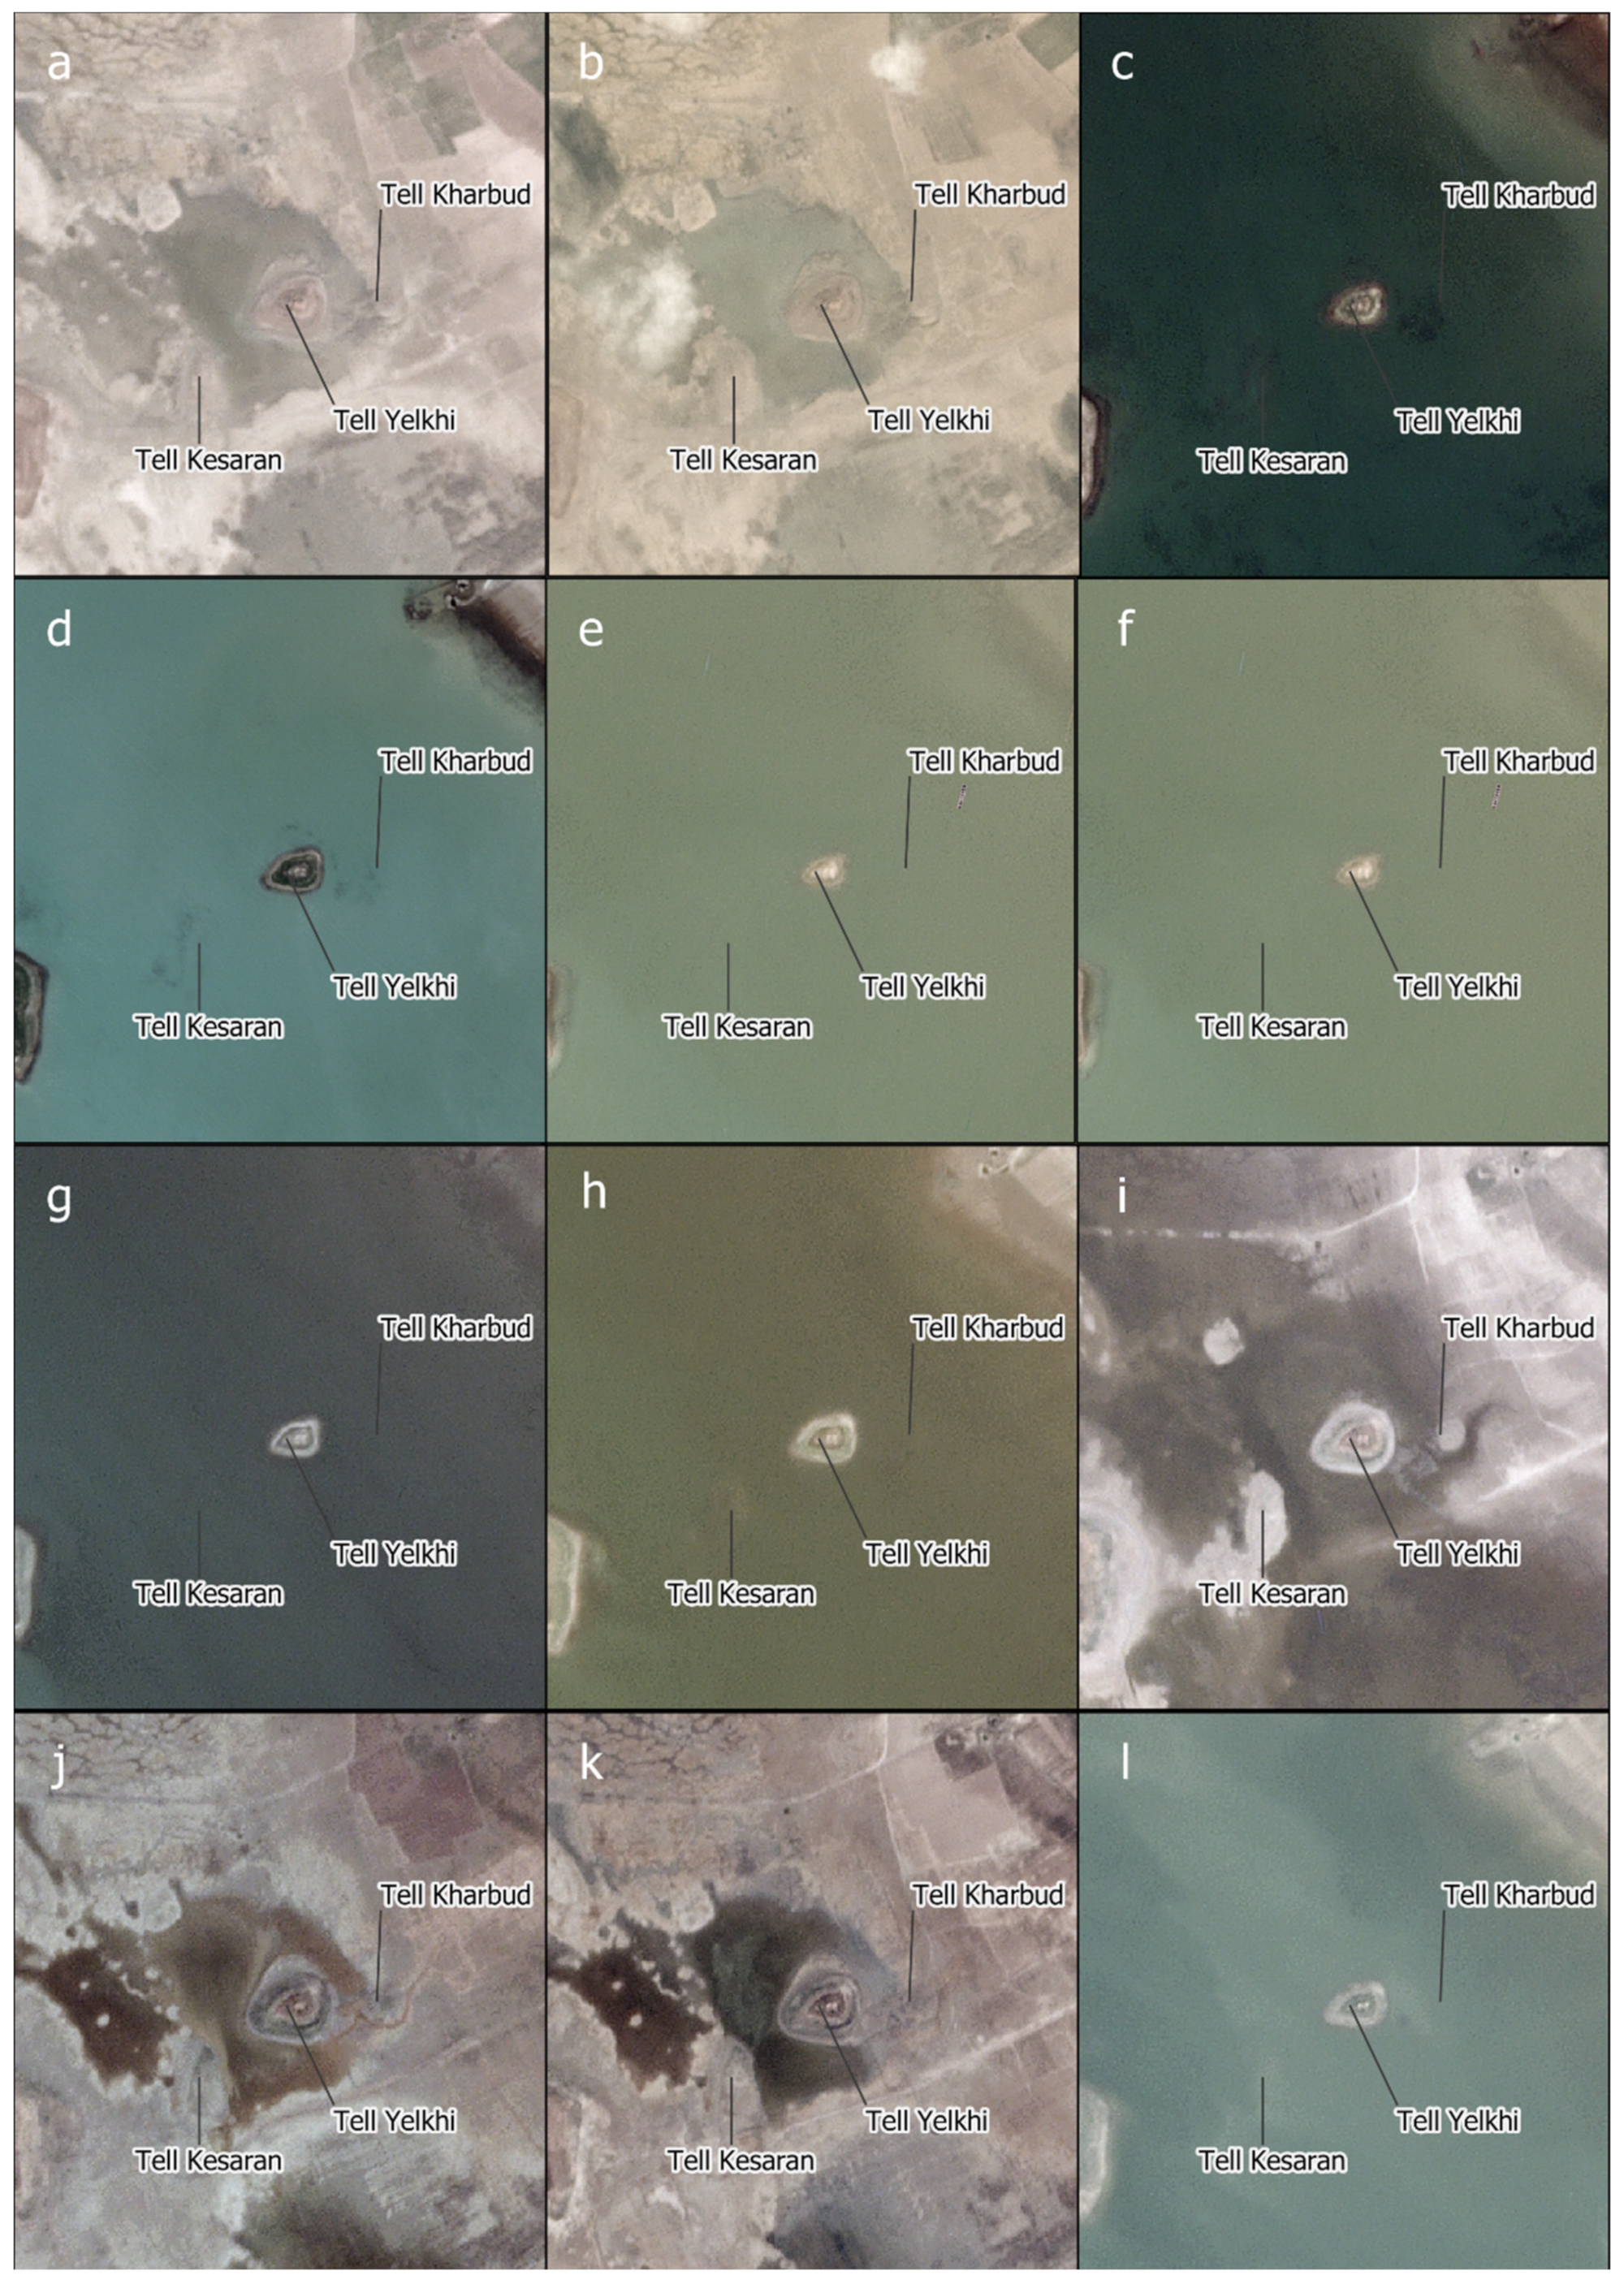
3.3. Hamrin Dam
3.4. Interannual Variability—2018 Monthly Analysis
3.5. Accuracy Assessment
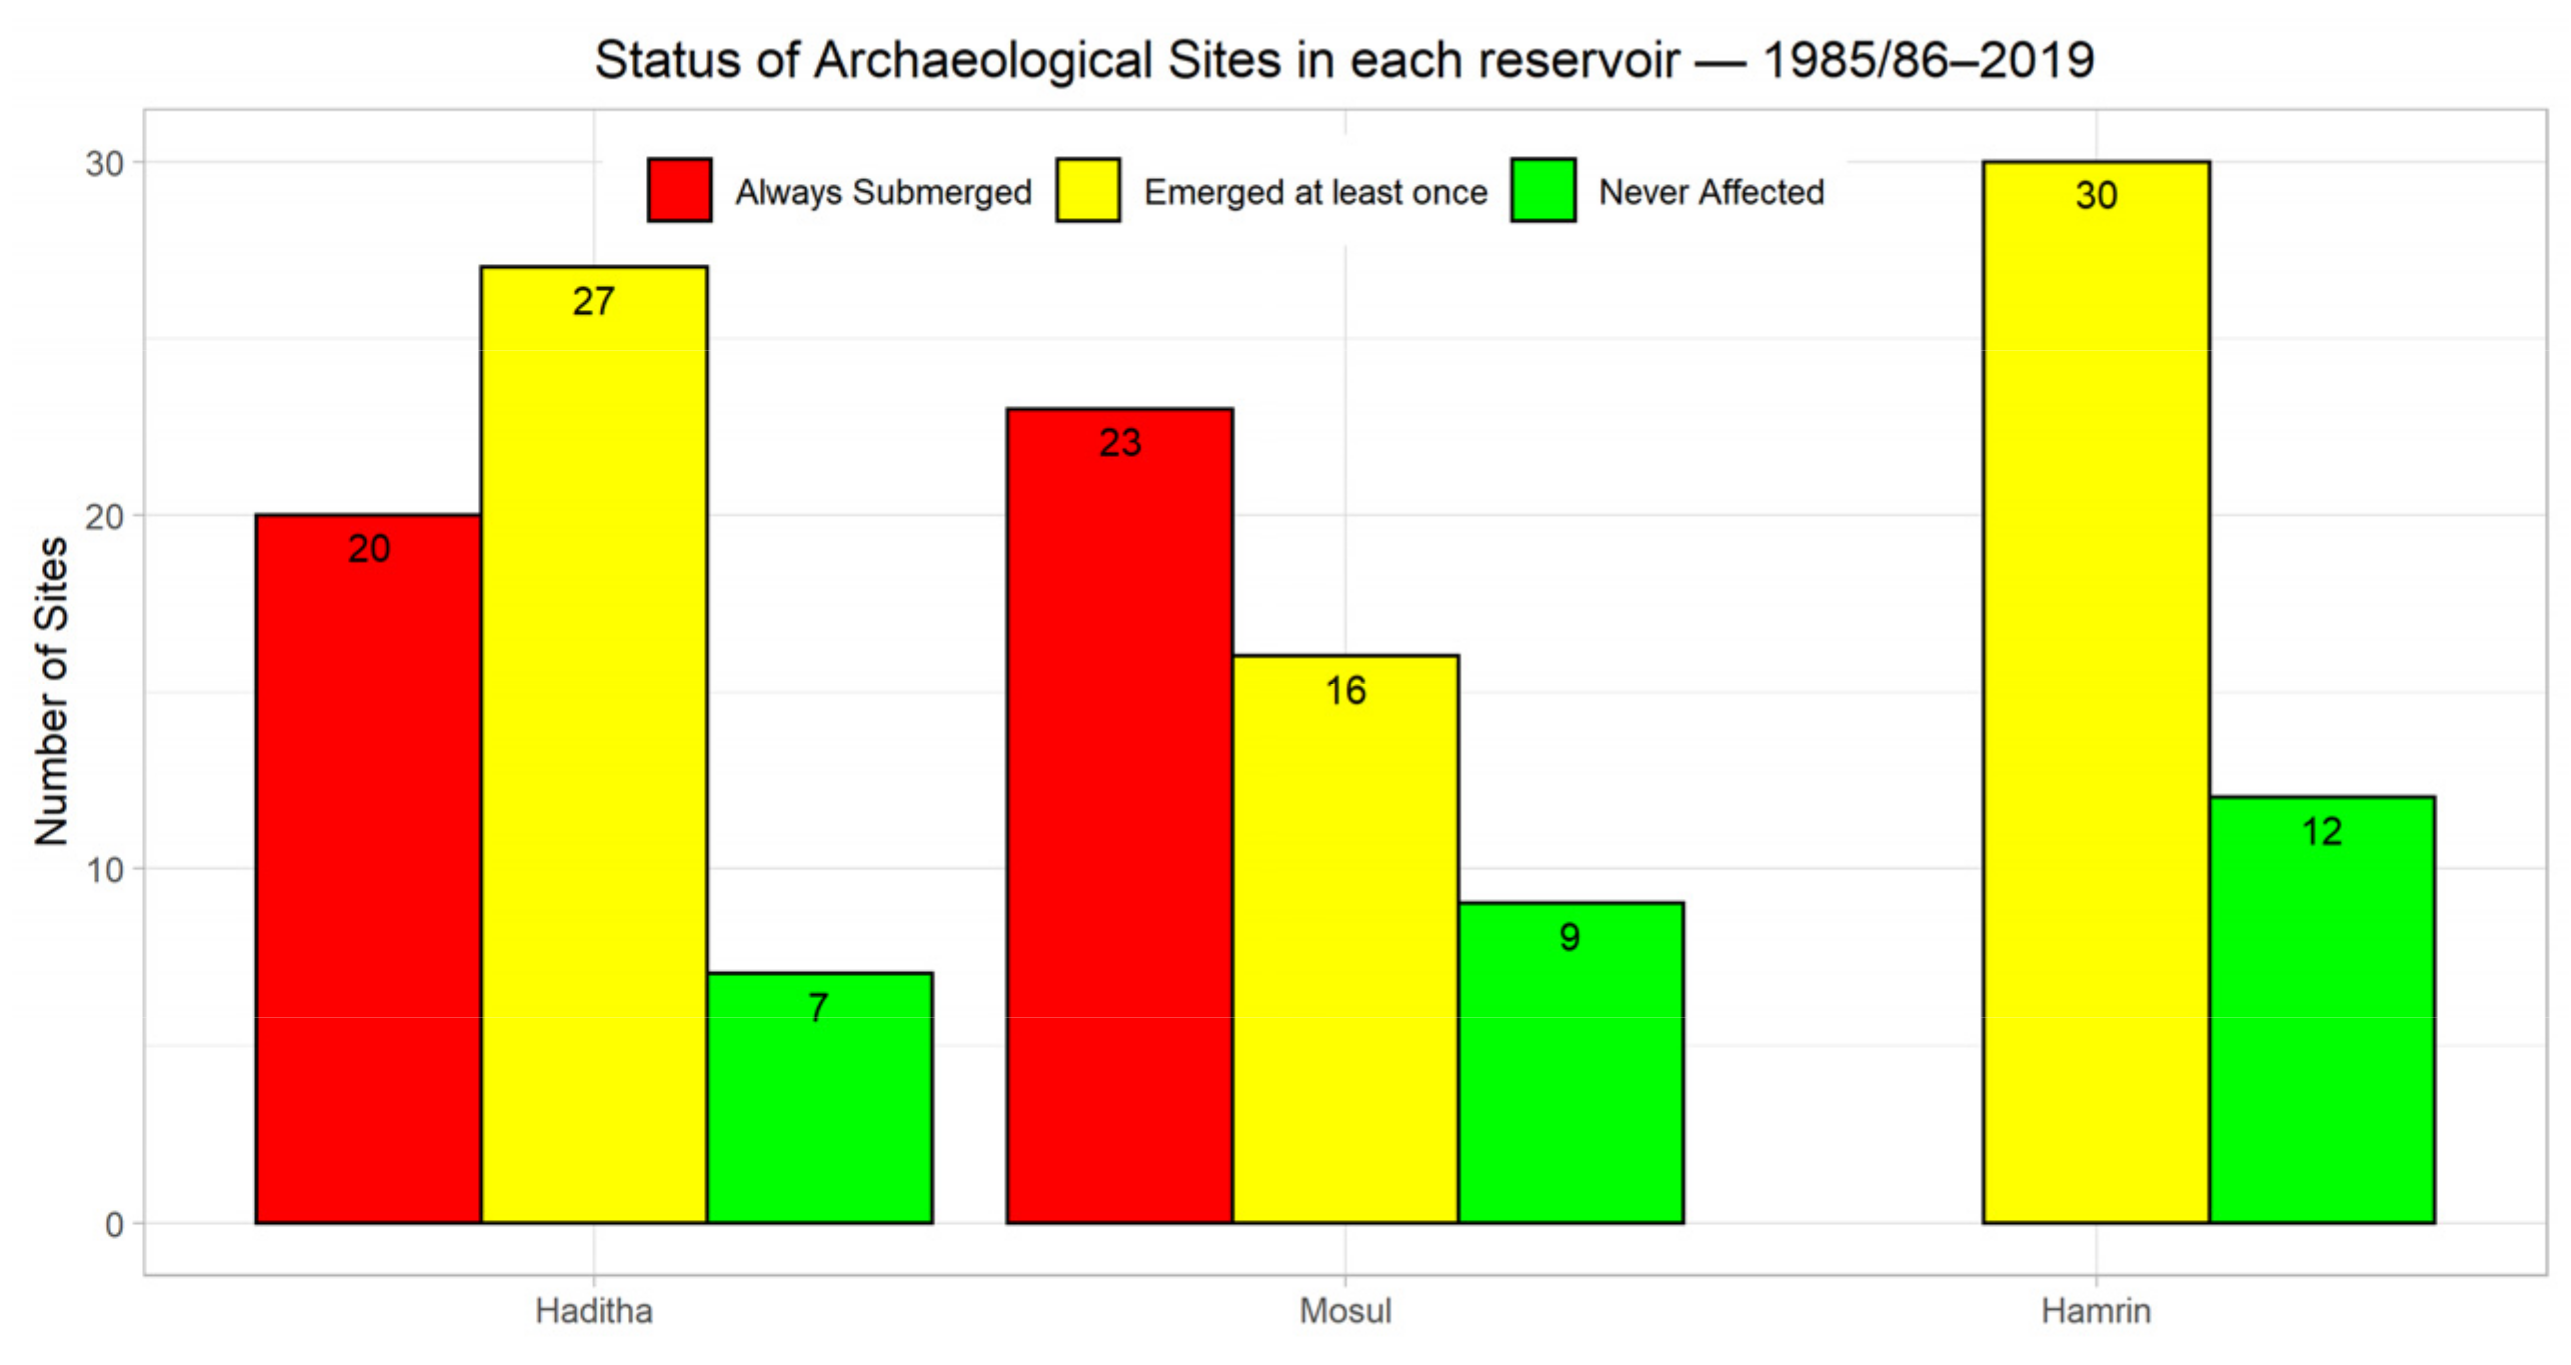
4. Discussion
- Sites that emerged cyclically from the waters;
- Sites that were never affected by the reservoir;
- Sites that were always submerged during the observed time span.
5. Conclusions
Supplementary Materials
Funding
Institutional Review Board Statement
Informed Consent Statement
Data Availability Statement
Acknowledgments
Conflicts of Interest
References
- Lupu, Y. International Law and the Waters of the Euphrates and Tigris. Georg. Int. Environ. Law Rev. 2001, 14, 349–366. [Google Scholar]
- Gleick, P.H. Water, Drought, Climate Change, and Conflict in Syria. Weather Clim. Soc. 2014, 6, 331–340. [Google Scholar] [CrossRef]
- Al-Ansari, N. Hydro-Politics of the Tigris and Euphrates Basins. Engineering 2016, 8, 140–172. [Google Scholar] [CrossRef]
- The United Nations Economic and Social Commission for Western Asia. Inventory of Shared Water Resources in Western Asia; ESCWA: Beirut, Lebanon, 2013; ISBN 9789211283617. [Google Scholar]
- Luke, C.; Meskell, L. Archaeology, assistance, and aggression along the Euphrates: Reflections from Raqqa. Int. J. Cult. Policy 2019, 25, 831–842. [Google Scholar] [CrossRef]
- Eidem, J. The “Tishrin Project” and Salvage Archaeology. In The Archaeology of the Upper Syrian Euphrates: The Tishrin Dam Area, Proceedings of the International Symposium, Barcelona, Spain, 28–30 January 1998; del Olmo Lete, G., Montero Fenollós, J.L., Eds.; The University of Chicago Press: Chicago, IL, USA, 1999; pp. 19–24. [Google Scholar]
- Wilkinson, T.J. On the Margins of the Euphrates: Settlement and Land Use at Tell Es-Sweyhat and in the Upper Lake Assad Area, Syria; Oriental Institute Publication: Chicago, IL, USA, 2004; ISBN 2004104597. [Google Scholar]
- Lehner, B.; Liermann, C.R.; Revenga, C.; Vörömsmarty, C.; Fekete, B.; Crouzet, P.; Döll, P.; Endejan, M.; Frenken, K.; Magome, J.; et al. Global Reservoir and Dam Database, Version 1 (GRanDv1): Dams, Revision 01. Available online: https://cmr.earthdata.nasa.gov/search/concepts/C1000000026-SEDAC.html (accessed on 19 February 2021).
- Lehner, B.; Liermann, C.R.; Revenga, C.; Vörömsmarty, C.; Fekete, B.; Crouzet, P.; Döll, P.; Endejan, M.; Frenken, K.; Magome, J.; et al. High-resolution mapping of the world’s reservoirs and dams for sustainable river-flow management. Front. Ecol. Environ. 2011, 9, 494–502. [Google Scholar] [CrossRef]
- Al-Shukri, S.J. Archaeological Survey of Ancient Settlements and Irrigation Systems in the Middle Euphrates Region of Mesopotamia; Univeristy of Chicago: Chicago, IL, USA, 1988. [Google Scholar]
- Blaylock, S.; French, D.H.; Summers, G.D. The Adıyaman Survey: An interim report. Anatol. Stud. 1990, 40, 81–135. [Google Scholar] [CrossRef]
- Algaze, G.; Breuninger, R.; Knudstad, J. The Tigris-Euphrates Archaeological Reconnaissance Project: Final report of the Birecik and Carchemish Dam survey areas. Anatolica 1994, 20, 1–96. [Google Scholar]
- Wilkinson, T.J. Late-Assyrian Settlement Geography in Upper Mesopotamia. In Neo-Assyrian Geography (Quaderni di Geografia Storica 5); Liverani, M., Ed.; Università di Roma, Dipartimento di scienze storiche, archeologiche e antropologiche dell’ Antichità: Rome, Italy, 1995; pp. 139–159. [Google Scholar]
- Parker, B.J. The Mechanics of Empire: The Northern Frontier of Assyria as a Case Study in Imperial Dynamics; University of Helsinki: Helsinki, Finland, 2001. [Google Scholar]
- Ball, W. Ancient Settlement in the Zammar Region: Excavations by the British Archaeological Expedition to Iraq in the Saddam Dam Salvage Project, 1985–1986; British Archaeological Reports International Series (1096); Archaeopress: Oxford, UK, 2003. [Google Scholar]
- Algaze, G.; Hammer, E.; Parker, B. The Tigris-Euphrates Archaeological Reconnaissance Project: Final Report of the Cizre Dam and Cizre-Silopi Plain Survey Areas. Anatolica 2012, 38, 1–115. [Google Scholar]
- Brancato, R. Settlement Patterns and Political Landscapes in the Upper Tigris River Valley; Arbor Sapientiae: Rome, Italy, 2017. [Google Scholar]
- Marchetti, N.; Zaina, F. Documenting Submerged Cultural Heritage. Dams and Archaeology in South-Eastern Turkey. In Culture and Conflict. Understanding Threats to Heritage; Kinzel, M., Thuesen, M.B., Thuesen, I., Eds.; Orbis: Copenhagen, Denmark, 2018; pp. 28–35. [Google Scholar]
- Marchetti, N.; Curci, A.; Gatto, M.C.; Nicolini, S.; Mühl, S.; Zaina, F. A multi-scalar approach for assessing the impact of dams on the cultural heritage in the Middle East and North Africa. J. Cult. Herit. 2019, 37, 17–28. [Google Scholar] [CrossRef]
- Marchetti, N.; Bitelli, G.; Franci, F.; Zaina, F. Archaeology and dams in southeastern turkey: Post-flooding damage assessment and safeguarding strategies on cultural heritage. J. Mediterr. Archaeol. 2020, 33, 29–54. [Google Scholar] [CrossRef]
- Marchetti, N.; Al-Hussainy, A.; Valeri, M.; Zaina, F. Assessing Endangered Cultural Heritage in Central Iraq. Methods and Perspectives of the QADIS Survey Project. Sumer 2018, 64, 11–34. [Google Scholar]
- Cunliffe, E.L. Satellites and Site Destruction: An Analysis of Modern Impacts on the Archaeological Resource of the Ancient Near East. Ph.D. Thesis, Durham University, Durham, UK, 2013. [Google Scholar]
- Puljiz, I.; Qasim, H.A. A new Mittani Centre on the middle Tigris (Kurdistan region): Report on the 2018 excavations at Kemune. Z. Orient-Archäologie 2019, 12, 10–43. [Google Scholar]
- Lesiv, M.; See, L.; Laso Bayas, J.C.; Sturn, T.; Schepaschenko, D.; Karner, M.; Moorthy, I.; McCallum, I.; Fritz, S. Characterizing the Spatial and Temporal Availability of Very High Resolution Satellite Imagery in Google Earth and Microsoft Bing Maps as a Source of Reference Data. Land 2018, 7. [Google Scholar] [CrossRef]
- Lippolis, C. Kifrin avant-poste sur l’Euphrate. In Studia Euphratica. Le Moyen Euphrate Iraquien Révélé par les Fouilles Préventives de Haditha; Kepinski, C., Lecomte, O., Tenu, A., Eds.; Maison Archeo: Paris, France, 2006; pp. 367–396. [Google Scholar]
- Valtz, E. Kifrin, a Fortress of the limes on the Euphrates. Mesopotamia 1987, 22, 81–89. [Google Scholar]
- Hasan, M.; Moody, A.; Benninger, L.; Hedlund, H. How war, drought, and dam management impact water supply in the Tigris and Euphrates Rivers. Ambio 2019, 48, 264–279. [Google Scholar] [CrossRef]
- Al-Ansari, N.A. Management of Water Resources in Iraq: Perspectives and Prognoses. Engineering 2013, 5, 667–684. [Google Scholar] [CrossRef]
- Doneus, M.; Miholjek, I.; Mandlburger, G.; Doneus, N.; Verhoeven, G.; Briese, C.; Pregesbauer, M. Airborne Laser Bathymetry for Documentation of Submerged Archaeological Sites in Shallow Water. Int. Arch. Photogramm. Remote Sens. Spat. Inf. Sci. 2015, 40, 99–107. [Google Scholar] [CrossRef]
- Papatheodorou, G.; Geraga, M.; Chalari, A.; Christodoulou, D.; Iatrou, M.; Fakiris, E.; Kordella, S.; Prevenios, M.; Ferentinos, G. Remote sensing for underwater archaeology: Case studies from Greece and Eastern Mediterranean. Bull. Geol. Soc. Greece 2011, 44, 100–115. [Google Scholar] [CrossRef]
- Bucci, G. Remote Sensing and Geo-Archaeological Data: Inland Water Studies for the Conservation of Underwater Cultural Heritage in the Ferrara District, Italy. Remote Sens. 2018, 10, 380. [Google Scholar] [CrossRef]
- Ur, J.A. Sennacherib’s Northern Assyrian Canals: New Insights from Satellite Imagery and Aerial Photography. Iraq 2005, 67, 317–345. [Google Scholar] [CrossRef]
- Wilkinson, T.J.; Rayne, L. Hydraulic landscapes and imperial power in the Near East. Water Hist. 2010, 2, 115–144. [Google Scholar] [CrossRef]
- Ur, J.; Reade, J.E. The Hydraulic Landscape of Nimrud. Mesopotamia 2015, 50, 25–51. [Google Scholar]
- Jotheri, J.; de Gruchy, M.; Almaliki, R.; Feadha, M. Remote Sensing the Archaeological Traces of Boat Movement in the Marshes of Southern Mesopotamia. Remote Sens. 2019, 11, 2474. [Google Scholar] [CrossRef]
- Jotheri, J.; Allen, M.B. Recognition of ancient channels and archaeological sites in the Mesopotamian floodplain using satellite imagery and digital topography. In New Agendas in Remote Sensing and Landscape Archaeology in the Near East: Studies in Honour of Tony J. Wilkinson; Lawrence, D., Altaweel, M., Philip, G., Eds.; Archaeopress: Oxford, UK, 2020; pp. 283–305. [Google Scholar]
- Hritz, C.; Wilkinson, T.J. Using Shuttle Radar Topography to map ancient water channels in Mesopotamia. Antiquity 2006, 80, 415–424. [Google Scholar] [CrossRef]
- Hritz, C. Tracing Settlement Patterns and Channel Systems in Southern Mesopotamia using Remote Sensing. J. Field Archaeol. 2010, 35, 184–203. [Google Scholar] [CrossRef]
- Parcak, S. Satellite Remote Sensing Methods for Monitoring Archaeological Tells in the Middle East. J. Field Archaeol. 2007, 32, 65–81. [Google Scholar] [CrossRef]
- Parcak, S. Archaeological Looting in Egypt: A Geospatial View (Case Studies from Saqqara, Lisht, and el Hibeh). Near East. Archaeol. 2015, 78, 196–203. [Google Scholar] [CrossRef]
- Casana, J. Satellite Imagery-Based Analysis of Archaeological Looting in Syria. Near East. Archaeol. 2015, 78, 142–152. [Google Scholar] [CrossRef]
- Danti, M.; Branting, S.; Penacho, S. The American Schools of Oriental Research Cultural Heritage Initiatives: Monitoring Cultural Heritage in Syria and Northern Iraq by Geospatial Imagery. Geosciences 2017, 7, 95. [Google Scholar] [CrossRef]
- Bewley, R.I.; Wilson, A.; Kennedy, D.N.; Mattingly, D.J.; Banks, R.; Bishop, M.; Bradbury, J.; Cunliffe, E.; Fradley, M.G.; Jennings, R.; et al. Endangered Archaeology in the Middle East and North Africa: Introducing the EAMENA Project. In CAA2015, Keep The Revolution Going: Proceedings of the 43rd Annual Conference on Computer Applications and Quantitative Methods in Archaeology, Siena, Italy, 31 March–2 April 2015; Archaeopress: Oxford, UK, 2016; pp. 919–932. Available online: https://core.ac.uk/download/pdf/303071887.pdf (accessed on 19 February 2021).
- Parcak, S.; Gathings, D.; Childs, C.; Mumford, G.; Cline, E. Satellite evidence of archaeological site looting in Egypt: 2002–2013. Antiquity 2016, 90, 188–205. [Google Scholar] [CrossRef]
- Rayne, L.; Bradbury, J.; Mattingly, D.; Philip, G.; Bewley, R.; Wilson, A. From Above and on the Ground: Geospatial Methods for Recording Endangered Archaeology in the Middle East and North Africa. Geosciences 2017, 7, 100. [Google Scholar] [CrossRef]
- Tapete, D.; Cigna, F. Appraisal of opportunities and perspectives for the systematic condition assessment of heritage sites with copernicus Sentinel-2 high-resolution multispectral imagery. Remote Sens. 2018, 10, 561. [Google Scholar] [CrossRef]
- Du, Z.; Linghu, B.; Ling, F.; Li, W.; Tian, W.; Wang, H.; Gui, Y.; Sun, B.; Zhang, X. Estimating surface water area changes using time-series Landsat data in the Qingjiang River Basin, China. J. Appl. Remote Sens. 2012, 6, 063609. [Google Scholar] [CrossRef]
- Du, Z.; Li, W.; Zhou, D.; Tian, L.; Ling, F.; Wang, H.; Gui, Y.; Sun, B. Analysis of Landsat-8 OLI imagery for land surface water mapping. Remote Sens. Lett. 2014, 5, 672–681. [Google Scholar] [CrossRef]
- Klein, I.; Dietz, A.J.; Gessner, U.; Galayeva, A.; Myrzakhmetov, A.; Kuenzer, C. Evaluation of seasonal water body extents in Central Asia over thepast 27 years derived from medium-resolution remote sensing data. Int. J. Appl. Earth Obs. Geoinf. 2014, 26, 335–349. [Google Scholar] [CrossRef]
- Rokni, K.; Ahmad, A.; Selamat, A.; Hazini, S. Water Feature Extraction and Change Detection Using Multitemporal Landsat Imagery. Remote Sens. 2014, 6, 4173–4189. [Google Scholar] [CrossRef]
- Acharya, T.D.; Lee, D.H.; Yang, I.T.; Lee, J.K. Identification of Water Bodies in a Landsat 8 OLI Image Using a J48 Decision Tree. Sensors 2016, 16, 1075. [Google Scholar] [CrossRef]
- Husain, Y. Monitoring and Calculating the Surface Area of Lakes in Northern Iraq Using Satellite Images. Appl. Res. J. 2016, 2, 54–62. [Google Scholar]
- Rayne, L.; Gatto, M.C.; Abdulaati, L.; Al-Haddad, M.; Sterry, M.; Sheldrick, N.; Mattingly, D. Detecting Change at Archaeological Sites in North Africa Using Open-Source Satellite Imagery. Remote Sens. 2020, 12, 3694. [Google Scholar] [CrossRef]
- Postgate, J.N.; Watson, P.J. Excavations in Iraq, 1977–1978. Iraq 1979, 41, 141–181. [Google Scholar] [CrossRef]
- Roaf, M.; Postgate, J.N. Excavations in Iraq, 1979–1980. Iraq 1981, 43, 167–198. [Google Scholar] [CrossRef]
- Lawrence, D. Early Urbanism in the Northern Fertile Crescent: A Comparison of Regional Settlement Trajectories and Millennial Landscape Change. Ph.D. Thesis, Durham University, Durham, UK, 2012. [Google Scholar]
- Killick, R.; Roaf, M. Excavations in Iraq, 1981–1982. Iraq 1983, 45, 199–224. [Google Scholar] [CrossRef]
- Killick, R.; Black, J. Excavations in Iraq, 1983–1984. Iraq 1985, 47, 215–239. [Google Scholar] [CrossRef]
- Ball, W.; Black, J. Excavations in Iraq, 1985–1986. Iraq 1987, 49, 231–251. [Google Scholar] [CrossRef]
- Sconzo, P.; Simi, F. Settlement Dynamics on the Banks of the Upper Tigris, Iraq: The Mosul Dam Reservoir Survey (1980). J. Open Archaeol. Data 2020, 8. [Google Scholar] [CrossRef]
- Banning, E.B. Archaeological Survey; Springer: New York, NY, USA, 2002. [Google Scholar]
- Qiao, C.; Luo, J.; Sheng, Y.; Shen, Z.; Zhu, Z.; Ming, D. An Adaptive Water Extraction Method from Remote Sensing Image Based on NDWI. J. Indian Soc. Remote Sens. 2012, 40, 421–433. [Google Scholar] [CrossRef]
- Li, W.; Du, Z.; Ling, F.; Zhou, D.; Wang, H.; Gui, Y.; Sun, B.; Zhang, X. A Comparison of Land Surface Water Mapping Using the Normalized Difference Water Index from TM, ETM+ and ALI. Remote Sens. 2013, 5, 5530–5549. [Google Scholar] [CrossRef]
- Jain, S.K.; Singh, R.D.; Jain, M.K.; Lohani, A.K. Delineation of Flood-Prone Areas Using Remote Sensing Techniques. Water Resour. Manag. 2005, 19, 333–347. [Google Scholar] [CrossRef]
- McFeeters, S.K. The use of the Normalized Difference Water Index (NDWI) in the delineation of open water features. Int. J. Remote Sens. 1996, 17, 1425–1432. [Google Scholar] [CrossRef]
- Xu, H. Modification of normalised difference water index (NDWI) to enhance open water features in remotely sensed imagery. Int. J. Remote Sens. 2006, 27, 3025–3033. [Google Scholar] [CrossRef]
- Ji, L.; Zhang, L.; Wylie, B. Analysis of Dynamic Thresholds for the Normalized Difference Water Index. Photogramm. Eng. Remote Sens. 2009, 75, 1307–1317. [Google Scholar] [CrossRef]
- Sun, F.; Zhao, Y.; Gong, P.; Ma, R.; Dai, Y. Monitoring dynamic changes of global land cover types: Fluctuations of major lakes in China every 8 days during 2000–2010. Chin. Sci. Bull. 2014, 59, 171–189. [Google Scholar] [CrossRef]
- Fisher, A.; Flood, N.; Danaher, T. Comparing Landsat Water Index Methods for Automated Water Classification in Eastern Australia. Remote Sens. Environ. 2016, 175, 167–182. [Google Scholar] [CrossRef]
- Liu, Z.; Yao, Z.; Wang, R. Assessing methods of identifying open water bodies using Landsat 8 OLI imagery. Environ. Earth Sci. 2016, 75, 1–13. [Google Scholar] [CrossRef]
- Sagar, S.; Roberts, D.; Bala, B.; Lymburner, L. Extracting the intertidal extent and topography of the Australian coastline from a 28 year time series of Landsat observations. Remote Sens. Environ. 2017, 195, 153–169. [Google Scholar] [CrossRef]
- Özelkan, E. Water Body Detection Analysis Using NDWI Indices Derived from Landsat-8 OLI. Pol. J. Environ. Stud. 2020, 29, 1759–1769. [Google Scholar] [CrossRef]
- Gorelick, N.; Hancher, M.; Dixon, M.; Ilyushchenko, S.; Thau, D.; Moore, R. Google Earth Engine: Planetary-scale geospatial analysis for everyone. Remote Sens. Environ. 2017, 202, 18–27. [Google Scholar] [CrossRef]
- Agapiou, A. Evaluation of Landsat 8 OLI/TIRS level-2 and sentinel 2 level-1C fusion techniques intended for image segmentation of archaeological landscapes and proxies. Remote Sens. 2020, 12. [Google Scholar] [CrossRef]
- Aybar, C.; Wu, Q.; Bautista, L.; Yali, R.; Barja, A. rgee: An R package for interacting with Google Earth Engine. J. Open Source Softw. 2020, 5, 2272. [Google Scholar] [CrossRef]
- Hijmans, R.J. Geographic Data Analysis and Modeling (R Package Raster Version 3.4-5). Available online: https://cran.r-project.org/package=raster (accessed on 19 February 2021).
- Olofsson, P.; Foody, G.M.; Herold, M.; Stehman, S.V.; Woodcock, C.E.; Wulder, M.A. Good practices for estimating area and assessing accuracy of land change. Remote Sens. Environ. 2014, 148, 42–57. [Google Scholar] [CrossRef]
- Congalton, R.G.; Green, K. Assessing the Accuracy of Remotely Sensed Data. Principles and Practices, 3rd ed.; CRC Press: Boca Raton, FL, USA, 2019; ISBN 9780429052729. [Google Scholar]
- Lillesand, T.; Kiefer, R.W.; Chipman, J. Remote Sensing and Image Interpretation, 7th ed.; John Wiley & Sons: Hoboken, NJ, USA, 2015; ISBN 9781118343289. [Google Scholar]
- Luca Congedo Semi-Automatic Classification Plugin Documentation. Available online: https://media.readthedocs.org/pdf/semiautomaticclassificationmanual-v4/latest/semiautomaticclassificationmanual-v4.pdf (accessed on 19 February 2021).
- Fisher, A.; Danaher, T. A water index for SPOT5 HRG satellite imagery, New South Wales, Australia, determined by linear discriminant analysis. Remote Sens. 2013, 5, 5907–5925. [Google Scholar] [CrossRef]
- Northedge, A.; Roaf, M. Excavations at ‘Āna, Qal‘a Island; British School of Archaeology in Iraq: London, UK, 1988; ISBN 0856684252. [Google Scholar]
- McFeeters, S.K. Using the normalized difference water index (NDWI) within a geographic information system to detect swimming pools for mosquito abatement: A practical approach. Remote Sens. 2013, 5, 3544–3561. [Google Scholar] [CrossRef]
- Du, Y.; Zhang, Y.; Ling, F.; Wang, Q.; Li, W.; Li, X. Water bodies mapping from Sentinel-2 imagery with Modified Normalized Difference Water Index at 10-m spatial resolution produced by sharpening the swir band. Remote Sens. 2016, 8. [Google Scholar] [CrossRef]
- Yang, X.; Zhao, S.; Qin, X.; Zhao, N.; Liang, L. Mapping of urban surface water bodies from sentinel-2 MSI imagery at 10 m resolution via NDWI-based image sharpening. Remote Sens. 2017, 9, 596. [Google Scholar] [CrossRef]
- Yang, X.; Chen, L. Evaluation of automated urban surface water extraction from Sentinel-2A imagery using different water indices. J. Appl. Remote Sens. 2017, 11, 026016. [Google Scholar] [CrossRef]
- Griffiths, P.; Nendel, C.; Hostert, P. Intra-annual reflectance composites from Sentinel-2 and Landsat for national-scale crop and land cover mapping. Remote Sens. Environ. 2019, 220, 135–151. [Google Scholar] [CrossRef]
- Rumora, L.; Miler, M.; Medak, D. Contemporary comparative assessment of atmospheric correction influence on radiometric indices between Sentinel-2A and Landsat 8 imagery. Geocarto Int. 2021, 36, 13–27. [Google Scholar] [CrossRef]
- Sharma, A.R.; Badarinath, K.V.S.; Roy, P.S. Corrections for atmospheric and adjacency effects on high resolution sensor data—A case study using irs-p6 LISS-IV data. Int. Arch. Photogramm. Remote Sens. Spat. Inf. Sci. 2008, 37, 497–502. [Google Scholar]
- Zhang, H.K.; Roy, D.P.; Yan, L.; Li, Z.; Huang, H.; Vermote, E.; Skakun, S.; Roger, J.C. Characterization of Sentinel-2A and Landsat-8 top of atmosphere, surface, and nadir BRDF adjusted reflectance and NDVI differences. Remote Sens. Environ. 2018, 215, 482–494. [Google Scholar] [CrossRef]
- Hadjimitsis, D.G.; Themistocleous, K. The importance of considering atmospheric correction in the pre-processing of satellite remote sensing data intended for the management and detection of cultural sites: A case study of the Cyprus area. In Proceedings of the 14th International Conference on Virtual Systems and Multimedia, Limassol, Cyprus, 20–25 October 2008; pp. 9–12. [Google Scholar]
- Hadjimitsis, D.G.; Papadavid, G.; Agapiou, A.; Themistocleous, K.; Hadjimitsis, M.G.; Retalis, A.; Michaelides, S.; Chrysoulakis, N.; Toulios, L.; Clayton, C.R.I. Atmospheric correction for satellite remotely sensed data intended for agricultural applications: Impact on vegetation indices. Nat. Hazards Earth Syst. Sci. 2010, 10, 89–95. [Google Scholar] [CrossRef]
- Agapiou, A.; Hadjimitsis, D.G.; Papoutsa, C.; Alexakis, D.D.; Papadavid, G. The Importance of accounting for atmospheric effects in the application of NDVI and interpretation of satellite imagery supporting archaeological research: The case studies of Palaepaphos and Nea Paphos sites in Cyprus. Remote Sens. 2011, 3, 2605–2629. [Google Scholar] [CrossRef]
- Pekel, J.F.; Cottam, A.; Gorelick, N.; Belward, A.S. High-resolution mapping of global surface water and its long-term changes. Nature 2016, 540, 418–422. [Google Scholar] [CrossRef] [PubMed]


| Satellite Images | Date Range | No. Images |
|---|---|---|
| Landsat 2 | 1975 | 1 |
| Landsat 5 | 1984–1998/2000/2004–2005/2008–2011 | 54 |
| Landsat 7 | 1999–2012 | 33 |
| Landsat 8 | 2013–2014 | 6 |
| Sentinel-2 | 2015–2019 | 15 |
| Sentinel-2 (Monthly) | 2018 | 36 |
| Planetscope | 2018 | 46 |
| Site Name | Jan | Feb | Mar | Apr | May | Jun | Jul | Aug | Sep | Oct | Nov | Dec |
|---|---|---|---|---|---|---|---|---|---|---|---|---|
| ‘Ana | 100% | 100% | 100% | 100% | 100% | 100% | 100% | 100% | 100% | 100% | 100% | 100% |
| al-’Usiya | 100% | 100% | 100% | 100% | 100% | 100% | 100% | 100% | 100% | 100% | 100% | 100% |
| al-Qasr | 100% | 100% | 100% | 100% | 100% | 100% | 100% | 100% | 100% | 100% | 100% | 98% |
| Glai’a | 46% | 35% | 13% | 19% | 10% | 8% | 19% | 40% | 51% | 74% | 80% | 68% |
| Kifrin | 100% | 100% | 100% | 100% | 98% | 98% | 99% | 100% | 100% | 100% | 100% | 100% |
| Sur Telbis | 100% | 100% | 100% | 100% | 94% | 92% | 100% | 100% | 100% | 100% | 100% | 100% |
| Telbis Isl. | 47% | 26% | 0% | 17% | 0% | 0% | 0% | 52% | 55% | 80% | 70% | 78% |
| Site Name | Jan | Feb | Mar | Apr | May | Jun | Jul | Aug | Sep | Oct | Nov | Dec |
|---|---|---|---|---|---|---|---|---|---|---|---|---|
| Irsheideh | 100% | 100% | 87% | 100% | 23% | 0% | 77% | 100% | 100% | 100% | 100% | 100% |
| T. Abu Qasim | 100% | 100% | 0% | 0% | 0% | 0% | 0% | 22% | 100% | 100% | 100% | 28% |
| T. Abu Shiafeh | 100% | 100% | 85% | 99% | 21% | 2% | 65% | 100% | 100% | 100% | 100% | 100% |
| T. Afwan | 100% | 100% | 100% | 100% | 100% | 100% | 100% | 100% | 100% | 100% | 100% | 100% |
| T. Akram | 76% | 74% | 74% | 97% | 87% | 97% | 100% | 100% | 100% | 100% | 68% | 66% |
| T. Atiqeh | 100% | 100% | 100% | 100% | 87% | 73% | 100% | 100% | 100% | 100% | 90% | 94% |
| T. Baradan | 70% | 75% | 16% | 19% | 11% | 9% | 12% | 25% | 47% | 60% | 50% | 25% |
| T. Hadad | 100% | 100% | 0% | 3% | 0% | 0% | 0% | 12% | 80% | 96% | 92% | 14% |
| T. Kesaran | 98% | 100% | 0% | 0% | 0% | 0% | 0% | 0% | 63% | 99% | 92% | 0% |
| T. Kharbud | 79% | 79% | 0% | 0% | 0% | 0% | 0% | 0% | 0% | 77% | 45% | 0% |
| T. Kinj | 100% | 100% | 20% | 34% | 7% | 0% | 14% | 62% | 100% | 100% | 100% | 60% |
| T. Razuk | 99% | 99% | 96% | 100% | 100% | 100% | 100% | 100% | 100% | 100% | 93% | 92% |
| T. Tannura | 99% | 97% | 96% | 100% | 64% | 43% | 97% | 100% | 100% | 100% | 97% | 98% |
| T. X | 100% | 86% | 50% | 100% | 64% | 100% | 100% | 100% | 100% | 100% | 50% | 57% |
| T. Yelkhi | 92% | 90% | 23% | 36% | 17% | 12% | 21% | 43% | 73% | 89% | 84% | 48% |
| T. Zubeidi | 39% | 52% | 0% | 0% | 0% | 0% | 0% | 0% | 0% | 11% | 0% | 0% |
| Site Name | Jan | Feb | Mar | Apr | May | Jun | Jul | Aug | Sep | Oct | Nov | Dec |
|---|---|---|---|---|---|---|---|---|---|---|---|---|
| Ger Matbakh | 100% | 100% | 100% | 100% | 100% | 100% | 100% | 100% | 100% | 100% | 100% | 100% |
| Khirbet Kharasan | 94% | 95% | 97% | 89% | 18% | 11% | 17% | 57% | 91% | 94% | 93% | 100% |
| T. Abu Dahir | 100% | 100% | 100% | 100% | 100% | 100 | 100% | 100% | 100% | 100% | 100% | 100% |
| Area | Satellite Images | Overall Accuracy | Producer’s Accuracy for Water | User’s Accuracy for Water |
|---|---|---|---|---|
| Haditha Dam | Landsat 5 | 98.56% | 100.00% | 94.99% |
| Landsat 7 | 98.57% | 100.00% | 95.07% | |
| Landsat 8 | 99.38% | 100.00% | 97.87% | |
| Sentinel-2 | 98.32% | 100.00% | 93.87% | |
| Monthly_S2 | 97.85% | 99.30% | 96.62% | |
| Mosul Dam | Landsat 5 | 98.01% | 98.63% | 94.74% |
| Landsat 7 | 98.59% | 100.00% | 95.22% | |
| Landsat 8 | 98.36% | 99.24% | 95.08% | |
| Sentinel-2 | 98.36% | 99.24% | 94.99% | |
| Monthly_S2 | 98.41% | 98.93% | 96.47% | |
| Hamrin Dam | Landsat 5 | 95.94% | 99.22% | 88.00% |
| Landsat 7 | 98.61% | 100.00% | 95.37% | |
| Landsat 8 | 97.58% | 95.33% | 96.70% | |
| Sentinel-2 | 98.18% | 98.35% | 96.39% | |
| Monthly_S2 | 98.43% | 100.00% | 97.17% |
Publisher’s Note: MDPI stays neutral with regard to jurisdictional claims in published maps and institutional affiliations. |
© 2021 by the author. Licensee MDPI, Basel, Switzerland. This article is an open access article distributed under the terms and conditions of the Creative Commons Attribution (CC BY) license (http://creativecommons.org/licenses/by/4.0/).
Share and Cite
Titolo, A. Use of Time-Series NDWI to Monitor Emerging Archaeological Sites: Case Studies from Iraqi Artificial Reservoirs. Remote Sens. 2021, 13, 786. https://doi.org/10.3390/rs13040786
Titolo A. Use of Time-Series NDWI to Monitor Emerging Archaeological Sites: Case Studies from Iraqi Artificial Reservoirs. Remote Sensing. 2021; 13(4):786. https://doi.org/10.3390/rs13040786
Chicago/Turabian StyleTitolo, Andrea. 2021. "Use of Time-Series NDWI to Monitor Emerging Archaeological Sites: Case Studies from Iraqi Artificial Reservoirs" Remote Sensing 13, no. 4: 786. https://doi.org/10.3390/rs13040786
APA StyleTitolo, A. (2021). Use of Time-Series NDWI to Monitor Emerging Archaeological Sites: Case Studies from Iraqi Artificial Reservoirs. Remote Sensing, 13(4), 786. https://doi.org/10.3390/rs13040786