
Article

Extending the Stimulus–Organism–Response Framework to Explain Continuance Purchase Intention in High-Involvement Online Furniture Commerce: A Dual-Layer Perspective on the Organism Component


by
Thanaporn Asawanuwat
,
Somchai Lekcharoen
* and
Sumaman Pankham
College of Digital Innovation Technology, Rangsit University, 52/347 Muang Ek Village, Lak Hok Subdistrict, Mueang District, Pathum Thani 12000, Thailand
*
Author to whom correspondence should be addressed.
J. Theor. Appl. Electron. Commer. Res. 2026, 21(8), 255; https://doi.org/10.3390/jtaer21080255
Submission received: 28 May 2026 / Revised: 30 July 2026 / Accepted: 31 July 2026 / Published: 4 August 2026

Abstract

Online furniture commerce has expanded, yet sustaining continuance purchase intention (CPI) remains challenging because furniture is a high-involvement product that consumers prefer to inspect physically. Drawing on the Stimulus–Organism–Response (SOR) framework, this study examines how social media marketing activity, product quality, and customer experience are associated with CPI through transactional appraisals (perceived value and customer satisfaction) and relational appraisals (customer trust and customer loyalty). An exploratory sequential mixed-methods design combined a three-round e-Delphi study with 19 experts and a survey of 1351 Thai consumers who had purchased furniture online. Data were analyzed using covariance-based structural equation modeling, bootstrapped indirect-effect analysis, and fuzzy-set qualitative comparative analysis (fsQCA). Customer loyalty and customer trust showed the strongest positive associations with CPI. Customer satisfaction showed a negative direct but significant positive indirect association through customer loyalty. Constraining the SAT → CPI path to zero significantly worsened model fit; however, the negative coefficient did not support the hypothesized positive association and should be interpreted cautiously as a model-conditional association. The fsQCA identified multiple sufficient configurations associated with high CPI, illustrating equifinality. The findings extend SOR to high-involvement commerce by integrating transactional and relational appraisals and complementary symmetric and configurational evidence.

1. Introduction

Online furniture commerce has expanded rapidly in recent years; however, sustaining consumers’ continuance purchase intention (CPI) remains challenging because furniture is a high-involvement product involving substantial financial expenditure, information asymmetry, high perceived risk, and limited opportunities for physical evaluation before purchase. Consumers therefore rely heavily on digital information, retailer credibility, and online service experiences when deciding whether to purchase again from the same retailer. These characteristics highlight the need to understand the consumer appraisals associated with long-term purchasing decisions in online furniture commerce [1,2,3].
Prior research on CPI and related online purchase behavior has examined perceived value, customer satisfaction, customer trust, customer loyalty, product quality, customer experience, and social media marketing activity [4,5,6,7,8]. However, these constructs have often been analyzed independently or primarily through their direct associations with behavioral outcomes. Limited attention has been given to the distinction between transactional appraisals, which concern immediate exchange outcomes, and relational appraisals, which concern the ongoing consumer–retailer relationship. This distinction is especially important for furniture because a favorable evaluation of a single transaction may not be sufficient to sustain purchasing from the same retailer when products are difficult to inspect, deliver, assemble, or return [1,2,3]. Although the Stimulus–Organism–Response (SOR) framework and related e-commerce research provide a relevant foundation linking external design and service stimuli, internal psychological states, and behavioral responses, most e-commerce applications represent the organism as an undifferentiated set of psychological constructs. This approach provides limited insight into the different but complementary roles of transaction-related and relationship-related appraisals in CPI [9,10,11].
To address this gap, this study extends the SOR framework by conceptually organizing the organism component into transactional appraisals (Perceived Value and Customer Satisfaction) and relational appraisals (Customer Trust and Customer Loyalty). All four constructs are modeled separately but remain theoretically interconnected. The term “dual-layer” refers only to this conceptual grouping and does not imply higher-order factors or a temporal sequence [12,13].
This study adopts an exploratory sequential mixed-methods design to examine the proposed framework and makes three principal contributions. First, it offers a more differentiated conceptualization of the organism component by organizing perceived value and customer satisfaction as transactional appraisals and customer trust and customer loyalty as relational appraisals, addressing the fragmented treatment of these constructs in prior e-commerce research [5,12,14,15,16,17,18,19,20,21,22]. Second, it advances understanding of CPI in online furniture commerce, where products are durable, relatively expensive, purchased infrequently, and difficult to evaluate fully through digital channels [1,2,3]. Third, integrating Structural Equation Modeling (SEM) and fuzzy-set Qualitative Comparative Analysis (fsQCA) provides complementary evidence from net associations and configurational patterns [23,24,25].

2. Literature Review

2.1. The Stimulus–Organism–Response (SOR) Framework

The Stimulus–Organism–Response (SOR) framework, originally proposed by Mehrabian and Russell [26], explains how external stimuli are associated with individuals’ internal cognitive and affective states, which are subsequently associated with behavioral responses. In electronic commerce, the framework has been applied to explain how digital, social, service-related, and product-related cues are associated with consumers’ internal evaluations and behavioral intentions. Prior research has linked servicescape quality with satisfaction and repurchase intention and has examined perceived functional value and trust as organismic states in live-commerce settings. These studies provide relevant foundations, but they do not jointly distinguish transactional and relational appraisals in high-involvement online furniture commerce [14,15,16,17]. Taken together, these studies provide relevant foundations for representing perceived value, customer satisfaction, customer trust, and customer loyalty as organismic states. However, these constructs have generally been examined in separate theoretical streams and have not been jointly distinguished as transaction-focused and relationship-focused appraisals in relation to continuance purchase intention [5,12,18].
The present study therefore incorporates perceived value, customer satisfaction, customer trust, and customer loyalty as distinct but interconnected evaluative states within the organism component. Rather than imposing a higher-order structure or temporal sequence, the framework examines their theoretically specified associations with continuance purchase intention. Furniture-specific research has examined product quality, social media marketing, satisfaction, loyalty, materials, esthetics, service, logistics, and brand trust; however, these factors have not been integrated within an SOR-based framework to explain continuance purchase intention in high-involvement online furniture commerce. Table 1 summarizes the relevant studies and positions the present research [1,2,3,19].
The theoretical extension therefore lies in differentiating the content of organismic appraisals: exchange-specific evaluations are organized as transactional appraisals, whereas confidence in and commitment to the retailer are organized as relational appraisals. This distinction refines the organism component without altering the core stimulus–organism–response sequence.
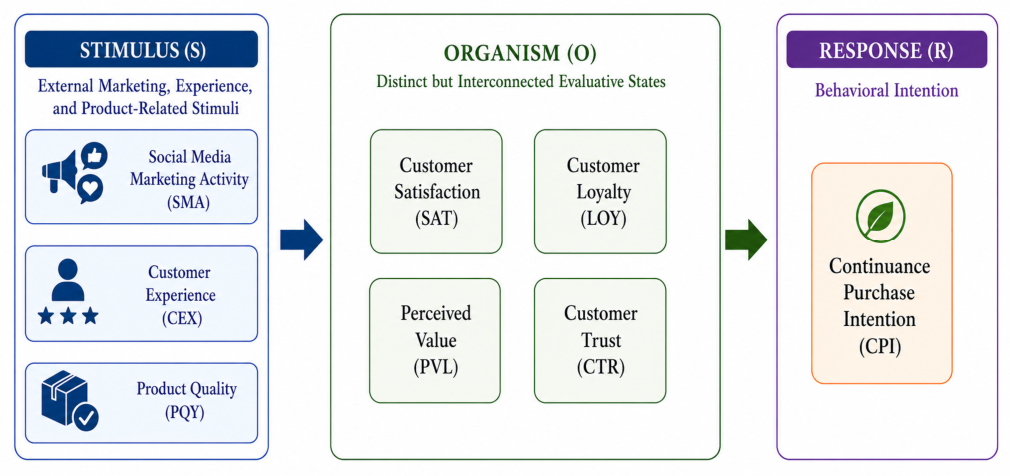
Building on this synthesis, Figure 1 presents the application of the SOR framework to the present research context.
Figure 1 presents the SOR framework, with SMA, CEX, and PQY as stimuli; PVL, SAT, CTR, and LOY as distinct but interconnected organismic states; and CPI as the response. The placement of the organism constructs does not imply a higher-order structure or temporal sequence.

2.2. Continuance Purchase Intention in High-Involvement Online Furniture Commerce

Continuance purchase intention (CPI) refers to consumers’ intention to continue purchasing from the same online retailer following prior purchasing experience. Unlike initial purchase intention, which concerns willingness to make a first purchase, CPI represents a post-adoption behavioral intention to maintain an ongoing purchasing relationship with an online retailer. Liu et al. conceptualized continuous purchase intention as a post-adoption outcome shaped by value-related and relational evaluations [4].
CPI is particularly relevant to high-involvement online furniture commerce because consumers face substantial uncertainty when evaluating furniture through digital channels. Furniture products are generally durable, relatively expensive, and purchased infrequently, while their suitability often depends on physical and sensory assessment. Before completing an online purchase, consumers may be unable to fully evaluate attributes such as material quality, dimensions, comfort, color accuracy, and suitability for the intended space. Evidence from furniture e-commerce further indicates that consumer evaluations are associated with product quality, materials, aesthetics, price, service, logistics, and brand trust [1,2,3].
Under these conditions, trust, return policies, and accumulated shopping experience become particularly important. Hipólito et al. [27] found that consumer trust was associated with lower perceived risk and greater satisfaction with the online shopping experience, while clearly defined return policies were also associated with customer satisfaction. Similarly, prior research has linked intangible product characteristics and institutional mechanisms in e-commerce to consumer trust and repurchase intention. Accordingly, consumers’ intentions to continue purchasing from an online furniture retailer may reflect multiple evaluations arising from their interactions with the product, platform, and retailer [28,29].
Within the proposed SOR framework, CPI constitutes the response component, whereas perceived value, customer satisfaction, customer trust, and customer loyalty are modeled as distinct but interconnected organismic states. This conceptualization explains CPI through both transactional evaluations of prior purchase outcomes and relational evaluations reflecting consumers’ confidence in and attachment to the online retailer.

2.3. Research Framework

Building upon the Stimulus–Organism–Response (SOR) framework, this study proposes a conceptual framework for explaining continuance purchase intention (CPI) in online furniture commerce. Social media marketing activity (SMA), product quality (PQY), and customer experience (CEX) are conceptualized as external stimuli linked to consumers’ internal evaluations. This classification is consistent with prior SOR-based research that treats marketing activities, product- and service-related attributes, and experiential cues as stimuli relevant to perceived value, satisfaction, trust, and behavioral intentions. In the present framework, CEX captures consumers’ accumulated interactions with an online retailer and is therefore positioned as an experiential stimulus relevant to their evaluations of the purchasing relationship [30,31,32].
The organism component comprises perceived value (PVL), customer satisfaction (SAT), customer trust (CTR), and customer loyalty (LOY). PVL represents consumers’ assessments of the benefits received relative to the sacrifices made, whereas SAT reflects their overall evaluation of prior purchasing experiences. CTR refers to consumers’ confidence in the retailer’s reliability and integrity, while LOY denotes their commitment and preference for maintaining the relationship. These constructs capture complementary transactional and relational evaluations that prior research has associated with repurchase and continuance intentions [20,21,22].
PVL, SAT, CTR, and LOY are modeled as distinct but interconnected first-order constructs within the organism component. Their conceptual grouping is used solely to organize the proposed framework and does not represent a higher-order structure or imply a temporal or developmental progression among the constructs. CPI constitutes the response component, representing consumers’ intention to continue purchasing from the same online retailer. Figure 1 illustrates the application of the SOR framework to the context of online furniture commerce.

3. Research Model and Hypotheses

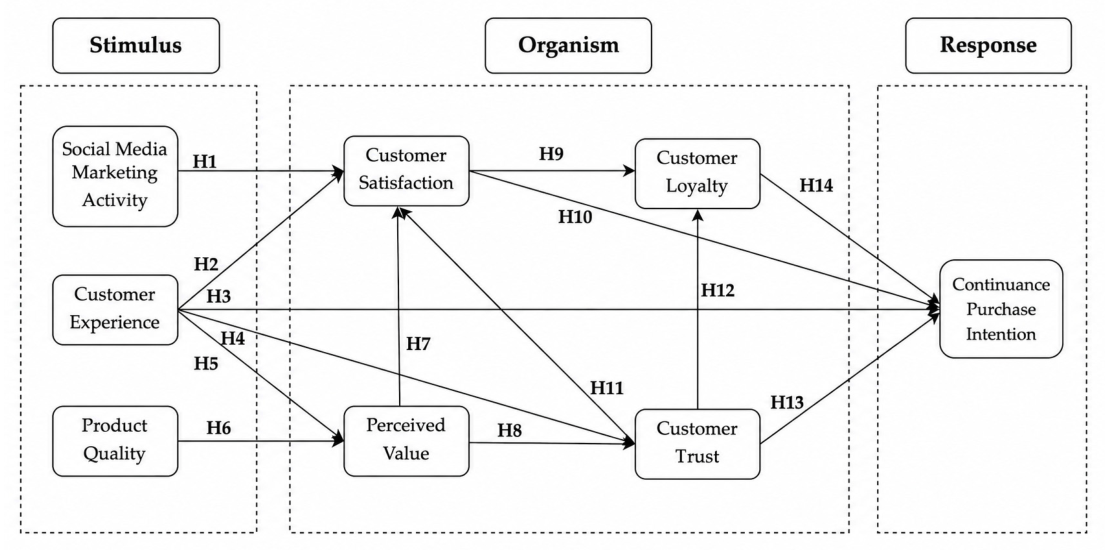
Building upon the conceptual framework presented in the preceding section, this study develops a structural model specifying the hypothesized relationships among the study constructs. Consistent with the SOR framework, social media marketing activity (SMA), product quality (PQY), and customer experience (CEX) are positioned as stimuli; perceived value (PVL), customer satisfaction (SAT), customer trust (CTR), and customer loyalty (LOY) constitute distinct but interconnected organismic states; and continuance purchase intention (CPI) represents the response. Drawing on the theoretical arguments and empirical evidence discussed below, fourteen hypotheses are proposed to examine the specified relationships among these constructs. Figure 2 presents the structural research model and the corresponding hypothesized paths.

3.1. Social Media Marketing Activity and Customer Satisfaction

Within the Stimulus–Organism–Response (SOR) framework, social media marketing activity (SMA) represents an external stimulus relevant to consumers’ evaluations of their online purchasing experiences. Through social media, consumers can access timely and relevant product information, communicate with retailers, and receive responses to purchase-related inquiries. Prior studies have linked social media marketing activity to customer experience and other favorable consumer responses in digital commerce contexts, including purchase intention, brand trust, brand loyalty, and revisit intention [31,32,33,34]. Building on this broader evidence, the present study examines its association with customer satisfaction.
In online furniture commerce, such activities are particularly relevant because consumers often require detailed information about product dimensions, materials, delivery, assembly, and after-sales conditions. The availability and clarity of this information may be associated with lower perceived uncertainty and more favorable evaluations of the purchasing experience. Nevertheless, the association between SMA and satisfaction remains insufficiently examined in the context of high-involvement online furniture purchasing. Therefore, the following hypothesis is proposed:
H1: 
Social media marketing activity is positively associated with customer satisfaction.

3.2. Customer Experience, Internal Evaluations, and Continuance Purchase Intention

Within the SOR framework, customer experience (CEX) is conceptualized as an experiential stimulus reflecting consumers’ accumulated interactions with an online retailer. These interactions provide cues relevant to consumers’ evaluations of the value received, satisfaction with the purchasing experience, confidence in the retailer, and intention to continue the purchasing relationship.
Prior research has positively associated customer experience with perceived value (PVL), customer satisfaction (SAT), and customer trust (CTR). Favorable experiences may be associated with greater perceived value when consumers regard the benefits obtained from the purchasing process as exceeding the corresponding monetary and non-monetary sacrifices. They may also be related to higher satisfaction through favorable evaluations of previous purchases and to greater trust when the retailer is perceived as reliable and capable of fulfilling its commitments. In addition, positive experience with an online retailer has been associated with consumers’ loyalty and intention to continue purchasing from that retailer [12,35,36,37].
These associations are particularly relevant in online furniture commerce, where consumers cannot fully assess attributes such as material quality, physical fit, comfort, and color accuracy before purchasing. Experience accumulated through completed transactions may therefore provide an important basis for evaluating both the product and the retailer. Although prior studies have examined the associations of customer experience with perceived value, satisfaction, trust, and continuance intention, these relationships have frequently been investigated separately rather than within an integrated SOR-based model of online furniture purchasing. Accordingly, the following hypotheses are proposed:
H2: 
Customer experience is positively associated with customer satisfaction.
H3: 
Customer experience is positively associated with continuance purchase intention.
H4: 
Customer experience is positively associated with customer trust.
H5: 
Customer experience is positively associated with perceived value.

3.3. Product Quality and Perceived Value

Within the SOR framework, product quality (PQY) is conceptualized as a product-related stimulus associated with consumers’ evaluations of the benefits obtained from a purchase. Perceived value (PVL) represents consumers’ overall assessment of these benefits relative to the monetary and non-monetary sacrifices involved in the transaction.
Prior studies have reported a positive association between product quality and perceived value in online commerce. When consumers perceive that a product performs well and meets their expectations, they may evaluate the benefits received as commensurate with or exceeding the costs incurred. In the context of furniture, perceived quality may reflect assessments of materials, construction, functionality, comfort, dimensional accuracy, durability, and the correspondence between the delivered product and its online description [2,3,38].
These considerations are particularly relevant in online furniture commerce, where consumers cannot fully assess material quality, fit, comfort, or color accuracy before purchase. Perceived product quality may therefore provide a key basis for evaluating whether the benefits received justify the monetary and non-monetary sacrifices involved. However, the association between product quality and perceived value has received limited attention within integrated SOR models of online furniture purchasing. Accordingly, the following hypothesis is proposed:
H6: 
Product quality is positively associated with perceived value.

3.4. Perceived Value as a Transactional Appraisal

Within the proposed SOR framework, perceived value (PVL) is conceptualized as a transactional appraisal because it reflects consumers’ assessment of the benefits obtained from an online purchase relative to the monetary and non-monetary sacrifices involved. Such sacrifices may include not only the purchase price but also the time, effort, uncertainty, and perceived risk associated with the transaction.
Prior research has reported a positive association between perceived value and customer satisfaction (SAT), as consumers tend to evaluate a purchasing experience more favorably when the benefits received are perceived as commensurate with or greater than the sacrifices made. Perceived value has also been positively associated with customer trust (CTR), because favorable assessments of a transaction may correspond with greater confidence in the retailer’s reliability and ability to deliver the promised value [20,21,39].
Although these relationships have been examined in online commerce, perceived value has often been considered in relation to satisfaction or trust separately. Their simultaneous inclusion in the proposed model provides a more comprehensive assessment of the transactional and relational evaluations associated with online furniture purchasing. Accordingly, the following hypotheses are proposed:
H7: 
Perceived value is positively associated with customer satisfaction.
H8: 
Perceived value is positively associated with customer trust.

3.5. Customer Satisfaction as a Transactional Appraisal

Within the proposed SOR framework, customer satisfaction (SAT) is conceptualized as a transactional appraisal because it reflects consumers’ overall evaluation of whether their purchasing experiences met or exceeded their expectations. Satisfaction therefore captures an evaluation of previous transaction outcomes rather than an enduring attachment to the retailer.
Prior studies have reported a positive association between customer satisfaction and customer loyalty (LOY), indicating that favorable evaluations of purchasing experiences tend to correspond with stronger retailer preference and commitment. Satisfaction has also been positively associated with consumers’ intention to continue purchasing from the same retailer. Nevertheless, satisfaction and loyalty should not be treated as interchangeable constructs. Satisfaction concerns consumers’ evaluations of their purchasing experiences, whereas loyalty represents a more enduring preference and commitment toward the retailer. Satisfied consumers may still consider alternative retailers when they encounter more attractive products, prices, or purchasing conditions [7,12,22,39].
Accordingly, the associations of satisfaction with loyalty and continuance purchase intention (CPI) are specified as separate relationships in the proposed model. The following hypotheses are therefore proposed:
H9: 
Customer satisfaction is positively associated with customer loyalty.
H10: 
Customer satisfaction is positively associated with continuance purchase intention.

3.6. Customer Trust as a Relational Appraisal

Within the proposed SOR framework, customer trust (CTR) is conceptualized as a relational appraisal reflecting consumers’ confidence in an online retailer’s reliability, competence, integrity, and ability to fulfill its commitments. Trust is particularly relevant to online commerce because consumers rely substantially on retailer-provided information and assurances when products cannot be fully inspected before purchase.
Prior research has associated customer trust with lower perceived uncertainty and more favorable evaluations of online transactions. Trust has also been positively associated with customer satisfaction (SAT), as confidence in a retailer’s reliability and fulfillment of its commitments may correspond with more favorable evaluations of the purchasing experience. Nevertheless, the theoretical ordering of trust and satisfaction remains debated. Some studies position satisfaction as theoretically preceding trust, whereas others specify trust as a predictor of satisfaction. Guided by the latter perspective, the present model specifies a directional path from trust to satisfaction. This specification represents the hypothesized relationship within the model and does not establish temporal or causal ordering [13,21,22].
Customer trust has also been positively associated with customer loyalty (LOY) and continuance purchase intention (CPI) [7,29,34,40]. These associations are particularly relevant to online furniture commerce, where consumers depend on the retailer’s product representations, delivery performance, assembly support, and after-sales service when evaluating whether to maintain the purchasing relationship. Accordingly, the following hypotheses are proposed:
H11: 
Customer trust is positively associated with customer satisfaction.
H12: 
Customer trust is positively associated with customer loyalty.
H13: 
Customer trust is positively associated with continuance purchase intention.

3.7. Customer Loyalty and Continuance Purchase Intention

Within the proposed SOR framework, customer loyalty (LOY) is conceptualized as an internal relational orientation reflecting consumers’ enduring preference for and commitment to an online retailer despite the availability of alternative sellers. In this study, loyalty primarily represents an attitudinal attachment to the retailer rather than the actual performance of repeat-purchase behavior.
Prior research has reported a positive association between customer loyalty and continuance purchase intention (CPI), indicating that stronger retailer preference and commitment tend to correspond to a greater intention to maintain the purchasing relationship [7,12,22]. Nevertheless, LOY and CPI are conceptually distinct. Loyalty reflects an enduring relational orientation toward the retailer, whereas CPI represents a prospective behavioral intention to make future purchases from the same retailer. In addition, CPI may depend on situational conditions, product requirements, financial considerations, and the emergence of future purchasing needs. This distinction is particularly relevant to furniture, which is durable and purchased relatively infrequently. The relationship between LOY and CPI therefore requires separate empirical examination. Accordingly, the following hypothesis is proposed:
H14: 
Customer loyalty is positively associated with continuance purchase intention.

4. Methodology

4.1. Research Design

To examine the proposed Stimulus–Organism–Response (SOR) framework, this study adopted an exploratory sequential mixed-methods design comprising qualitative and quantitative phases. The qualitative phase provided a contextual and conceptual foundation and refined the measurement instrument before quantitative testing.
The qualitative phase employed a three-round electronic Delphi (e-Delphi) study to establish expert consensus on the relevance, clarity, and contextual appropriateness of the measurement items. The first round elicited experts’ initial assessments, while the second and third rounds evaluated the revised items and established consensus [41].
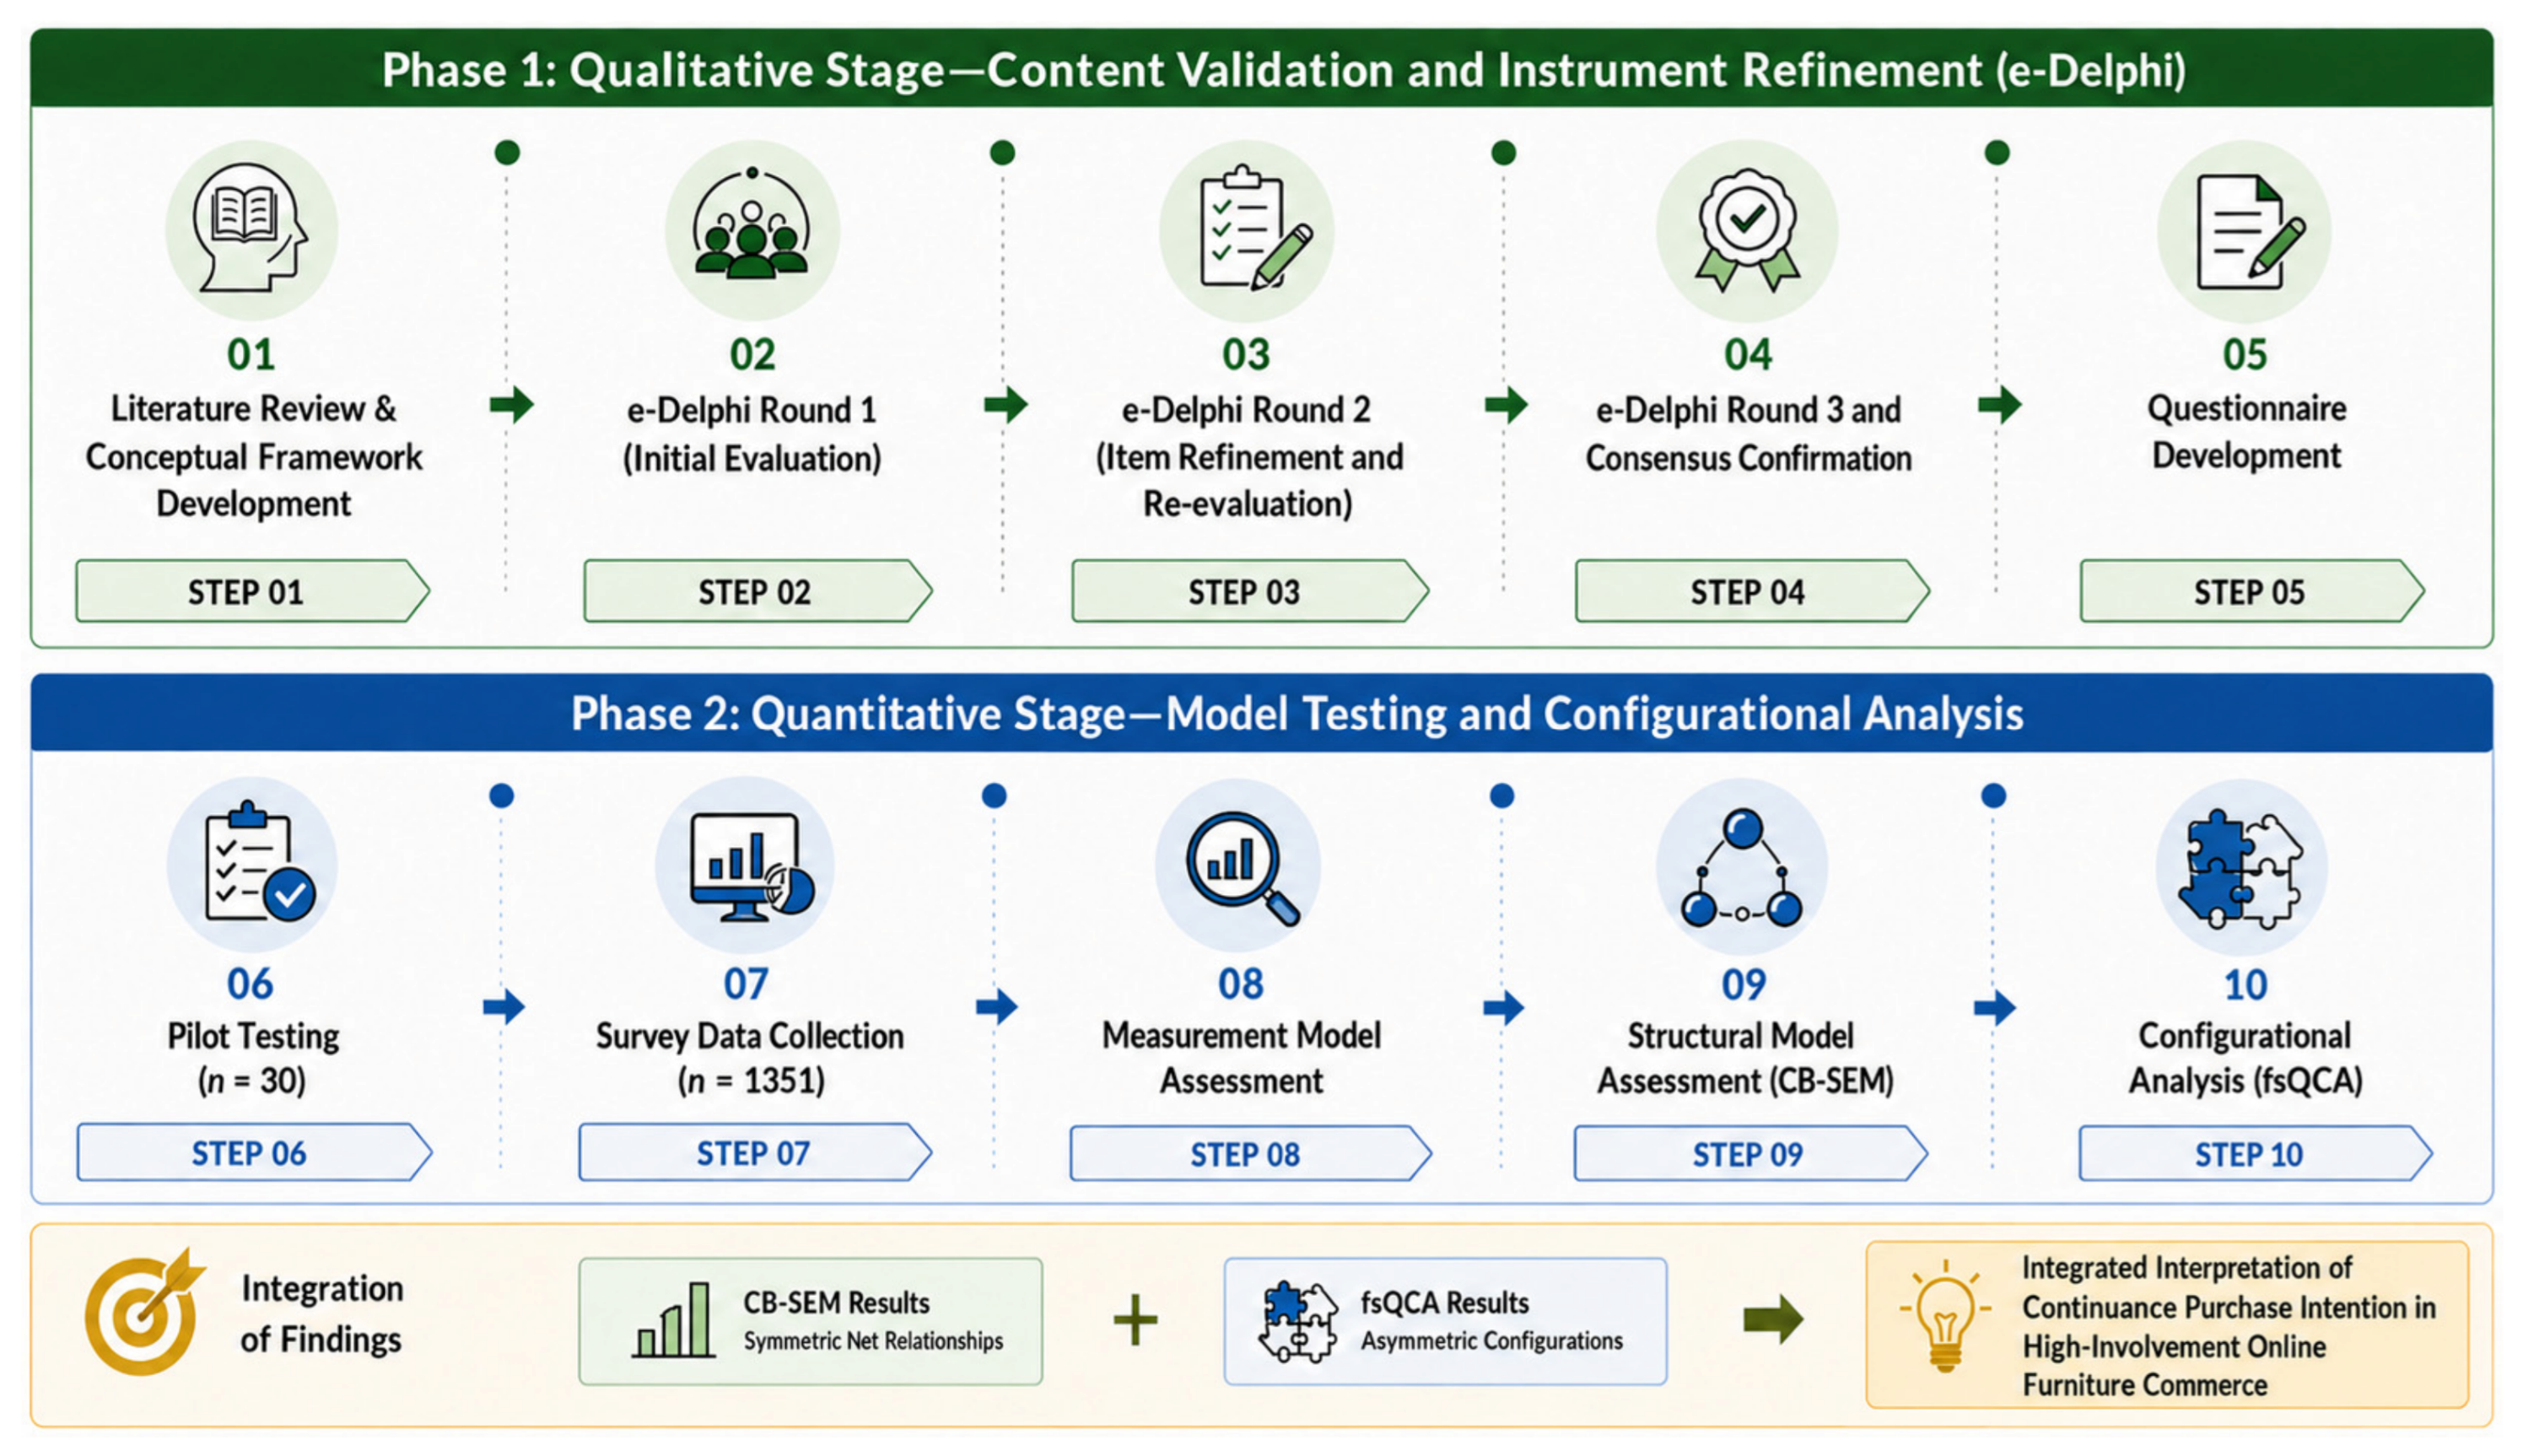
The quantitative phase analyzed survey data using covariance-based Structural Equation Modeling (CB-SEM) to examine the hypothesized net associations and fuzzy-set Qualitative Comparative Analysis (fsQCA) to identify asymmetric and equifinal configurations associated with high Continuance Purchase Intention (CPI). These methods provide complementary symmetric and configurational perspectives [23,24]. Together, e-Delphi, CB-SEM, and fsQCA integrated instrument refinement, hypothesis testing, and configurational analysis within a sequential research process, as illustrated in Figure 3.
Figure 3 summarizes the sequential research process, from e-Delphi instrument refinement to CB-SEM and fsQCA analyses, with the findings integrated during the interpretation stage.

4.2. Qualitative Phase: Expert Consensus Through e-Delphi

Before the quantitative phase, a three-round electronic Delphi (e-Delphi) procedure was conducted to assess the content validity and contextual appropriateness of the proposed constructs and measurement items. The iterative process maintained expert anonymity and provided controlled feedback between rounds, reducing the influence of dominant individuals and allowing participants to reconsider their evaluations. This process supported consensus on the relevance, clarity, and contextual suitability of the measurement instrument [41].
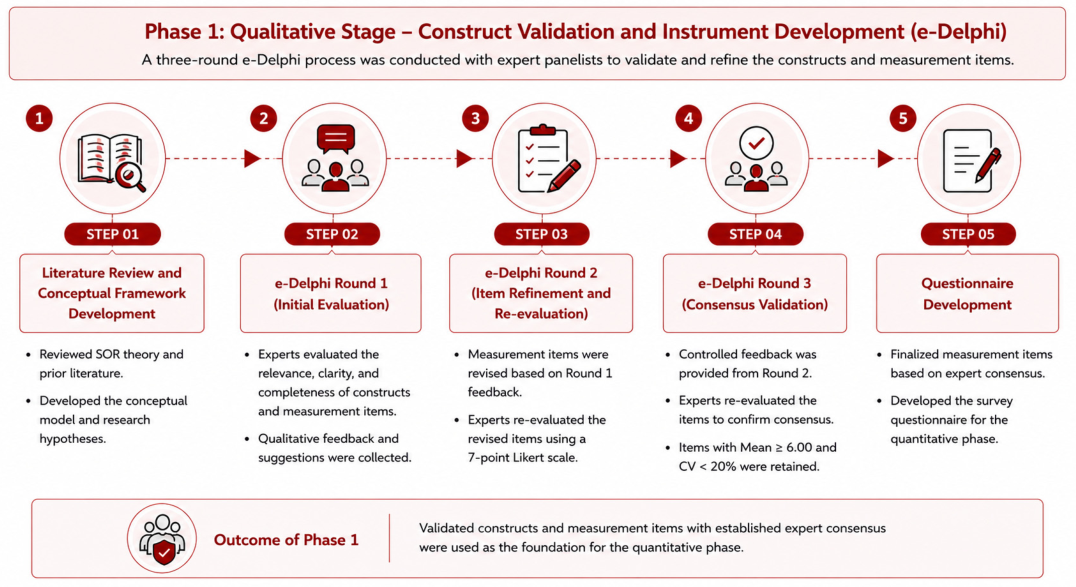
As illustrated in Figure 4, the qualitative phase progressed from literature review and conceptual framework development through three e-Delphi rounds: initial evaluation, item refinement and re-evaluation, and consensus validation. The constructs and measurement items validated through expert consensus were then used to develop the questionnaire for the quantitative phase.

4.2.1. Participants and Sampling

The qualitative phase employed purposive sampling to recruit experts with substantial academic or professional expertise relevant to the study context. Selection was based on demonstrated knowledge and experience in digital marketing, electronic commerce, consumer behavior, or the furniture industry, ensuring that both theoretical and practical perspectives were represented throughout the e-Delphi process.
A total of 19 experts participated, comprising 5 doctoral-level academics specializing in digital marketing and consumer behavior, 7 marketing and e-commerce professionals, and 7 senior executives from the furniture industry. All participants had at least five years of academic or professional experience in their respective fields and were therefore qualified to evaluate the relevance, clarity, and contextual appropriateness of the proposed constructs and measurement items.

4.2.2. Instrument Development and e-Delphi Procedure

The measurement items were initially developed based on the literature review and the proposed extended Stimulus–Organism–Response (SOR) framework. As illustrated in Figure 4, the three-round electronic Delphi (e-Delphi) procedure was subsequently implemented to evaluate and refine the proposed constructs and measurement items through iterative expert review and controlled feedback [41].
This procedure formed the qualitative stage of construct validation and instrument development.
In Round 1, the experts qualitatively evaluated the proposed constructs and measurement items and provided suggestions regarding conceptual clarity, wording, and contextual suitability. Based on this feedback, the measurement items were revised accordingly. In Round 2, the experts re-evaluated the revised instrument using a seven-point Likert scale ranging from 1 (strongly disagree) to 7 (strongly agree). The summarized results were then returned to the expert panel as controlled feedback for further evaluation. In Round 3, the experts re-evaluated the refined instrument to establish consensus on the proposed constructs and measurement items.
All 19 experts completed the three Delphi rounds, resulting in a 100% response retention rate. Rather than recommending the addition or removal of constructs, the experts primarily suggested improvements to the wording and contextual relevance of several measurement items for the online furniture purchasing context while preserving the original measurement structure.
Consistent with established Delphi guidelines, consensus was considered to be achieved when the mean score was at least 6.00 on the seven-point Likert scale and the coefficient of variation (CV) was below 0.20, indicating a high level of agreement among the expert panel [41]. The coefficient of variation was calculated as follows:
C V = S D M e a n
where
CV = coefficient of variation
SD = standard deviation
Mean = mean score of expert ratings
The finalized measurement instrument was subsequently employed in the quantitative phase for Structural Equation Modeling (SEM) and fuzzy-set qualitative comparative analysis (fsQCA).

4.3. Quantitative Research

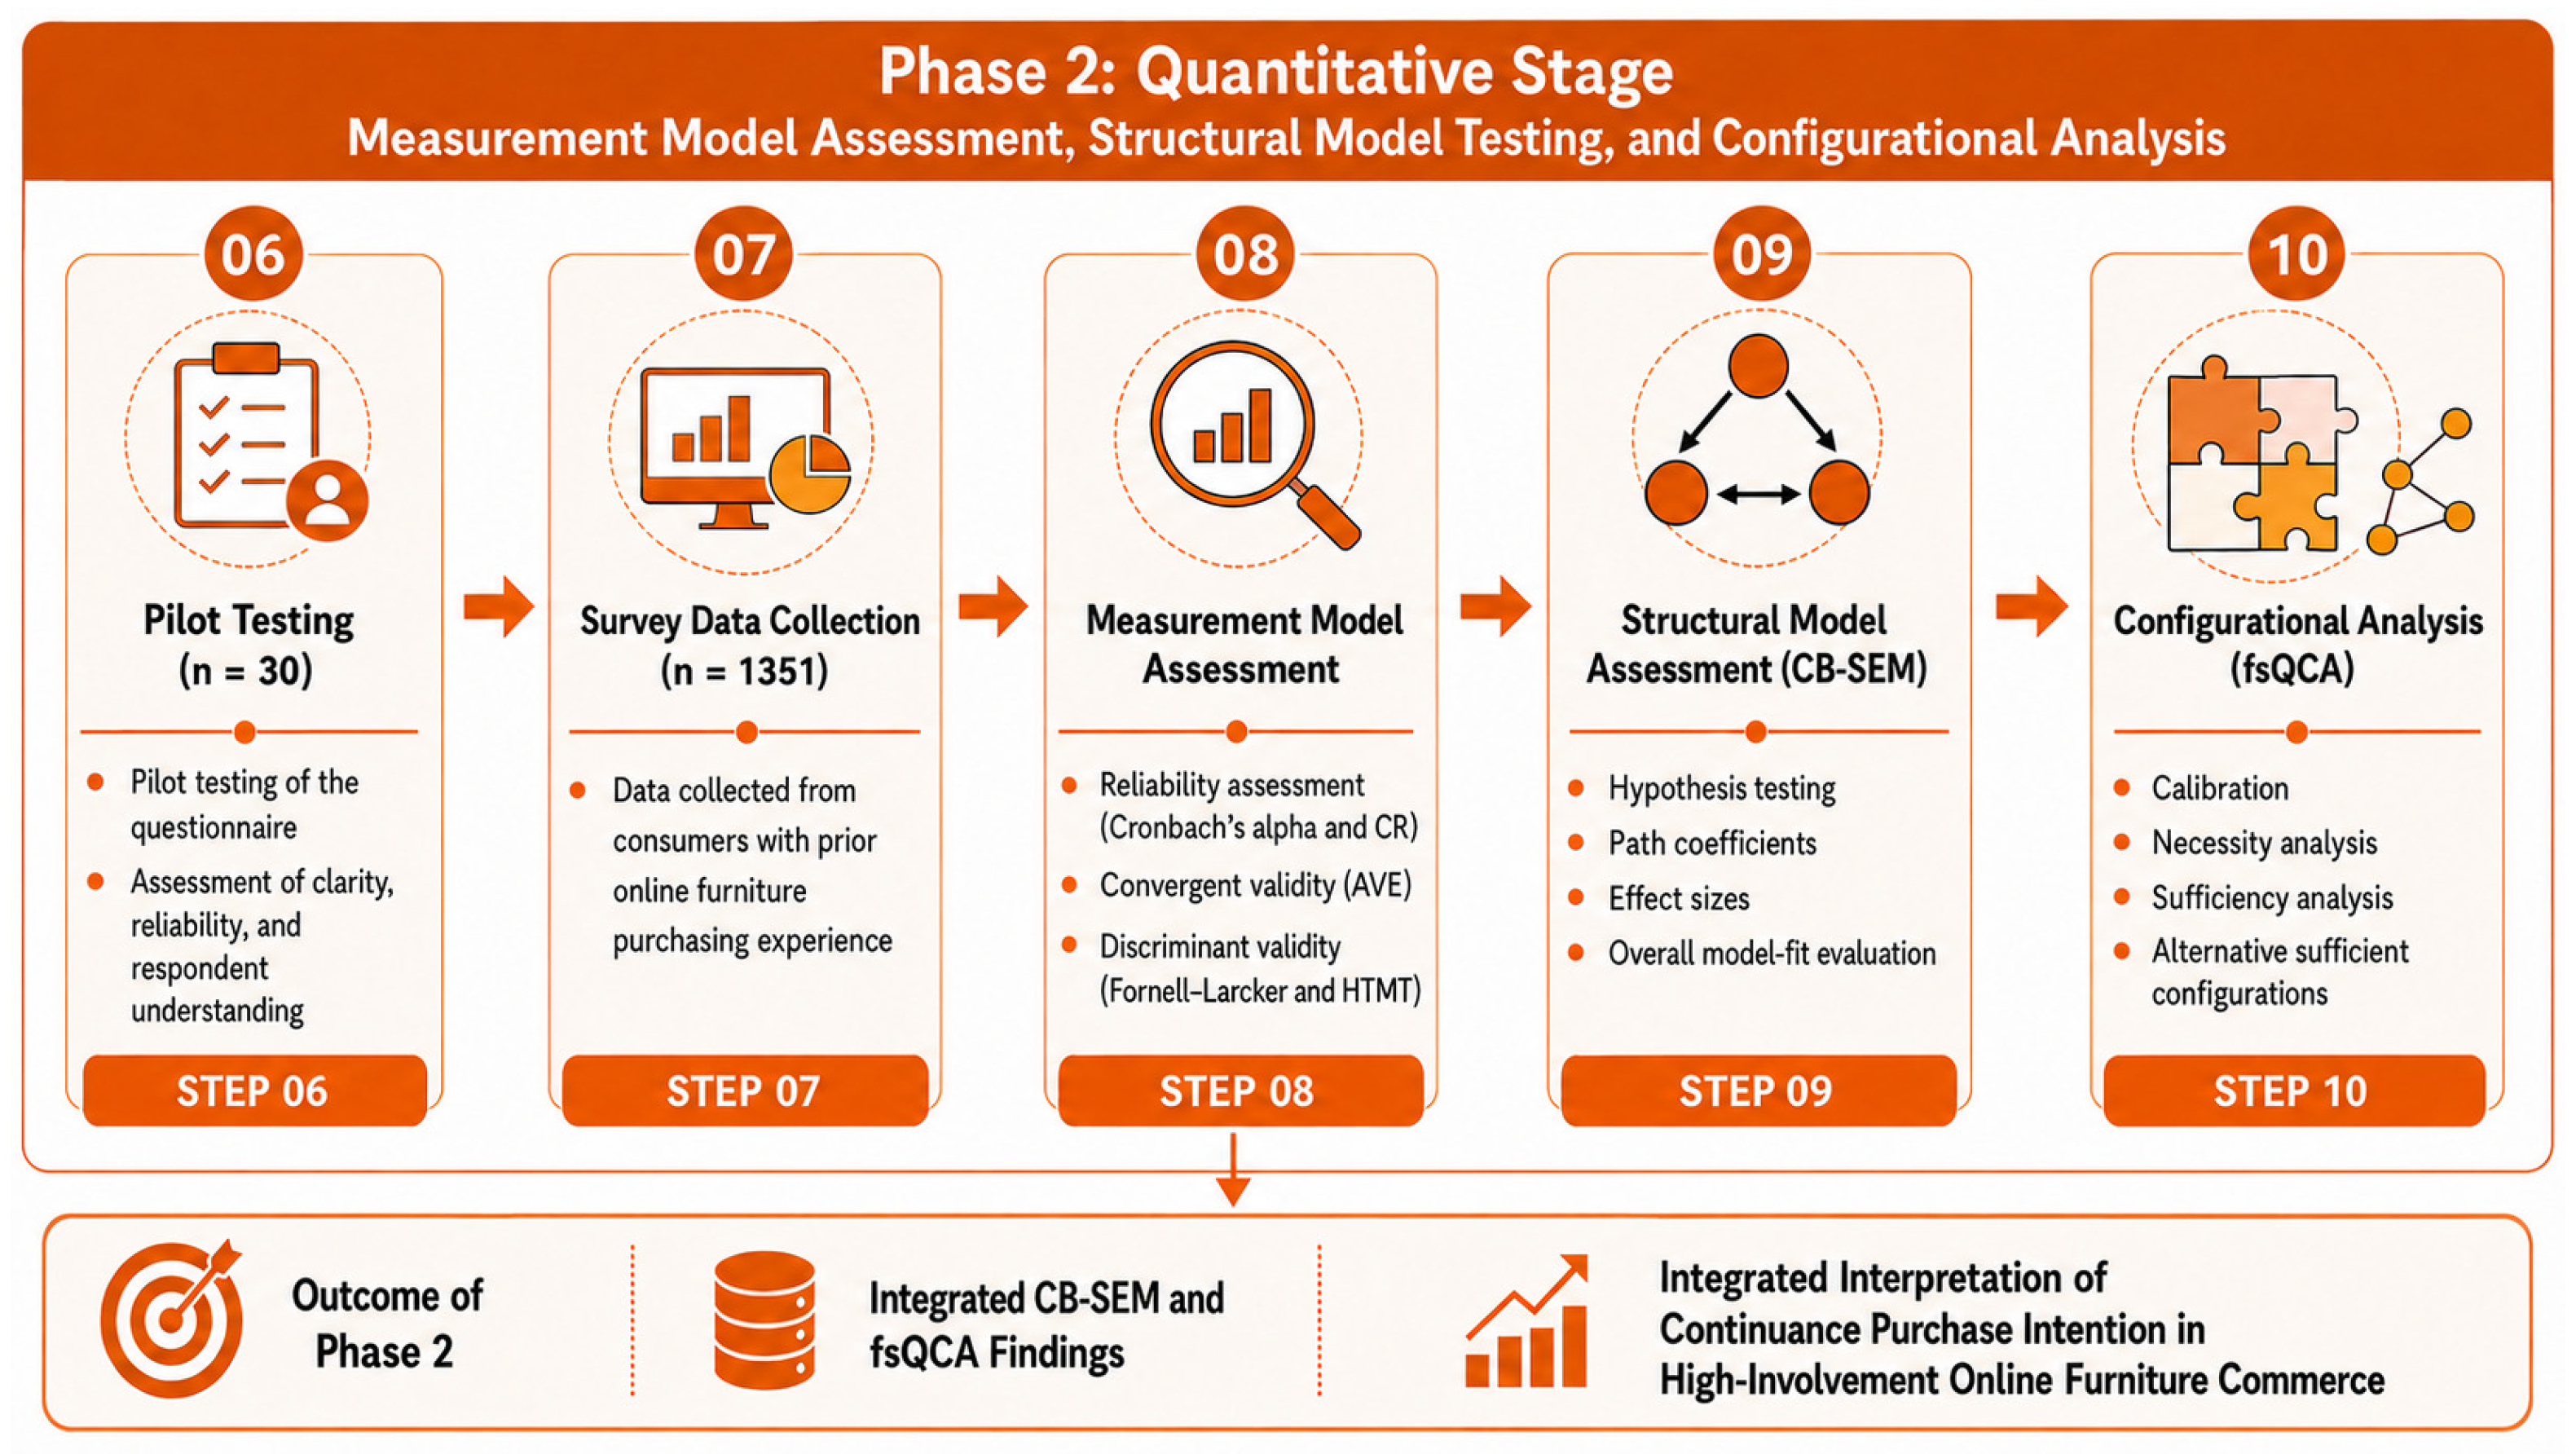
Following the e-Delphi phase, the refined measurement instrument was used to examine the proposed framework. Figure 5 summarizes the quantitative research process.
As illustrated in Figure 5, the quantitative phase comprised five stages: pilot testing (n = 30), survey data collection (n = 1351), measurement-model assessment, structural-model testing using CB-SEM, and configurational analysis using fsQCA. CB-SEM evaluated measurement quality, overall model fit, and the hypothesized net relationships, whereas fsQCA identified alternative sufficient configurations associated with high CPI. The findings were integrated during the interpretation stage to provide complementary variable-oriented and configurational perspectives on CPI.

4.3.1. Population and Sampling

The target population comprised Thai consumers aged 18 years or older who resided in Thailand and had purchased furniture through an online channel at least once. Because no identifiable sampling frame was available, participants were recruited through purposive non-probability sampling. At the beginning of the questionnaire, respondents were asked, “Have you ever purchased furniture through an online channel?” Those who answered “No” were directed to end the questionnaire, whereas those who answered “Yes” were eligible to continue. Respondents’ age and country of residence were also recorded to confirm that the retained sample corresponded to the defined target population.
Eligible participants were asked to identify the retailer or platform operating in Thailand from which they had most frequently purchased furniture online. The listed options included SB Design Square, Index Living Mall, IKEA, HomePro, Shopee, and Lazada. Data were collected from mid-August to December 2025 using a self-administered online questionnaire distributed through Facebook, home-decoration-related Facebook groups, and LINE. Of the 1500 initiated questionnaires, 149 were excluded because respondents did not meet the online-purchase screening criterion and/or submitted incomplete responses. Separate counts for these exclusion reasons were not retained; therefore, they are reported as a combined category. Consequently, 1351 valid questionnaires were retained for analysis, representing 90.1% of those initiated.
The reported 90.1% represents the proportion of initiated questionnaires retained for analysis rather than a conventional response rate. Because participants were recruited through open online channels and were not randomly selected, the number of individuals who viewed the invitation but did not participate was unknown. The eligibility screening ensured the relevance of the sample but did not make it probability-based or statistically representative. Therefore, although the sample size was sufficient for the analyses, purposive non-probability sampling and voluntary participation may have introduced self-selection bias, and the generalizability of the findings should be interpreted with caution.

4.3.2. Measurement Instrument

The measurement instrument was developed based on the construct definitions and measurement items established through the literature review and the three-round e-Delphi process described in the qualitative phase. The questionnaire comprised separate sections covering respondent eligibility, demographic characteristics, and the study constructs. The measurement items were presented using a seven-point Likert scale ranging from 1 = strongly disagree to 7 = strongly agree.
Before the main survey, the questionnaire was pilot tested with 30 respondents who had prior experience purchasing furniture through online channels. The pilot test assessed the clarity, readability, and comprehensibility of the questionnaire instructions and measurement items. Based on participant feedback, minor wording revisions were made before the full-scale survey. These revisions did not alter the conceptual meaning of the items or the operational definitions of the constructs.

4.3.3. Common Method Bias Assessment (CMB)

Because all substantive variables were collected from the same respondents using a self-administered questionnaire at a single point in time, both procedural measures and statistical diagnostics were used to address potential common method bias (CMB). Participation was voluntary and anonymous, neutral wording was used, and the questionnaire was organized into separate sections. Nevertheless, these measures could not eliminate the possibility of CMB.
Statistically, construct-level full-collinearity VIFs were examined using the conservative benchmark of 3.30 proposed by Kock [42] and the general collinearity benchmark of 5.00 [43]. Values exceeding 3.30 were treated as indicating a potential CMB concern, whereas values of 5.00 or greater indicated a more substantial collinearity concern. A common latent factor (CLF) was also linked to all observed indicators, and standardized loadings from the baseline model were compared with those obtained after introducing the CLF. Absolute loading differences approaching 0.20 were regarded as potentially material. Because neither diagnostic can conclusively confirm or rule out CMB, the results were interpreted cautiously. No marker variable was included. The results are reported in Section 5.2.3 [42].

4.3.4. Covariance-Based Structural Equation Modeling (CB-SEM)

Covariance-Based Structural Equation Modeling (CB-SEM) was employed to estimate the hypothesized structural associations and evaluate overall model fit. Following a two-step analytical approach, the measurement model was assessed before the structural model. Internal consistency reliability was evaluated using Cronbach’s alpha and composite reliability (CR), whereas convergent validity was assessed using standardized factor loadings and average variance extracted (AVE).
Discriminant validity was examined using the Fornell–Larcker criterion and the heterotrait–monotrait ratio (HTMT). Under the Fornell–Larcker criterion, the square root of each construct’s AVE was compared with its correlations with the other constructs. For HTMT, values below 0.85 were considered to satisfy the conservative criterion, whereas values below 0.90 may be acceptable for conceptually related constructs. Values exceeding 0.90 were treated as warranting further diagnostic assessment and cautious interpretation [44,45].
Because several descriptive HTMT values exceeded 0.90, inferential HTMT was additionally assessed using 5000 bootstrap resamples and 95% confidence intervals. Discriminant validity under the inferential criterion was considered to be supported when the confidence interval did not include 1.00 [45]. The results are reported in Section 5.2.4.
PVL, SAT, CTR, and LOY were modeled as distinct but interconnected first-order constructs, with no higher-order organism construct or temporal sequence specified. PVL represents a benefit–sacrifice evaluation, SAT an evaluation of prior purchasing experience, CTR confidence in the retailer’s reliability and integrity, and LOY an enduring relational preference and commitment. CPI is conceptually distinct because it represents an intention to continue purchasing from the same online retailer.
The structural relationships were evaluated using standardized path coefficients, corresponding p-values, coefficients of determination (R2), and effect sizes (f2). Following contemporary CB-SEM guidance [46], overall model fit was assessed using multiple absolute, incremental, and parsimonious fit indices, including χ2/df, GFI, AGFI, NFI, IFI, CFI, TLI, RMSEA, and SRMR.
The explanatory power of each endogenous construct was assessed using R2. The effect size of each predictor was calculated by comparing the R2 of the endogenous construct when the focal predictor was included with the corresponding R2 obtained when that predictor was excluded:
f 2 = R 2 i n c l u d e d R 2 e x c l u d e d 1 R 2 i n c l u d e d
where R2included represents the explained variance when the focal predictor is included in the model, and R2excluded represents the explained variance after its exclusion. Following Cohen’s criteria, f2 values of 0.02, 0.15, and 0.35 indicate small, medium, and large effect sizes, respectively [47].
To assess the specification sensitivity of the negative SAT–CPI coefficient and the comparatively large LOY–CPI coefficient, the hypothesized model was compared with a nested model in which the direct SAT–CPI path was fixed to zero. Relative fit was evaluated using the chi-square difference test (Δχ2; Δdf = 1) and global fit indices [46], together with AIC-based model comparison [48], explained variance, and changes in the principal structural coefficients. This supplementary analysis did not replace the hypothesized model or provide evidence of causality.
Direct, indirect, and total associations were estimated using bias-corrected bootstrapping with 5000 resamples and 95% confidence intervals. An indirect association was considered statistically significant when its confidence interval did not include zero. When both theoretically specified direct and indirect paths to CPI were present, the mediation pattern was classified according to the significance and direction of the corresponding estimates. When no direct path to CPI was theoretically specified, the results were reported as indirect associations rather than formally classified as mediation. The results are presented in Section 5.2.7 [49].

4.3.5. Fuzzy-Set Qualitative Comparative Analysis (fsQCA)

Following the CB-SEM analysis, fsQCA was employed to identify alternative configurations associated with high continuance purchase intention (CPI). Unlike variable-oriented analysis, fsQCA examines how combinations of conditions are jointly associated with an outcome, thereby accommodating conjunctural relationships, configurational asymmetry, and equifinality [23,24,25].
Construct scores were transformed into fuzzy-set membership scores using the direct calibration method. Necessity analysis was first conducted for the presence and absence of each individual condition, followed by truth table sufficiency analysis. The intermediate solution was used as the primary basis for interpretation because it incorporates theoretically informed directional expectations when simplifying the solution [24]. Raw coverage, unique coverage, and consistency were reported for each configuration, together with overall solution coverage and consistency. Robustness was assessed using alternative frequency thresholds. The calibration anchors, analytical thresholds, and corresponding justifications are summarized in Table 2.

5. Results

5.1. Qualitative Results: e-Delphi Expert Consensus Analysis

The three-round e-Delphi process demonstrated a high level of expert consensus regarding the relevance and contextual appropriateness of the proposed constructs and their associated measurement items. As shown in Table 3, the mean scores ranged from 6.137 to 6.589, while the coefficients of variation (CVs) ranged from 0.090 to 0.161. All constructs satisfied the predefined consensus criteria of a mean score of at least 6.00 and a CV below 0.20.

5.2. Quantitative Results

5.2.1. Demographic Characteristics of Respondents

A total of 1351 valid responses were obtained from Thai consumers with prior experience purchasing furniture through online channels. As presented in Table 4, the sample was predominantly female (59.36%), with the largest age group being 41–50 years (35.90%), followed by 31–40 years (30.57%). Most respondents held at least a bachelor’s degree (76.09%) and were employed in the private sector (43.30%). In addition, the majority reported moderate monthly incomes and frequent use of digital platforms, particularly Facebook and TikTok, when searching for furniture products. Overall, the sample represents active online consumers with substantial experience in high-involvement online furniture purchasing.

5.2.2. Measurement Quality Assessment

The reliability, convergent validity, and collinearity of the study constructs were assessed prior to evaluating the structural relationships, and the results are presented in Table 5.
As shown in Table 5, standardized factor loadings ranged from 0.74 to 0.89, Cronbach’s alpha ranged from 0.87 to 0.92, CR ranged from 0.879 to 0.941, and AVE ranged from 0.593 to 0.761. These values supported indicator reliability, internal consistency reliability, and convergent validity across all constructs. VIF values ranged from 1.835 to 3.771 and remained below 5.00, indicating no severe multicollinearity under the conventional criterion. Overall, the measurement results supported the subsequent assessment of discriminant validity and structural relationships.

5.2.3. Common Method Bias Assessment

Common method bias was evaluated using full-collinearity VIFs and common latent factor (CLF) loading comparisons. The results are reported in Table 6 and Table 7 [42,43].
As shown in Table 6, the construct-level full-collinearity VIFs ranged from 3.046 to 4.654. Although none reached 5.00, seven of the eight constructs exceeded 3.30. Thus, CMB could not be ruled out on the basis of the full-collinearity assessment alone. Accordingly, common latent factor (CLF) loading comparisons were conducted as a complementary diagnostic; Table 7 reports the absolute differences between the baseline and CLF-adjusted standardized loadings.
As shown in Table 7, the absolute differences in standardized loadings across the 42 measurement items ranged from 0.0001 to 0.0175, with the largest difference observed for SMA1. All differences remained below 0.20, suggesting that introducing the CLF produced only limited changes in the item loadings. Nevertheless, considering the VIF findings reported in Table 6 and the single-source, cross-sectional design, common method bias could not be conclusively ruled out.

5.2.4. Discriminant Validity

Following the assessment of potential common method bias, discriminant validity was evaluated using the Fornell–Larcker criterion, which compares the square root of the average variance extracted (AVE) for each construct with its correlations with the other constructs. The results are presented in Table 8 [44].
As shown in Table 8, the square root of AVE for each construct was lower than one or more interconstruct correlations, indicating that the Fornell–Larcker criterion was not fully satisfied and that substantial empirical overlap remained among the constructs [44]. Therefore, the heterotrait–monotrait ratio (HTMT) was additionally examined as a more stringent assessment of construct distinctiveness. The HTMT results are presented in Table 9 [44,45].
As reported in Table 9, five construct pairs exceeded 0.90: CEX–PVL (0.915), CTR–PVL (0.908), PQY–PVL (0.901), CTR–SAT (0.934), and PVL–SAT (0.918). These elevated values indicated potential empirical overlap among several conceptually related constructs and therefore warranted further examination. Accordingly, inferential HTMT was assessed using 5000 bootstrap resamples to determine whether the corresponding 95% confidence intervals included 1.00. The results are presented in Table 10 [45].
As shown in Table 10, none of the 95% bootstrap confidence intervals for the five construct pairs included 1.00. The upper confidence limits ranged from 0.929 to 0.957, providing inferential support for discriminant validity under the confidence-interval criterion. Nevertheless, because the corresponding HTMT point estimates exceeded 0.90, potential empirical overlap or shared variance among CEX, PQY, PVL, CTR, and SAT could not be entirely ruled out.
Conceptually, the constructs represent different aspects of the online purchasing process. CEX captures consumers’ accumulated interactions with the online retailer; PQY reflects perceived product attributes and performance; PVL represents an evaluation of benefits relative to monetary and non-monetary sacrifices; SAT reflects whether prior purchasing experiences met or exceeded expectations; CTR represents confidence in the retailer’s reliability and integrity; LOY reflects an enduring preference and relational commitment toward the retailer; and CPI represents the prospective intention to continue purchasing from the same online retailer.
Despite these conceptual distinctions, the Fornell–Larcker results and elevated HTMT values were explicitly considered when interpreting the structural coefficients. This consideration was particularly relevant to the model-conditional SAT–CPI coefficient because SAT exhibited elevated HTMT values with CTR and PVL, which were simultaneously included in the structural model. The sensitivity of this coefficient was therefore further assessed through an alternative-model comparison and acknowledged in the Discussion and Limitations. Overall, the constructs were retained as theoretically distinct first-order constructs, while the observed empirical overlap was treated as an interpretive qualification rather than as grounds for construct aggregation.

5.2.5. Structural Model Assessment

The overall goodness-of-fit of the proposed structural model was evaluated using multiple model fit indices. The results are presented in Table 11.
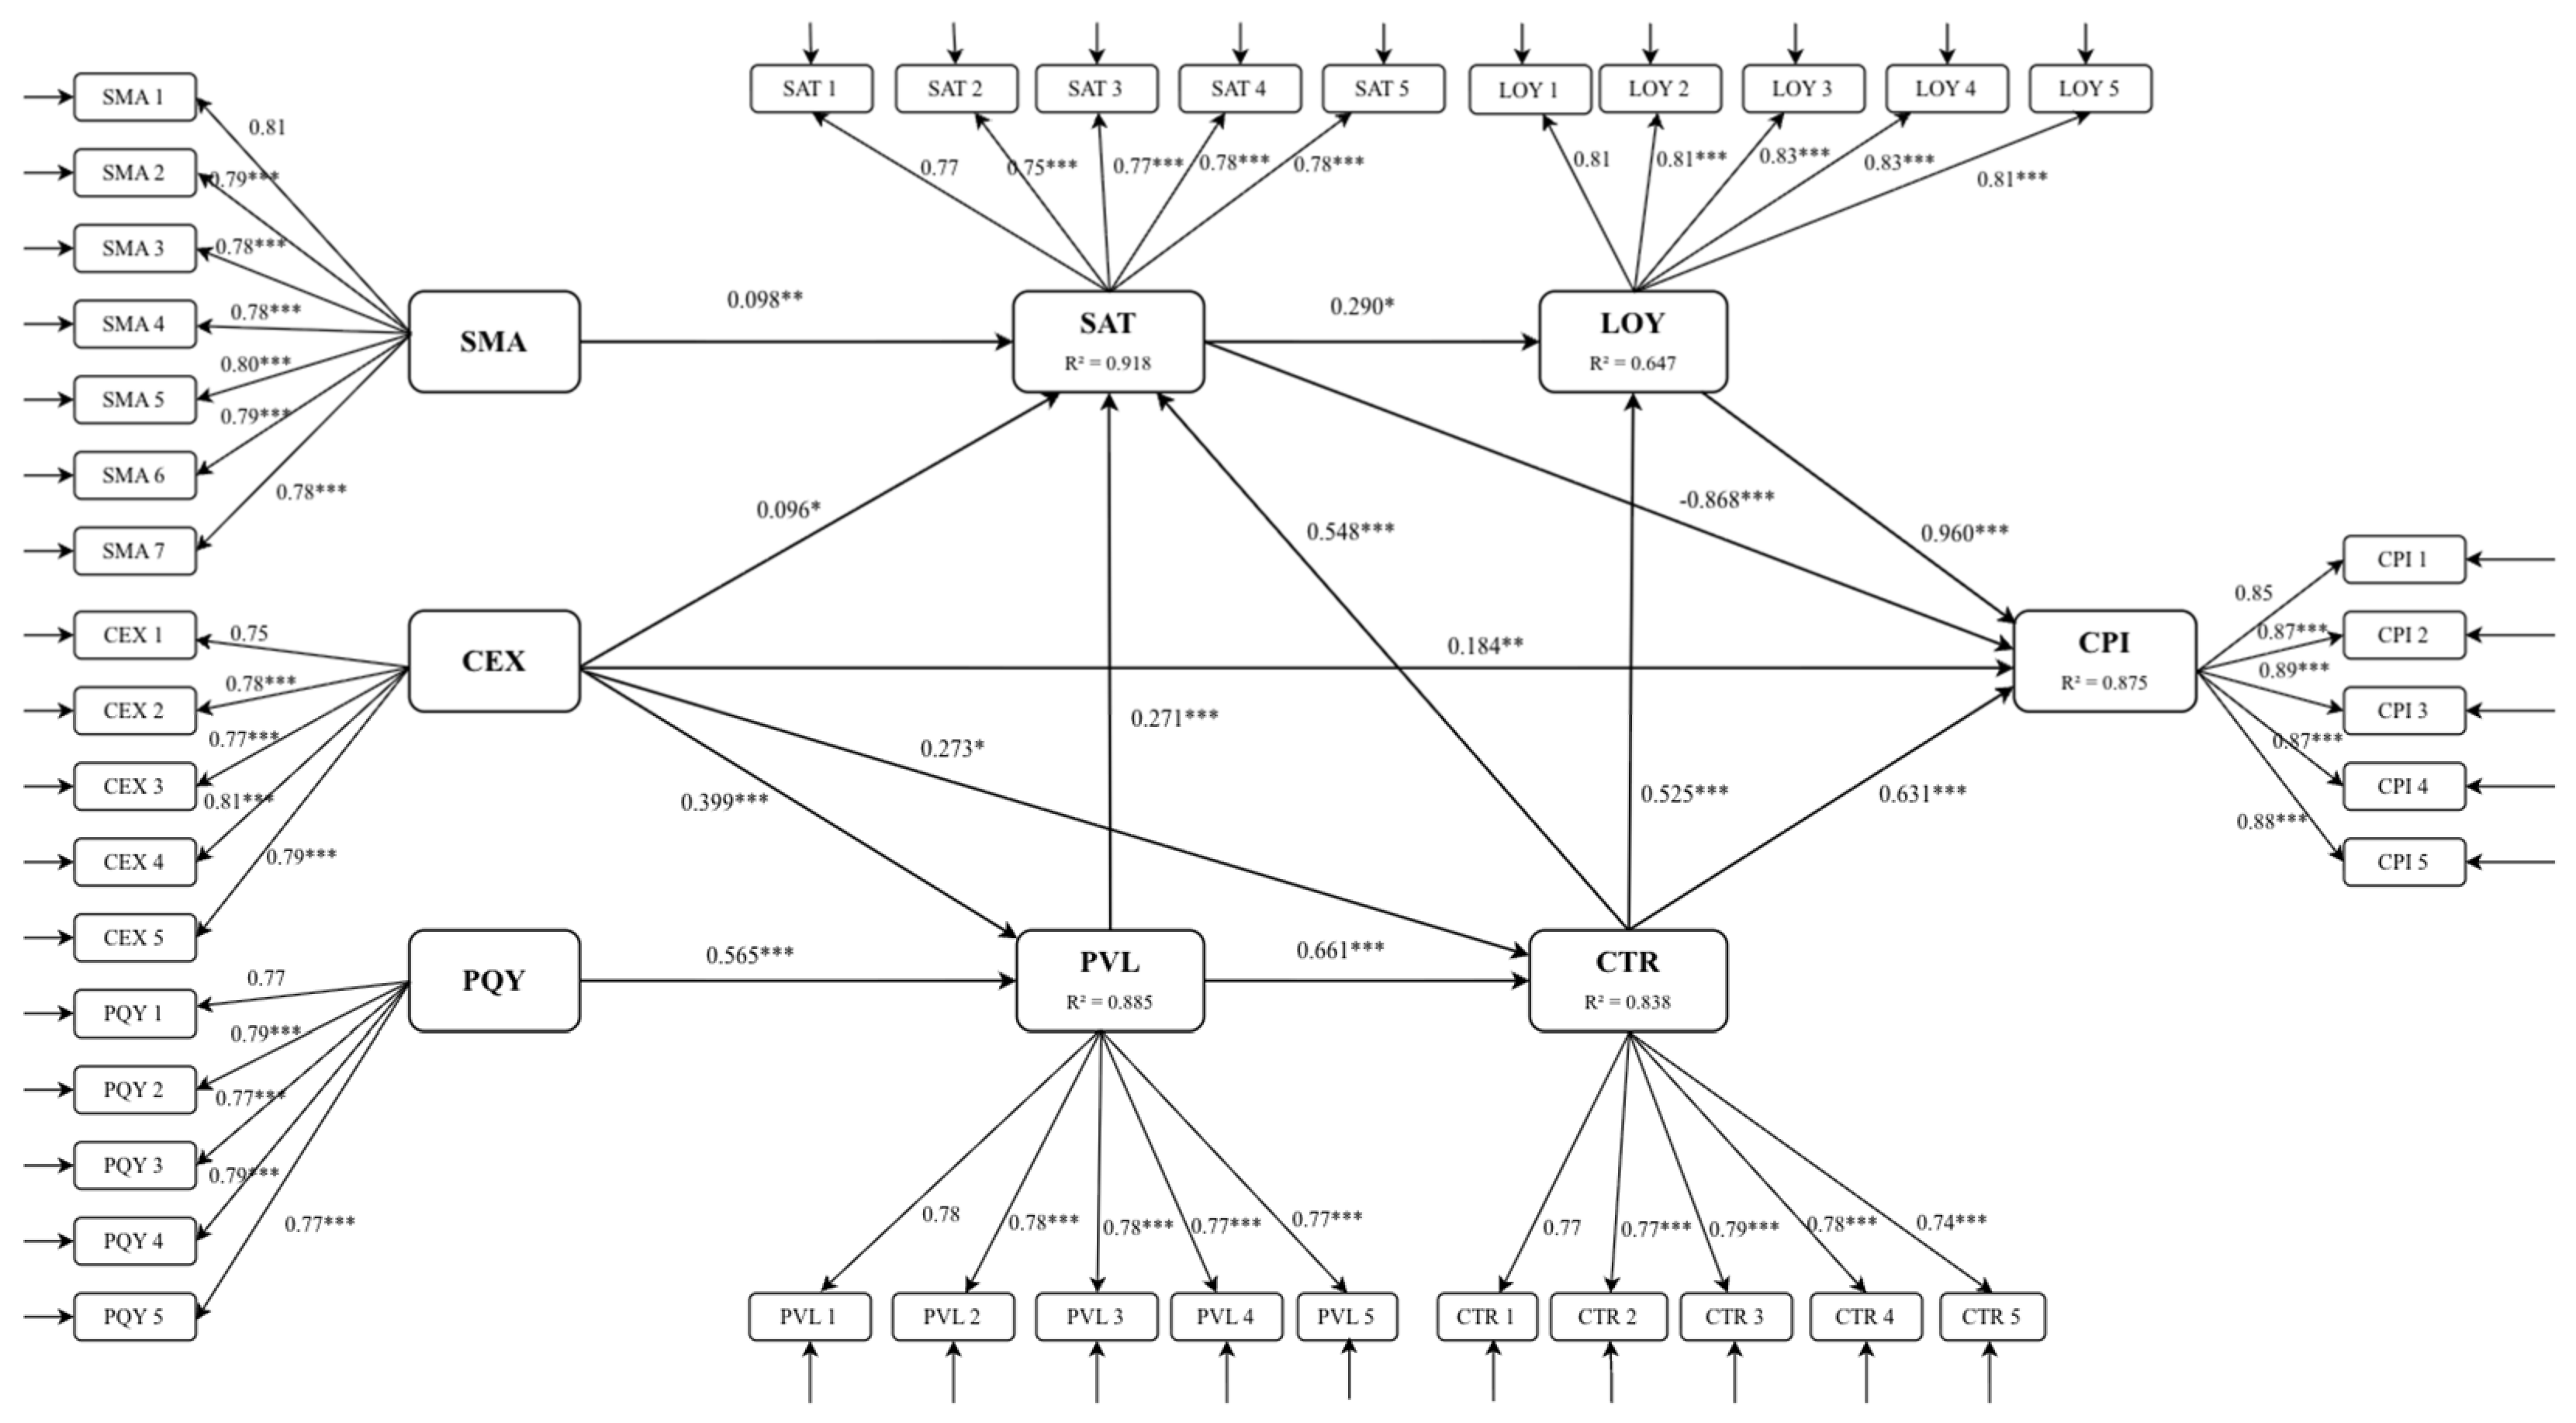
As shown in Table 11, all reported indices were consistent with the conventional reference values used for descriptive model-fit assessment. The χ2/df value (2.686), GFI (0.932), and AGFI (0.921) indicated an acceptable fit, while the CFI (0.971), TLI (0.968), IFI (0.971), NFI (0.954), RMSEA (0.035), and SRMR (0.042) provided further support for the overall fit of the model. Accordingly, the analysis proceeded to assess the hypothesized structural relationships, which are presented in Figure 6.
Figure 6 summarizes the standardized path coefficients and R2 values for the endogenous constructs. All fourteen structural paths were statistically significant. Thirteen hypotheses were supported in the proposed directions, whereas H10 was not supported because the SAT → CPI coefficient was negative, contrary to the hypothesized positive direction. Complete hypothesis-testing results and corresponding effect sizes (f2) are reported in Table 12.

5.2.6. Structural Relationship Analysis

Following the evaluation of the structural model, the hypothesized relationships and their corresponding effect sizes (f2) were examined using structural equation modeling (SEM). The results are presented in Table 12.
As presented in Table 12, all fourteen structural paths were statistically significant, with thirteen hypotheses supported in the hypothesized directions. H10 was not supported because the SAT → CPI coefficient was negative (β = −0.868, p < 0.001), contrary to the hypothesized positive direction. Among the constructs directly associated with CPI, LOY exhibited the largest positive standardized coefficient (β = 0.960, p < 0.001), followed by CTR (β = 0.631, p < 0.001). The f2 values ranged from 0.018 to 0.791, representing negligible to large effect sizes.
Given the unexpected negative SAT → CPI coefficient and the comparatively large LOY → CPI coefficient, a supplementary alternative-model analysis was conducted to assess model specification sensitivity. The hypothesized model, in which the SAT → CPI path was freely estimated, was compared with a nested model in which this path was fixed to zero while all other specifications were retained. The comparative results are presented in Table 13, based on established SEM fit-evaluation principles [46] and information-theoretic model-selection principles using AIC [48].
As shown in Table 13, fixing the SAT → CPI path to zero resulted in a statistically significant deterioration in relative model fit (Δχ2 = 21.855, Δdf = 1, p < 0.001). The hypothesized model also exhibited a lower AIC value than the restricted model (2344.942 versus 2364.797). Although both models were consistent with the conventional reference values for overall fit and differed only marginally in GFI, AGFI, CFI, TLI, RMSEA, and SRMR, the chi-square difference test and AIC favored the hypothesized model. These findings support retaining the freely estimated SAT → CPI path in the reported model.
However, this comparison does not support H10 or establish that the unexpected negative coefficient is substantively robust or causal. The SAT → CPI coefficient was therefore interpreted cautiously as model-conditional, particularly given the elevated empirical overlap between SAT and the conceptually related constructs.
To further examine specification sensitivity, the explained variance of each endogenous construct was compared across the two models. As presented in Table 14, the R2 values for PVL, CTR, and LOY remained nearly unchanged, whereas relatively larger differences were observed for SAT and CPI.
The R2 values for PVL, CTR, and LOY were highly similar across the two models, indicating that constraining the direct SAT → CPI path did not materially alter the explained variance of these constructs. Model 2 produced a higher R2 for SAT (0.948 versus 0.918) and a slightly higher R2 for CPI (0.881 versus 0.875), whereas the R2 for LOY decreased marginally from 0.647 to 0.644. However, the increases in R2 for SAT and CPI do not indicate superior model performance because R2 alone does not determine model preference and the remaining free parameters were re-estimated under the imposed restriction. These changes were therefore interpreted as evidence of specification sensitivity rather than improved explanatory performance. As reported in Table 13, the significant chi-square difference and lower AIC favored Model 1. Taken together, these findings favored retaining the model specification in which the SAT → CPI path was freely estimated, while reinforcing the need to interpret its unexpected negative coefficient cautiously.
To examine whether the broadly similar R2 values concealed changes in the individual structural coefficients, the principal structural paths involving SAT, CTR, LOY, and CPI were subsequently compared. Table 15 presents the standardized coefficients obtained from the hypothesized and restricted models.
As shown in Table 15, fixing the SAT → CPI path to zero was accompanied by substantial changes in several structural coefficients. The SAT → LOY coefficient decreased from 0.290 to 0.144, representing a reduction of approximately 50.3%. The CTR → CPI coefficient changed from positive (β = 0.631) to negative (β = −0.119), whereas the LOY → CPI coefficient increased from 0.960 to 1.033. These changes demonstrate that the coefficients involving SAT, CTR, LOY, and CPI were sensitive to the imposed model restriction.
Together with the statistically significant deterioration in relative model fit reported in Table 13, the chi-square difference and AIC results favored retaining the hypothesized specification in which the SAT → CPI path was freely estimated. Nevertheless, the sign reversal of CTR → CPI and the standardized LOY → CPI coefficient exceeding 1.00 in the restricted model are consistent with specification sensitivity and possible shared variance or suppression among the predictors of CPI. These findings do not establish the robustness or causal meaning of the negative SAT → CPI coefficient. Accordingly, the direct associations of SAT, CTR, and LOY with CPI were interpreted cautiously in light of the coefficient changes observed in the restricted model.

5.2.7. Mediation Analysis

Table 16 reports the bootstrapped direct, indirect, and total associations with CPI and the corresponding mediation classifications.
As presented in Table 16, statistically significant total indirect associations with CPI were identified for SMA (indirect association = −0.058, 95% CI [−0.127, −0.022]), PQY (indirect association = 0.211, 95% CI [0.191, 0.352]), and PVL (indirect association = 0.374, 95% CI [0.353, 0.595]). Because direct paths from these constructs to CPI were not specified, the results were interpreted as indirect associations rather than formal mediation.
CEX and CTR exhibited statistically significant direct associations with CPI, whereas their total indirect associations were not statistically supported because the corresponding confidence intervals included zero. SAT exhibited competitive mediation: its negative direct association with CPI (−0.868) was accompanied by a statistically significant positive indirect association through LOY (0.275, 95% CI [0.230, 0.567]), resulting in a negative total association (−0.593). Therefore, H10 was not supported, and the positive indirect association did not restore support for the hypothesized positive SAT → CPI relationship. Given the unexpected negative direct association and the cross-sectional design, this competitive mediation pattern was interpreted cautiously and should not be regarded as evidence of temporal or causal mediation.
These indirect associations should not be interpreted as temporal or causal mediation because the data were obtained from a cross-sectional self-report survey. Following the SEM analysis, fsQCA was conducted using calibrated construct scores to examine alternative configurations associated with high CPI.

5.3. Configurational Analysis Using fsQCA

Following the SEM analysis, the fsQCA results are presented through calibration, necessity, sufficiency, and robustness assessments.

5.3.1. Calibration of Fuzzy Sets

Prior to the configurational analysis, the original construct scores were transformed into fuzzy-set membership scores using the direct calibration method. As presented in Table 17, three qualitative anchors corresponding to full non-membership, the crossover point, and full membership were specified for each condition and the outcome. The 5th, 50th, and 95th percentiles were used as the respective calibration anchors, consistent with established fsQCA recommendations.
The calibrated membership scores were used in the subsequent necessity and sufficiency analyses.

5.3.2. Necessary Condition Analysis

A necessity analysis was conducted to assess whether the presence or absence of any individual condition could be considered necessary for high continuance purchase intention (CPI). The consistency and coverage values for each condition are presented in Table 18.
As shown in Table 18, neither the presence nor the absence of any individual condition reached the recommended necessity-consistency threshold of 0.90. Therefore, no individual condition was identified as necessary for high continuance purchase intention (CPI). This result supports proceeding to the sufficiency analysis of alternative combinations of conditions.

5.3.3. Sufficiency and Robustness Analysis

Following the necessity analysis, truth table sufficiency analysis was conducted using a baseline frequency threshold of five cases and a row-consistency threshold of 0.8186. Robustness was subsequently assessed by increasing the frequency threshold to 12 and 14 cases while retaining the same row-consistency threshold and all other analytical settings. The comparative results are presented in Table 19.
As shown in Table 19, the baseline analysis identified 12 sufficient configurations, with an overall solution coverage of 0.8416 and an overall solution consistency of 0.8147. Increasing the frequency threshold to 12 and 14 cases reduced the number of configurations to five and four, respectively. Solution coverage decreased to 0.7876 and 0.7722, whereas solution consistency increased to 0.8627 and 0.8666. LOY, CTR, SAT, PVL, and PQY continued to recur across the retained solutions under the alternative thresholds. These findings indicate that the number of retained configurations was sensitive to the frequency threshold, while the recurrence of the principal conditions and the overall solution performance remained reasonably stable. The results therefore provide reasonable evidence of robustness across the evaluated thresholds. The detailed baseline intermediate solution is presented in Table 20.

5.3.4. Baseline Configurational Solution

Following the robustness assessment, the baseline intermediate solution obtained using a frequency threshold of five cases and a row-consistency threshold of 0.8186 is presented in Table 20, which reports the condition patterns and configurational performance measures for each of the 12 configurations associated with high continuance purchase intention (CPI).
The baseline intermediate solution comprised 12 sufficient configurations, with an overall solution coverage of 0.8416 and an overall solution consistency of 0.8147. Across the configurations, raw coverage ranged from 0.304 to 0.672, unique coverage ranged from 0.000 to 0.021, and consistency ranged from 0.819 to 0.945. The small or zero unique-coverage values for several configurations indicate substantial overlap in the portions of the high-CPI outcome covered by the configurations. Accordingly, the configurations should be interpreted as overlapping sufficient patterns rather than as independent or mutually exclusive pathways.

5.3.5. Configurational Interpretation

The fsQCA results identified multiple sufficient configurations associated with high continuance purchase intention (CPI), illustrating equifinality whereby the same outcome was associated with different combinations of transactional and relational conditions [25].
Broadly consistent with the SEM findings, customer trust (CTR) and customer loyalty (LOY) appeared in several configurations, indicating their recurring configurational relevance to high CPI. Although customer satisfaction (SAT) exhibited a significant negative direct association with CPI in the SEM analysis, its presence formed part of several configurations associated with high CPI. This pattern indicates that the configurational relevance of SAT depends on the broader combination of conditions in which it is embedded and should not be interpreted solely from its net association in the SEM model.
Taken together, these configurations reveal conjunctural patterns that cannot be inferred from the individual net associations estimated by SEM.

6. Discussion

This study examined continuance purchase intention (CPI) in high-involvement online furniture commerce using an extended Stimulus–Organism–Response (SOR) framework. Customer loyalty and customer trust exhibited the strongest positive associations with CPI, consistent with prior e-commerce research emphasizing the relevance of relational evaluations to repurchase and continuance intentions [5,12]. Product quality was positively associated with perceived value, while customer experience was positively associated with perceived value, customer satisfaction, customer trust, and CPI. These findings indicate that product evaluations and online retail experiences are associated with both transactional and relational appraisals [2,9]. Because the data were cross-sectional, these relationships should not be interpreted as temporal or causal.

6.1. Interpreting the Satisfaction–Continuance Intention Relationship

The negative SAT → CPI coefficient did not support H10 and should be interpreted as model-conditional rather than as evidence that satisfaction reduces continuance purchase intention. Because satisfaction, trust, loyalty, and CPI were strongly associated and estimated simultaneously, the coefficient represents the unique association of satisfaction with CPI after accounting for shared variance with the other constructs.
The Fornell–Larcker results, elevated HTMT values, and coefficient changes observed in the alternative-model analysis suggested possible empirical overlap, suppression, and specification sensitivity. Although constraining the SAT → CPI path to zero produced a slightly higher R2 for CPI, the significant deterioration in model fit and higher AIC supported retaining the hypothesized specification. The negative coefficient was therefore interpreted cautiously alongside the indirect association through loyalty [49].
Satisfaction also exhibited a significant positive indirect association with CPI through loyalty. The opposite signs of the direct and indirect associations suggest a competitive mediation pattern, while the total association remained negative. Within the SOR organization, the SAT → LOY → CPI pathway suggests that a transactional appraisal may be associated with the response partly through a relational appraisal. Given the cross-sectional design, this finding should be interpreted as associational and does not establish a temporal sequence between the appraisal groups [49].

6.2. Integration of SEM and fsQCA Findings

SEM and fsQCA provided complementary perspectives on CPI. SEM estimated the unique net association of each predictor while accounting for the other predictors, whereas fsQCA identified multiple sufficient configurations associated with high CPI. No individual condition was necessary for high CPI, indicating that the outcome was associated with combinations of conditions rather than with any single factor alone. These configurational findings should be understood as set-theoretic associations rather than as causal claims [23,24,25].
SEM and fsQCA also revealed different but compatible roles for satisfaction. In SEM, the SAT → CPI coefficient represents the unique partial association of satisfaction with CPI after accounting for shared variance with trust, loyalty, and the other predictors. In fsQCA, satisfaction is evaluated as part of combinations of conditions associated with high CPI. Its presence in several high-CPI configurations therefore reflects its configurational relevance and is compatible with its negative model-conditional net coefficient.

6.3. Theoretical Contributions

This study makes three theoretical contributions. First, it organizes the organism component of the SOR framework into transactional appraisals of perceived value and customer satisfaction and relational appraisals of customer trust and customer loyalty. This distinction provides a more structured explanation of the exchange-related and relationship-oriented evaluations associated with continuance purchasing [14,15,16,17].
Second, the findings show that these appraisal categories are conceptually distinguishable yet empirically interconnected. The associations among perceived value, satisfaction, trust, and loyalty illustrate their complementary roles while retaining their theoretically specified treatment as distinct first-order constructs. This conceptual organization does not imply higher-order factors or temporal progression between the appraisal categories.
Third, combining SEM and fsQCA broadens the explanation of CPI beyond individual net associations. SEM identifies the unique association of each predictor, whereas fsQCA captures equifinality by revealing multiple configurations associated with high CPI. Together, these approaches provide complementary variable-oriented and configurational perspectives on continuance purchasing in high-involvement online commerce.

6.4. Practical Implications

The findings highlight trust and loyalty as important relational factors associated with continuance purchase intention. The model-conditional SAT → CPI result does not diminish the managerial importance of customer satisfaction. Rather, the significant positive indirect association through loyalty suggests that satisfaction may be particularly relevant when considered together with relationship-building outcomes. Retailers should therefore reinforce satisfactory experiences through consistent service, reliable transactions, responsive complaint handling, and appropriate relationship-maintenance programs.
Online furniture retailers should also reduce purchasing uncertainty by providing accurate product descriptions, realistic multi-angle images, transparent pricing, secure payment processes, reliable delivery, clear return policies, and responsive after-sales support. Information concerning materials, durability, dimensions, functionality, warranties, delivery conditions, and customization options may assist consumers in evaluating product quality and perceived value.
Finally, the fsQCA findings suggest that there is no single universal route to high CPI. Retailers may therefore coordinate product quality, customer experience, trust-building, transaction security, and post-purchase support flexibly according to customer needs and purchasing situations. Because these recommendations are derived from observed associations, their effectiveness should be further evaluated within specific organizational and market contexts.

7. Conclusions, Limitations, and Future Research

7.1. Conclusions

This study extended the Stimulus–Organism–Response (SOR) framework by conceptually organizing perceived value and customer satisfaction as transactional appraisals and customer trust and customer loyalty as relational appraisals. The SEM results identified loyalty and trust as having the strongest positive associations with CPI, highlighting the relevance of relationship-oriented evaluations in high-involvement online furniture commerce [5,12,26].
Satisfaction was positively associated with CPI indirectly through loyalty, whereas its hypothesized positive direct association was not supported. The fsQCA results complemented the SEM findings by identifying multiple configurations associated with high CPI. Taken together, the findings demonstrate the value of examining transactional and relational appraisals jointly. The dual-layer framework should be understood as a theoretical organizing perspective rather than as evidence of higher-order constructs or temporal progression between the appraisal categories.

7.2. Limitations and Future Research

The findings should be considered in light of several limitations. First, the negative SAT → CPI coefficient should be interpreted in the context of the simultaneous estimation of correlated predictors and the sensitivity of the coefficient to model specification. Nevertheless, the nested-model comparison favored retaining the theory-specified path based on overall model fit and AIC. Future research could further examine this relationship using theoretically justified alternative specifications and independent samples.
Second, the study focused on Thai consumers with previous online furniture purchasing experience. The cultural context and the characteristics of furniture as a durable, high-involvement product may limit the generalizability of the findings to other countries and product categories. Future studies could examine the framework across different cultural settings and comparable high-involvement products.
Third, purposive non-probability sampling was used because no identifiable sampling frame was available. Although this approach enabled the recruitment of consumers with relevant purchasing experience, it limited population-level generalization and prevented the calculation of a conventional response rate. Future research could employ broader recruitment channels, probability-based sampling, or clearly defined sampling frames where feasible.
Fourth, the cross-sectional self-report design limits temporal and causal interpretation and does not entirely exclude the possibility of common method bias. The common latent factor analysis showed only small changes in the standardized loadings, and all full-collinearity VIF values remained below 5.00, although most exceeded the conservative benchmark of 3.30. Future studies could strengthen the evidence through longitudinal or multi-wave designs, temporal separation, and multiple data sources.
Fifth, the Fornell–Larcker criterion and five descriptive HTMT values above 0.90 suggested potential empirical overlap among several constructs. However, none of the bootstrapped 95% confidence intervals included 1.00, providing support for construct distinction under the inferential HTMT criterion [44,45]. These mixed results warrant cautious interpretation and provide an opportunity for future research to refine potentially overlapping items and compare theoretically grounded measurement models using independent samples [51,52].
Sixth, the principal fsQCA solution patterns remained reasonably stable across the alternative frequency thresholds, although the exact configurations depended on the selected calibration anchors, frequency threshold, and consistency criterion. Some configurations also exhibited limited unique coverage and should therefore be interpreted as overlapping sufficient patterns rather than fully distinct pathways. Future research could assess their robustness using alternative calibration schemes and independent datasets.
Finally, the dual-layer perspective was intentionally specified as a conceptual organization of distinct first-order constructs rather than as a higher-order or temporally sequential structure. Future research may examine whether alternative hierarchical or longitudinal formulations are theoretically warranted and empirically supported.

Author Contributions

Conceptualization, T.A., S.L. and S.P.; methodology, T.A., S.L. and S.P.; formal analysis, T.A., S.L. and S.P.; investigation, T.A.; resources, T.A.; data curation, T.A.; writing—original draft preparation, T.A.; writing—review and editing, T.A., S.L. and S.P.; supervision, S.L. and S.P.; project administration, T.A. All authors have read and agreed to the published version of the manuscript.

Funding

This research received no external funding.

Institutional Review Board Statement

The study was conducted in accordance with the Declaration of Helsinki and approved by the Human Research Ethics Committee of Rangsit University (COA No. RSUERB2025-177, dated 30 July 2025).

Informed Consent Statement

Informed consent was obtained from all subjects involved in the study. Participation was voluntary, and respondents were informed of their rights, including the right to withdraw at any point without consequence.

Data Availability Statement

The datasets generated and analyzed during the current study are available from the corresponding author upon reasonable request.

Acknowledgments

The authors would like to thank all participants in this research project and Rangsit University.

Conflicts of Interest

The authors declare no conflicts of interest.

Abbreviations

The following abbreviations are used in this manuscript:
SORStimulus–Organism–Response
SEM Structural equation modeling
SMA Social media marketing activity
CEX Customer experience
PQY Product quality
SAT Customer satisfaction
PVL Perceived value
LOY Customer loyalty
CTR Customer trust
CPI Continuance purchase intention

References

  1. Zhang, S.; Zhu, J.; Wang, G.; Reng, S.; Yan, H. Furniture online consumer experience: A literature review. BioResources 2022, 17, 1627–1642. [Google Scholar] [CrossRef]
  2. Yu, C.; Liu, W.; Fei, Y.; Chen, J.; Hu, Z. Influencing factors of online furniture purchase behavior based on the analytic hierarchy process. BioResources 2023, 18, 2857–2873. [Google Scholar] [CrossRef]
  3. Shi, Y.; Zhao, E.; Li, M. Optimizing furniture retail strategies: Insights from cross-platform consumer sentiment and topic modeling. J. Theor. Appl. Electron. Commer. Res. 2025, 20, 258. [Google Scholar] [CrossRef]
  4. Liu, X.; Zhang, C.; Wu, J. Explaining consumers’ continuance purchase intention toward subscriber-based knowledge payment platforms: Findings from PLS-SEM and fsQCA. Aslib J. Inf. Manag. 2024, 76, 189–211. [Google Scholar] [CrossRef]
  5. Fei, L.G.; Liu, X.; Jin, Y.C.; Su, M. Reconstruction of logistics services in cross-border e-commerce and consumer continuance intention on platforms: The mediating role of digital logistics services. J. Theor. Appl. Electron. Commer. Res. 2025, 20, 251. [Google Scholar] [CrossRef]
  6. Li, S.; Zhang, Y.; Tang, Y.; Zhao, W.; Yu, Z. Impact mechanisms of consumer impulse buying in accumulative social live shopping: Considering the moderating role of para-social relationships. J. Theor. Appl. Electron. Commer. Res. 2025, 20, 66. [Google Scholar] [CrossRef]
  7. Jeon, H.G.; Kim, C.; Lee, J.; Lee, K.C. Understanding e-commerce consumers’ repeat purchase intention: The role of trust transfer and the moderating effect of neuroticism. Front. Psychol. 2021, 12, 690039. [Google Scholar] [CrossRef] [PubMed]
  8. Blut, M.; Chaney, D.; Lunardo, R.; Mencarelli, R.; Grewal, D. Customer perceived value: A comprehensive meta-analysis. J. Serv. Res. 2024, 27, 501–524. [Google Scholar] [CrossRef]
  9. Ananda, A.S.; Hanny, H.; Hernández, Á.; Prasetya, P. Stimuli are all around: The influence of offline and online servicescapes on customer satisfaction and repurchase intention. J. Theor. Appl. Electron. Commer. Res. 2023, 18, 524–547. [Google Scholar] [CrossRef]
  10. Guo, J.; Zhang, W.; Xia, T. Impact of shopping website design on customer satisfaction and loyalty: The mediating role of usability and the moderating role of trust. Sustainability 2023, 15, 6347. [Google Scholar] [CrossRef]
  11. Jeong, J.; Kim, D.; Li, X.; Li, Q.; Choi, I.; Kim, J. An empirical investigation of personalized recommendation and reward effect on customer behavior: A stimulus–organism–response (SOR) model perspective. Sustainability 2022, 14, 15369. [Google Scholar] [CrossRef]
  12. Pires, P.B.; Perestrelo, B.M.; Santos, J.D. Unpacking customer experience in online shopping: Effects on satisfaction and loyalty. J. Theor. Appl. Electron. Commer. Res. 2025, 20, 245. [Google Scholar] [CrossRef]
  13. Paștiu, C.A.; Oncioiu, I.; Gârdan, D.A.; Maican, S.T.; Gârdan, I.P.; Muntean, A.C. The perspective of e-business sustainability and website accessibility of online stores. Sustainability 2020, 12, 9780. [Google Scholar] [CrossRef]
  14. Cai, X.; Suh, W. Exploring the impact of streamer competencies and situational factors on consumers’ purchase intention in live commerce: A stimulus–organism–response perspective. J. Theor. Appl. Electron. Commer. Res. 2025, 20, 296. [Google Scholar] [CrossRef]
  15. Lee, C.H.; Chen, C.W. Impulse buying behaviors in live streaming commerce based on the stimulus–organism–response framework. Information 2021, 12, 241. [Google Scholar] [CrossRef]
  16. Zhou, T.; Li, S. Examining consumer impulsive purchase intention in virtual AI streaming: A S-O-R perspective. J. Theor. Appl. Electron. Commer. Res. 2025, 20, 204. [Google Scholar] [CrossRef]
  17. Shui, X.; Bian, S.; Zhang, P. How can AI virtual streamers gain consumer trust to influence purchase intention in live-streaming e-commerce? J. Theor. Appl. Electron. Commer. Res. 2025, 20, 325. [Google Scholar] [CrossRef]
  18. Rehman, F.U.; Zahid, H.; Qayyum, A.; Jamil, R.A. Building relationship equity: Role of social media marketing activities, customer engagement, and relational benefits. J. Theor. Appl. Electron. Commer. Res. 2025, 20, 223. [Google Scholar] [CrossRef]
  19. Pires, P.B.; Prisco, M.; Delgado, C.; Santos, J.D. A conceptual approach to understanding the customer experience in e-commerce: An empirical study. J. Theor. Appl. Electron. Commer. Res. 2024, 19, 1943–1983. [Google Scholar] [CrossRef]
  20. Yang, Z.; Peterson, R.T. Customer perceived value, satisfaction, and loyalty: The role of switching costs. Psychol. Mark. 2004, 21, 799–822. [Google Scholar] [CrossRef]
  21. Kurniadi, H.; Rana, J.A.S. The power of trust: How does consumer trust impact satisfaction and loyalty in Indonesian digital business? Innov. Mark. 2023, 19, 236–249. [Google Scholar] [CrossRef]
  22. Ashiq, R.; Hussain, A. Exploring the effects of e-service quality and e-trust on consumers’ e-satisfaction and e-loyalty: Insights from online shoppers in Pakistan. J. Electron. Bus. Digit. Econ. 2024, 3, 117–141. [Google Scholar] [CrossRef]
  23. Kumar, S.; Sahoo, S.; Lim, W.M.; Kraus, S.; Bamel, U. Fuzzy-set qualitative comparative analysis (fsQCA) in business and management research: A contemporary overview. Technol. Forecast. Soc. Change 2022, 178, 121599. [Google Scholar] [CrossRef]
  24. Pappas, I.O.; Woodside, A.G. Fuzzy-set qualitative comparative analysis (fsQCA): Guidelines for research practice in information systems and marketing. Int. J. Inf. Manag. 2021, 58, 102310. [Google Scholar] [CrossRef]
  25. Misangyi, V.F.; Greckhamer, T.; Furnari, S.; Fiss, P.C.; Crilly, D.; Aguilera, R. Embracing causal complexity: The emergence of a neo-configurational perspective. J. Manag. 2017, 43, 255–282. [Google Scholar] [CrossRef]
  26. Mehrabian, A.; Russell, J.A. An Approach to Environmental Psychology; MIT Press: Cambridge, MA, USA, 1974. [Google Scholar]
  27. Hipólito, F.; Dias, Á.; Pereira, L. Influence of consumer trust, return policy, and risk perception on satisfaction with the online shopping experience. Systems 2025, 13, 158. [Google Scholar] [CrossRef]
  28. Quintus, M.; Mayr, K.; Hofer, K.M.; Chiu, Y.T. Managing consumer trust in e-commerce: Evidence from advanced versus emerging markets. Int. J. Retail Distrib. Manag. 2024, 52, 1038–1056. [Google Scholar] [CrossRef]
  29. Zou, H.; Qureshi, I.; Fang, Y.; Sun, H.; Lim, K.H.; Ramsey, E.; McCole, P. Investigating the nonlinear and conditional effects of trust: The new role of institutional contexts in online repurchase. Inf. Syst. J. 2023, 33, 486–523. [Google Scholar] [CrossRef]
  30. Sohaib, M.; Safeer, A.A.; Majeed, A. Role of social media marketing activities in China’s e-commerce industry: A stimulus–organism–response theory context. Front. Psychol. 2022, 13, 941058. [Google Scholar] [CrossRef] [PubMed]
  31. Moslehpour, M.; Ismail, T.; Purba, B.; Wong, W.K. What makes GO-JEK go in Indonesia? The influences of social media marketing activities on purchase intention. J. Theor. Appl. Electron. Commer. Res. 2021, 17, 89–103. [Google Scholar] [CrossRef]
  32. Wibowo, A.; Chen, S.C.; Wiangin, U.; Ma, Y.; Ruangkanjanases, A. Customer behavior as an outcome of social media marketing: The role of social media marketing activity and customer experience. Sustainability 2021, 13, 189. [Google Scholar] [CrossRef]
  33. Ibrahim, B.; Aljarah, A.; Sawaftah, D. Linking social media marketing activities to revisit intention through brand trust and brand loyalty on the coffee shop Facebook pages: Exploring the sequential mediation mechanism. Sustainability 2021, 13, 2277. [Google Scholar] [CrossRef]
  34. Althuwaini, S. The effect of social media activities on brand loyalty for banks: The role of brand trust. Adm. Sci. 2022, 12, 148. [Google Scholar] [CrossRef]
  35. Rahman, S.M.; Carlson, J.; Gudergan, S.P.; Wetzels, M.; Grewal, D. Perceived omnichannel customer experience (OCX): Concept, measurement, and impact. J. Retail. 2022, 98, 611–632. [Google Scholar] [CrossRef]
  36. Ahmad, F.; Mustafa, K.; Hamid, S.A.R.; Khawaja, K.F.; Zada, S.; Jamil, S.; Qaisar, M.N.; Vega-Muñoz, A.; Contreras-Barraza, N.; Anwer, N. Online customer experience leads to loyalty via customer engagement: Moderating role of value co-creation. Front. Psychol. 2022, 13, 897851. [Google Scholar] [CrossRef] [PubMed]
  37. Yi, M.; Chen, M.; Yang, J. Understanding the self-perceived customer experience and repurchase intention in live streaming shopping: Evidence from China. Humanit. Soc. Sci. Commun. 2024, 11, 202. [Google Scholar] [CrossRef]
  38. Kang, J.W.; Namkung, Y. The role of service quality attributes and perceived value in US consumers’ impulsive buying intentions for fresh food e-commerce. J. Theor. Appl. Electron. Commer. Res. 2024, 19, 1893–1906. [Google Scholar] [CrossRef]
  39. Yum, K.; Kim, J. The influence of perceived value, customer satisfaction, and trust on loyalty in entertainment platforms. Appl. Sci. 2024, 14, 5763. [Google Scholar] [CrossRef]
  40. Kim, J.; Yum, K. Enhancing continuous usage intention in e-commerce marketplace platforms: The effects of service quality, customer satisfaction, and trust. Appl. Sci. 2024, 14, 7617. [Google Scholar] [CrossRef]
  41. Dragostinov, Y.; Harðardóttir, D.; McKenna, P.E.; Robb, D.A.; Nesset, B.; Ahmad, M.I.; Romeo, M.; Lim, M.Y.; Yu, C.; Jang, Y.; et al. Preliminary psychometric scale development using the mixed methods Delphi technique. Methods Psychol. 2022, 7, 100103. [Google Scholar] [CrossRef]
  42. Kock, N. Common method bias in PLS-SEM: A full collinearity assessment approach. Int. J. E-Collab. 2015, 11, 1–10. [Google Scholar] [CrossRef]
  43. Ringle, C.M.; Sarstedt, M.; Sinkovics, N.; Sinkovics, R.R. A perspective on using partial least squares structural equation modelling in data articles. Data Brief 2023, 48, 109074. [Google Scholar] [CrossRef] [PubMed]
  44. Fornell, C.; Larcker, D.F. Evaluating structural equation models with unobservable variables and measurement error. J. Mark. Res. 1981, 18, 39–50. [Google Scholar] [CrossRef]
  45. Henseler, J.; Ringle, C.M.; Sarstedt, M. A new criterion for assessing discriminant validity in variance-based structural equation modeling. J. Acad. Mark. Sci. 2015, 43, 115–135. [Google Scholar] [CrossRef]
  46. Hair, J.F.; Babin, B.J.; Ringle, C.M.; Sarstedt, M.; Becker, J.-M. Covariance-based structural equation modeling (CB-SEM): A SmartPLS 4 software tutorial. J. Mark. Anal. 2025, 13, 709–724. [Google Scholar] [CrossRef]
  47. Selya, A.S.; Rose, J.S.; Dierker, L.C.; Hedeker, D.; Mermelstein, R.J. A practical guide to calculating Cohen’s f2, a measure of local effect size, from PROC MIXED. Front. Psychol. 2012, 3, 111. [Google Scholar] [CrossRef] [PubMed]
  48. Portet, S. A primer on model selection using the Akaike Information Criterion. Infect. Dis. Model. 2020, 5, 111–128. [Google Scholar] [CrossRef] [PubMed]
  49. Nitzl, C.; Roldán, J.L.; Cepeda, G. Mediation analysis in partial least squares path modeling: Helping researchers discuss more sophisticated models. Ind. Manag. Data Syst. 2016, 116, 1849–1864. [Google Scholar] [CrossRef]
  50. Cangur, S.; Ercan, I. Comparison of model fit indices used in structural equation modeling under multivariate normality. J. Mod. Appl. Stat. Methods 2015, 14, 152–167. [Google Scholar] [CrossRef]
  51. Voorhees, C.M.; Brady, M.K.; Calantone, R.; Ramirez, E. Discriminant validity testing in marketing: An analysis, causes for concern, and proposed remedies. J. Acad. Mark. Sci. 2016, 44, 119–134. [Google Scholar] [CrossRef]
  52. Rönkkö, M.; Cho, E. An updated guideline for assessing discriminant validity. Organ. Res. Methods 2022, 25, 6–14. [Google Scholar] [CrossRef]
Figure 1. Extended Stimulus–Organism–Response framework for continuance purchase intention in online furniture commerce.
Jtaer 21 00255 g001
Figure 2. Structural research model and hypothesized relationships.
Jtaer 21 00255 g002
Figure 3. Sequential mixed-methods research process integrating e-Delphi, CB-SEM, and fsQCA.
Jtaer 21 00255 g003
Figure 4. Qualitative-stage construct validation and instrument development (e-Delphi).
Jtaer 21 00255 g004
Figure 5. Quantitative research process integrating CB-SEM and fsQCA.
Jtaer 21 00255 g005
Figure 6. Standardized structural equation modeling results for the proposed extended Stimulus–Organism–Response (SOR) framework. Note: Values shown on the structural paths are standardized path coefficients, whereas values shown on the measurement paths are standardized factor loadings. Statistical significance is denoted as follows: * p < 0.05, ** p < 0.01, and *** p < 0.001. R2 values shown within the endogenous constructs represent the proportion of variance explained. Single-headed arrows indicate the direction of the structural and measurement relationships.
Jtaer 21 00255 g006
Table 1. Comparison of relevant e-commerce and furniture studies and positioning of the present study.
StudyTheoretical LensResearch Context and Key ConstructsResponse OutcomeRelevance to the Present Study and Remaining Gap
Ananda et al. (2023) [9]Servicescape framework grounded in the SOR logicMultichannel retailing; offline and online servicescape quality and customer satisfactionRepurchase intentionDemonstrates that environmental and service-quality stimuli are associated with customer satisfaction and repurchase intention. However, it does not incorporate perceived value, customer trust, and customer loyalty as distinct but interconnected organismic appraisals, nor does it examine continuance purchase intention in high-involvement online furniture commerce.
Rehman et al. (2025) [18]Social Exchange TheorySocial media marketing activities, customer engagement, relational benefits, and relationship equityRelationship equityEstablishes the role of social media marketing activities in fostering engagement and long-term customer relationships. However, the reviewed study was conducted in the banking sector and did not examine product quality, continuance purchase intention, or the full S–O–R mechanism in a high-involvement online retail context.
Pires et al. (2025) [12]Experience–satisfaction–loyalty frameworkOnline shopping; customer experience, satisfaction, and loyaltyCustomer loyalty and eWOMProvides empirical support for the relationships among customer experience, satisfaction, and loyalty in e-commerce. However, it does not integrate perceived value and customer trust as distinct transactional and relational appraisals within the organism component of the SOR framework or examine how these interconnected appraisals are associated with continuance purchase intention in high-involvement online furniture commerce.
Yu et al. (2023) [2]Analytic hierarchy processOnline furniture purchasing; product, platform, logistics, and service factorsOnline furniture purchase behaviorProvides furniture-specific evidence on product, platform, logistics, and service-related factors associated with online furniture purchasing. However, it does not employ the SOR framework, distinguish perceived value and satisfaction as transactional appraisals from trust and loyalty as relational appraisals, or examine their associations with continuance purchase intention.
Cai and Suh (2025) [14]Stimulus–Organism–Response frameworkLive commerce; streamer competencies and situational factors as stimuli; perceived functional value and trust as internal statesPurchase intentionShows that e-commerce stimuli are associated with purchase intention through perceived value and trust. However, it focuses on initial purchase intention and does not integrate satisfaction and loyalty with these constructs within a dual-layer organismic structure or examine continuance purchase intention in a post-purchase context.
Fei et al. (2025) [5]Social Exchange Theory and Resource Dependence TheoryCross-border e-commerce; logistics process reengineering and digital logistics servicesConsumer continuance intentionIdentifies continuance intention as an important post-adoption outcome in e-commerce. However, the model emphasizes organizational and logistics processes rather than explaining continuance purchase intention through consumer-level transactional appraisals (perceived value and satisfaction) and relational appraisals (trust and loyalty).
Shi et al. (2025) [3]Consumer sentiment and topic-modeling perspectiveFurniture reviews from the Jingdong and Taobao e-commerce platforms; product quality, materials, esthetics, price, service, logistics, and brand trustConsumer sentiment and platform-specific preferencesProvides furniture-specific evidence of the importance of product quality, value-related considerations, service, and trust in online retailing. However, it does not integrate these factors within an SOR framework that distinguishes transactional appraisals (perceived value and satisfaction) from relational appraisals (trust and loyalty) or examines their associations with continuance purchase intention.
Present StudyExtended SOR frameworkHigh-involvement online furniture commerce; social media marketing activity, customer experience, and product quality as stimuli; perceived value, satisfaction, trust, and loyalty as organism statesContinuance purchase intention (CPI)Integrates perceived value and satisfaction as transactional appraisals and customer trust and customer loyalty as relational appraisals within the organism component of the SOR framework, and examines their distinct and interconnected associations with CPI in high-involvement online furniture commerce.
Note: SOR = Stimulus–Organism–Response; CPI = continuance purchase intention; eWOM = electronic word-of-mouth. The remaining gaps were synthesized by the authors based on the theoretical scope, constructs, and research contexts of the reviewed studies.
Table 2. Analytical thresholds applied in the fsQCA analysis.
Assessment CriterionThreshold AppliedJustification
Calibration anchors95th/50th/5th percentilesPercentile-based empirical anchors were used because no substantively established external calibration standards were available for the study constructs.
Necessity consistency threshold≥0.90Conditions meeting this threshold were considered potentially necessary for high CPI and were interpreted together with their necessity coverage.
Frequency threshold5 casesThe threshold excluded sparsely populated truth table rows while retaining sufficient empirical diversity for the baseline analysis. Robustness was assessed using higher thresholds of 12 and 14 cases.
Raw consistency threshold0.8186The threshold was selected by examining the distribution of truth table consistency scores and identifying a clear break between retained and excluded configurations.
PRI consistency threshold≥0.70The threshold was used to reduce the retention of configurations simultaneously associated with both the presence and absence of the outcome.
Note: PRI = proportional reduction in inconsistency; CPI = Continuance Purchase Intention. The baseline thresholds were selected based on established fsQCA guidance and the empirical distribution of the data. Robustness was assessed using alternative frequency thresholds of 12 and 14 cases.
Table 3. Construct-level results of the three-round e-Delphi process.
ConstructNo. of ItemsMeanSDCVConsensus
Social Media Marketing Activity (SMA)76.4210.7900.123Achieved
Product Quality (PQY)56.4000.7910.124Achieved
Customer Experience (CEX)56.3790.9700.152Achieved
Perceived Value (PVL)56.5890.5920.090Achieved
Customer Satisfaction (SAT)56.4110.7790.121Achieved
Customer Trust (CTR)56.2420.9530.153Achieved
Customer Loyalty (LOY)56.2740.8560.136Achieved
Continuance Purchase Intention (CPI)56.1370.9850.161Achieved
Note: Mean = average expert rating; SD = standard deviation; CV = coefficient of variation. Consensus was considered achieved when the mean score was ≥6.00 and the CV was <0.20. The expert panel comprised 19 participants.
Table 4. Demographic characteristics of the respondents (N = 1351).
VariableCategoryFrequencyPercentage
SexMale51037.75%
Female80259.36%
Prefer not to specify392.89%
Age18–25 years old21015.54%
26–30 years old1007.40%
31–40 years old41330.57%
41–50 years old48535.90%
51–60 years old1118.22%
More than 60 years old322.37%
Educational LevelBelow Bachelor’s Degree32323.91%
Bachelor’s Degree84362.40%
Master’s Degree17012.58%
Doctoral Degree (PhD)151.11%
Monthly Income20,000 Baht or below36527.02%
20,001–40,000 Baht64147.45%
40,001–60,000 Baht25919.17%
60,001–80,000 Baht503.70%
More than 80,000 Baht362.66%
OccupationGovernment Officer/State Enterprise Employee18013.32%
Private Company Employee58543.30%
Student16312.07%
Business Owner16211.99%
Freelancer/Self-Employed25919.17%
Others20.15%
Social Media Application UsageTikTok37427.68%
Instagram1047.70%
YouTube816.00%
Facebook48635.97%
Website30322.43%
Other30.22%
Online Usage TimeLess than 30 min per day16512.21%
30 min to 1 h per day36426.94%
1 to 2 h per day44432.86%
More than 2 h per day37827.98%
Furniture Purchasing BudgetBelow 1000 Baht28220.87%
1001–5000 Baht40730.13%
5001–10,000 Baht30622.65%
10,001–15,000 Baht15611.55%
15,001–20,000 Baht1067.85%
More than 20,000 Baht946.96%
Note: Social media application usage refers to the platform used most frequently. Percentages may not total exactly 100% because of rounding.
Table 5. Measurement model assessment: reliability, convergent validity, and collinearity diagnostics.
ConstructItemFactor Loading (λ)VIFCronbach’s AlphaCRAVE
Social Media Marketing Activity (SMA)SMA10.812.6390.910.9210.624
SMA20.792.456
SMA30.782.279
SMA40.782.406
SMA50.802.448
SMA60.792.398
SMA70.782.236
Customer Experience (CEX)CEX10.752.0570.880.8860.609
CEX20.782.137
CEX30.772.159
CEX40.812.053
CEX50.792.190
Product Quality (PQY)PQY10.772.1530.890.8850.605
PQY20.792.201
PQY30.771.907
PQY40.792.034
PQY50.772.243
Perceived Value (PVL)PVL10.782.2740.900.8830.602
PVL20.782.118
PVL30.782.015
PVL40.772.008
PVL50.772.178
Customer Trust (CTR)CTR10.772.2940.890.8790.593
CTR20.772.129
CTR30.791.835
CTR40.782.140
CTR50.742.138
Customer Satisfaction (SAT)SAT10.772.1940.870.8790.593
SAT20.752.181
SAT30.772.127
SAT40.782.156
SAT50.782.401
Customer Loyalty (LOY)LOY10.812.6180.910.9100.669
LOY20.812.621
LOY30.832.403
LOY40.833.047
LOY50.813.646
Continuance Purchase Intention (CPI)CPI10.853.7710.920.9410.761
CPI20.873.633
CPI30.893.541
CPI40.872.639
CPI50.882.456
Note: λ = standardized factor loading; VIF = variance inflation factor; CR = composite reliability; AVE = average variance extracted. All VIF values were below 5.00.
Table 6. Full-collinearity VIF assessment for common method bias.
ConstructFull Collinearity VIF
CEX4.230
CTR4.429
LOY4.121
PQY4.561
PVL4.627
SAT4.654
SMA3.753
CPI3.046
Note: VIF = variance inflation factor; CMB = common method bias. Values exceeding 3.30 indicate a potential CMB concern, whereas values of 5.00 or higher indicate a more substantial collinearity concern [42,43].
Table 7. Summary of common latent factor assessment.
ConstructNumber of ItemsRange of Absolute Loading DifferencesMaximum DifferenceItem with Maximum Difference
SMA70.0046–0.01750.0175SMA1
PQY50.0070–0.01490.0149PQY5
CEX50.0009–0.01300.0130CEX1
PVL50.0103–0.01390.0139PVL1
SAT50.0064–0.01210.0121SAT5
CTR50.0017–0.01370.0137CTR1
LOY50.0004–0.00420.0042LOY1
CPI50.0001–0.00090.0009CPI1
Overall420.0001–0.01750.0175SMA1
Note: CLF = common latent factor. Absolute loading differences represent the absolute differences between standardized loadings obtained from the baseline and CLF-adjusted measurement models.
Table 8. Discriminant validity assessment using the Fornell–Larcker criterion.
ConstructSMACEXPQYPVLCTRSATLOYCPI
SMA0.790
CEX0.8630.780
PQY0.9210.9200.778
PVL0.8650.9220.9260.776
CTR0.8100.8910.8780.9190.770
SAT0.8510.8980.8990.9240.9480.770
LOY0.7050.7760.7500.7830.8730.8150.818
CPI0.6020.6650.6260.6560.7600.6870.9080.872
Note: Diagonal values represent the square roots of AVE, whereas off-diagonal values represent inter-construct correlations.
Table 9. Discriminant validity assessment using the heterotrait–monotrait ratio (HTMT).
ConstructCEXCTRLOYPQYPVLSATSMACPI
CEX
CTR0.874
LOY0.7410.834
PQY0.8930.8550.728
PVL0.9150.9080.7470.901
SAT0.8870.9340.7820.8830.918
SMA0.8410.7920.6870.8940.8480.840
CPI0.6280.6940.8620.5840.6040.6290.551
Note: HTMT = heterotrait–monotrait ratio of correlations. Values below 0.85 indicate discriminant validity under the conservative criterion, whereas values below 0.90 may be acceptable for conceptually related constructs. Values exceeding 0.90 warrant further examination and cautious interpretation [45].
Table 10. Inferential HTMT assessment based on bootstrapped confidence intervals.
Construct PairHTMT95% CI Lower95% CI UpperIncludes 1.00Inferential Assessment
CEX–PVL0.9150.8980.941NoSupported
CTR–PVL0.9080.8840.929NoSupported
PQY–PVL0.9010.8960.941NoSupported
CTR–SAT0.9340.9130.957NoSupported
PVL–SAT0.9180.9000.942NoSupported
Note: HTMT = heterotrait–monotrait ratio; CI = confidence interval. Confidence intervals were estimated using 5000 bootstrap resamples. Discriminant validity is supported when the 95% CI does not include 1.00 [45].
Table 11. Model fit assessment of the structural equation model.
Model Fit IndexConventional Reference ValueObtained ValueModel
Evaluation
Reference
χ2/df (CMIN/DF)<5.002.686Acceptable Fit[50]
GFI≥0.900.932Acceptable Fit[50]
AGFI≥0.900.921Acceptable Fit[50]
CFI≥0.900.971Good Fit[46,50]
TLI≥0.900.968Good Fit[46,50]
IFI≥0.900.971Good Fit[50]
NFI≥0.900.954Good Fit[50]
RMSEA≤0.080.035Good Fit[46,50]
SRMR≤0.080.042Good Fit[46,50]
Note: CMIN/DF = normed chi-square; GFI = goodness-of-fit index; AGFI = adjusted goodness-of-fit index; CFI = comparative fit index; TLI = Tucker–Lewis index; IFI = incremental fit index; NFI = normed fit index; RMSEA = root mean square error of approximation; SRMR = standardized root mean square residual.
Table 12. Hypothesis testing results and effect size (f2) of the structural model.
HypothesisStructural PathStd. βS.E.C.R.p-ValueResultf2Effect Size
Interpretation
H1SMA → SAT0.0980.0283.288<0.01Supported0.021Small Effect
H2CEX → SAT0.0960.0471.967<0.05Supported0.018Negligible Effect
H3CEX → CPI0.1840.0753.050<0.01Supported0.047Small Effect
H4CEX → CTR0.2730.0554.588<0.001Supported0.112Small Effect
H5CEX → PVL0.3990.0517.479<0.001Supported0.196Medium Effect
H6PQY → PVL0.5650.05510.351<0.001Supported0.421Large Effect
H7PVL → SAT0.2710.0614.458<0.001Supported0.137Small Effect
H8PVL → CTR0.6610.06010.623<0.001Supported0.518Large Effect
H9SAT → LOY0.2900.1472.376<0.05Supported0.684Large Effect
H10SAT → CPI−0.8680.172−6.580<0.001Not Supported0.293Medium Effect
H11CTR → SAT0.5480.05310.579<0.001Supported0.447Large Effect
H12CTR → LOY0.5250.1554.257<0.001Supported0.301Medium Effect
H13CTR → CPI0.6310.1545.476<0.001Supported0.356Large Effect
H14LOY → CPI0.9600.04124.861<0.001Supported0.791Large Effect
Note: Std. β = standardized path coefficient. S.E. and C.R. are based on the corresponding unstandardized estimates, where S.E. = standard error and C.R. = critical ratio. Statistical significance levels: p < 0.05, p < 0.01, and p < 0.001. Following Cohen’s criteria, f2 values of 0.02, 0.15, and 0.35 indicate small, medium, and large effects, respectively; values below 0.02 indicate negligible effects [47].
Table 13. Alternative-model sensitivity analysis.
Assessment CriterionModel 1: HypothesizedModel 2: SAT → CPI Fixed to Zero
χ22110.9422132.797
df786787
χ2/df2.6862.710
GFI0.9320.931
AGFI0.9210.920
CFI0.9710.970
TLI0.9680.967
RMSEA0.0350.036
SRMR0.0420.045
AIC2344.9422364.797
Note: Model 2 fixed the direct SAT → CPI path to zero while retaining all other measurement and structural specifications. SAT = Customer Satisfaction; CPI = Continuance Purchase Intention; AIC = Akaike Information Criterion. Lower AIC values indicate better relative model fit.
Table 14. Comparison of explained variance (R2) between the hypothesized and restricted models.
Endogenous ConstructModel 1Model 2
PVL0.8850.886
CTR0.8380.839
SAT0.9180.948
LOY0.6470.644
CPI0.8750.881
Note: Model 1 represents the hypothesized model in which the SAT → CPI path was freely estimated. Model 2 represents the restricted model in which the SAT → CPI path was fixed to zero while all other measurement and structural specifications were retained. R2 = coefficient of determination; PVL = Perceived Value; CTR = Customer Trust; SAT = Customer Satisfaction; LOY = Customer Loyalty; CPI = Continuance Purchase Intention.
Table 15. Comparison of structural path coefficients between the hypothesized and restricted models.
Structural PathModel 1: Hypothesized (β)Model 2: SAT → CPI Fixed to Zero (β)Change
SAT → LOY0.2900.144↓ 50.3%
CTR → CPI0.631−0.119Changed sign (+ → −)
LOY → CPI0.9601.033↑ 7.6%
SAT → CPI−0.868Fixed to zeroRemoved
Note: β = standardized path coefficient. Model 2 fixed the SAT → CPI path to zero while retaining all other measurement and structural specifications. Percentage changes were calculated relative to the corresponding model 1 coefficients. A sign change indicates a reversal in coefficient direction and is therefore not expressed as a percentage change. ↑ indicates an increase, ↓ indicates a decrease, and (+ → −) indicates a change from a positive to a negative coefficient.
Table 16. Bootstrapped direct, indirect, and total associations with CPI.
PathwayDirect EffectIndirect Effect95% Bootstrap CI for Indirect EffectTotal EffectEffect Pattern/
Interpretation
SMA → SAT → CPI−0.058[−0.127, −0.022]−0.058Significant negative indirect association; direct path not specified
PQY → PVL → CTR → CPI0.211[0.191, 0.352]0.211Significant positive indirect association; direct path not specified
CEX → CPI0.1840.313[−0.126, 0.519]0.497Direct-only association; indirect effect not supported
PVL → CTR → CPI0.374[0.353, 0.595]0.374Significant positive indirect association; direct path not specified
CTR → CPI0.6310.178[−1.688, 0.744]0.809Direct-only association; indirect effect not supported
SAT → LOY → CPI−0.8680.275[0.230, 0.567]−0.593Competitive mediation
Note: Standardized direct, total indirect, and total associations were estimated using bias-corrected bootstrapping with 5000 resamples and 95% confidence intervals. The total indirect association represents the sum of all indirect paths specified in the structural model from each antecedent to CPI. An indirect association was considered statistically supported when its confidence interval did not include zero. Mediation patterns were classified based on the signs and statistical significance of the direct and indirect associations, following the framework summarized by Nitzl, Roldán, and Cepeda (2016) [49]. “—“ indicates that a direct path to CPI was not specified; in such cases, the result was interpreted as an indirect association rather than classified as mediation.
Table 17. Calibration thresholds for fsQCA analysis.
ConstructFull Non-MembershipCrossoverFull Membership
SMA3.75.77.0
PQY3.85.87.0
CEX3.85.67.0
PVL3.85.66.8
SAT3.85.66.8
CTR3.85.66.8
LOY3.45.46.8
CPI2.85.26.8
Note: Calibration thresholds were determined using the direct calibration method based on the observed distribution of each construct. The three qualitative anchors represent full non-membership, the crossover point, and full membership.
Table 18. Necessary condition analysis for high continuance purchase intention (CPI).
ConditionConsistencyCoverageNecessary Condition
SMA0.8030.772No
PQY0.8340.748No
CEX0.8090.781No
PVL0.8020.796No
SAT0.8210.793No
CTR0.8510.788No
LOY0.8810.843No
~SMA0.5640.499No
~PQY0.5360.507No
~CEX0.5440.479No
~PVL0.5610.481No
~SAT0.5400.475No
~CTR0.5180.474No
~LOY0.5040.447No
Note: “~” denotes the absence of a condition. In the necessity analysis, conditions with consistency values of at least 0.90 were considered potentially necessary. Necessity coverage indicates the empirical relevance of each condition [24].
Table 19. Robustness analysis across different frequency thresholds.
Frequency ThresholdNo. of
Configurations
Solution CoverageSolution ConsistencyRecurring ConditionsRobustness Conclusion
5 (Baseline)120.84160.8147LOY, CTR, SAT, PVL, PQYReference solution
1250.78760.8627LOY, CTR, SAT, PVL, PQYBroadly stable
1440.77220.8666LOY, CTR, SAT, PVL, PQYBroadly stable
Note: All analytical settings other than the frequency threshold were held constant. Recurring conditions refer to conditions that continued to appear across the retained solutions at all evaluated thresholds; this designation does not distinguish between core and peripheral conditions.
Table 20. Baseline intermediate configurational solution for high continuance purchase intention (CPI).
ConfigurationLOYCTRSATPVLCEXPQYSMARaw CoverageUnique CoverageConsistency
1 0.6720.0170.913
2 0.3490.0210.856
30.3510.0070.904
40.3340.0040.887
50.3770.0080.945
60.3150.0050.821
70.3040.0030.823
80.3190.0070.819
90.3400.0000.927
100.3440.0000.943
110.3720.0000.900
120.6640.0050.906
                                                  Solution Coverage = 0.8416
                                                  Solution Consistency = 0.8147
Note: ● indicates the presence of a condition; ⊗ indicates its absence; blank cells indicate “don’t care” conditions. These symbols do not distinguish between core and peripheral conditions. Raw coverage represents the proportion of the high-CPI outcome covered by each configuration, whereas unique coverage represents the proportion covered exclusively by that configuration. Consistency indicates the degree to which cases exhibiting a configuration also exhibit high CPI.
Disclaimer/Publisher’s Note: The statements, opinions and data contained in all publications are solely those of the individual author(s) and contributor(s) and not of MDPI and/or the editor(s). MDPI and/or the editor(s) disclaim responsibility for any injury to people or property resulting from any ideas, methods, instructions or products referred to in the content.