Systematic Review

Rethinking Meta-Analytic Evidence in TAM-Based Research: From Pooled Effects to Generalizability in E-Banking Contexts


1
Department of Applied Economics and Quantitative Analysis, Faculty of Business and Administration, University of Bucharest, 030018 Bucharest, Romania
2
Faculty of Economic Sciences, Ovidius University, 900470 Constanta, Romania
*
Author to whom correspondence should be addressed.
J. Theor. Appl. Electron. Commer. Res. 2026, 21(5), 129; https://doi.org/10.3390/jtaer21050129
Submission received: 2 February 2026 / Revised: 6 April 2026 / Accepted: 18 April 2026 / Published: 22 April 2026

Abstract

The Technology Acceptance Model (TAM) has been widely used to explain e-banking and digital technology adoption. Existing literature supports the robustness of its core relationships, but the magnitude of the effects varies considerably across studies, raising questions about their stability and generalizability in new contexts. Existing meta-analysis studies focus primarily on pooled effect sizes, providing limited insight into the temporal stability of relationships, their sensitivity to individual studies, and the extent to which observed heterogeneity reflects contextual variation. This study contributes by reinterpreting heterogeneity not as a problem to be reduced, but as a feature that defines the limits of generalizability. We advance the TAM literature by moving beyond average effects and rethinking empirical evidence through the joint lens of robustness, stability, and dispersion. We conduct a random-effects meta-analysis on 44 effect sizes (correlation coefficients) coming from 43 research papers indexed in Web of Science and Scopus. In addition to pooled correlations, the analysis employed cumulative meta-analysis, leave-one-out influence diagnostics, prediction intervals, and publication bias assessments to evaluate the evolution, consistency, and variability of TAM relationships across contexts. The findings show that core TAM relationships are consistently positive and stable at the aggregate level yet display substantial variation across empirical settings. While some relationships remain robust across contexts, others exhibit prediction intervals that include zero, indicating that their strength and even direction may depend on contextual conditions. As prior TAM meta-analyses have not systematically incorporated prediction intervals, this study provides new evidence to the extent to which TAM relationships generalize beyond average effects. The results further show that although TAM offers a reliable structural framework, interventions and policies based on its core relationships must be context-sensitive, because relying on average effects alone may lead to ineffective or inconsistent adoption outcomes.

1. Introduction

The rapid digital transformation of the financial sector has reshaped the way banking services are delivered and consumed. Electronic banking (e-banking)—encompassing internet banking, mobile banking, and other technology-mediated financial services—has shifted from branch-based operations to technology-enabled financial interaction [1,2,3,4]. As financial institutions increasingly rely on digital platforms to enhance efficiency, accessibility and competitiveness, understanding the determinants of e-banking adoption has become a central concern for both scholars and practitioners [5,6].
Beyond organizational performance, successful adoption of digital banking services has broad implications for transaction costs, the transmission of monetary policy, systemic risk, and financial inclusion [7]. At both institutional and individual levels, e-banking enables value creation through convenience, efficiency, and accessibility [8,9], while fostering customer engagement, product uptake, and continual usage [9,10,11].
The most widely used theoretical framework of e-banking adoption is the Technology Acceptance Model (TAM), which identifies perceived usefulness and perceived ease of use as central determinants of user acceptance [8,12,13]. While TAM has proven influential, its empirical performance is often context-dependent, leading to numerous extensions incorporating additional constructs such as trust, perceived risk, security, social influence, and government support which have been found to enhance its explanatory and predictive performance [8,12,14,15]. While these extensions improve predictive performance, they have also contributed to a fragmented empirical landscape, raising questions about the consistency and generalizability of the model’s core relationships.
Empirical evidence shows that the predictive relevance of TAM constructs varies across contexts. For example, perceived ease of use has been shown to lose predictive relevance in certain populations or regional contexts, highlighting the need for contextual adaptation in technology acceptance research [16]. While TAM offers a well-validated theoretical foundation, its explanatory relevance is not uniform across settings. Studies incorporating complementary frameworks or context-specific variables that capture institutional, cultural, or user-related conditions report improved explanatory performance [8,14,15,17]. Other findings show that augmented versions of TAM often explain a greater share of variance in actual internet banking usage than the original model, and that the relative importance of specific determinants varies systematically across demographic segments and cultural environments [14,15,16].
Such individual studies focus mainly on the explanatory power of TAM by identifying significant predictors of technology adoption. Their findings often differ in the magnitude and relative importance of these relationships across contexts. As such, conclusions regarding the effectiveness of TAM cannot be based solely on the strength of relationships within individual studies but require an assessment of how these effects vary across the broader body of evidence.
Several meta-analyses, summarized in Table 1, have attempted to address this need by synthesizing evidence across diverse contexts, datasets, and methodological approaches. Despite differences in scope and data selection, these studies consistently identify perceived usefulness and perceived ease of use as the most important predictors of technology adoption [18,19,20,21,22]. At the same time, they rely primarily on pooled effect sizes to summarize relationships and, as documented in Table 1, report very high levels of between-study heterogeneity, often with I2 values exceeding 90%.
Whenever heterogeneity is high, meta-regression and moderation analysis are usually used to explain variation in effect sizes across studies by relating them to study-level characteristics. Meta-regression models effect sizes as a function of moderators and examines whether these account for between-study heterogeneity [23,24,25]. Beyond explaining heterogeneity, it also refines effect estimates by producing context-specific results and supports hypothesis generation, although such findings remain observational and non-causal [23,26,27,28]. However, even after accounting for moderators, substantial residual between-study variance typically remains, often accompanied by wide uncertainty intervals, indicating persistent unexplained variability [29]. Table 1 shows the emerging pattern in e-banking TAM research that employs meta-analysis in an attempt to explain heterogeneity.
Table 1. A summary of existing meta-analyses on e-banking adoption.
StudyScopeDatabaseModerators/Meta-RegressionModerators Used (Detail)Baseline I2 (Approx.)Residual Heterogeneity After ModeratorsPrediction IntervalsLeave-One-Out/InfluenceCumulative Meta-AnalysisCore Contribution
Montazemi & Qahri-Saremi (2015) [20]Online bankingEBSCOhost, JSTOR, Scholar’s Portal, Google Scholar, AIS, ACM, ScienceDirect, Palgrave Macmillan, Extenza, Metapress, Highwire Press, Sage, Emerald, IEEE, INFORMS, InterScience, Factiva, Gale Cengage, ProQuest and WorldCatNo-Very high (I2 often >90%)-NoNoNoMeta-analytic SEM (pre- and post-adoption of online banking)
Santini et al. (2019) [30]Banking Google Scholar, Jstor, Emerald, PsycINFO, Taylor & Francis, Elsevier Science, Direct, SCOPUS, Scielo and EBSCO.YesSample type, sample size, scale size, economic level, cultural orientations, innovation level, connectivity level, device typeVery high (I2 often >90%)Remains high even after moderators (I2—96.30–98.68%)NoNoNoImpact of antecedents, consequences, moderators on TAM constructs in banking contexts.
Sharma et al. (2022) [22]Mobile banking and wallets; online and telephone bankingScopus Emerald, EBSCO, Wiley, and JSTORNo (Subgroup analysis)-Very high (I2—91.94–98.89%)-YesNoNoLocation is a major contributor to heterogeneity in a comprehensive global framework.
Neves et al. (2023) [21]Digital banking, digital management
and payment services, and digital wallets
Scopus, Science Direct and WoSYesHuman development Index, Global innovation Index, Uncertainty avoidance, Masculinity, Individualism, Long-term orientation, Power distance, Indulgence.Very high (I2 often >90%)Still substantial after moderation; not fully explainedNoNoNoComprehensive synthesis of 121 articles; Highlights that barriers/facilitators vary by service type
Mentari et al. (2025) [19]Digital bankingScopus, Science Direct and SintaYes Model type (TAM vs. UTAUT), context variablesVery high (I2—95.16–98.84%) Partial reduction; NoNoNoUTAUT is significantly superior to TAM in predicting BI and AU
Hornuf et al. (2025) [18]Mobile fintech adoption in Sub-Saharan AfricaScience Direct, Scopus, Business Source Premier, Proquest and Google ScholarNo---NoNoNoRegional and policy insights
Liu et al. (2019) [31]Mobile paymentsWoSNo-Very high (I2 often >90%)-NoNoNoSynthesized factors affecting mobile payment
The fact is that prior meta-analysis research on TAM in e-banking, with one notable exception, focuses exclusively on pooled effect sizes and confidence intervals that quantify estimation uncertainty but do not capture the expected dispersion of effects. In addition, there is no in-depth investigation of what this heterogeneity implies for the stability, predictability, and practical applicability of TAM relationships. The mere fact that TAM holds up well to scrutiny provides very little insight into how reliably its effects can be expected to hold across new contexts or over time. In other words, prior research has focused primarily on explaining heterogeneity, rather than assessing its implications for the stability, predictability and generalizability of TAM relationships.
Prediction intervals provide a complementary perspective by shifting the focus from detecting and explaining heterogeneity to assessing its practical implications. While traditional metrics such as Q, I2, and τ2 indicate the presence and magnitude of variability, they do not convey how this variability translates into the range of effects expected in new empirical settings. Prediction intervals address this gap by estimating where the true effect of a future study is likely to fall, incorporating both uncertainty around the mean effect and between-study heterogeneity [32,33,34,35,36,37].
This reframing has important implications. Empirical evidence across multiple fields shows that prediction intervals are often substantially wider than confidence intervals and frequently include null or even opposite effects, despite statistically significant pooled estimates [33,35,38,39,40,41,42]. This suggests that, even after modeling covariates, many a meta-analysis cannot ensure that observed average effects will translate into consistent benefits across contexts. At the same time, prediction intervals require cautious interpretation in meta-analyses with a small number of studies, where estimates may be imprecise [24,34,38,43,44].
Thus, rather than replacing traditional heterogeneity measures, prediction intervals extend them by translating statistical variability into the range of effects that decision-makers can expect in real-world settings, offering a more direct assessment of generalizability [32,35,45,46,47,48].
Against this background, our study re-examines TAM-based evidence on e-banking adoption by shifting the focus from average effect sizes to their dispersion, robustness, and temporal stability across contexts. The analysis draws on a final sample of 44 independent effect sizes collected from 43 peer-reviewed studies indexed in Web of Science and Scopus (N = 15,915). We conduct a series of mixed-effects meta-analyses [49] to estimate pooled effect sizes, covering core TAM relationships.
This study contributes by reinterpreting heterogeneity not as a problem to be reduced, but as a feature that defines the limits of generalizability. More specifically, our work makes four contributions to the adoption of e-banking literature. First and foremost we report prediction intervals for all relationships, offering direct insight into the range of effects that can be expected across various empirical contexts. We find that some apparently very stable relationships can become irrelevant or reverse direction depending on circumstances, a result that is not captured by pooled effect sizes alone.
To support this interpretation, we complement the analysis with a series of robustness and stability checks. First, we employ leave-one-out analysis and influence diagnostics to assess whether the observed effects are driven by a small number of influential studies or reflect genuine structural variability across contexts. Second, we examine the temporal stability of TAM relationships using cumulative meta-analysis (CMA) which allows us to evaluate whether effect sizes remain stable as new evidence accumulates or evolves [50]. This allows us to evaluate whether the strength of relationships evolved as digital banking technologies have matured, and whether conclusions drawn in earlier stages of the literature remain valid as new evidence accumulates.
Finally, our study provides an additional robustness check by examining TAM relationships in digital banking under deliberate sample restrictions. As shown in Table 1, prior meta-analyses rely on heterogenous combinations of databases, including Scopus, Emerald, EBSCO, Wiley, JSTOR and others, with no consistent standard of selection and, in some cases, without including Web of Science. In contrast, our analysis focuses on a narrowly defined yet theoretically coherent set of studies indexed in Web of Science and Scopus. This design allows us to assess whether the observed relationships are sensitive to database coverage and sample construction. In this sense, the analysis functions as a sensitivity check of existing results, analogous to resampling procedures used to evaluate the stability of statistical estimates. The convergence of our findings with those reported in larger-scale meta-analysis studies suggests that the core TAM relationships are not results of sample expansion or sample size but reflect structurally stable associations that remain robust even under a wide variety of circumstances.

2. Materials and Methods

2.1. Data

The data search was conducted using Clarivate Analytics’ Web of Science (WoS) and Elsevier’s Scopus, two widely recognized databases in the academic world [51]. There is substantial methodological literature supporting the use of these databases as core sources in systematic reviews and meta-analyses, due to their curated coverage of high-impact, peer-reviewed journals and rigorous indexing standards [52,53,54,55].These characteristics contribute to a more homogeneous and methodologically reliable evidence base, while also ensuring transparency and reproducibility.
In addition, WoS and Scopus support advanced and reproducible search strategies through stable query systems, structured metadata, and transparent filtering procedures, which are essential for PRISMA-compliant workflows [53,56]. Their citation indexing functionalities further facilitate backward and forward citation tracking, an important component of systematic evidence synthesis [57].
Compared to more inclusive or less rigorous selection criteria platforms, such as Google Scholar or EBSCO, which apply broader inclusion criteria, WoS and Scopus reduce the likelihood of retrieving non-peer-reviewed or poorly indexed materials [58]. For these reasons, only WoS and Scopus were included in the data selection process.
At the same time, we acknowledge that database selection inherently shapes the resulting evidence base. Prior research shows that overlap across major databases can be limited (e.g., as low as 5.7% across Scopus, WoS, and EBSCO), indicating that no single database or combination thereof is exhaustive [55]. While broader sources such as Google Scholar may increase coverage, they often do so at the cost of increased noise and screening burden [57]. Accordingly, methodological guidance often recommends combining multiple databases when maximal comprehensiveness is desired [59]. However, in the present study, the emphasis was placed on data quality and methodological consistency.
The search was conducted on 10 August 2025, using the title, abstract, and keywords fields of both databases. The search strategy aimed to identify studies examining user acceptance of internet banking, e-banking, digital banking, mobile banking, and fintech services within the TAM framework. The following Boolean search string was used: (“Technology Acceptance Model” AND “internet banking”) OR (“TAM” AND “internet banking”) OR (“TAM” AND “fintech services”) OR (“Technology Acceptance Model” AND “fintech services”) OR (“TAM” AND “digital banking”) OR (“Technology Acceptance Model” AND “digital banking”). To ensure broad conceptual coverage, no publication year restrictions were specified. Additional filters were applied to include only peer-reviewed journal articles written in English.
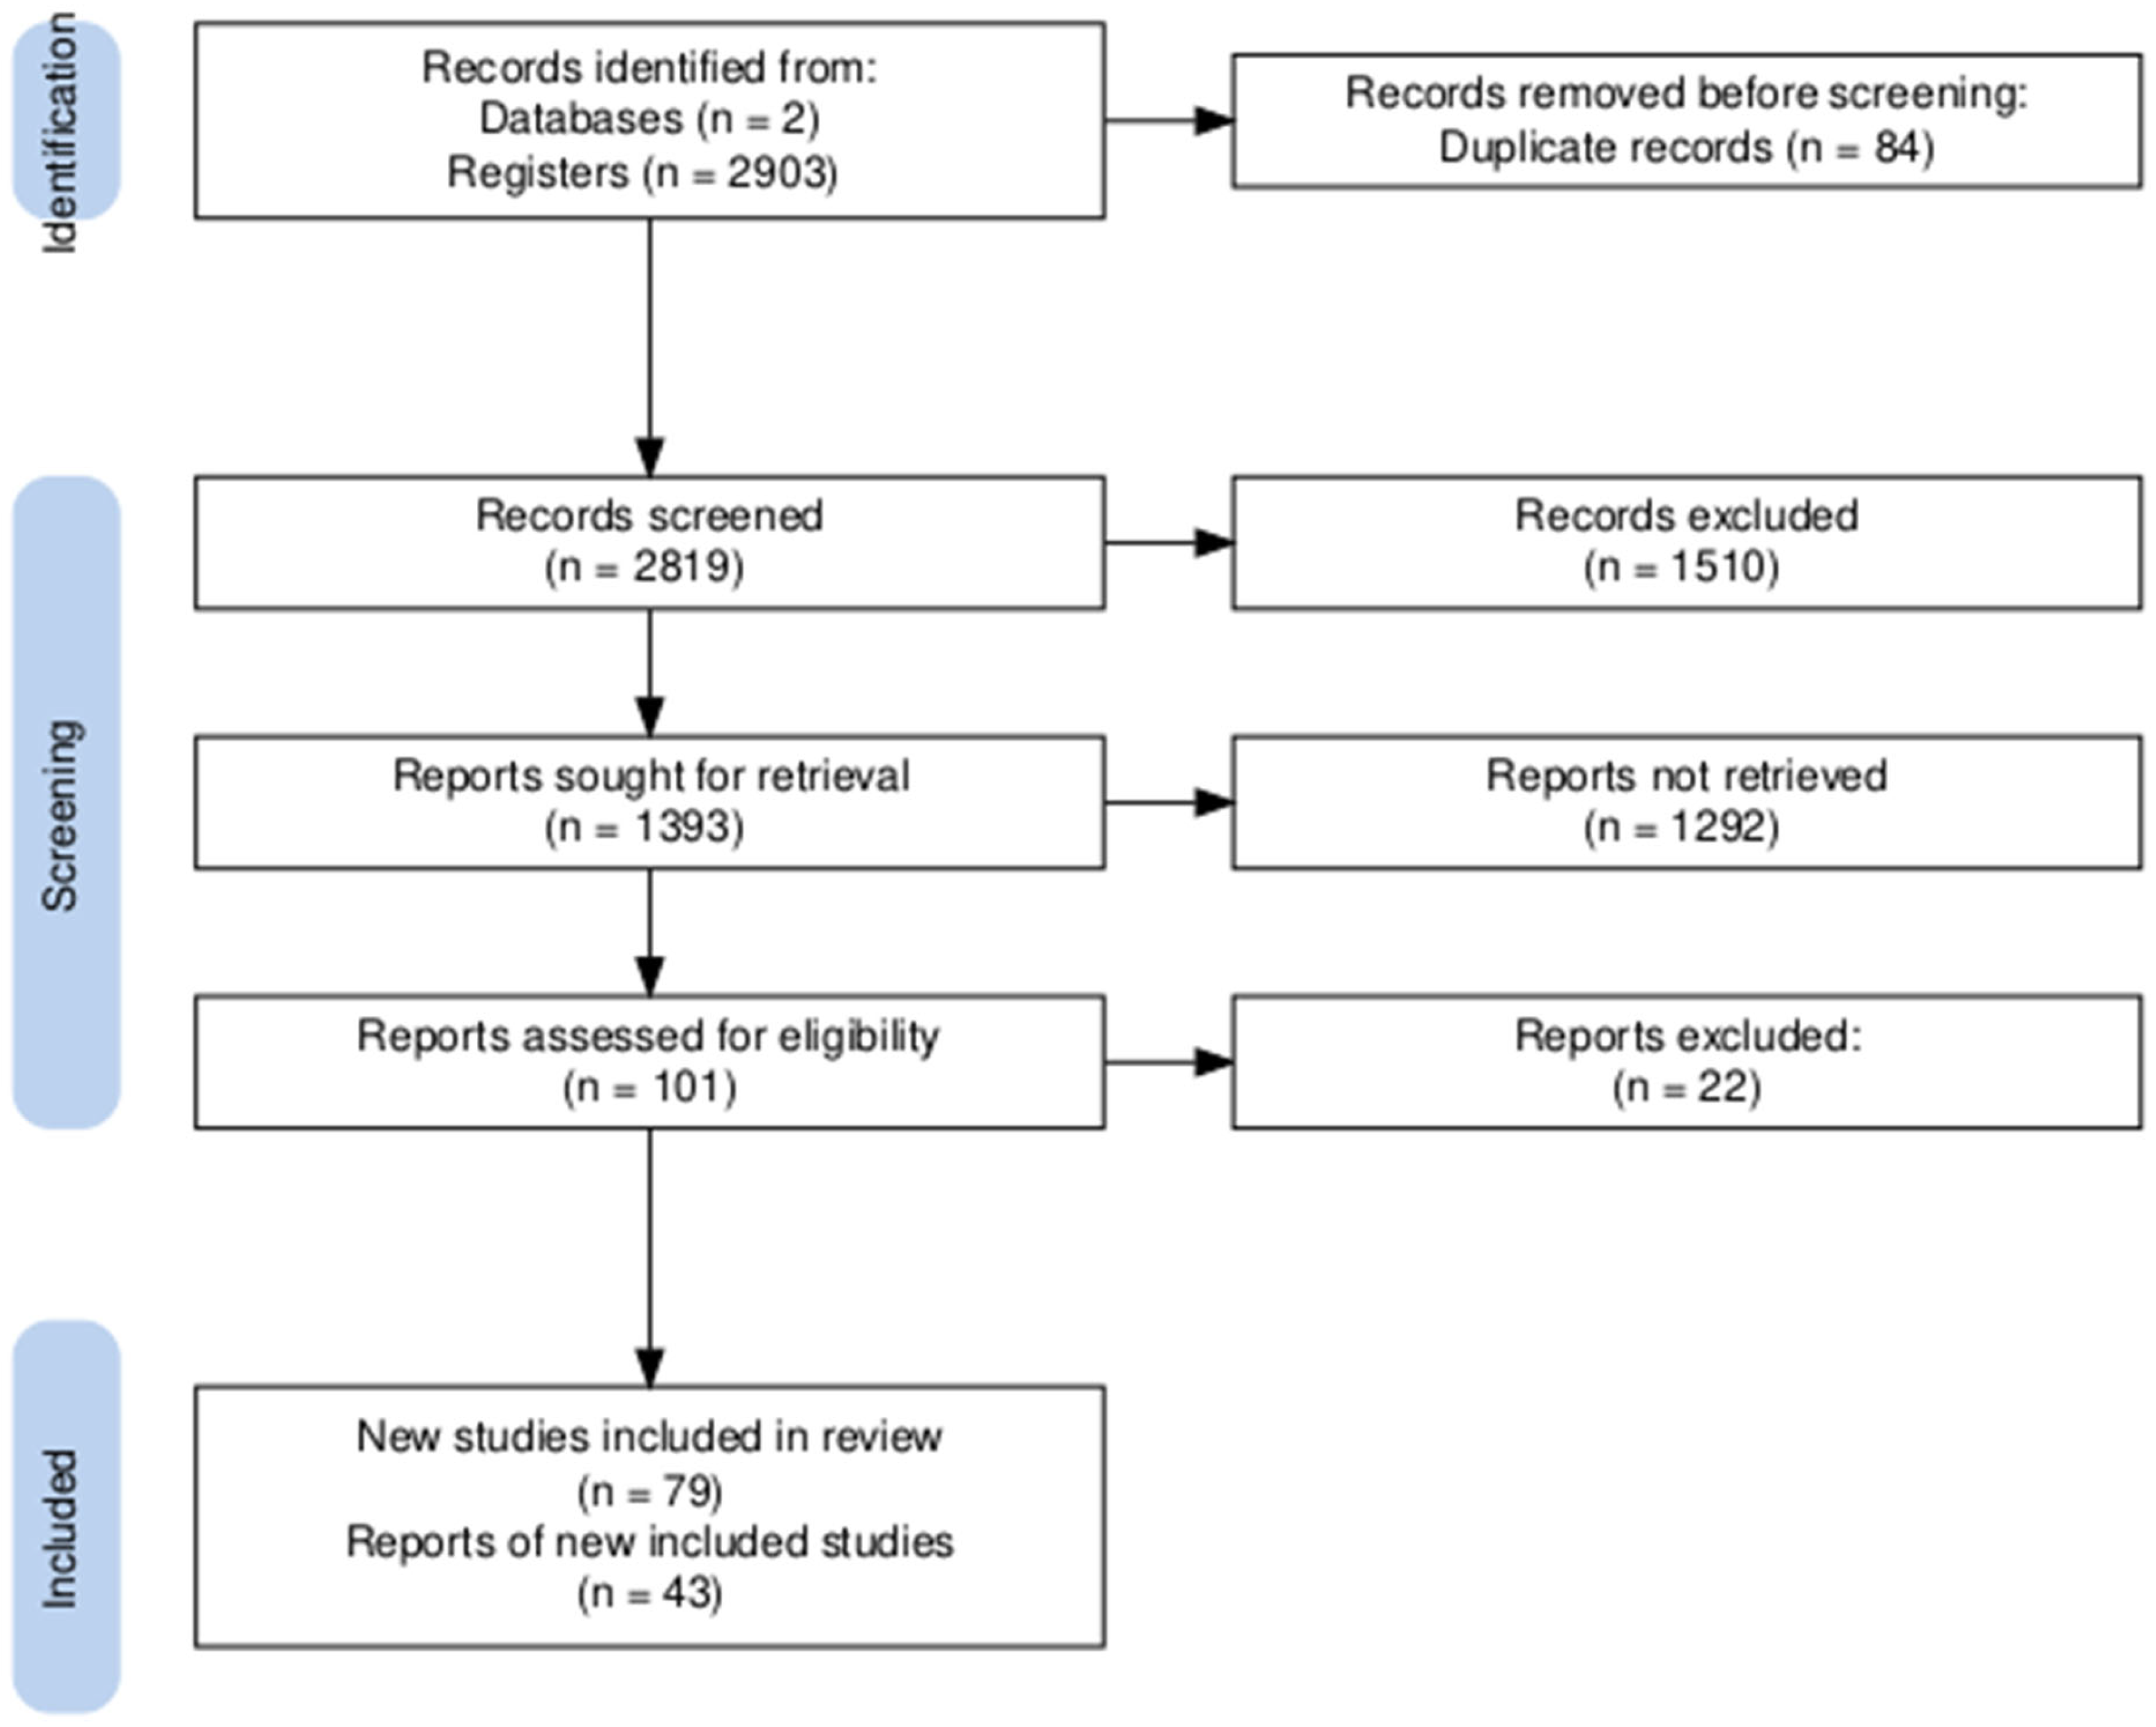
The initial search conducted yielded 2903 records, of which 84 were duplicates and were removed. Following title and abstract screening, 1393 articles were retained for eligibility assessment. The inclusion criteria were as follows: (1) empirical studies, (2) studies applying the Technology Acceptance Model (TAM), (3) studies focusing on internet banking or related digital financial services, and (4) studies reporting statistical correlation coefficients required for meta-analysis. The exclusion criteria included: (1) conceptual or theoretical papers, (2) studies not reporting sufficient statistical data, (3) studies not focused on banking-related contexts, and (4) unavailable full texts. Applying these criteria, the sample was further reduced to 79 studies. These studies were further subjected to in-depth content analysis to exclude papers lacking a direct focus on internet banking or not reporting explicit correlations among variables. As illustrated in Figure 1, the meta-analysis followed the PRISMA 2020 guidelines. Two reviewers independently extracted data from each eligible report to minimize errors and reduce selection bias. Any disagreements between reviewers were resolved through discussion until consensus was reached. Ultimately, a final set of 43 studies (reporting a total of 44 independent effect sizes, n = 15,915 cases) met all predefined eligibility criteria and were included in the quantitative synthesis. The review was retrospectively registered on the Open Science Framework (OSF), and the registration is available at: https://osf.io/ptwr9/overview.

2.2. Methods

To synthesize empirical evidence on the relationships among key TAM constructs, we employed a mixed-effects meta-analysis, a statistical technique that aggregates effect sizes across independent studies to estimate the magnitude and consistency of theoretical associations. Meta-analysis allows us to quantify the strength of paths such as perceived usefulness → behavioral intention or perceived ease of use → perceived usefulness, while accounting for sampling error, study heterogeneity, and variations in research design. By pooling standardized effect sizes drawn from the selected studies, the method provides more precise and generalizable estimates of TAM relationships than any single study can offer, enabling a rigorous evaluation of the model’s predictive structure across different contexts and applications.
Between-study heterogeneity was assessed using the Q statistic, the between-study variance (τ2), and the inconsistency index (I2). Significant Q values, and larger τ2 and I2 estimates indicate greater dispersion of true effects across studies beyond what would be expected from sampling error.
To evaluate the robustness of the pooled effects and detect potentially influential studies, influence diagnostics were performed using the influence() function from the metafor package. Leave-one-out (LOO) sensitivity analysis was used to assess whether pooled effects and heterogeneity estimates (I2, τ2) are driven by individual studies, helping identify outliers and influential cases [60,61]. In some cases, removing a single study can substantially reduce heterogeneity and alter the pooled effect, indicating that variability may be concentrated in a few observations rather than broadly distributed [60,61]. More systematic approaches show that commonly used heterogeneity thresholds can often be reached by excluding only one or two studies, highlighting their disproportionate influence [62].
The analysis examined standard indicators, including studentized deleted residuals (to identify outliers), DFITS and Cook’s distance (to assess overall influence), and covariance ratios (to evaluate changes in model precision). Additional diagnostics—such as changes in between-study variance (τ2), heterogeneity (Qe), leverage (hat values), and DFBETAS—were inspected to determine whether any individual study disproportionately affected the pooled estimate or the heterogeneity structure. These measures jointly provide a comprehensive assessment of the model’s sensitivity to single-study omission.
To examine the temporal stability of the estimated relationships, and to assess how the accumulation of evidence has shaped the conclusions of prior research, we conducted a cumulative meta-analysis (CMA). In cumulative meta-analysis, studies are sequentially ordered, typically by year of publication, and the pooled effect size is recalculated each time a new study is added to the evidence base. This procedure allows for the evaluation of how early findings evolve incrementally as additional data become available, and whether subsequent studies reinforce, attenuate, or overturn previously established results [50].
Publication bias was evaluated using Egger’s regression test [63], which assesses funnel plot asymmetry by examining whether smaller studies tend to report larger effects; a significant intercept suggests a potential small-study bias.

3. Results

This section examines TAM relationships from three complementary perspectives: their average strength, their generalizability across contexts, and their robustness to study-specific influence and temporal variation.

3.1. Sample Statistics

Our final sample consists of 43 articles, 32 from Web of Science, and another 11 from Scopus, summarizing a maximum of 44 independent effect sizes. Table 2 presents the descriptive statistics of each set of correlation coefficients, ordered by TAM relationships pairs. The last column shows how many of these observations are available in the final sample. For instance, for the PEOU-PU relationship all 44 correlation coefficients are available; for the BI-AU relationship there are only eight correlation coefficients available, etc.
As shown in Table 2, mean correlations are positive across all TAM relationships, with values generally clustering around moderate-to-strong effect sizes. At the same time, the wide range between minimum and maximum coefficients—particularly for relationships involving behavioral intention and actual use—suggest substantial between-study variability. The number of available observations differs across relationships, with some paths (e.g., perceived ease of use–perceived usefulness and perceived usefulness–behavioral intention) being extensively examined, while others (notably behavioral intention–actual use) are represented by relatively few studies.
Table 3 presents the summary of meta-analysis studies for all relationships. There are consistently positive and statistically significant pooled correlations among TAM constructs. The estimated mean effects range from r = 0.488 (PEOU → ATT) to r = 0.591 (PU → AU), with all confidence intervals excluding zero. The strongest associations are observed between Perceived Usefulness and Actual Use (r = 0.591, 95% CI [0.387, 0.740]) and between Attitude and Behavioral Intention (r = 0.578, 95% CI [0.493, 0.653]), while the weakest link is between Perceived Ease of Use and Attitude (r = 0.488, 95% CI [0.399, 0.568]). All models indicate substantial between-study heterogeneity, as reflected by highly significant Q statistics (all p < 0.001) and I2 values above 95%, confirming that most variability among observed effects was due to true differences rather than sampling error. Correspondingly, the estimated between-study variance (τ2) ranged from 0.040 to 0.204, with τ values between 0.20 and 0.45, underscoring considerable dispersion in effect sizes across studies. While these results confirm the overall strength and statistical significance of TAM relationships, pooled estimates alone do not provide information about their generalizability across different empirical contexts.
The prediction intervals provide a different perspective compared to pooled estimates, as they capture the expected dispersion of effects across empirical settings rather than estimation uncertainty alone. Relationships such as PEOU → BI (95% PI [0.052, 0.793]), PU → ATT ([0.141, 0.736]), PU → BI ([0.045, 0.834]), and ATT → BI ([0.111, 0.836]) display intervals entirely above zero, suggesting that these effects are not only significant on average but also consistently positive across various contexts. In contrast, the prediction intervals for PEOU → PU ([−0.027, 0.868]), PEOU → ATT ([−0.007, 0.791]), PU → AU ([−0.077, 0.893]), and BI → AU ([−0.276, 0.921]) include zero, indicating that the magnitude and even the direction of these effects may vary across settings. These findings indicate that statistical significance at the aggregate level does not necessarily imply consistent effects across contexts. In this sense, prediction intervals reveal that TAM relationships are not uniformly predictive but vary in strength and even direction depending on contextual conditions.
The results of Egger’s regression test indicate that publication bias is not a concern for most relationships within the TAM framework, as the corresponding tests did not reach statistical significance with one exception. For the BI → AU relationship, Egger’s test yielded a significant result (z = –2.054, p = 0.04), suggesting a potential small-study or reporting bias. This finding should be interpreted with caution, as the BI–AU association was analyzed based on only eight effect size data points. The limited number of observations reduces the power and reliability of the asymmetry test, making it difficult to distinguish genuine bias from sampling variability. Nevertheless, this result highlights the need for further evidence on the intention–use link, which remains underrepresented in the current literature compared with other TAM relationships.

3.2. Leave-Out Analysis and Influential Points

Across all meta-analytic models corresponding to the core TAM relationships, influence diagnostics indicate a high degree of robustness and stability. The studentized deleted residuals remained within conventional boundaries for outlier detection (|rstudent| < 2), providing no evidence of extreme or aberrant observations across models. Measures of overall influence, including DFITS, Cook’s distance, and DFBETAS, consistently exhibited low values (generally < 0.3), indicating that the removal of any single study would have a negligible impact on the fitted values or pooled effect size estimates.
The covariance ratios were tightly centered around unity, typically ranging between 1.02 and 1.05, demonstrating that model precision remained virtually unchanged under single-study deletion. Similarly, leave-one-out estimates of between-study variance (τ2) and residual heterogeneity (Qe) showed only marginal fluctuations across all relationships, with τ2 varying within narrow bounds (e.g., τ2 ≈ 0.066–0.069 for representative models). These patterns suggest that heterogeneity is not driven by individual influential studies but reflects genuine between-study variability. In addition, leverage values (hat-statistics) and study weights were highly homogeneous across models, suggesting a balanced contribution of individual studies to the pooled estimates. These diagnostics, available in Figures S9–S16 in the Supplementary Material, provide evidence that none of the included studies exert undue influence on the meta-analytic results. These results suggest that the observed heterogeneity is not driven by a small number of influential studies but reflects genuine variability across empirical contexts.

3.3. Cumulative Meta-Analysis Results

The cumulative meta-analysis results reveal a high degree of temporal stability across all core TAM relationships, as shown in Figures S17–S24 in the Supplementary Material. For each relationship, pooled effect size estimates converge rapidly as evidence accumulates, with early fluctuations attenuating after the inclusion of a relatively small number of studies. In most cases, the cumulative estimates become stable within the first 10–15 studies and remain remarkably consistent thereafter, despite the continued addition of new evidence. Across relationships, the direction of effects remained uniformly positive throughout the cumulative process, and no reversals or substantive shifts in magnitude were observed as later studies were incorporated.
Although between-study heterogeneity remains high across all cumulative models—as reflected by persistently elevated I2 values and non-zero τ2 estimates—the magnitude of heterogeneity exhibits no systematic temporal trend. Instead, τ2 and I2 stabilize alongside pooled effect sizes, indicating that the accumulation of evidence increased the precision of the estimates without altering their substantive interpretation. Confidence intervals narrow progressively with each added study, reflecting growing estimation precision rather than changes in effect magnitude.
The cumulative meta-analysis results show that the core TAM relationships in e-banking adoption exhibit consistent effect sizes over time. The absence of temporal drift, effect inflation, or late-stage reversals suggests that over the last two decades, the empirical evidence documenting these relationships reached a stable configuration relatively early on and has remained robust and consistent as the literature continued to expand. Therefore, the variability across studies reflects contextual, rather than temporal differences.

4. Discussion

4.1. Preliminary Discussion

This study synthesizes evidence from a total of 44 independent effect sizes coming from 43 empirical studies examining the core relationships of the Technology Acceptance Model in the context of e-banking adoption, revealing an uneven distribution of empirical evidence across constructs. While relationships involving perceived ease of use, perceived usefulness, attitude, and behavioral intention are well documented, the link between behavioral intention and actual use remains comparatively underexplored (only eight effect sizes are available in our sample).
This imbalance reflects a broader pattern in behavioral research in general, and technology acceptance research in particular, where actual behavior, adoption in this case, is frequently operationalized only in terms of intentions. As a result, conclusions regarding the intention–behavior relationship are based on more limited evidence and should be interpreted with caution. The relative scarcity of studies reporting actual usage outcomes constrains both theoretical and practical understanding, as it remains unclear whether favorable attitudes and intentions toward e-banking reliably translate into sustained behavioral engagement. In this sense, our findings not only confirm intention-based relationships but also highlight a persistent gap in the empirical examination of post-intentional adoption processes.
The meta-analytic findings confirm that the structural relationships proposed by the Technology Acceptance Model are, on average, positive and statistically significant, consistent with prior meta-analytic evidence presented in Table 1. Our results reinforce the central role of perceived usefulness and actual use, and between attitude and behavioral intention. At the same time, these findings must be interpreted with caution. As documented both in our study and in prior meta-analyses, TAM relationships are characterized by substantial heterogeneity, indicating that their strength varies across contexts.
Importantly, the convergence of pooled effect sizes across studies with different scopes, datasets and database selections suggests that the relations are structurally stable. For the relationship between perceived ease of use and perceived usefulness our study yields a pooled effect size of 0.571, closely aligning with the estimate reported by [21] (r = 0.58). For the perceived usefulness–behavioral intention relationship, the pooled effect size obtained in the present study (r = 0.553) exceeds the corresponding estimate reported by [21] (r = 0.41), while closely approximating the value reported for digital banking [22] (r = 0.59).
The pooled effect size for the relationship between perceived ease of use and behavioral intention obtained in our study (r = 0.512) closely mirrors the estimate reported by [22] for digital banking (r = 0.50), while substantially exceeding the more modest effect size reported by [21] (r = 0.18). With respect to attitude-based relationships, the estimated effects for perceived ease of use–attitude (r = 0.488) and perceived usefulness–attitude (r = 0.495) are notably stronger than those reported in previous meta-analyses, including the values of approximately 0.26 and 0.39 documented by [21].
In contrast, a high degree of convergence across studies is observed for the relationship between attitude and behavioral intention. The pooled effect size identified in our analysis (r = 0.578) is virtually identical to that reported by [21].
The most pronounced divergence in results emerges in the case of the relationship between behavioral intention and actual use. Whereas the present study documents a comparatively strong pooled effect (r = 0.576), ref. [21] reports a substantially weaker association (r = 0.33). However, as mentioned before, this may be the result of the small sample size documenting the relation between intention and actual behavior.
This convergence of results across so many different conditions should not be interpreted as evidence of uniform applicability. Rather, it indicates that similar average effects may emerge despite underlying variability, reinforcing the need to move beyond pooled estimates when assessing the generalizability of TAM relationships. The consistently high I2 values and non-negligible between-study variance (τ2) indicate that the strength of TAM relationships is not uniform across empirical contexts. These patterns of heterogeneity are further elucidated by prediction intervals. For several core relationships—such as those linking the perceived ease of use and behavioral intention, perceived usefulness and attitude, perceived usefulness and behavioral intention, and attitude and behavioral intention, the intervals remain consistently positive, suggesting a relatively stable pattern across contexts. These findings reinforce a central tenet of TAM—namely, that perceived usefulness and attitudes constitute reliable predictors of behavioral intention across diverse technological and cultural settings. In contrast, the inclusion of zero within the prediction intervals for the relationships involving perceived ease of use and perceived usefulness, perceived ease of use and attitude, perceived usefulness and actual use, and behavioral intention and actual use indicates greater context sensitivity. In these cases, the strength of the associations appears more contingent on situational factors, such as user experience, technological maturity, institutional support, or environmental constraints.
Our results suggest that while the structural logic of TAM is robust, its predictive precision varies across contexts. Although prior research has sought to account for this variability through moderator analyses and meta-regression approaches, the persistence of substantial unexplained heterogeneity indicates that these strategies provide only a partial explanation. Rather than fully resolving variability, these findings highlight the need to explicitly acknowledge and quantify the dispersion of effects across contexts. In this sense, approaches such as prediction intervals offer a more informative framework for assessing the extent to which TAM relationships can be generalized beyond average effects. The assessment of publication bias suggests that most TAM relationships are not characterized by systematic reporting asymmetry, as indicated by non-significant results of Egger’s regression test. An exception is observed for the relationship between behavioral intention and actual use, pointing to the possibility of small-study effects or selective reporting. This result, however, should be interpreted with caution, given that the behavioral intention–actual use path is represented by only eight effect sizes in the meta-analytic dataset, a condition under which the power and reliability of funnel plot-based diagnostics are limited. The synthesized evidence is largely robust to publication bias: the substantial heterogeneity observed across studies is more plausibly attributed to genuine theoretical and contextual variation than to artifacts arising from selective reporting.

4.2. Theoretical Implications

The main contribution of this study lies not in documenting heterogeneity in TAM relationships, which has been consistently reported in prior research, but in reinterpreting what this heterogeneity implies for the body of theory. By explicitly examining the dispersion of effect sizes through prediction intervals, this study shows that relationships appearing stable at the aggregate level may not be uniformly applicable across empirical contexts. This distinction challenges the implicit assumption, common in prior meta-analyses, that robust average effects imply generalizable relationships. In this sense, the present findings shift the focus of TAM research from explaining variability through moderators to understanding the limits of generalizability inherent in the model’s empirical application. Rather than treating heterogeneity solely as a statistical issue to be reduced, this study conceptualizes it as a substantive feature that defines the boundary conditions under which TAM relationships hold.

4.3. Practical Implications

From a practical perspective, the findings highlight a critical distinction between statistical reliability and practical relevance. Although core TAM relationships are consistently statistically significant at the aggregate level, this does not guarantee that they will produce reliable effects in specific empirical contexts. Relying solely on pooled estimates may therefore lead to misguided interventions, particularly when substantial heterogeneity remains unexplained. In this sense, prediction intervals provide a more decision-relevant perspective by indicating whether an effect can be expected to be held in practice, rather than merely on average.
In line with this distinction, perceived usefulness and attitudes emerge as consistently robust drivers of technology adoption, suggesting that interventions should prioritize clear communications and the functional value of digital services. Concrete use cases, targeted training, and transparent value propositions are likely to strengthen adoption intentions across diverse user groups and settings.
At the same time, the comparatively smaller yet significant influence of perceived ease of use suggests that usability and interface simplicity remain important enabling factors but are unlikely to compensate for limited perceived value. Accordingly, organizations introducing new digital systems should place primary emphasis on communicating tangible improvements in performance, efficiency, or convenience, while ensuring that system design and onboarding processes minimize cognitive overloading and operational barriers. Such an approach aligns design and implementation strategies with the empirically supported hierarchy of determinants identified in this meta-analysis. Failure to strike the right balance between usefulness and ease of use could increase reputational risk [64,65].
At the same time, other relationships, including perceived ease of use → perceived usefulness, perceived ease of use → attitude, perceived usefulness → actual use, and behavioral intention → actual use, exhibit substantial variability across contexts, as indicated by prediction intervals that include zero. This implies that interventions based on these relationships may not produce consistent outcomes when applied across different technological, institutional, or user environments. For example, improving system usability does not necessarily translate into higher perceived usefulness or more favorable attitudes in contexts where users are already digitally experienced or where other concerns, such as trust or security, are more salient. Similarly, increasing perceived usefulness or behavioral intention does not guarantee actual usage, particularly in settings characterized by structural constraints, limited access, or entrenched behavioral patterns.
The substantial heterogeneity observed across studies also carries important managerial and policy implications. The observed variation in effect sizes indicates that the strength of TAM relationships is highly contingent on contextual and cultural conditions. One should expect different dynamics according to variations in social norms, age, gender and political climate. At the same time, heterogeneity in the size and scope of financial institutions is consequential to operational risk and efficiency of digitalization. Some studies report that smaller banks benefit to a greater extent from digitalization. Operational risk appears to be contingent in great part on strategic and business-level digitalization, driven by business model innovation [66].
Moreover, outside financial and operational risks, the digitalization of finance and the adoption of its business model impact another dimension: cybersecurity [67]. In principle, the range of stakeholders affected by financial and systemic risk stemming from online fraud is open-ended. Consumers, financial institutions, and policymakers alike have a huge stake in controlling and reducing cyberthreats linked to the adoption of new digital technologies. Consumers fear for their wealth and wellbeing, banks and other financial institutions fear for their operational efficiency and reputation, and policymakers are concerned with the long-term stability of the entire financial system [68,69,70].
Finally, policymakers have yet another reason and a keen interest in a successful financial digital transformation. On the one hand, digital banking is changing how monetary policies are being transmitted, opening new avenues to digital currencies and cashless transactions [71,72,73,74]. On the other hand, financial digitalization appears to impact tax compliance and government revenues [75,76].
Accordingly, financial institutions should avoid one-size-fits-all implementation strategies and instead tailor adoption initiatives to the specific characteristics of their target user groups, such as levels of technological readiness, digital literacy, prior experience, cultural and social context, and trust in digital systems.
Policymakers and system developers should lean towards transparent data governance frameworks, user-centered system design, and communication strategies that explicitly address privacy, security, and reliability. The practical effectiveness of technology acceptance depends critically on alignment with the social, cultural, and organizational settings in which digital technologies are introduced.

4.4. Limitations and Future Research

Our work is not without limitations. First, the substantial heterogeneity observed across studies indicates that unmeasured contextual factors—such as cultural setting, technological maturity, institutional environment, or methodological design—systematically shape the magnitude of reported effects. While prior research has attempted to account for this variability through moderator analyses and meta-regression, substantial unexplained heterogeneity typically remains. This highlights an important boundary condition of the present approach; prediction intervals capture the extent and practical implications of variability but are not capable of explicitly modelling contextual influences.
Rather than suggesting that heterogeneity can be fully resolved through additional moderators, these findings point to the need for a complementary strategy. Future studies should aim not only to identify context-specific drivers of variability, but also to better understand the conditions under which TAM relationships are likely to hold or fail.
Second, the limited number of primary studies available for certain relationships, most notably the behavioral intention–actual use path, constrains the interpretation of the results. With only a small number of effect sizes, the precision of pooled estimates is reduced and the estimation of between-study variance (τ2) becomes less stable, which in turn leads to wider and potentially less reliable prediction intervals. Considering that prediction intervals are sensitive to both sample size and heterogeneity, they should be interpreted with caution. Future empirical research that prioritizes the measurement of actual usage outcomes, particularly in longitudinal and real-world settings, would substantially strengthen the evidence base and enable more reliable assessments of the intention–behavior link.
Finally, our study focused on the core TAM constructs to preserve theoretical coherence and comparability across studies. While this choice ensures internal consistency, it may omit relevant contextual and behavioral factors—such as trust, perceived risk, facilitating conditions, or habits—that could contribute to the observed variability in effect sizes. Importantly, the inclusion of such constructs should not be expected to fully eliminate heterogeneity, but rather to provide a more nuanced understanding of the conditions under which TAM relationships hold. Future meta-analyses may extend this work by systematically integrating complementary constructs—such as trust, perceived risk, facilitating conditions, or habit—to capture the growing complexity of digital adoption processes. Such extensions would allow researchers to evaluate how TAM’s core mechanisms interact with broader behavioral and contextual factors in increasingly sophisticated technological environments.

5. Conclusions

This study provides a comprehensive meta-analytic synthesis of the core relationships of the Technology Acceptance Model in the context of e-banking and related digital technologies. Drawing on evidence from 44 independent effect sizes extracted from 43 research articles, the analysis combines conventional random-effects meta-analysis with cumulative meta-analysis, influence diagnostics, prediction intervals, and publication bias assessments to examine both the average strength and the stability of TAM relationships across various contexts. The findings confirm that perceived usefulness, attitude, and behavioral intention form a structurally robust core of the model, while relationships involving perceived ease of use and actual use exhibit greater contextual sensitivity. At the same time, substantial between-study heterogeneity persists across all relationships. Prediction intervals reveal that this variability has important implications for interpretation. Specifically, while some relationships remain consistently positive across contexts, others exhibit intervals that include zero, indicating that their strength—and in some cases even their direction—may depend on contextual conditions.
These results highlight a central insight of this study: statistically robust average effects do not necessarily translate into context-stable relationships. Rather than interpreting heterogeneity solely as a statistical problem to be explained or reduced, this study shows that it represents a defining feature of TAM-based evidence, delineating the conditions under which relationships can be expected to hold. In this sense, heterogeneity functions as a boundary condition for generalizability, rather than merely a nuisance parameter.
Beyond corroborating prior evidence, this study makes several distinct contributions to literature. First, by focusing on a more selective, consistent, and theoretically coherent evidence base indexed in Web of Science and Scopus, it shows that previously reported TAM relationships remain stable even under deliberate sample restrictions, thereby providing a most needed robustness check of previous studies. Second, the use of cumulative meta-analysis reveals that over time, key TAM effects converged early on, and have remained remarkably stable as the literature expanded, reinforcing confidence in the durability of the model’s core mechanisms. Third, the joint consideration of heterogeneity measures and prediction intervals advances the interpretation of variability in TAM research by distinguishing structural robustness from contextual plasticity. While our study positions TAM as theoretically resilient, it also emphasizes it as a nuanced framework whose predictive strength depends on how it is embedded within specific technological, cultural, and institutional settings.

Supplementary Materials

The following supporting information can be downloaded at: https://www.mdpi.com/article/10.3390/jtaer21050129/s1.

Author Contributions

Conceptualization, E.D.; methodology, E.D.; software, E.D.; formal analysis, E.D.; investigation, E.D., I.-A.P. and I.M.; resources, I.-A.P., C.V. and I.M.; data curation, I.-A.P.; writing—original draft preparation, E.D., I.-A.P. and C.V.; writing—review and editing, E.D., C.V. and I.M.; supervision, E.D. All authors have read and agreed to the published version of the manuscript.

Funding

This research received no external funding. The APC was supported by the University of Bucharest.

Institutional Review Board Statement

Not applicable.

Informed Consent Statement

Not applicable.

Data Availability Statement

No new data were created or analyzed in this study. Data sharing is not applicable to this article.

Conflicts of Interest

The authors declare no conflicts of interest.

Abbreviations

The following abbreviations are used in this manuscript:
TAMTechnology Acceptance Model
CMACumulative Meta-Analysis
WoSWeb of Science
CIConfidence Interval
PEOUPerceived Ease of Use
PUPerceived Usefulness
ATTAttitude
BIBehavioral Intention
AUActual Use

References

  1. Aakriti, A. E-Banking in India. Int. J. Multidiscip. Res. 2023, 5, 2295. [Google Scholar] [CrossRef]
  2. Mintah, R.; Owusu, G.M.Y.; Amoah-Bekoe, R.; Obro-Adibo, G. Banking without Limits: A Bibliometric Analysis of Scholarly Works on Electronic Banking. Int. J. Bank Mark. 2024, 42, 1559–1586. [Google Scholar] [CrossRef]
  3. Nathiya, T.; Janaki Priya, K. Analysis of Electronic Banking and Information Technology Using the TOPSIS Method. REST J. Bank. Account. Bus. 2023, 2, 32–41. [Google Scholar] [CrossRef]
  4. Surekha, A. Electronic Banking and Information Technology Using the TOPSIS Method. Trends Financ. Econ. 2023, 1, 38–47. [Google Scholar] [CrossRef]
  5. Gayan Nayanajith, D.A.; Weerasiri, R.A.S.; Damunupola, K.A. A Review on E-Banking Adoption in the Context of E-Service Quality. Sri Lanka J. Mark. 2019, 5, 25–52. [Google Scholar] [CrossRef]
  6. Hanafizadeh, P.; Keating, B.W.; Khedmatgozar, H.R. A Systematic Review of Internet Banking Adoption. Telemat. Inform. 2014, 31, 492–510. [Google Scholar] [CrossRef]
  7. Ozili, P.K. Impact of Digital Finance on Financial Inclusion and Stability. Borsa Istanb. Rev. 2018, 18, 329–340. [Google Scholar] [CrossRef]
  8. Carranza, R.; Díaz, E.; Sánchez-Camacho, C.; Martín-Consuegra, D. E-Banking Adoption: An Opportunity for Customer Value Co-Creation. Front. Psychol. 2021, 11, 621248. [Google Scholar] [CrossRef] [PubMed]
  9. Xue, M.; Hitt, L.M.; Chen, P. Determinants and Outcomes of Internet Banking Adoption. Manag. Sci. 2011, 57, 291–307. [Google Scholar] [CrossRef]
  10. Grigorescu, A.; Oprisan, O.; Lincaru, C.; Pirciog, C.S. E-Banking Convergence and the Adopter’s Behavior Changing Across EU Countries. Sage Open 2023, 13, 21582440231220455. [Google Scholar] [CrossRef]
  11. Sánchez-Torres, J.A.; Canada, F.-J.A.; Sandoval, A.V.; Alzate, J.-A.S. E-Banking in Colombia: Factors Favouring Its Acceptance, Online Trust and Government Support. Int. J. Bank Mark. 2018, 36, 170–183. [Google Scholar] [CrossRef]
  12. Alnemer, H.A. Determinants of Digital Banking Adoption in the Kingdom of Saudi Arabia: A Technology Acceptance Model Approach. Digit. Bus. 2022, 2, 100037. [Google Scholar] [CrossRef]
  13. Pikkarainen, T.; Pikkarainen, K.; Karjaluoto, H.; Pahnila, S. Consumer Acceptance of Online Banking: An Extension of the Technology Acceptance Model. Internet Res. 2004, 14, 224–235. [Google Scholar] [CrossRef]
  14. Marakarkandy, B.; Yajnik, N.; Dasgupta, C. Enabling Internet Banking Adoption: An Empirical Examination with an Augmented Technology Acceptance Model (TAM). JEIM 2017, 30, 263–294. [Google Scholar] [CrossRef]
  15. Patel, K.J.; Patel, H.J. Adoption of Internet Banking Services in Gujarat: An Extension of TAM with Perceived Security and Social Influence. Int. J. Bank Mark. 2018, 36, 147–169. [Google Scholar] [CrossRef]
  16. Ly, B.; Ly, R. Internet Banking Adoption under Technology Acceptance Model—Evidence from Cambodian Users. Comput. Hum. Behav. Rep. 2022, 7, 100224. [Google Scholar] [CrossRef]
  17. Kimiagari, S.; Baei, F. Promoting E-Banking Actual Usage: Mix of Technology Acceptance Model and Technology-Organisation-Environment Framework. Enterp. Inf. Syst. 2022, 16, 1894356. [Google Scholar] [CrossRef]
  18. Hornuf, L.; Safari, K.; Voshaar, J. Mobile Fintech Adoption in Sub-Saharan Africa: A Systematic Literature Review and Meta-Analysis. Res. Int. Bus. Financ. 2025, 73, 102529. [Google Scholar] [CrossRef]
  19. Mentari, S.; Mujiyanti, S.A.; Palasari, R.S.; Handayati, P.; Hermawan, A. Comparative Analysis of TAM and UTAUT Models for Digital Technology Adoption in Banking: A Meta-Regression Approach. Indones. J. Contemp. Multidiscip. Res. 2025, 4, 123–138. [Google Scholar] [CrossRef]
  20. Montazemi, A.R.; Qahri-Saremi, H. Factors Affecting Adoption of Online Banking: A Meta-Analytic Structural Equation Modeling Study. Inf. Manag. 2015, 52, 210–226. [Google Scholar] [CrossRef]
  21. Neves, C.; Oliveira, T.; Santini, F.; Gutman, L. Adoption and Use of Digital Financial Services: A Meta Analysis of Barriers and Facilitators. Int. J. Inf. Manag. Data Insights 2023, 3, 100201. [Google Scholar] [CrossRef]
  22. Sharma, S.; Sharma, R.; Kayal, G.; Kaur, J. Digital Banking: A Meta-Analysis Approach. Indian J. Mark. 2022, 52, 41–68. [Google Scholar] [CrossRef]
  23. Baker, W.L.; Michael White, C.; Cappelleri, J.C.; Kluger, J.; Coleman, C.I. From the Health Outcomes, Policy, and Economics (HOPE) Collaborative Group Understanding Heterogeneity in Meta-Analysis: The Role of Meta-Regression. Int. J. Clin. Pract. 2009, 63, 1426–1434. [Google Scholar] [CrossRef] [PubMed]
  24. Spineli, L.M.; Pandis, N. Exploring Heterogeneity in Meta-Analysis: Meta-Regression Analysis. Am. J. Orthod. Dentofac. Orthop. 2020, 158, 623–625. [Google Scholar] [CrossRef]
  25. Van Lissa, C.J.; Van Erp, S.; Clapper, E. Selecting Relevant Moderators with Bayesian Regularized Meta-regression. Res. Synth. Methods 2023, 14, 301–322. [Google Scholar] [CrossRef]
  26. Cordero, A.; Santos-Gallego, C.G.; Oterino, A.; Rodriguez-Mañero, M.; Fernández-Olmo, R.; Quesada, A.J. Meta-Analysis and Meta-Regression for Uncertain Areas and the Estimation of Possible Benefit of Future Therapies. Eur. Cardiol. 2025, 20, e25. [Google Scholar] [CrossRef]
  27. Haghnejad, A.; Farahati, M. An Overview of Meta-Analytic Methods for Economic Research. arXiv 2024, arXiv:2412.10608. [Google Scholar] [CrossRef]
  28. Thompson, S.G.; Higgins, J.P.T. How Should Meta-regression Analyses Be Undertaken and Interpreted? Stat. Med. 2002, 21, 1559–1573. [Google Scholar] [CrossRef]
  29. Jackson, D.; Turner, R.; Rhodes, K.; Viechtbauer, W. Methods for Calculating Confidence and Credible Intervals for the Residual Between-Study Variance in Random Effects Meta-Regression Models. BMC Med. Res. Methodol. 2014, 14, 103. [Google Scholar] [CrossRef]
  30. Santini, F.D.O.; Ladeira, W.J.; Sampaio, C.H.; Perin, M.G.; Dolci, P.C. A Meta-Analytical Study of Technological Acceptance in Banking Contexts. Int. J. Bank Mark. 2019, 37, 755–774. [Google Scholar] [CrossRef]
  31. Liu, Z.; Ben, S.; Zhang, R. Factors Affecting Consumers’ Mobile Payment Behavior: A Meta-Analysis. Electron. Commer. Res. 2019, 19, 575–601. [Google Scholar] [CrossRef]
  32. Faggion, C.M.; Menne, M.C.; Pandis, N. Prediction Intervals Should Be Included in Meta-analyses Published in Dentistry. Eur. J. Oral Sci. 2021, 129, e12827. [Google Scholar] [CrossRef]
  33. IntHout, J.; Ioannidis, J.P.A.; Rovers, M.M.; Goeman, J.J. Plea for Routinely Presenting Prediction Intervals in Meta-Analysis. BMJ Open 2016, 6, e010247. [Google Scholar] [CrossRef]
  34. Mátrai, P.; Kói, T.; Sipos, Z.; Farkas, N. Assessing the Properties of the Prediction Interval in Random-Effects Meta-Analysis. Res. Synth. Methods 2026, 17, 517–537. [Google Scholar] [CrossRef]
  35. Migliavaca, C.B.; Stein, C.; Colpani, V.; Barker, T.H.; Ziegelmann, P.K.; Munn, Z.; Falavigna, M. Prevalence Estimates Reviews—Systematic Review Methodology Group (PERSyst). Meta-analysis of Prevalence: I2 Statistic and How to Deal with Heterogeneity. Res. Synth. Methods 2022, 13, 363–367. [Google Scholar] [CrossRef] [PubMed]
  36. Nagashima, K.; Noma, H.; Furukawa, T.A. Prediction Intervals for Random-Effects Meta-Analysis: A Confidence Distribution Approach. Stat. Methods Med. Res. 2019, 28, 1689–1702. [Google Scholar] [CrossRef] [PubMed]
  37. Veroniki, A.A.; Jackson, D.; Bender, R.; Kuss, O.; Langan, D.; Higgins, J.P.T.; Knapp, G.; Salanti, G. Methods to Calculate Uncertainty in the Estimated Overall Effect Size from a Random-effects Meta-analysis. Res. Synth. Methods 2019, 10, 23–43. [Google Scholar] [CrossRef] [PubMed]
  38. Al Amer, F.M.; Lin, L. Empirical Assessment of Prediction Intervals in Cochrane Meta-analyses. Eur. J. Clin. Investig. 2021, 51, e13524. [Google Scholar] [CrossRef]
  39. Borg, D.N.; Impellizzeri, F.M.; Borg, S.J.; Hutchins, K.P.; Stewart, I.B.; Jones, T.; Baguley, B.J.; Orssatto, L.B.R.; Bach, A.J.E.; Osborne, J.O.; et al. Meta-analysis Prediction Intervals Are under Reported in Sport and Exercise Medicine. Scand. Med. Sci. Sports 2024, 34, e14603. [Google Scholar] [CrossRef]
  40. Graham, P.L.; Moran, J.L. Robust Meta-Analytic Conclusions Mandate the Provision of Prediction Intervals in Meta-Analysis Summaries. J. Clin. Epidemiol. 2012, 65, 503–510. [Google Scholar] [CrossRef]
  41. Kronthaler, D.; Held, L. Edgington’s Method for Random-Effects Meta-Analysis Part I: Estimation. arXiv 2025, arXiv:2510.12301. [Google Scholar]
  42. Seehra, J.; Stonehouse-Smith, D.; Pandis, N. Prediction Intervals Reporting in Orthodontic Meta-Analyses. Eur. J. Orthod. 2021, 43, 596–600. [Google Scholar] [CrossRef]
  43. Partlett, C.; Riley, R.D. Random Effects Meta-analysis: Coverage Performance of 95% Confidence and Prediction Intervals Following REML Estimation. Stat. Med. 2017, 36, 301–317. [Google Scholar] [CrossRef]
  44. Van Aert, R.C.M.; Schmid, C.H.; Svensson, D.; Jackson, D. Study Specific Prediction Intervals for Random-effects Meta-analysis: A Tutorial: Prediction Intervals in Meta-analysis. Res. Synth. Methods 2021, 12, 429–447. [Google Scholar] [CrossRef]
  45. Borenstein, M. How to Understand and Report Heterogeneity in a Meta-Analysis: The Difference between I-Squared and Prediction Intervals. Integr. Med. Res. 2023, 12, 101014. [Google Scholar] [CrossRef]
  46. Borenstein, M. Avoiding Common Mistakes in Meta-analysis: Understanding the Distinct Roles of Q, I-squared, Tau-squared, and the Prediction Interval in Reporting Heterogeneity. Res. Synth. Methods 2024, 15, 354–368. [Google Scholar] [CrossRef] [PubMed]
  47. Choi, G.J.; Kang, H. Heterogeneity in Meta-Analyses: An Unavoidable Challenge Worth Exploring. Korean J. Anesthesiol. 2025, 78, 301–314. [Google Scholar] [CrossRef] [PubMed]
  48. Cordero, C.P.; Dans, A.L. Key Concepts in Clinical Epidemiology: Detecting and Dealing with Heterogeneity in Meta-Analyses. J. Clin. Epidemiol. 2021, 130, 149–151. [Google Scholar] [CrossRef]
  49. Gurevitch, J.; Koricheva, J.; Nakagawa, S.; Stewart, G. Meta-Analysis and the Science of Research Synthesis. Nature 2018, 555, 175–182. [Google Scholar] [CrossRef]
  50. Kulinskaya, E.; Mah, E.Y. Cumulative Meta-Analysis: What Works. Res. Synth. Methods 2022, 13, 48–67. [Google Scholar] [CrossRef]
  51. Mongeon, P.; Paul-Hus, A. The Journal Coverage of Web of Science and Scopus: A Comparative Analysis. Scientometrics 2016, 106, 213–228. [Google Scholar] [CrossRef]
  52. Falagas, M.E.; Pitsouni, E.I.; Malietzis, G.A.; Pappas, G. Comparison of PubMed, Scopus, Web of Science, and Google Scholar: Strengths and Weaknesses. FASEB J. 2008, 22, 338–342. [Google Scholar] [CrossRef]
  53. Hamzah, H.; Hamzah, M.I.; Zulkifli, H. Systematic Literature Review on the Elements of Metacognition-Based Higher Order Thinking Skills (HOTS) Teaching and Learning Modules. Sustainability 2022, 14, 813. [Google Scholar] [CrossRef]
  54. Nasrabadi, M.A.; Beauregard, Y.; Ekhlassi, A. The Implication of User-Generated Content in New Product Development Process: A Systematic Literature Review and Future Research Agenda. Technol. Forecast. Soc. Change 2024, 206, 123551. [Google Scholar] [CrossRef]
  55. Wanyama, S.B.; McQuaid, R.W.; Kittler, M. Where You Search Determines What You Find: The Effects of Bibliographic Databases on Systematic Reviews. Int. J. Soc. Res. Methodol. 2022, 25, 409–422. [Google Scholar] [CrossRef]
  56. Idris, N.; Talib, O.; Razali, F. Strategies in Mastering Science Process Skills in Science Experiments: A Systematic Literature Review. J. Pendidik. IPA Indones. 2022, 11, 155–170. [Google Scholar] [CrossRef]
  57. Gusenbauer, M. Beyond Google Scholar, Scopus, and Web of Science: An Evaluation of the Backward and Forward Citation Coverage of 59 Databases’ Citation Indices. Res. Synth. Methods 2024, 15, 802–817. [Google Scholar] [CrossRef]
  58. Gusenbauer, M.; Haddaway, N.R. Which Academic Search Systems Are Suitable for Systematic Reviews or Meta-analyses? Evaluating Retrieval Qualities of Google Scholar, PubMed, and 26 Other Resources. Res. Synth. Methods 2020, 11, 181–217. [Google Scholar] [CrossRef] [PubMed]
  59. Afraz, A.; Chashmyazdan, M.; Khajouei, R.; Bagherinezhad, Z. Literature Searches in Medical Informatics Systematic Reviews: Suggested Approaches. Med. Ref. Serv. Q. 2025, 44, 17–30. [Google Scholar] [CrossRef]
  60. Lin, L.; Chu, H.; Hodges, J.S. Alternative Measures of Between-Study Heterogeneity in Meta-Analysis: Reducing the Impact of Outlying Studies. Biometrics 2017, 73, 156–166. [Google Scholar] [CrossRef]
  61. Meng, Z.; Wang, J.; Lin, L.; Wu, C. Sensitivity Analysis with Iterative Outlier Detection for Systematic Reviews and Meta-analyses. Stat. Med. 2024, 43, 1549–1563. [Google Scholar] [CrossRef] [PubMed]
  62. Patsopoulos, N.A.; Evangelou, E.; Ioannidis, J.P. Sensitivity of Between-Study Heterogeneity in Meta-Analysis: Proposed Metrics and Empirical Evaluation. Int. J. Epidemiol. 2008, 37, 1148–1157. [Google Scholar] [CrossRef]
  63. Egger, M.; Davey Smith, G.; Schneider, M.; Minder, C. Bias in Meta-Analysis Detected by a Simple, Graphical Test. BMJ 1997, 315, 629–634. [Google Scholar] [CrossRef] [PubMed]
  64. Bernini, F.; Ferretti, P.; Angelini, A. The Digitalization-Reputation Link: A Multiple Case-Study on Italian Banking Groups. Meditari Account. Res. 2022, 30, 1210–1240. [Google Scholar] [CrossRef]
  65. Kaur, B.; Kiran, S.; Grima, S.; Rupeika-Apoga, R. Digital Banking in Northern India: The Risks on Customer Satisfaction. Risks 2021, 9, 209. [Google Scholar] [CrossRef]
  66. Yu, Z.; Liu, J. The Digital Revolution in Banking: Unpacking Risk Management in the Age of Transformation. Int. Rev. Econ. Financ. 2025, 103, 104444. [Google Scholar] [CrossRef]
  67. Buckley, R.P.; Arner, D.W.; Zetzsche, D.A.; Selga, E. The Dark Side of Digital Financial Transformation: The New Risks of FinTech and the Rise of TechRisk. SSRN J. 2019. [Google Scholar] [CrossRef]
  68. Bahmanova, A.; Lace, N. Cyber Risks: Systematic Literature Analysis. J. Syst. Cybern. Inform. 2024, 22, 37–47. [Google Scholar] [CrossRef]
  69. Głogowski, A. Systemic and Cyber Risk: The Two Monsters of Financial System. In Digital Finance and the Future of the Global Financial System; Routledge: London, UK, 2022. [Google Scholar]
  70. Vučinić, M.; Luburić, R. Fintech, Risk-Based Thinking and Cyber Risk. J. Cent. Bank. Theory Pract. 2022, 11, 27–53. [Google Scholar] [CrossRef]
  71. Al-Laham, M.; Al-Tarawneh, H.; Abdallat, N. Development of Electronic Money and Its Impact on the Central Bank Role and Monetary Policy. Issues Informing Sci. Inf. Technol. 2009, 6, 339–349. [Google Scholar] [CrossRef]
  72. Chu, V.; Dahlhaus, T.; Hajzler, C.; Yanni, P.-Y. Digitalization: Implications for Monetary Policy. In Bank of Canada Staff Discussion Paper; Bank of Canada: Ottawa, ON, Cnanada, 2023. [Google Scholar] [CrossRef]
  73. Jiang, S.; Qiu, S.; Zhou, H. Will Digital Financial Development Affect the Effectiveness of Monetary Policy in Emerging Market Countries? Econ. Res.-Ekon. Istraživanja 2022, 35, 3437–3472. [Google Scholar] [CrossRef]
  74. Kahyaoglu, H. The Impact of Artificial Intelligence on Central Banking and Monetary Policies. In The Impact of Artificial Intelligence on Governance, Economics and Finance, Volume I; Bozkuş Kahyaoğlu, S., Ed.; Accounting, Finance, Sustainability, Governance & Fraud: Theory and Application; Springer Nature: Singapore, 2021; pp. 83–98. [Google Scholar]
  75. Han, L.; Wang, Y.; Sun, J.; Sun, Z. How Does Digital Technology Application Affect Tax Compliance? Financ. Res. Lett. 2025, 85, 107932. [Google Scholar] [CrossRef]
  76. Kitsios, E.; Jalles, J.T.; Verdier, G. Tax Evasion from Cross-Border Fraud: Does Digitalization Make a Difference? Appl. Econ. Lett. 2023, 30, 1400–1406. [Google Scholar] [CrossRef]
Figure 1. PRISMA 2020 flow diagram.
Jtaer 21 00129 g001
Table 2. Descriptive statistics of correlation coefficients by TAM relationships across studies.
RelationshipMinMedianMeanMaxSDAvailable
Observations
PEOU_PU−0.0260.5860.5290.8800.23444
PEOU_ATT−0.0590.4620.4640.8100.20724
PEOU_BI0.0360.5130.4860.8230.18740
PU_ATT0.0730.4940.4800.7310.15924
PU_BI−0.2080.5420.5230.8770.20941
PU_AU0.2820.510.5510.8690.2087
ATT_BI0.1790.5520.5510.8330.17821
BI_AU−0.1050.560.5130.8610.3128
Table 3. The results of eight random-effects meta-analyses.
RelationPooled Effect SizeQI2
95% CI
Tau2
95% CI
Tau
95% CI
Prediction IntervalEgger’s Test
PEOU_PU0.571
[0.498; 0.636]
2112.60
(p < 0.001)
98.0% [97.7%; 98.2%]0.116
[0.078; 0.187]
0.341
[0.279; 0.433]
[−0.027, 0.868]z = −0.558,
p = 0.577
PEOU_ATT0.488
[0.399; 0.568]
663.51
(p < 0.001)
96.5% [95.7%; 97.2%]0.073
[0.042; 0.145]
0.270 [0.206; 0.381][−0.007, 0.791]z = 0.016,
p = 0.988
PEOU_BI0.512
[0.449; 0.570]
1059.31
(p < 0.001)
96.3% [95.6%; 96.9%]0.067
[0.044; 0.111]
0.259
[0.209; 0.334]
[0.052, 0.793]−1.44,
p = 0.150
PU_ATT0.495 [0.429; 0.555]469.95
(p < 0.001)
95.1% [93.7%; 96.2%]0.040 [0.022; 0.079]0.200
[0.150; 0.281]
[0.141, 0.736]−0.1012,
p = 0.919
PU_BI0.553 [0.487; 0.613]1206.70
(p < 0.001)
96.7% [96.1%; 97.2%]0.085 [0.056; 0.142]0.291 [0.237; 0.377][0.045, 0.834]−0.956,
p = 0.339
PU_AU0.591
[0.387; 0.740]
321.32
(p < 0.001)
98.1% [97.3%; 98.7%]0.130 [0.052; 0.635]0.361 [0.228; 0.797][−0.077 0.893]−0.21,
p = 0.834
ATT_BI0.578 [0.493; 0.653]733.28
(p < 0.001)
97.3% [96.6%; 97.8%]0.075
[0.042; 0.157]
0.273
[0.205; 0.396]
[0.111, 0.836]−0.476,
p = 0.634
BI_AU0.576 [0.328; 0.749]420.08
(p < 0.001)
98.3% [97.7%; 98.8%]0.204 [0.087; 0.865]0.451 [0.295; 0.930][−0.276, 0.921]−2.054,
p = 0.04
Disclaimer/Publisher’s Note: The statements, opinions and data contained in all publications are solely those of the individual author(s) and contributor(s) and not of MDPI and/or the editor(s). MDPI and/or the editor(s) disclaim responsibility for any injury to people or property resulting from any ideas, methods, instructions or products referred to in the content.