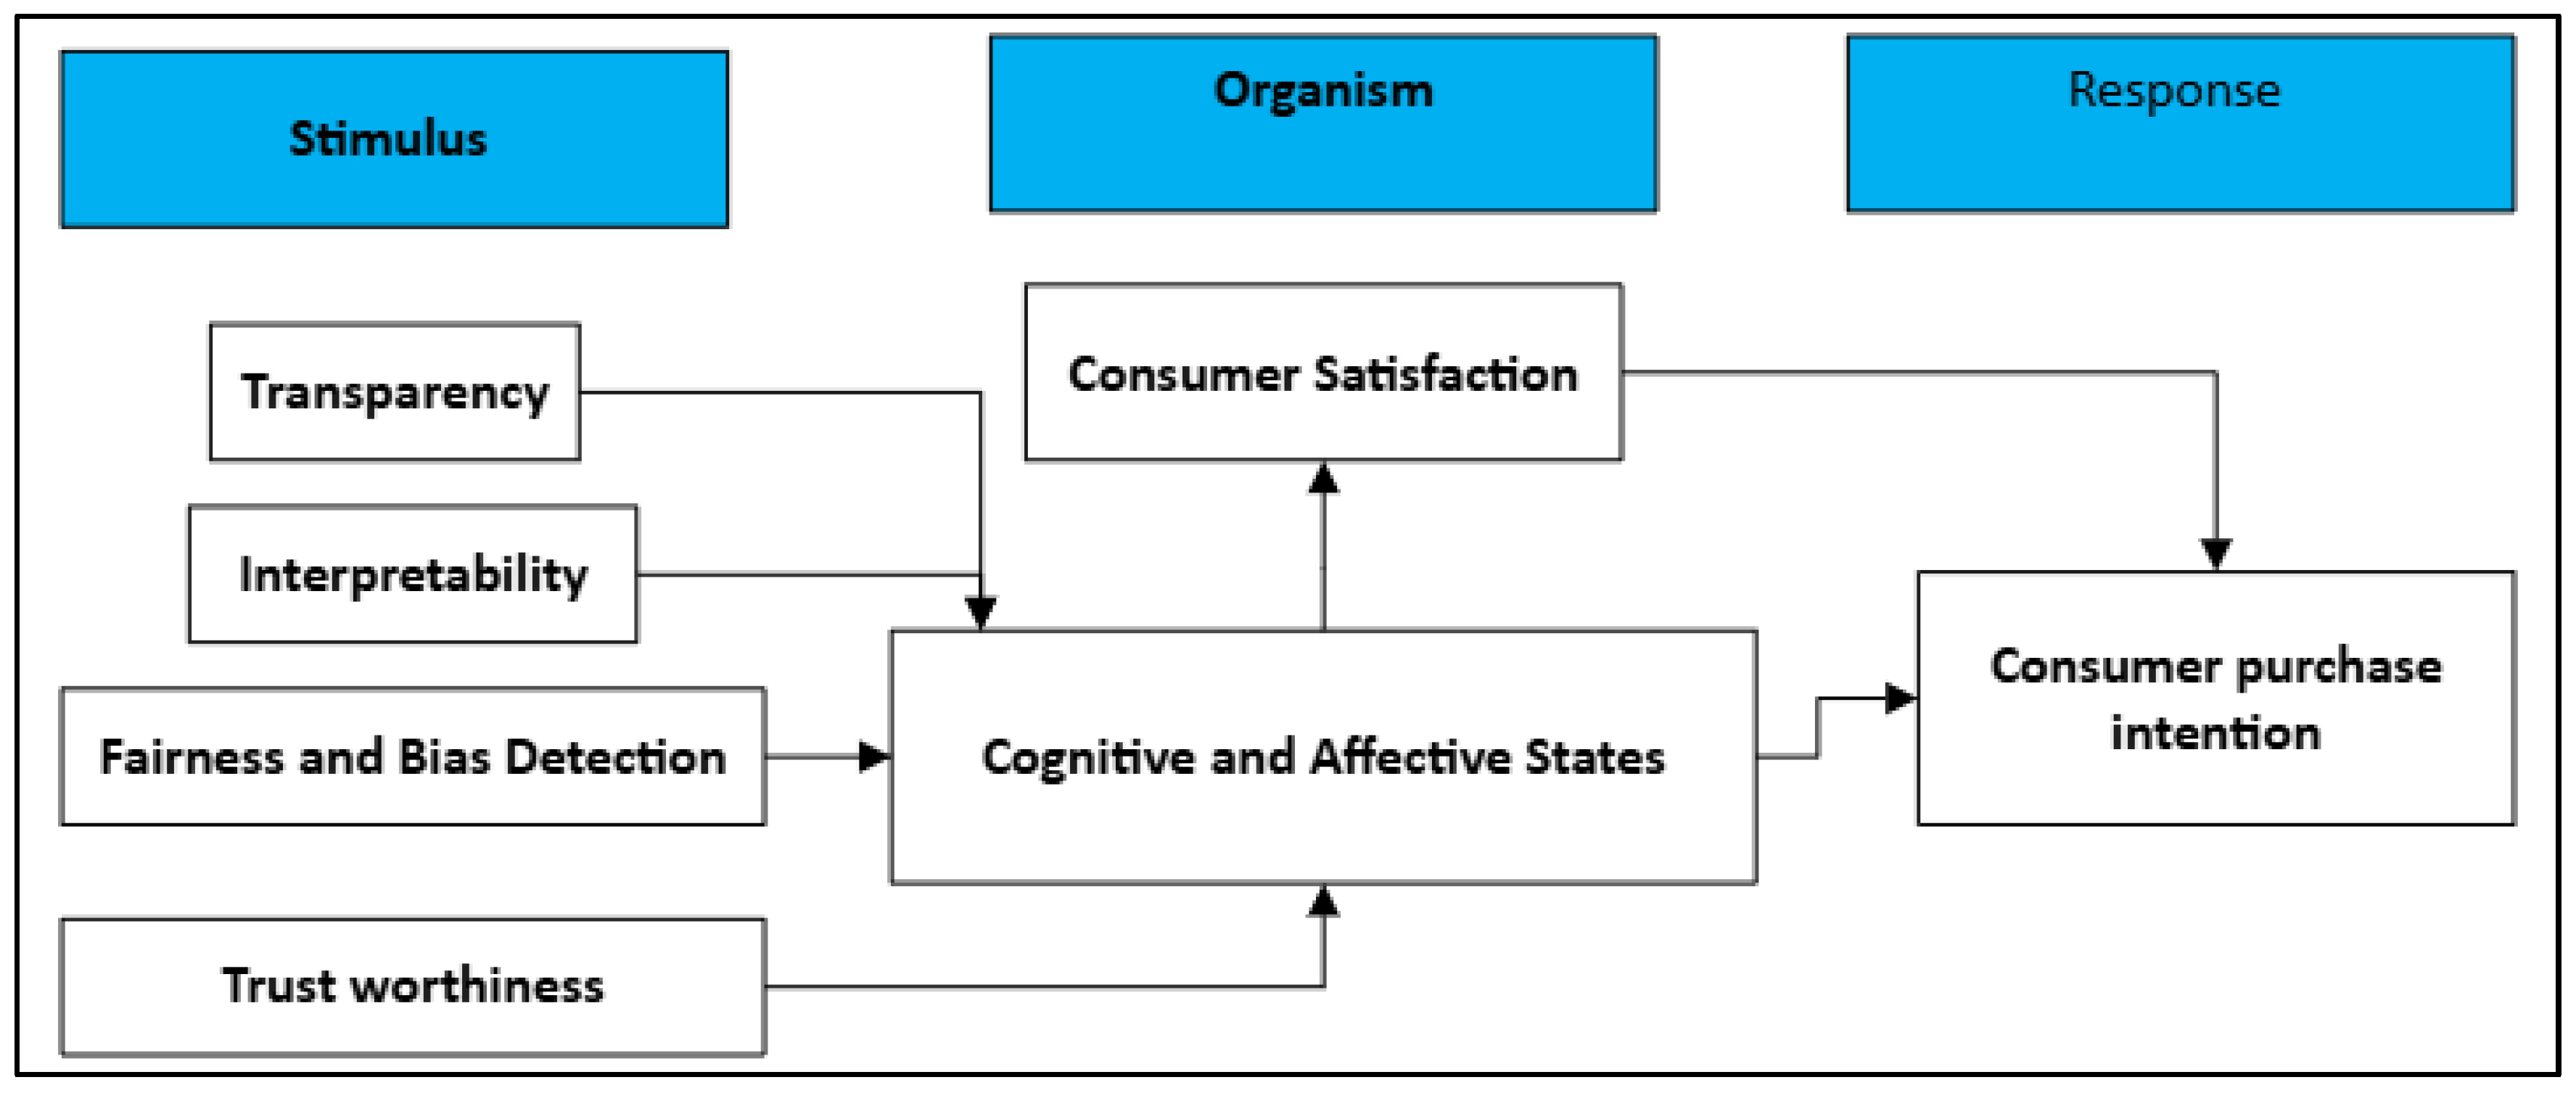
The demographic profile of respondents presented in
Table 1 highlights diverse representation across age, gender, education, income, and usage frequency. In terms of age, the majority fell within the 31–40 years category (36.3%, n = 217), followed by 41–50 years (25.1%, n = 150), 21–30 years (17.9%, n = 107), and up to 20 years (16.9%, n = 101), while only a small proportion were above 50 years (3.7%, n = 22). Gender distribution indicates a slight male majority (54.9%, n = 328) compared to females (45.1%, n = 269). Regarding educational attainment, the largest group reported holding technical degrees or diploma certificates (37.2%, n = 222), followed by postgraduates (23.1%, n = 138), professional qualifications (12.1%, n = 72), bachelor’s degrees (15.2%, n = 91), high school (7.7%, n = 46), and other qualifications (4.7%, n = 28). Income distribution reveals that nearly half of the respondents earn up to 5000 SAR (47.4%, n = 283), with 38.2% (n = 228) in the 5001–10,000 SAR range, 10.7% (n = 64) in the 10,001–20,000 SAR range, and only 3.7% (n = 22) earning above 20,000 SAR. Finally, usage frequency indicates that 27.5% (n = 164) of respondents engage occasionally, 26.3% (n = 157) monthly, 18.6% (n = 111) rarely, 14.4% (n = 86) weekly, and 13.2% (n = 79) daily, suggesting a tendency toward moderate-to-occasional engagement.
The multiple response analysis presented in
Table 2 provides insights into the distribution of explainable AI (XAI) features across commonly used mobile shopping applications in the Kingdom of Saudi Arabia. A total of 2196 responses were recorded, indicating that participants frequently reported using more than one application, as reflected in the cumulative percentage of cases (367.8%), which exceeds 100% due to multiple selections. Among the applications,
Temu registered the highest frequency (n = 408; 18.6% of responses; 68.3% of cases), followed by
Shein (n = 373; 17.0%; 62.5%) and
Trendyol (n = 333; 15.2%; 55.8%). In contrast, platforms such as
Janir Bookstore (n = 189; 8.6%; 31.7%) and
Flipchart (n = 191; 8.7%; 32.0%) received the lowest response shares, suggesting comparatively lower user adoption. Mid-range platforms included
Amazon.sa (n = 248; 11.3%; 41.5%) and
Alixpress (n = 259; 11.8%; 43.4%). These statistical values underscore the dominance of Temu, Shein, and Trendyol in the Saudi e-commerce landscape, while also indicating a fragmented yet diverse shopping ecosystem where multiple apps coexist and overlap in consumer preference patterns.
The descriptive statistics presented in
Table 3 provide insights into the stimulus factors influencing cognitive and response behaviour toward explainable artificial intelligence (XAI) and purchase intention. Among the constructs,
fairness and bias detection recorded the highest mean score (M = 4.0864, SD = 0.77963, and Var = 0.608), indicating that users strongly value unbiased decision-making and equitable treatment by AI systems.
Consumer satisfaction (M = 3.8428, SD = 0.72822, and Var = 0.530) and
cognitive and affective states (M = 3.7267, SD = 0.62598, and Var = 0.392) also demonstrated relatively high mean scores, suggesting that satisfaction with AI explanations and positive cognitive–affective experiences enhance consumer trust and decision-making effectiveness.
Consumer purchase intention followed closely (M = 3.6463, SD = 0.71145, and Var = 0.506), reflecting that XAI features positively shape users’ willingness to engage in purchase behaviour. Constructs such as
interpretability (M = 3.5168, SD = 0.99059, and Var = 0.981) and
trustworthiness (M = 3.4845, SD = 0.86060, and Var = 0.741) demonstrated moderate mean values, highlighting that while users appreciate clarity and accountability, these aspects still leave room for improvement.
Transparency yielded the lowest mean (M = 3.3388, SD = 0.85277, and Var = 0.727), suggesting that despite its importance, users perceive AI systems as less effective at fully disclosing their processes and reasoning. Overall, the results imply that fairness, satisfaction, and cognitive–affective states are the strongest drivers of favourable consumer responses, while transparency remains a weaker yet critical area for enhancing trust and purchase intentions in mobile shopping contexts.
Stimulus Factors Affecting Cognitive and Response Behaviour Toward Explainable Artificial Intelligence and Purchase Intention: A PLS-SEM
In this study, all constructs were modelled as reflective constructs because their indicators represent observable manifestations of the underlying latent variables related to explainable artificial intelligence features, cognitive evaluation, and behavioural responses. Variations in the latent construct are expected to cause corresponding changes in the indicators; therefore, internal consistency reliability, convergent validity, and discriminant validity assessments were applied to ensure measurement accuracy. The results presented in
Table 4 demonstrate that the constructs in the PLS-SEM model exhibit satisfactory reliability and validity based on established threshold criteria. Cronbach’s alpha values for all constructs range between 0.860 and 0.974, exceeding the recommended threshold of 0.70 [
39], indicating strong internal consistency. Similarly, composite reliability (rho a and rho c) values for all constructs are above 0.86, surpassing the acceptable cut-off of 0.70, thus confirming construct reliability. The average variance extracted (AVE) values for all constructs fall between 0.700 and 0.867, higher than the minimum threshold of 0.50 [
41], which establishes convergent validity. The f-square values indicate varying effect sizes, with consumer purchase intention (0.837) and trustworthiness (0.493) showing large effects, while fairness and bias detection (0.041) and interpretability (0.004) exhibit negligible effects. Furthermore, the Variance Inflation Factor (VIF) values are between 1.000 and 1.308, well below the critical threshold of 5.0, suggesting no multicollinearity issues. Collectively, these findings confirm the model’s reliability, validity, and adequacy for structural model testing.
Table 5 presents the results of discriminant validity testing using the Fornell–Larcker criterion, which compares the square root of the average variance extracted (AVE) for each construct (diagonal values) with the inter-construct correlations (off-diagonal values). According to the threshold suggested by Fornell and Larcker (1981), discriminant validity is established when the square root of AVE for each construct exceeds its correlations with other constructs. In this study, the square roots of AVE values for Consumer Satisfaction (0.859), Cognitive and Affective State of Mind (0.931), Consumer Purchase Intention (0.836), Fairness and Bias Detection (0.848), Interpretability (0.885), Transparency (0.852), and Trustworthiness (0.840) are all greater than their respective inter-construct correlations. For example, Consumer Satisfaction (0.859) shows stronger discriminant validity compared to its correlations with Purchase Intention (0.678) and Transparency (0.424). Similarly, Cognitive and Affective State of Mind (0.931) demonstrates higher discriminant validity over its correlations with Purchase Intention (0.759) and Trustworthiness (0.681). These results indicate that each construct shares more variance with its indicators than with other constructs, thus satisfying the Fornell–Larcker criterion and confirming adequate discriminant validity for the model.
The results of discriminant validity assessment using the Heterotrait–Monotrait ratio (HTMT) presented in
Table 6 indicate that the constructs demonstrate satisfactory discriminant validity. According to the established threshold criteria, HTMT values below 0.85 [
42] or 0.90 [
43] confirm discriminant validity in structural equation modelling. In this study, the HTMT values range between 0.037 and 0.877. While most values, such as between
Consumer Satisfaction and
Cognitive and Affective State of Mind (0.495),
Consumer Satisfaction and
Consumer Purchase Intention (0.733), or
Transparency and
Cognitive and Affective State of Mind (0.648), remain well below the recommended threshold, the association between
Trustworthiness and
Consumer Purchase Intention (0.877) approaches the upper acceptable limit. Nevertheless, as it does not exceed 0.90, the model maintains adequate discriminant validity, supporting the distinctiveness of the latent constructs and confirming overall model fitness [
44].
Table 7 of the correlation analysis shows the relation between transparency, interpretability, fairness and bias detection, trustworthiness, the cognitive and affective state, consumer satisfaction, and consumer purchase intention (N = 597). Transparency has a strong positive relationship with trustworthiness (r = 0.474,
p = 0.001), cognitive and affective states (r = 0.599,
p = 0.001), consumer satisfaction (r = 0.427,
p = 0.001), and purchase intention (r = 0.678,
p = 0.001). Cognitive and affective state (r = 0.676,
p < 0.001), satisfaction (r = 0.507,
p < 0.001), and purchase intention (r = 0.787,
p < 0.001) have a close relationship with trustworthiness. Likewise, cognitive and affective states have a significant relationship with satisfaction (r = 0.473,
p < 0.001) and purchase intention (r = 0.752,
p < 0.001). Conversely, interpretability and fairness have low or insignificant relationships with the majority of constructs. In general, findings indicate that transparency and trustworthiness are important to the development of consumer psychological reactions, satisfaction, and purchase intentions in the XAI context.
The results presented in
Table 8 demonstrate the explanatory power, predictive relevance, and model fit of the proposed structural model. The coefficient of determination (R
2) indicates that consumer satisfaction is moderately explained by its predictors (R
2 = 0.227), while cognitive and affective states of mind (R
2 = 0.588) and consumer purchase intention (R
2 = 0.706) exhibit substantial explanatory power, surpassing the recommended threshold of 0.50 [
39]. The adjusted R
2 values are closely aligned, confirming model stability. Predictive accuracy, assessed through RMSE and MAE, shows acceptable error levels, with consumer purchase intention demonstrating the lowest error (RMSE = 0.639, MAE = 0.483). Model fit indices reveal that the Standardised Root Mean Square Residual (SRMR) for the saturated model (0.068) falls below the cut-off of 0.08, indicating good fit, although the estimated model (0.093) slightly exceeds the threshold, suggesting a marginal misfit [
45]. The d ULS and d G values are within acceptable ranges, while the Normed Fit Index (NFI) values (0.701 and 0.690) approach the minimum acceptable threshold of 0.70, indicating moderate model fit. Overall, the model demonstrates adequate explanatory power and predictive relevance, with generally acceptable but improvable fit indices.
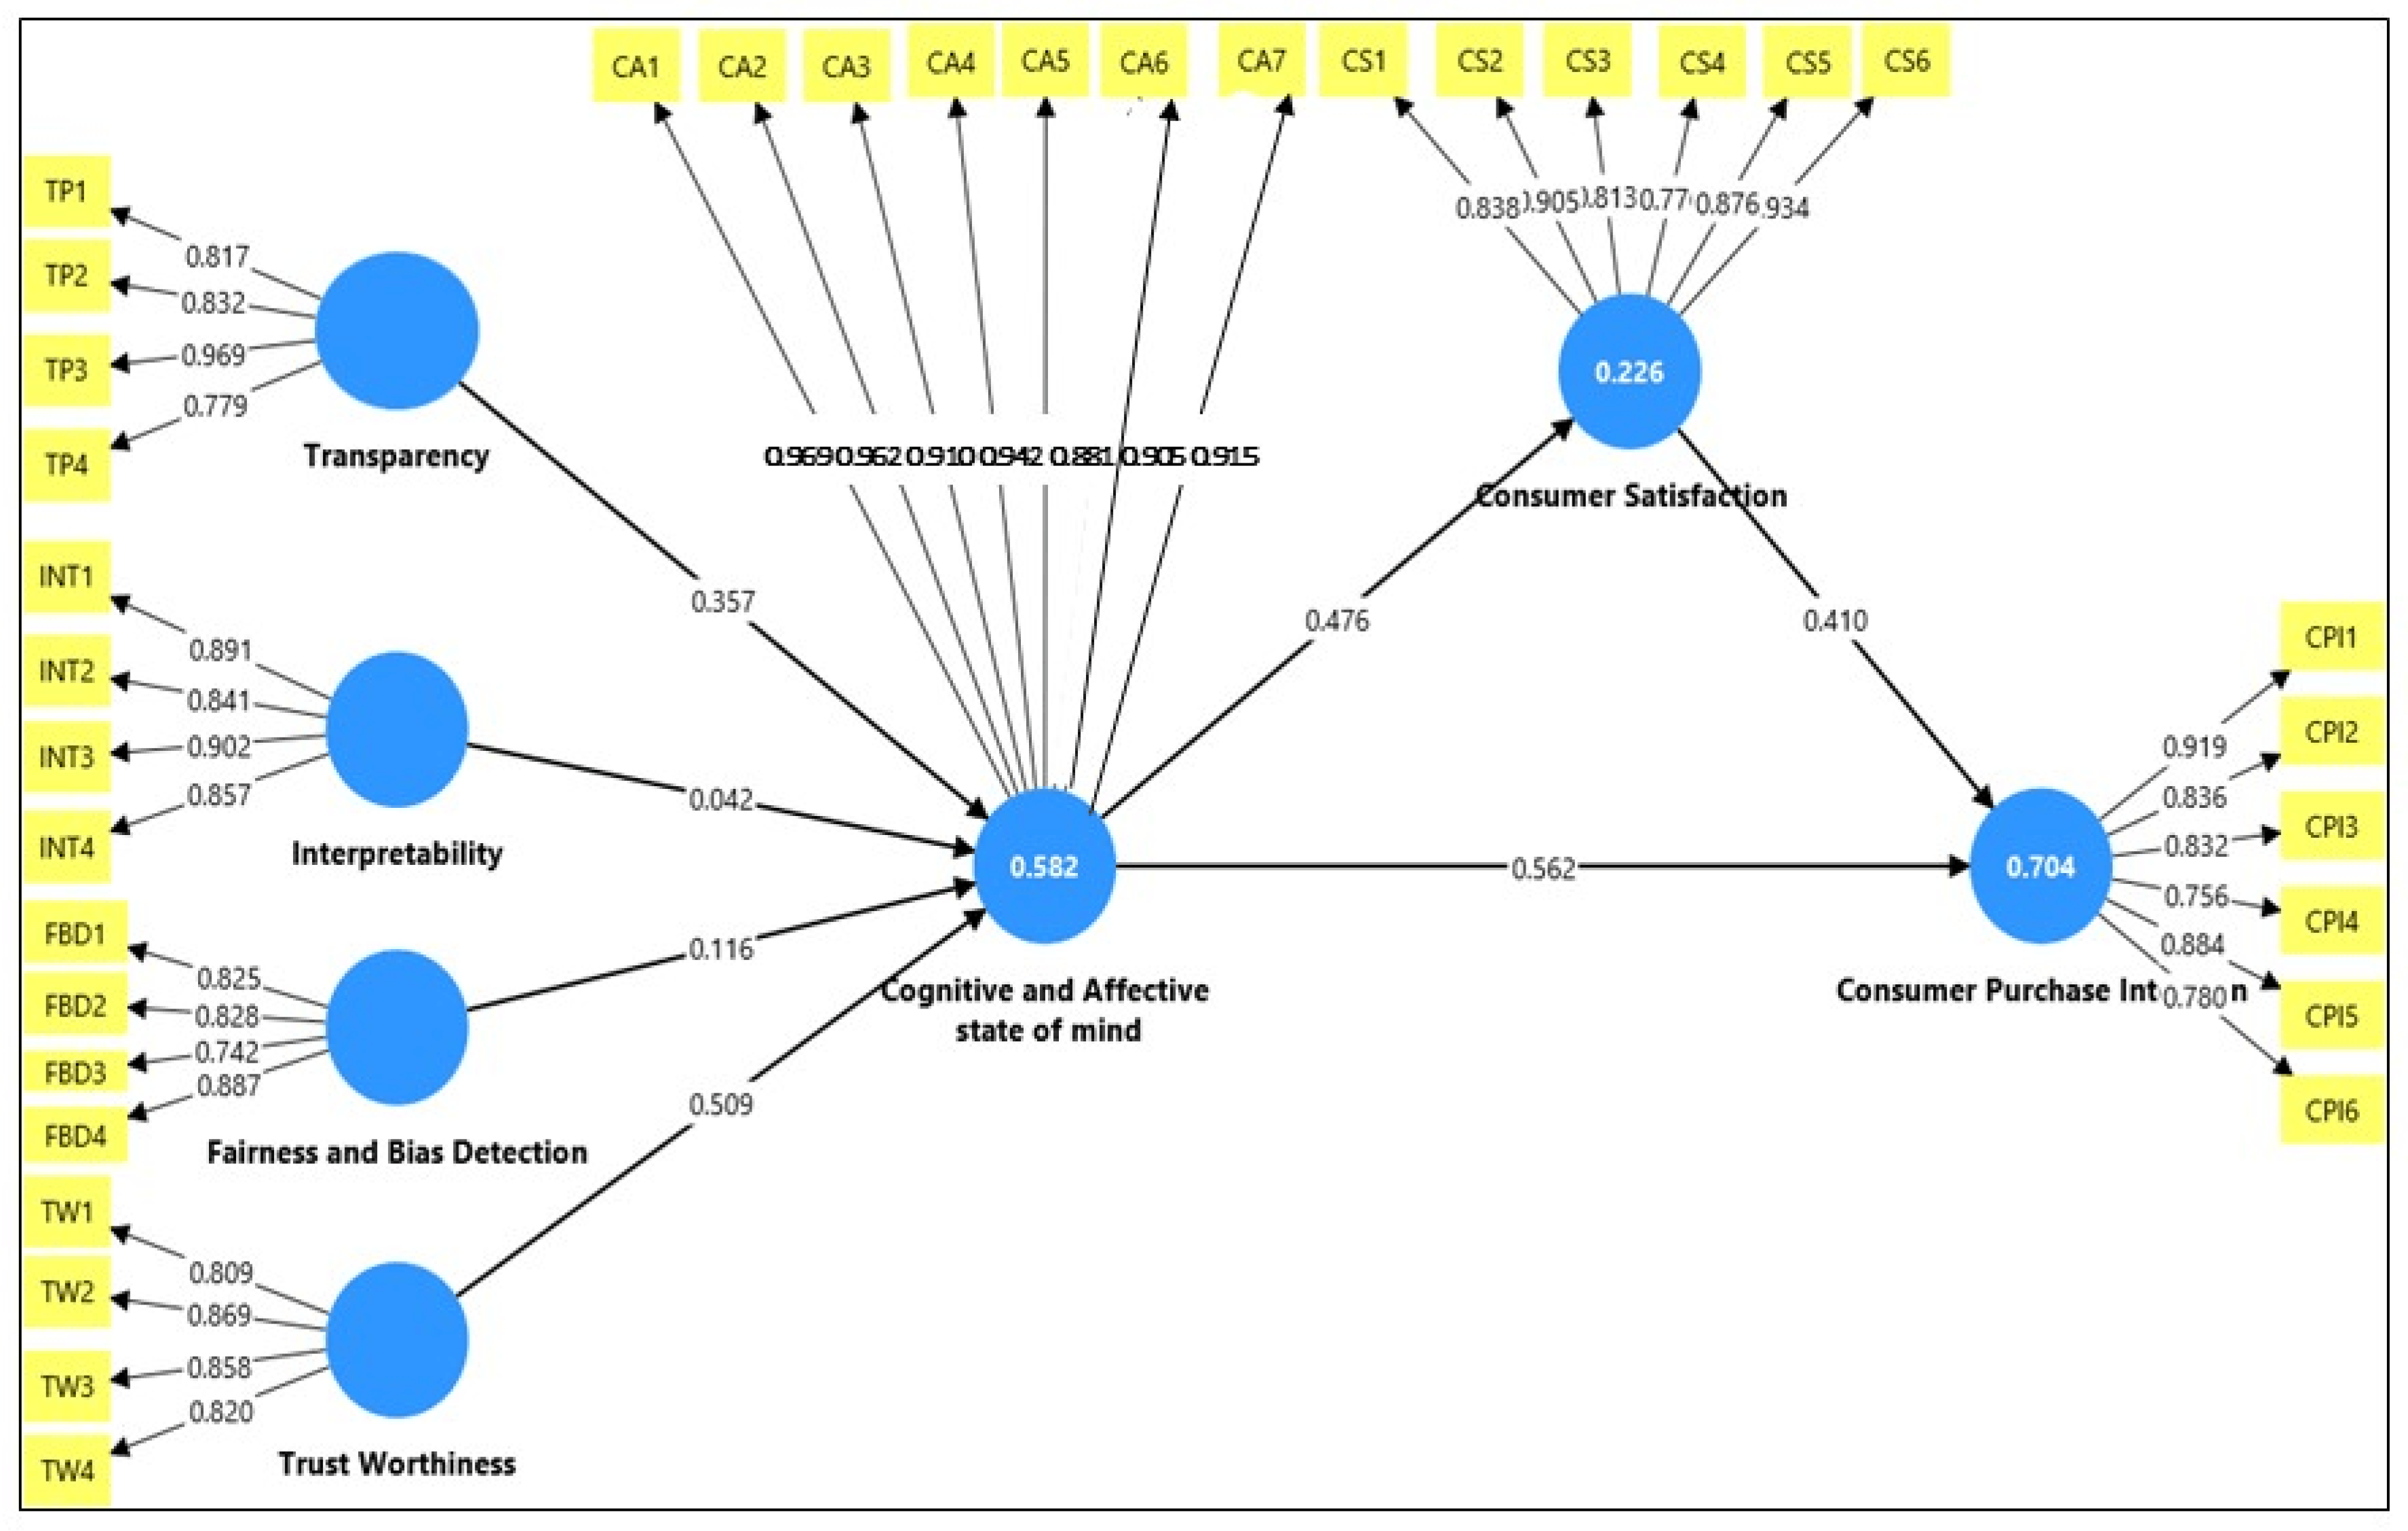
The structural model results presented in
Table 9 indicate varying levels of significance among the hypothesised relationships. Transparency exhibits a strong and positive effect on the cognitive and affective state of mind (β = 0.357, t = 10.311, and
p < 0.001), supporting the corresponding hypothesis. In contrast, interpretability shows a weak and non-significant effect (β = 0.042, t = 1.316, and
p = 0.188), leading to the rejection of its hypothesis. Fairness and bias detection significantly influence the cognitive and affective state of mind (β = 0.129, t = 4.615, and
p < 0.001), while trustworthiness emerges as the strongest predictor (β = 0.511, t = 15.702, and
p < 0.001), with both hypotheses being accepted. Furthermore, the cognitive and affective state of mind significantly predicts consumer purchase intention (β = 0.562, t = 19.667, and
p < 0.001) and consumer satisfaction (β = 0.476, t = 15.323, and
p < 0.001), confirming both hypothesised paths. Consumer satisfaction also has a substantial direct effect on consumer purchase intention (β = 0.410, t = 13.540, and
p < 0.001). Additionally, the mediating role of consumer satisfaction in the relationship between the cognitive and affective state of mind and purchase intention is statistically significant (β = 0.195, t = 9.055, and
p < 0.001). Overall, except for interpretability, all other hypothesised paths are supported, confirming the robustness of the model(see
Figure 2).