Article

From Policy Catalysis to Market Relay: A Tripartite Evolutionary Game Study on Digital–Green Synergy in E-Commerce

School of Management, Wuhan University of Technology, Wuhan 430070, China
*
Author to whom correspondence should be addressed.
J. Theor. Appl. Electron. Commer. Res. 2026, 21(4), 117; https://doi.org/10.3390/jtaer21040117
Submission received: 3 March 2026 / Revised: 8 April 2026 / Accepted: 9 April 2026 / Published: 11 April 2026
(This article belongs to the Section Digital Business, Governance, and Sustainability)

Abstract

Against the backdrop of a technological revolution centered on green and low-carbon development, the deep integration of digitalization and greening has become a core engine for high-quality progress. Moving beyond linear perspectives of environmental governance, this study constructs tripartite evolutionary game models to dissect the strategic interactions among government, enterprises, and consumers. Focusing on the institutional context of e-commerce, we examine how platform-enabled transparency mechanisms (e.g., blockchain traceability and carbon labeling) shape these interactions through key parameters: greenwashing detection (θ), premium loss coefficient (η), and information screening cost (CD). The analysis reveals that the long-term trajectory is fundamentally determined by the intrinsic economic viability of corporate transformation. Government intervention acts as an equilibrium selector, influencing the speed of convergence, while product value (consumer utility and premium) and platform transparency determine the sustainability of the equilibrium. Critically, the tripartite model shows that the optimal outcome—full enterprise transformation and consumer adoption—can be achieved without sustained government intervention when product fundamentals are sufficiently attractive. This demonstrates the potential for market self-regulation to sustain digital–green synergy. The study makes three contributions: it captures the full tripartite feedback loop, reveals the saturation effect of policy intensity, and embeds platform transparency mechanisms into an evolutionary framework. The findings reframe the government’s role as a temporary enabler and position e-commerce platforms as key governance intermediaries, offering a theoretical basis for adaptive governance strategies in digital commerce.

1. Introduction

The world is currently undergoing a technological revolution and an industrial transformation centered on green and low-carbon development. In this context, the deep integration of digitalization and greening has emerged as a core engine driving high-quality economic and social progress. Reflecting a global policy shift, governments are increasingly designing industrial policies to prioritize qualitative growth over quantitative expansion [1,2]. Aligning with this trend, the Chinese government has actively promoted the synergistic transformation of digitalization and greening, launching pilot programs and implementation guidelines to explore pathways for this dual transition at the regional and sectoral levels [3,4]. However, achieving such synergy requires more than isolated policy measures; it depends on the co-evolution of strategic behaviors among government, enterprises, and consumers, particularly in the increasingly digital marketplace.
In the digital era, e-commerce platforms have become central arenas where consumers encounter green products and make sustainability-influenced purchasing decisions. Major platforms such as Alibaba’s Tmall and JD.com in China increasingly incorporate digital tools—including carbon labels, green certifications, and blockchain-based traceability—to enhance product transparency and credibility [5]. These mechanisms reduce information asymmetry, shape consumer trust, and generate real-time market feedback that actively influences corporate strategies. Yet, existing studies have not formally modeled how such platform-mediated transparency interacts with government policy and corporate behavior. This study therefore analyzes digital–green synergy within a tripartite evolutionary game framework, with particular attention to how platform-enabled transparency shapes strategic interactions among government, enterprises, and consumers.
Digital–green synergy refers to the mutually reinforcing process in which digital technologies (e.g., blockchain traceability, carbon labeling, and platform governance) enhance the credibility and transparency of environmental claims, while green practices (e.g., low-carbon production and sustainable consumption) are amplified through digital platforms. Unlike the concept of “sustainable digitalization,” which focuses primarily on reducing the environmental footprint of digital infrastructure, digital–green synergy emphasizes the instrumental role of digital tools in enabling, verifying, and accelerating green transitions. It differs from “green innovation” in that it foregrounds the informational and trust-building function of digital platforms, rather than solely technological or product innovation. Furthermore, it extends “platform governance” by embedding it within a broader tripartite system of government, enterprises, and consumers, where digital platforms serve as the institutional infrastructure that shapes information flows and strategic behavior.
To better understand how this synergy can emerge, the present study constructs a tripartite evolutionary game model that captures the co-evolution of government, enterprise, and consumer strategies. Platform transparency is embedded through key parameters reflecting information asymmetry, trust, and greenwashing detection. Through analytical and numerical analysis, the model explores the conditions under which digital–green synergy can develop through market self-regulation.

2. Literature Review

2.1. Policy, Enterprise, and Consumer Interactions: A Tripartite Literature

Research on policy instruments has predominantly examined their effects in isolation. A representative study by Li & Gao [6], for instance, specifically investigates the impact of market-based environmental regulations on corporate green technology innovation. An emerging strand of literature, however, has begun to emphasize the heterogeneity of policy tools [7] and the mechanisms through which policy mixes shape corporate innovation [8,9]. Scholars widely acknowledge the government’s role as an “institutional supplier,” with extensive evidence demonstrating the efficacy of fiscal subsidies [10,11,12], tax incentives [13], green credit [14], and carbon trading mechanisms [15,16,17] in incentivizing corporate green innovation and emission reduction. Nevertheless, a large part of this literature rests on an implicit linear assumption of “government incentive–firm response,” paying insufficient attention to how corporate strategic behaviors (e.g., “greenwashing”) may undermine policy effectiveness.
At the enterprise level, studies have documented the complex strategic choices firms make in response to policies and market conditions. Scholars note that, in contexts of information asymmetry and regulatory gaps, companies frequently engage in opportunistic behaviors to capitalize on policy incentives—such as data fabrication in subsidy applications or symbolic compliance that meets formal requirements without substantive transformation [18,19]. Further research has identified “symbolic compliance” [20], wherein firms fulfill the letter, but not the spirit, of regulations. These analyses, however, often rely on static case studies and describe firm behavior under given policy regimes without modeling the evolutionary process through which firms learn and adapt over time.
At the consumer level, research has explored the formation of green consumption preferences, highlighting that such decisions are not purely economic but are also shaped by intrinsic environmental awareness [21] and the acceptance of green premiums [22]. Notably, recent work has started to focus on the enabling role of digitalization in shaping these preferences. Technologies like blockchain traceability [23,24,25] and carbon labeling [26] enhance information traceability, transparency, and credibility, thereby helping consumers identify “greenwashing” and incentivizing sustainable consumption. Yet, a persistent “intention–behavior gap” exists [27]; despite professing environmental support, consumers often revert to conventional purchases due to price sensitivity [28], lack of convenience [29], or persistent information asymmetry [30].

2.2. Evolutionary Game Approaches: From Dyadic Models to Tripartite Interactions

Evolutionary game theory offers a natural remedy to these limitations by modeling how boundedly rational agents learn, adapt, and co-evolve over time. Prior applications have developed dyadic models of government–enterprise interactions [31,32], showing how subsidies [33], fines, and regulatory intensity [34] affect corporate compliance. Other studies have modeled enterprise–consumer dynamics [35], demonstrating how consumer preferences can incentivize green innovation under conditions of information transparency. These models have advanced our understanding of strategic adaptation in sustainability contexts.
In recent years, tripartite evolutionary game models have been increasingly applied to sustainability and governance contexts. Studies have examined government–enterprise–consumer dynamics in environmental regulation [36,37], government-led digital transformation involving third-party demonstration enterprises and small and medium-sized enterprises [38], and government–environmental service company–polluting enterprise interactions in third-party pollution governance [39]. These applications demonstrate the value of capturing full feedback loops among multiple actors.
However, existing tripartite models—despite their diverse actor configurations—do not address the specific context of digital–green synergy in e-commerce markets. They typically treat “green” and “digital” attributes separately, if the latter is considered at all. More importantly, they do not incorporate platform-mediated transparency mechanisms—such as blockchain traceability, carbon labeling, and certification systems—as factors that shape strategic interactions. The questions of how platform governance intensity affects greenwashing detection, consumer information costs, and trust, and under what conditions digitally mediated markets can achieve self-sustaining synergy without government intervention, remain unexplored.

2.3. Positioning Within Platform Governance and Digital Markets Research

A growing body of literature examines how digital platforms govern market interactions. Studies have explored how algorithmic recommendation systems shape consumer choice [40,41], how blockchain traceability enhances supply chain transparency [42,43], and how certification systems reduce information asymmetry [44,45]. However, this literature has largely developed separately from evolutionary game models of sustainability transitions. As a result, the mechanisms through which platform governance interacts with public policy and corporate strategy remain undertheorized.
This study bridges these two literatures by embedding platform governance mechanisms into the tripartite evolutionary game framework through key parameters that reflect different dimensions of platform transparency.

3. Game-Theoretic Relationships and Strategic Choices

3.1. Government Advocacy and Regulation in Driving Corporate Digital–Green Synergy: A Collaborative-Constraint Analysis

In the synergistic development of digitalization and greening, the interests and objectives of governments and industrial firms exhibit both alignment and divergence. Grounded in institutional economics [46], the government, as an institutional actor serving public interests, employs policy tools to correct market failures, including environmental externalities and barriers to technology diffusion. Enterprises, as micro-level decision-makers, are primarily driven to minimize compliance costs while maximizing the benefits derived from synergistic development. This interplay of interests constitutes a dynamic game of “institutional incentives and corporate responses.”
On one hand, the government fosters collaborative relationships with enterprises through incentive-based policies, aiming to lower the barriers to green transformation and enhance corporate engagement. Instruments such as fiscal subsidies, tax incentives, and green credit can effectively mitigate the high costs and risks enterprises face in the early stages of dual transitions, thereby increasing their willingness to invest resources and adopt new technologies. For instance, Wang et al. found that fiscal subsidies and tax incentives positively promote enterprise digital transformation [47]. Similarly, in green finance and digital infrastructure, government-led investments not only provide foundational support but also, through a signaling effect, bolster market confidence, stimulating enterprises to pursue structural adjustments and innovation. Research by D Chen et al. confirms the positive influence of green finance on the green energy transition of industrial enterprises [48].
On the other hand, the government plays a critical constraining role within the digital–green synergy mechanism. Through stringent institutional arrangements—such as environmental regulations, energy efficiency standards, and emission caps—the government establishes clear ecological compliance boundaries. This compels firms to integrate environmental responsibility with their pursuit of economic efficiency [25]. For example, Chen found that low-carbon-driven environmental regulation can incentivize corporate digital transformation, particularly among highly productive firms [49]. This indicates that under tightening environmental rules, enterprises—especially those with greater efficiency or technological adaptability—are more inclined to pursue green transformation through digital means. Thus, seemingly “soft constraints” can generate powerful “hard incentives” for action.
In summary, the government embodies a dual role as both an “enabler” and a “regulator” in the corporate digital–green transition. It utilizes collaborative incentives to lower transformation barriers while employing institutional constraints to steer corporate behavior. Through ongoing interaction with enterprises, the government continuously strives to balance multiple objectives, including efficiency, equity, development, and ecological integrity.

3.2. Consumer Preferences and Corporate Digital–Green Synergistic Development: A Demand-Driven Analysis

Consumer preferences, serving as the core vehicle of market demand, are emerging as a pivotal driver for the synergistic development of corporate digitalization and greening. This preference-driven synergy mechanism is essentially a process in which market demand signals, verified through digital means, guide the reallocation of corporate resources via the price mechanism [50]. Against the dual backdrop of an increasingly transparent digital consumption environment and strengthening green preferences, enterprises face growing bottom-up pressure to adjust their production structures and technological pathways in response to market incentives, thereby fostering transformative development. However, environmental information asymmetry between consumers and enterprises presents a central obstacle to this synergistic pathway. According to the “lemons market” theory [51], when product quality cannot be effectively discerned, the market deteriorates into an inefficient equilibrium of adverse selection, where “bad products drive out good ones.” In the specific context of digital–green synergy, when corporate green claims lack substantiation through digital verification, some firms may engage in “greenwashing” or mislabeling to mislead consumers. This practice erodes the effectiveness of the digital–green premium, distorts resource allocation, and ultimately impedes overall synergistic efficiency.
Within this context, the efficacy of consumer preferences as a driver depends critically on leveraging digital technologies to enhance the recognizability and credibility of green attributes, thereby establishing a robust feedback mechanism between consumer signals and corporate responses. On one hand, green consumption preferences, when reinforced by digital verification, steer enterprises toward low-carbon and environmentally friendly transformation. Studies show that green production labels [52] and carbon information disclosure [53,54] significantly enhance consumers’ purchase intention. To gain competitive advantage, firms are incentivized to increase their share of green products and strengthen traceability and transparency through digital tools. On the other hand, empowered by the digital environment, consumers are equipped with enhanced monitoring capabilities over corporate green practices. By utilizing digital tools such as the Internet of Things, big data, and blockchain, consumers can more readily access product lifecycle information through digital traceability [55] and authentication signatures [56], enabling them to identify genuinely responsible environmental practices. This forms a closed-loop mechanism of “digital verification–purchasing choice–reputation feedback” in consumer decision-making, compelling enterprises to deepen the integration and innovation of digital technology with green manufacturing.

3.3. The Government–Consumer Interaction Mechanism: A Two-Way Dynamic of Public Governance and Social Feedback

In the process of corporate digital and green transformation, the government and consumers do not operate in isolation but engage in direct and continuous interaction. This relationship forms a bidirectionally driven system: the government guides and influences consumer awareness and choices through policymaking and platform development; simultaneously, consumers are not merely passive recipients but actively test policy effectiveness, convey social preferences, and ultimately influence subsequent government decisions through purchasing behavior, public discourse, and social participation. This interplay collectively shapes the market environment and social foundation for the industrial synergistic transition, serving as a key force propelling the evolution of the entire system.
As the public governance actor, the government proactively guides and shapes consumer green preferences and digital consumption habits, thereby creating a market demand foundation for industrial synergistic transformation. Its primary approach involves policy guidance and green awareness cultivation [57]. Through top-level design, the government promotes green consumption concepts and carbon neutrality knowledge, aiming to enhance societal environmental responsibility. For instance, the EU’s “Green Deal” [58,59] and China’s “Dual Carbon” communications [60,61] have elevated green consumption from individual preference to collective action and social trend through national-level advocacy. Secondly, the government addresses information asymmetry by advancing digital platform development. The core obstacle for consumers lies in the inability to effectively identify genuine green attributes of products. By establishing data standards, opening public data, and encouraging certifications, the government guides and supports enterprises or industry associations in investing in digital traceability platforms [62] and green product certification systems [63]. For example, companies voluntarily disclose information to meet market access requirements or obtain policy incentives [64]. This approach leverages the technical expertise and operational efficiency of market entities while ensuring information credibility through government endorsement and supervision, thereby significantly reducing consumer identification costs and strengthening trust in green products.
Consumers are not passive policy recipients but active societal feedback providers who influence the government through multiple channels, becoming a crucial driver for policy optimization and iteration. In the digital era, consumer oversight is particularly potent. Once corporate greenwashing or ineffective policy implementation is detected, they can rapidly generate significant public pressure on social media [65,66]. This pressure compels regulatory bodies to respond promptly and strengthen enforcement, thereby ensuring the achievement of policy objectives.
More importantly, consumer purchasing behavior directly reflects market preferences. Their choices generate crucial data for evaluating policy effectiveness, with vast consumption records revealing which products hold greater market appeal and which subsidy policies genuinely stimulate sales. Through systematic analysis of this real-world market data, the government can objectively monitor and assess policy outcomes, enabling precise adjustments such as optimizing subsidy catalogs or refining communication priorities. This feedback-informed decision-making mechanism shifts the policy formulation process from theoretical speculation toward evidence-based scientific governance.

4. Model Specification

This section develops three evolutionary game models to analyze the multi-agent equilibrium pathways in the digitalization and greening transition. These include two two-party models (government–enterprise and enterprise–consumer) and one tripartite model (government–enterprise–consumer).

4.1. Evolutionary Game Model of Government Incentives, Regulation, and Enterprise Digital–Green Synergy

To thoroughly investigate the behavioral strategies and systemic evolution of governments and enterprises in the digital–green synergy process, this section constructs a two-party evolutionary game model between the two actors. The model is built on the following set of assumptions:
Assumption 1: The government and manufacturing enterprises are viewed as an integrated system within a simplified “natural” environment, free from other external constraints. Both parties are boundedly rational actors with learning capabilities, each possessing distinct behavioral choices and decision-making authority.
Assumption 2: The strategy sets for the two agents are defined as follows: Government (G): {Perform duty (G1), Not perform duty (G2)}, Enterprise (E): {Promote digital–green synergy (E1), Maintain conventional (business-as-usual) operations (E2)}.
Assumption 3: Let x denote the probability of the government choosing strategy G1, and y the probability of an enterprise choosing strategy E1, where x, y ϵ [0, 1] and both are functions of time t. Through learning, imitation, and strategic adjustment, the players converge toward Evolutionary Stable Strategies (ESSs). The terms x* and y* represent the government’s and enterprises’ strategy proportions within an ESS.
Assumption 4: Government actions are classified into incentives and regulation. Incentives consist of subsidies for digital–green synergy, while regulation involves imposing fines for violations such as excessive pollution. Let β and γ denote the intensity factors for incentives and regulation, respectively, with associated costs βB and γC. The government also bears an environmental governance cost CE.
Assumption 5: The government derives benefits from several sources. Firstly, when enterprises adopt the digital–green synergistic path, they generate total social welfare benefit E, of which a portion λE (where λ ϵ [0, 1]) is attributed to government performance. Secondly, if an enterprise maintains its original operations and exceeds pollution emission standards, the fine F it pays becomes government revenue. Finally, tax revenues from enterprise operations also contribute to government income, amounting to T1 under digital–green synergy and T2 under the status quo.
Assumption 6: An enterprise choosing E2 incurs a production cost C0, yields profit P0, but faces a potential fine F. An enterprise choosing E1 incurs cost C1, earns additional profit ΔP, receives a government subsidy βB, and gains a share μE of the long-term environmental benefits.
Based on the above assumptions, the payoff matrix for the two-party evolutionary game between the government and enterprises is constructed and presented in Table 1.
The replicator dynamic equation for the government is:
F ( x ) = d x d t = x ( 1 x ) [ F γ C y ( F + β B ) ]
The replicator dynamic equation for the enterprise is:
F ( y ) = d y d t = y ( 1 y ) [ Δ P + μ E + C 0 C 1 + x ( β B + F ) ]
According to Equation (1), if y = ( F γ C ) / ( F + β B ) , then F ( x ) 0 , implying that any value of x constitutes an ESS. If y ( F γ C ) / ( F + β B ) , then x* = 1 and x* = 0 are the two ESS points. Specifically, when y > ( F γ C ) / ( F + β B ) , x* = 0 is the ESS; when y < ( F γ C ) / ( F + β B ) , x* = 1 is the ESS.
According to Equation (2), if x = ( C 1 C 0 Δ P μ E ) / ( F + β B ) , then F ( y ) 0 , meaning that any value of y is an ESS. If x ( C 1 C 0 Δ P μ E ) / ( F + β B ) , then y* = 1 and y* = 0 are the two ESS points. Specifically, when x > ( C 1 C 0 Δ P μ E ) / ( F + β B ) , y* = 1 is the ESS; when x < ( C 1 C 0 Δ P μ E ) / ( F + β B ) , y* = 0 is the ESS.
Notably, the ESS of this game model depends on the relative magnitudes of F, γC, C1, C0, ΔP, and μE. This paper examines scenarios arising from different relative sizes of C1, C0, ΔP, and μE under the conditions ( F γ C ) / ( F + β B ) < 0 and 0 < ( F γ C ) / ( F + β B ) < 1 .
1. When ( F γ C ) / ( F + β B ) < 0
Since y ϵ [0, 1], the inequality F γ C y ( F + β B ) < 0 holds for any y. Consequently, F ( x ) < 0 for all x ϵ [0, 1], making x* = 0 the ESS for the government.
Case 1: If C 1 C 0 Δ P μ E < 0 , then ( C 1 C 0 Δ P μ E ) / ( F + β B ) < 0 . For all x ϵ [0, 1], the expression Δ P + μ E + C 0 C 1 + x ( F + β B ) > 0 holds. In this case, y* = 1 is the ESS for enterprises.
Case 2: If C 1 C 0 Δ P μ E > 0 and 0 < ( C 1 C 0 Δ P μ E ) / ( F + β B ) < 1 , then y* = 0 is the ESS for enterprises when x < ( C 1 C 0 Δ P μ E ) / ( F + β B ) , and y* = 1 is the ESS when x > ( C 1 C 0 Δ P μ E ) / ( F + β B ) .
Case 3: If C 1 C 0 Δ P μ E > 0 and 1 < ( C 1 C 0 Δ P μ E ) / ( F + β B ) , then for any x ϵ [0, 1], the inequality Δ P + μ E + C 0 C 1 + x ( F + β B ) < 0 holds. Consequently, y* = 0 is the ESS for enterprises.
2. When 0 < ( F γ C ) / ( F + β B ) < 1
For the government, x* = 0 is the ESS when ( F γ C ) / ( F + β B ) < y , and x* = 1 is the ESS when y < ( F γ C ) / ( F + β B ) . For enterprises, the following three cases exist:
Case 1: If C 1 C 0 Δ P μ E < 0 , then ( C 1 C 0 Δ P μ E ) / ( F + β B ) < 0 . Since x ϵ [0, 1], the inequality Δ P + μ E + C 0 C 1 + x ( F + β B ) > 0 holds for any x. Therefore, the replicator dynamic equation satisfies F ( y ) > 0 for y ϵ [0, 1], and the system converges to y* = 1.
Case 2: If 0 < C 1 C 0 Δ P μ E , and 0 < ( C 1 C 0 Δ P μ E ) / ( F + β B ) < 1 , then when ( C 1 C 0 Δ P μ E ) / ( F + β B ) < x , 0 < Δ P + μ E + C 0 C 1 + x ( F + β B ) holds, resulting in F ( y ) > 0 and the enterprise strategy converging to y* = 1. Conversely, when x < ( C 1 C 0 Δ P μ E ) / ( F + β B ) , y* = 0 is the ESS.
Case 3: If 0 < C 1 C 0 Δ P μ E , and 1 < ( C 1 C 0 Δ P μ E ) / ( F + β B ) , then for any x ϵ [0, 1], the inequality Δ P + μ E + C 0 C 1 + x ( F + β B ) < 0 holds. Therefore, F ( y ) < 0 for y ϵ [0, 1], and the enterprise strategy converges to y* = 0.
In summary, the construction and analysis of the government–enterprise evolutionary game model reveal a fundamental dynamic that transcends short-term governmental cost–benefit calculations: the long-term evolutionary trajectory of the digital–green synergistic transition is ultimately determined by the intrinsic economic viability of corporate transformation—represented by the baseline economic expression Δ P + μ E + C 0 C 1 . The government’s role, in turn, shapes the specific mode through which equilibrium is realized. Depending on this intrinsic viability, the system exhibits three archetypal scenarios:
(1) Market-Driven Scenario: When the baseline economic calculus is significantly positive ( 0 < Δ P + μ E + C 0 C 1 ), indicating inherent profitability for firms, the system converges to the ESS (0,1). This constitutes a market-driven equilibrium characterized by “government non-intervention and full enterprise transition.” In this case, corporate initiative alone is sufficient to drive the transition, rendering government intervention potentially redundant.
(2) Policy-Driven Scenario: When the baseline economic calculus is negative but can be effectively counterbalanced by government intervention 0 < ( C 1 C 0 Δ P μ E ) / ( F + β B ) < 1 , the system exhibits coordination game dynamics. The resulting ESS hinges critically on the initial strategic beliefs of both parties: it may converge to (1,1), representing a virtuous cycle of “strong intervention–strong transition,” or to (0,0), a developmental trap of “weak intervention–weak transition.” In this context, the government’s strategic conviction and policy consistency become pivotal for breaking the deadlock and guiding the system toward the high-level equilibrium.
(3) Dual-Failure Scenario: When the baseline economic calculus is negative and lies beyond the compensatory capacity of government intervention 1 < ( C 1 C 0 Δ P μ E ) / ( F + β B ) , the transition is rendered economically infeasible under prevailing techno-economic conditions. The system converges to an ESS where enterprises resist transition (y* = 0), and the government’s strategy devolves into an isolated decision based solely on its own costs and benefits (i.e., F versus γC) This leads to a dual failure of both market and policy mechanisms.
The government’s cost–benefit structure—specifically, the relationship between F and γC—does not alter the fundamental dynamic described above but influences the behavioral pattern it adopts. When F < γ C , the government tends to be passive, primarily adopting a free-riding strategy. When F > γ C , the government becomes responsive, strategically adjusting its level of intervention in reaction to the behavioral distribution observed in the enterprise population.
Therefore, to effectively promote the digital–green synergistic transition, policymakers should prioritize enhancing the intrinsic economic viability of corporate transformation. This entails fundamentally improving the corporate cost–benefit structure through pathways such as technological innovation, new business model development, and ecosystem building. Building on this foundation, and in accordance with its identified role (passive or responsive), the government should implement precisely targeted governance measures: it should refrain from intervention in the Market-Driven Scenario; provide resolute and consistent guidance in the Policy-Driven Scenario; and shift focus toward long-term, fundamental capacity building—such as foundational research and infrastructure—in the Dual-Failure Scenario. Such a differentiated approach enables effective and adaptive governance throughout the transition process.

4.2. Evolutionary Game Model of Consumer Preferences and Enterprise Digital–Green Synergy

To analyze the behavioral strategies and systemic evolution of consumers and enterprises in the digital–green synergy process, this section develops a two-party evolutionary game model between these two actors. The model is based on the following assumptions:
Assumption 1: Enterprises and consumers are conceptualized as an integrated system operating in a simplified “natural” environment, abstracted from external constraints. Both parties are boundedly rational agents with learning capabilities, whose behavioral choices are driven by expected payoffs and continuously adjusted through learning and imitation.
Assumption 2: The two game participants are the consumer (making purchasing decisions on an e-commerce platform) and the enterprise (selling products through the platform). The consumer’s strategy set includes {“Actively choose digital–green products” (R1)} and {“Maintain conventional consumption” (R2)}. The enterprise’s strategy set includes {“Promote digital–green synergy” (E1)} and {“Maintain traditional development model” (E2)}. On the platform, consumers can observe product information such as green certifications, carbon footprint labels, and blockchain-based traceability data, which influence their utility and trust.
Assumption 3: Let y denote the probability of an enterprise choosing strategy E1, and z the probability of a consumer choosing strategy R1, where y, z ϵ [0, 1]. Through continuous learning and imitation in the evolutionary game, each agent optimizes its strategy, and the system tends toward a stable state. The corresponding Evolutionary Stable Strategies (ESSs) are denoted as y* and z*.
Assumption 4: Consumers derive a baseline utility U0 from all products that satisfies their basic needs, paying a benchmark price P0. When a consumer adopts R1 and an enterprise adopts E1, the consumer gains a comprehensive digital–green utility increase ΔU while paying the corresponding digital–green premium ΔP. This ΔU reflects the value of verifiable green and digital attributes—such as those communicated through carbon labels, blockchain traceability, and certification systems on e-commerce platforms—where higher platform transparency increases ΔU by reducing information uncertainty. Conversely, if the enterprise chooses E2 while the consumer maintains R1, the consumer experiences a utility reduction ΔU due to unmet expectations. When the consumer adopts R2 while the enterprise implements E1, the consumer free-rides, obtaining a reduced utility increase λΔU (where λ ϵ [0, 1]) while paying a reduced premium λΔP. The parameter λ captures the degree of information asymmetry: when platform transparency is low, consumers cannot fully verify green claims, resulting in a lower λ. Finally, when both consumer and enterprise choose their baseline strategies (R2 and E2), the consumer receives only the baseline utility U0 while paying the benchmark price P0.
Assumption 5: An enterprise choosing E1 incurs a transformation cost C1. In this case, if the consumer chooses R1, the enterprise obtains a comprehensive benefit G (including the green premium and reputational gains), resulting in a profit of P 0 + Δ P + G C 1 . If the consumer chooses R2, the enterprise receives only the benchmark price P0 and bears a loss L1 from underutilized capacity due to unrealized economies of scale, yielding a profit of P 0 + λ Δ P C 1 L 1 . An enterprise choosing E2 incurs a base cost C0 (where C1 > C0) and earns P0. However, if the consumer chooses R1, the enterprise forfeits potential revenue, incurring a loss L2, leading to a net profit of P 0 C 0 L 2 .
Based on the above assumptions, the payoff matrix for the two-party evolutionary game between enterprises and consumers is constructed and presented in Table 2.
The replicator dynamic equation for the enterprise is:
G ( y ) = d y d t = y ( 1 y ) [ λ Δ P + C 0 C 1 L 1 + z ( G + ( 1 λ ) Δ P + L 1 + L 2 ) ]
The replicator dynamic equation for the consumer is:
G ( z ) = d z d t = z ( 1 z ) [ y ( Δ U ( 2 λ ) Δ P ( 1 λ ) ) Δ U ]
According to Equation (3), if z = ( L 1 + C 1 C 0 λ Δ P ) / [ G + ( 1 λ ) Δ P + L 1 + L 2 ] , then F ( y ) 0 , implying that all values of y represent an ESS. If z ( L 1 + C 1 C 0 λ Δ P ) / [ G + ( 1 λ ) Δ P + L 1 + L 2 ] , then y∗ = 0 and y∗ = 1 are the two ESS points. Specifically, when z > ( L 1 + C 1 C 0 λ Δ P ) / [ G + ( 1 λ ) Δ P + L 1 + L 2 ] , y∗ = 1 is the ESS; when z < ( L 1 + C 1 C 0 λ Δ P ) / [ G + ( 1 λ ) Δ P + L 1 + L 2 ] , y∗ = 0 is the ESS.
According to Equation (4), if y = Δ U / [ ( 2 λ ) Δ U ( 1 λ ) Δ P ] , then F ( z ) 0 , meaning that all values of z are an ESS. If y Δ U / [ ( 2 λ ) Δ U ( 1 λ ) Δ P ] , then F ( z ) = 0 , only when z∗ = 0 or z∗ = 1, which constitute the two ESS points.
Based on the constructed enterprise–consumer evolutionary game model, the system’s evolutionarily stable strategy depends on the relative positions of the consumer’s critical threshold y c = Δ U / [ ( 2 λ ) Δ U ( 1 λ ) Δ P ] and the enterprise’s critical threshold z c = ( L 1 + C 1 C 0 λ Δ P ) / [ G + ( 1 λ ) Δ P + L 1 + L 2 ] . Various scenarios may emerge depending on parameter conditions. For conciseness, and because the condition 0 < Δ U / [ ( 2 λ ) Δ U ( 1 λ ) Δ P ] < 1 represents the most interactive and analytically substantial scenario, this section focuses specifically on evolutionary equilibrium analysis under this condition, examining how the system evolves for different values of the enterprise’s critical threshold. The analysis of other scenarios follows a similar logic and is therefore omitted.
When Δ U / [ ( 2 λ ) Δ U ( 1 λ ) Δ P ] < 1 , it follows that ( 2 λ ) Δ U ( 1 λ ) Δ P > 0 . Under this premise: if y > Δ U / [ ( 2 λ ) Δ U ( 1 λ ) Δ P ] , then F ( z ) > 0 for z ϵ [0, 1], and the system converges to z∗ = 1; if y < Δ U / [ ( 2 λ ) Δ U ( 1 λ ) Δ P ] , then F ( z ) < 0 for z ϵ [0, 1], and the system converges to z∗ = 0.
Case 1: When ( L 1 + C 1 C 0 λ Δ P ) / [ G + ( 1 λ ) Δ P + L 1 + L 2 ] < 0 , and given that z ϵ [0, 1], the inequality λ Δ P + C 0 C 1 L 1 + z [ G + ( 1 λ ) Δ P + L 1 + L 2 ] > 0 holds. If G + ( 1 λ ) Δ P + L 1 + L 2 > 0 , enterprises always converge to y∗ = 1. Consequently, the system converges to (1,1) when ( L 1 + C 1 C 0 λ Δ P ) / [ G + ( 1 λ ) Δ P + L 1 + L 2 ] < y , and to (1,0) when y < ( L 1 + C 1 C 0 λ Δ P ) / [ G + ( 1 λ ) Δ P + L 1 + L 2 ] . Conversely, if G + ( 1 λ ) Δ P + L 1 + L 2 < 0 , enterprises always converge to y∗ = 0, leading the system to converge to (0,0).
Case 2: When 0 ( L 1 + C 1 C 0 λ Δ P ) / [ G + ( 1 λ ) Δ P + L 1 + L 2 ] 1 , the system’s evolution depends on the mutual feedback between the enterprise strategy proportion y and the consumer strategy proportion z. Enterprise behavior converges to y∗ = 0 or y∗ = 1 based on the comparison between z and the critical threshold ( L 1 + C 1 C 0 λ Δ P ) / [ G + ( 1 λ ) Δ P + L 1 + L 2 ] , similarly to consumer behavior. The system may exhibit multiple equilibria, with the boundary points (0,0), (0,1), (1,0), and (1,1) all being potential stable states.
Case 3: When 1 < ( L 1 + C 1 C 0 λ Δ P ) / [ G + ( 1 λ ) Δ P + L 1 + L 2 ] , the sign of G + ( 1 λ ) Δ P + L 1 + L 2 may be positive or negative. If G + ( 1 λ ) Δ P + L 1 + L 2 > 0 , the system converges to (0,0). If G + ( 1 λ ) Δ P + L 1 + L 2 < 0 , then the system converges to (1,1) when ( L 1 + C 1 C 0 λ Δ P ) / [ G + ( 1 λ ) Δ P + L 1 + L 2 ] < y , and to (1,0) when y < ( L 1 + C 1 C 0 λ Δ P ) / [ G + ( 1 λ ) Δ P + L 1 + L 2 ] .
In summary, through the construction and analysis of the enterprise–consumer evolutionary game model, this study reveals the underlying logic of digital–green synergistic transformation in the market: the long-term evolutionary path of the system fundamentally depends on the dynamic alignment between consumer preference intensity (reflected in the relationship between ΔU and ΔP) and the net benefits of corporate transformation (reflected in parameters such as G, C1, C0, L1, and L2). Based on the relative positions of the consumer’s and enterprise’s critical thresholds, the system evolution manifests three typical scenarios:
(1) Consumer-Driven Scenario: When consumer preference for digital–green products is strong (ΔU is significantly higher than ΔP) and the net benefit of corporate transformation is significantly positive, the system converges to a (1,1) equilibrium, forming a virtuous market cycle of “full corporate transformation and active consumer choice.” In this scenario, the market mechanism spontaneously drives synergistic transformation without requiring external intervention.
(2) Coordination Game Scenario: When both consumer preference and the net benefit of corporate transformation fall within an intermediate range, the system evolution exhibits the characteristics of a coordination game, potentially converging to multiple equilibria such as (1,1) or (0,0). In this scenario, initial consumer beliefs, pioneering demonstrations by enterprises, or government guidance and awareness campaigns become crucial for breaking the deadlock and steering the system toward a high-level equilibrium.
(3) Dual-Failure Scenario: When consumer preference is insufficient or corporate transformation costs are prohibitively high, and the market mechanism cannot compensate for this gap, the system becomes trapped in a (0,0) equilibrium—a state of dual failure where “enterprises do not transform, and consumers do not choose.” Here, relying solely on market self-regulation is insufficient to initiate transformation, necessitating external policies or technological breakthroughs to reconfigure the incentive mechanisms.

4.3. Evolutionary Game Model Among Government, Enterprise, and Consumer for Digital–Green Synergy

Assumption 1: The government, manufacturing enterprises, and consumers form a cohesive evolutionary game system operating under conditions of bounded rationality and information asymmetry. As boundedly rational decision-makers with learning capabilities, all three parties base their behavioral choices on expected payoffs. They continuously adjust their strategies through a process of “imitation ⟶ selection ⟶ adaptation,” which ultimately drives the system toward an Evolutionary Stable Strategy (ESS).
Assumption 2: The strategy sets for the three agents are defined as follows: Government (G): {Active intervention (G1), Basic administration (G2)}. Strategy G1 entails implementing specific digital–green policies (e.g., subsidies, publicity, and regulation), whereas G2 involves maintaining only basic administrative functions without such targeted interventions. Manufacturing Enterprise (E): {Synergistic transformation (E1), Business-as-usual (E2)}. Strategy E1 represents substantive investment in synergistic transformation, whereas E2 denotes continuing high-energy consumption and high-pollution operations, potentially involving “greenwashing” to secure policy benefits. Consumer (R): {Choose digital–green products (R1), Choose conventionally (R2)}. Strategy R1 reflects a preference for integrated green and digital attributes (e.g., traceability) and a willingness to pay a premium, whereas R2 indicates decisions based solely on traditional factors like price and basic functionality.
Assumption 3: The probability of the government choosing strategy G1 is denoted as x(t), that of an enterprise choosing E1 as y(t), and that of a consumer choosing R1 as z(t), where x, y, and z ϵ [0, 1] are functions of time t. The corresponding equilibrium proportions, when the system stabilizes, are denoted as x*, y*, and z*.
Assumption 4: The government’s revenue and cost structure are defined as follows. When performing its duty (G1), the government incurs costs for publicity campaigns, denoted as αA, and disbursed subsidies, denoted as βB, where α and β represent policy intensity coefficients. Government revenues originate from three primary sources: tax income from enterprises, which amounts to T1 if an enterprise adopts E1 and T2 if it adopts E2, with T1 > T2; collected from penalizing non-compliant enterprises; and environmental performance benefits. The latter include S1, derived from environmental and efficiency improvements achieved through authentic enterprise transformation, and S2, resulting from the enhanced social environmental awareness reflected by consumers’ digital–green consumption behavior.
Assumption 5: The payoff of a manufacturing enterprise is fundamentally determined by its strategic choice. An enterprise opting for E1 incurs a high transformation cost C1, which is partially offset by a government subsidy βB and compensated by long-term reputational and competitive gains W. The enterprise’s market revenue is influenced by consumer behavior: it earns a base return P1, augmented by an additional premium GP if consumers choose R1. Conversely, an enterprise choosing E2 bears a lower conventional operational cost C2 (where C2 < C1) but faces a fine F under government supervision. Its market revenue is P3 when consumers are indifferent (R2). However, when consumers choose R1, there exists a probability θ (where θ ϵ [0, 1]) that the enterprise’s greenwashing will be detected through digital means, resulting in a reduced revenue of (1−θ)P2, where P2 < P1. This detection probability θ reflects the effectiveness of platform governance mechanisms, such as blockchain traceability, third party certification, and algorithmic monitoring—higher platform transparency increases θ.
Assumption 6: A consumer’s utility is jointly determined by the interaction between their consumption choice and the enterprise’s production strategy, and is further modulated by government action and e-commerce platform-mediated information transparency. When a consumer chooses R1 on an e-commerce platform, they observe product labels, traceability information, and certification badges displayed on the product page. The credibility of this information is influenced by government-backed certification and platform reputation, which affects the utility U1 and the premium GP. If the enterprise chooses E1, the consumer attains a high utility level U1 while paying the full price premium GP. If the enterprise chooses E2, the consumer receives a diminished utility U2 (where U1 > U2), incurs an information screening cost CD, pays only a partial premium ηGP (with η ϵ [0, 1] representing the premium loss coefficient) due to information asymmetry, and experiences further utility reduction if greenwashing is detected via platform transparency mechanisms (e.g., blockchain traceability). The coefficient η captures the degree to which consumers are misled by greenwashing; it is directly influenced by the credibility of platform-endorsed certifications, such as the “green label” or “certified sustainable” badges prominently shown on e-commerce product pages. A higher η means consumers are less sensitive to deceptive claims, reflecting lower platform transparency. Conversely, reducing η—achieved through trustworthy certification systems and reliable traceability records—helps consumers distinguish genuine green products. The screening cost CD reflects the time and effort consumers spend verifying product claims; e-commerce platforms can lower CD by standardizing green labels, providing one click access to product traceability histories, and designing user friendly interfaces that consolidate certification information. Such platform design choices reduce information asymmetry and facilitate informed purchasing decisions. Government publicity under G1 (αA) can partially mitigate negative experiences by enhancing value perception. When the consumer chooses R2, they obtain a base utility U0 (where U1 > U2 > U0) regardless of the enterprise’s strategy. A limited “free rider” utility gain D is obtained if the enterprise adopts E1, arising from positive spillover effects. Government publicity under G1 provides a weaker utility enhancement γαA (with γ ϵ [0, 1] being the publicity attenuation coefficient) by raising general environmental awareness.
Based on these assumptions, this study constructs a payoff matrix for the tripartite evolutionary game involving the government, enterprises, and consumers, as presented in Table 3. The matrix systematically captures the payoff functions of all three parties under different strategy combinations. Each cell contains the respective payoff values for the government, manufacturing enterprise, and consumer under the corresponding strategy profile, listed in sequence.
Based on the payoff matrix shown in Table 3, the expected payoffs for the government, enterprises, and consumers, as well as the average payoffs of their respective populations, can be derived. This leads to the replication dynamic equations for the three parties as follows:
U 1 ( x ) = d x d t = x ( 1 x ) [ S 1 y + S 2 z + F ( 1 y ) α A β B y ]
U 2 ( y ) = d y d t = y ( 1 y ) [ P 1 ( 1 θ ) z P 2 ( 1 z ) P 3 C 1 + C 2 + ( β B + F ) x + z G P + W ]
U 3 ( z ) = d z d t = z ( 1 z ) [ ( U 1 U 2 G p + η G P + C D D ) y + U 2 η G P C D U 0 + α A x ( 1 γ ) ]
The analysis of ESS involves calculating the Jacobian matrix and evaluating its eigenvalues at the system’s equilibrium points. According to Friedman’s method [67], the stability of an evolutionary game system can be determined by examining the local stability of the corresponding Jacobian matrix. For this system, the Jacobian matrix J is defined as the matrix formed by the first-order partial derivatives of the replicator dynamic equations with respect to the variables x, y, and z, and is expressed as follows:
J = [ U 1 ( x ) x U 1 ( x ) y U 1 ( x ) z U 2 ( y ) x U 2 ( y ) y U 2 ( y ) z U 3 ( z ) x U 3 ( z ) y U 3 ( z ) z ]
where the elements of the first row are:
U 1 ( x ) x = ( 1 2 x ) [ S 1 y + S 2 z + F ( 1 y ) α A β B y ] U 1 ( x ) y = x ( 1 x ) ( S 1 F β B ) U 1 ( x ) z = x ( 1 x ) S 2
The elements of the second row are:
U 2 ( y ) x = y ( 1 y ) ( F + β B ) U 2 ( y ) y = ( 1 2 y ) [ P 1 ( 1 θ ) z P 2 ( 1 z ) P 3 C 1 + C 2 + ( F + β B ) x + z G P + W ] U 2 ( y ) z = y ( 1 y ) [ G P ( 1 θ ) P 2 + P 3 ]
The elements of the third row are:
U 3 ( z ) x = z ( 1 z ) α A ( 1 γ ) U 3 ( z ) y = z ( 1 z ) [ U 1 U 2 + C D D G P ( 1 η ) ] U 3 ( z ) z = ( 1 2 z ) [ ( U 1 U 2 G P + η G P + C D D ) y + U 2 U 0 η G P C D + α A x ( 1 γ ) ]
The stability analysis for the eight boundary equilibrium points, obtained from the eigenvalues of the Jacobian matrix, is presented in Table 4.
The eigenvalue expressions and detailed stability analysis are provided in Appendix A. The signs reported in Table 4 reflect the typical parameter regime used in the simulation, under which the conditions for Theorem 1 are satisfied.
Based on the results presented in Table 4, the following theorem is established:
Theorem 1.
The government–enterprise–consumer tripartite evolutionary game system possesses a unique ESS. The specific form of this ESS depends on whether the net environmental performance benefit covers the government’s cost of intervention:
  • 1. If  S 1 + S 2 < α A + β B , indicating that net benefits are insufficient to cover costs, the unique ESS is (0,1,1). This corresponds to the strategy profile where the government does not perform its duty, while enterprises promote digital–green synergy and consumers practice digital–green consumption.
  • 2. If  S 1 + S 2 > α A + β B , indicating that net benefits exceed costs, the unique ESS is (1,1,1). This leads to the strategy profile where the government performs its duty, enterprises promote digital–green synergy, and consumers practice digital–green consumption.

4.4. Numerical Simulation and Sensitivity Analysis

4.4.1. Parameter Calibration and Economic Interpretation

All simulations are conducted using Python 3.10. The time horizon is set to t ϵ [0, 50] with a step size of 0.001, resulting in 10,000 discrete time points. This step size is chosen to ensure sufficient resolution for capturing the evolutionary dynamics while maintaining computational efficiency. The initial strategy probabilities for the government, enterprises, and consumers are uniformly set to x0 = y0 = z0 = 0.2, representing a neutral starting point where no agent has a dominant initial inclination. The parameter values used in the baseline scenario are those justified in the following subsections. Sensitivity analyses vary one or more parameters as explicitly stated, while keeping the others at their baseline values.
For government-related parameters, the environmental performance benefits S1 and S2 are set to 18 and 12 respectively, which together sum to 30. This value is intentionally chosen to be less than the combined policy costs αA + βB = 55.25 + 35.75 = 91, thereby satisfying the condition S1 + S2 < αA + βB under which the analytical model predicts that the optimal equilibrium (0,1,1) can be achieved without sustained government intervention. The specific magnitude of S1 and S2 is not critical; what matters is their sum relative to policy costs. If S1 + S2 were larger—say 100—the condition would reverse, and the model would predict (1,1,1) as the equilibrium, a scenario in which government intervention remains necessary. Our choice of 30 thus represents a realistic scenario where policy costs are substantial but not prohibitive, and market self-regulation has the potential to take over once catalyzed.
The fine F = 60 is set above the government’s publicity cost αA = 55.25 to satisfy the credibility condition F > αA, which ensures that regulation is not merely symbolic. The difference of approximately 5 reflects a modest but meaningful deterrent effect. Setting F substantially higher, say 100, would not change the qualitative equilibrium but would accelerate convergence; setting F below αA would weaken regulatory credibility and delay the transition. Our choice of 60 is therefore a conservative representation of a credible regulatory regime.
For enterprise-related parameters, the transformation cost C1 = 230 exceeds the conventional cost C2 = 185 by 45, reflecting the initial investment required for digital–green transformation. The additional revenue when consumers choose green products is captured by P1 = 420 versus P3 = 160 when consumers do not, a difference of 260 that represents the premium and market share gains from successful transformation. The reputation gain W = 130 is set at a moderate level relative to these revenues. The key composite condition P1 − P3 − C1 + C2 + W = 420 − 160 − 230 + 185 + 130 = 345 > 0 holds, ensuring that transformation is economically viable when consumers respond—a necessary condition for market-driven synergy. If this expression were negative, the model would predict that enterprises never find it profitable to transform regardless of consumer behavior, a scenario we do not wish to analyze.
For consumer-related parameters, utility levels U1 = 190, U2 = 95, and U0 = 65 are set to satisfy U1 > U2 > U0 and to generate the key condition U1 − GP – D − U0 = 190 − 35 – 25 − 65 = 65 > 0, meaning that consumers derive positive net utility from digital–green products when supported by government publicity. The information screening cost CD = 18 and premium loss coefficient η = 0.45 are chosen to produce U2 − ηGP − CD − U0 = 95 − 15.75 − 18 − 65 = −3.75 < 0, capturing consumer disutility from greenwashing. These signs are what matter for the qualitative dynamics; the exact magnitudes could vary while preserving the same sign patterns.
Platform transparency is captured directly through three parameters: greenwashing detection probability θ, premium loss coefficient η, and information screening cost CD. In the baseline scenario, we set θ = 0.75, η = 0.45, and CD = 18, representing a moderate level of platform governance.
In sum, the parameter values are not arbitrary; they are selected to satisfy the theoretical conditions derived in the stability analysis and to represent a realistic scenario in which digital–green synergy is potentially achievable but requires appropriate policy and market conditions. The sensitivity analyses reported in the following subsection confirm that the qualitative results remain robust across a wide range of parameter values, provided the core theoretical conditions are maintained.

4.4.2. Policy Catalysis: Single Parameter Sensitivity Analysis

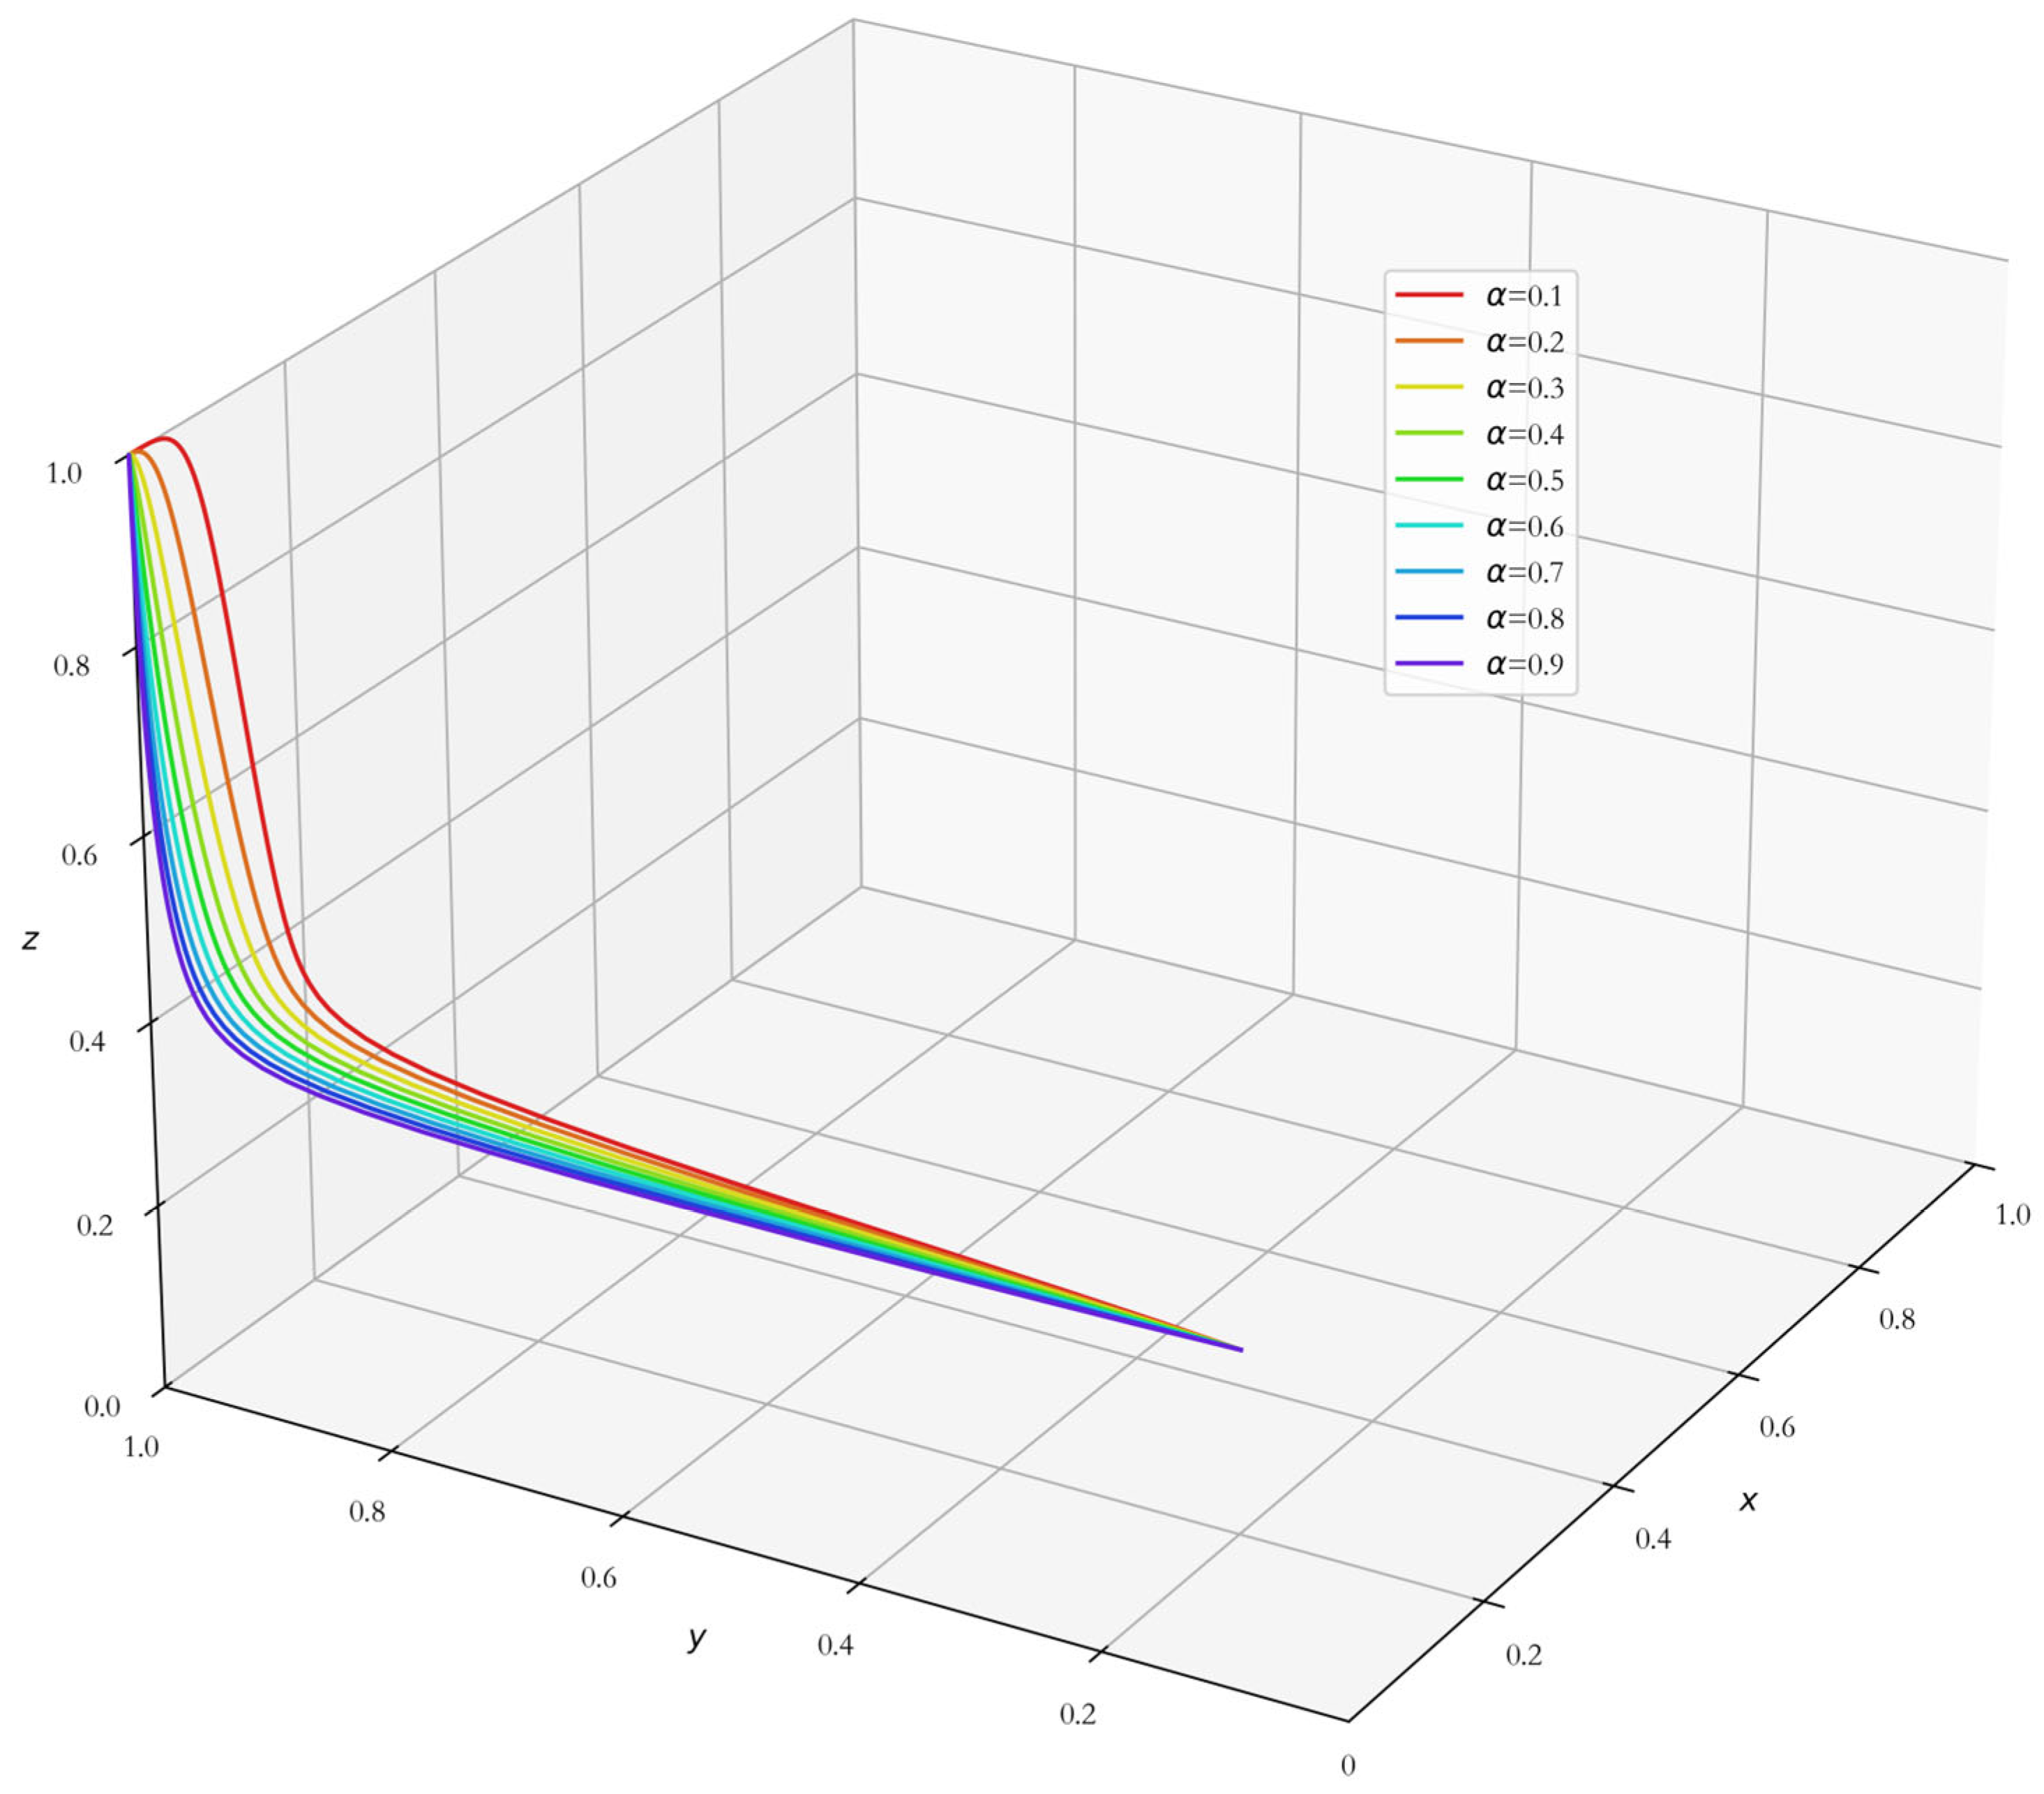
Figure 1 presents the evolutionary trajectories of the government’s strategy x (probability of active intervention), enterprises’ strategy y (probability of digital–green transformation), and consumers’ strategy z (probability of choosing digital–green products) under varying levels of government publicity intensity α, ranging from α = 0.1 to α = 0.9.
Figure 1 presents the evolutionary trajectories of government intervention x, enterprise transformation y, and consumer adoption z for publicity intensity α ranging from 0.1 to 0.9. All scenarios converge to the optimal equilibrium (0,1,1) with the same convergence time, indicating that once a baseline level of publicity is provided, further increases do not accelerate the overall transition speed. However, the trajectories exhibit slight variations in slope, especially during the early stages. Higher α tends to produce steeper initial rises in consumer adoption z, but the system compensates with a later plateau, resulting in identical crossing times. This pattern suggests that public awareness campaigns reliably catalyze the market, but their marginal effect on speed saturates quickly; the transient path may differ, but the final relay timing is robust.
Figure 2 presents the evolutionary trajectories of government intervention x, enterprise transformation y, and consumer adoption z under varying levels of government subsidy intensity β, ranging from β = 0.1 to β = 0.9. All scenarios eventually converge to the optimal equilibrium (0,1,1), consistent with the theoretical condition S1 + S2 < αA + βB.
The trajectories differ in slope: higher β induces a more rapid initial increase in enterprise transformation y, but this acceleration is later offset by a slightly slower consumer adoption phase, leading to the same overall crossing time. This indicates that while subsidies are effective in motivating enterprises, beyond a minimal level they do not hasten the market relay. The finding underscores that policy makers can choose a low to moderate subsidy level without sacrificing transition speed, thereby avoiding unnecessary fiscal expenditure.
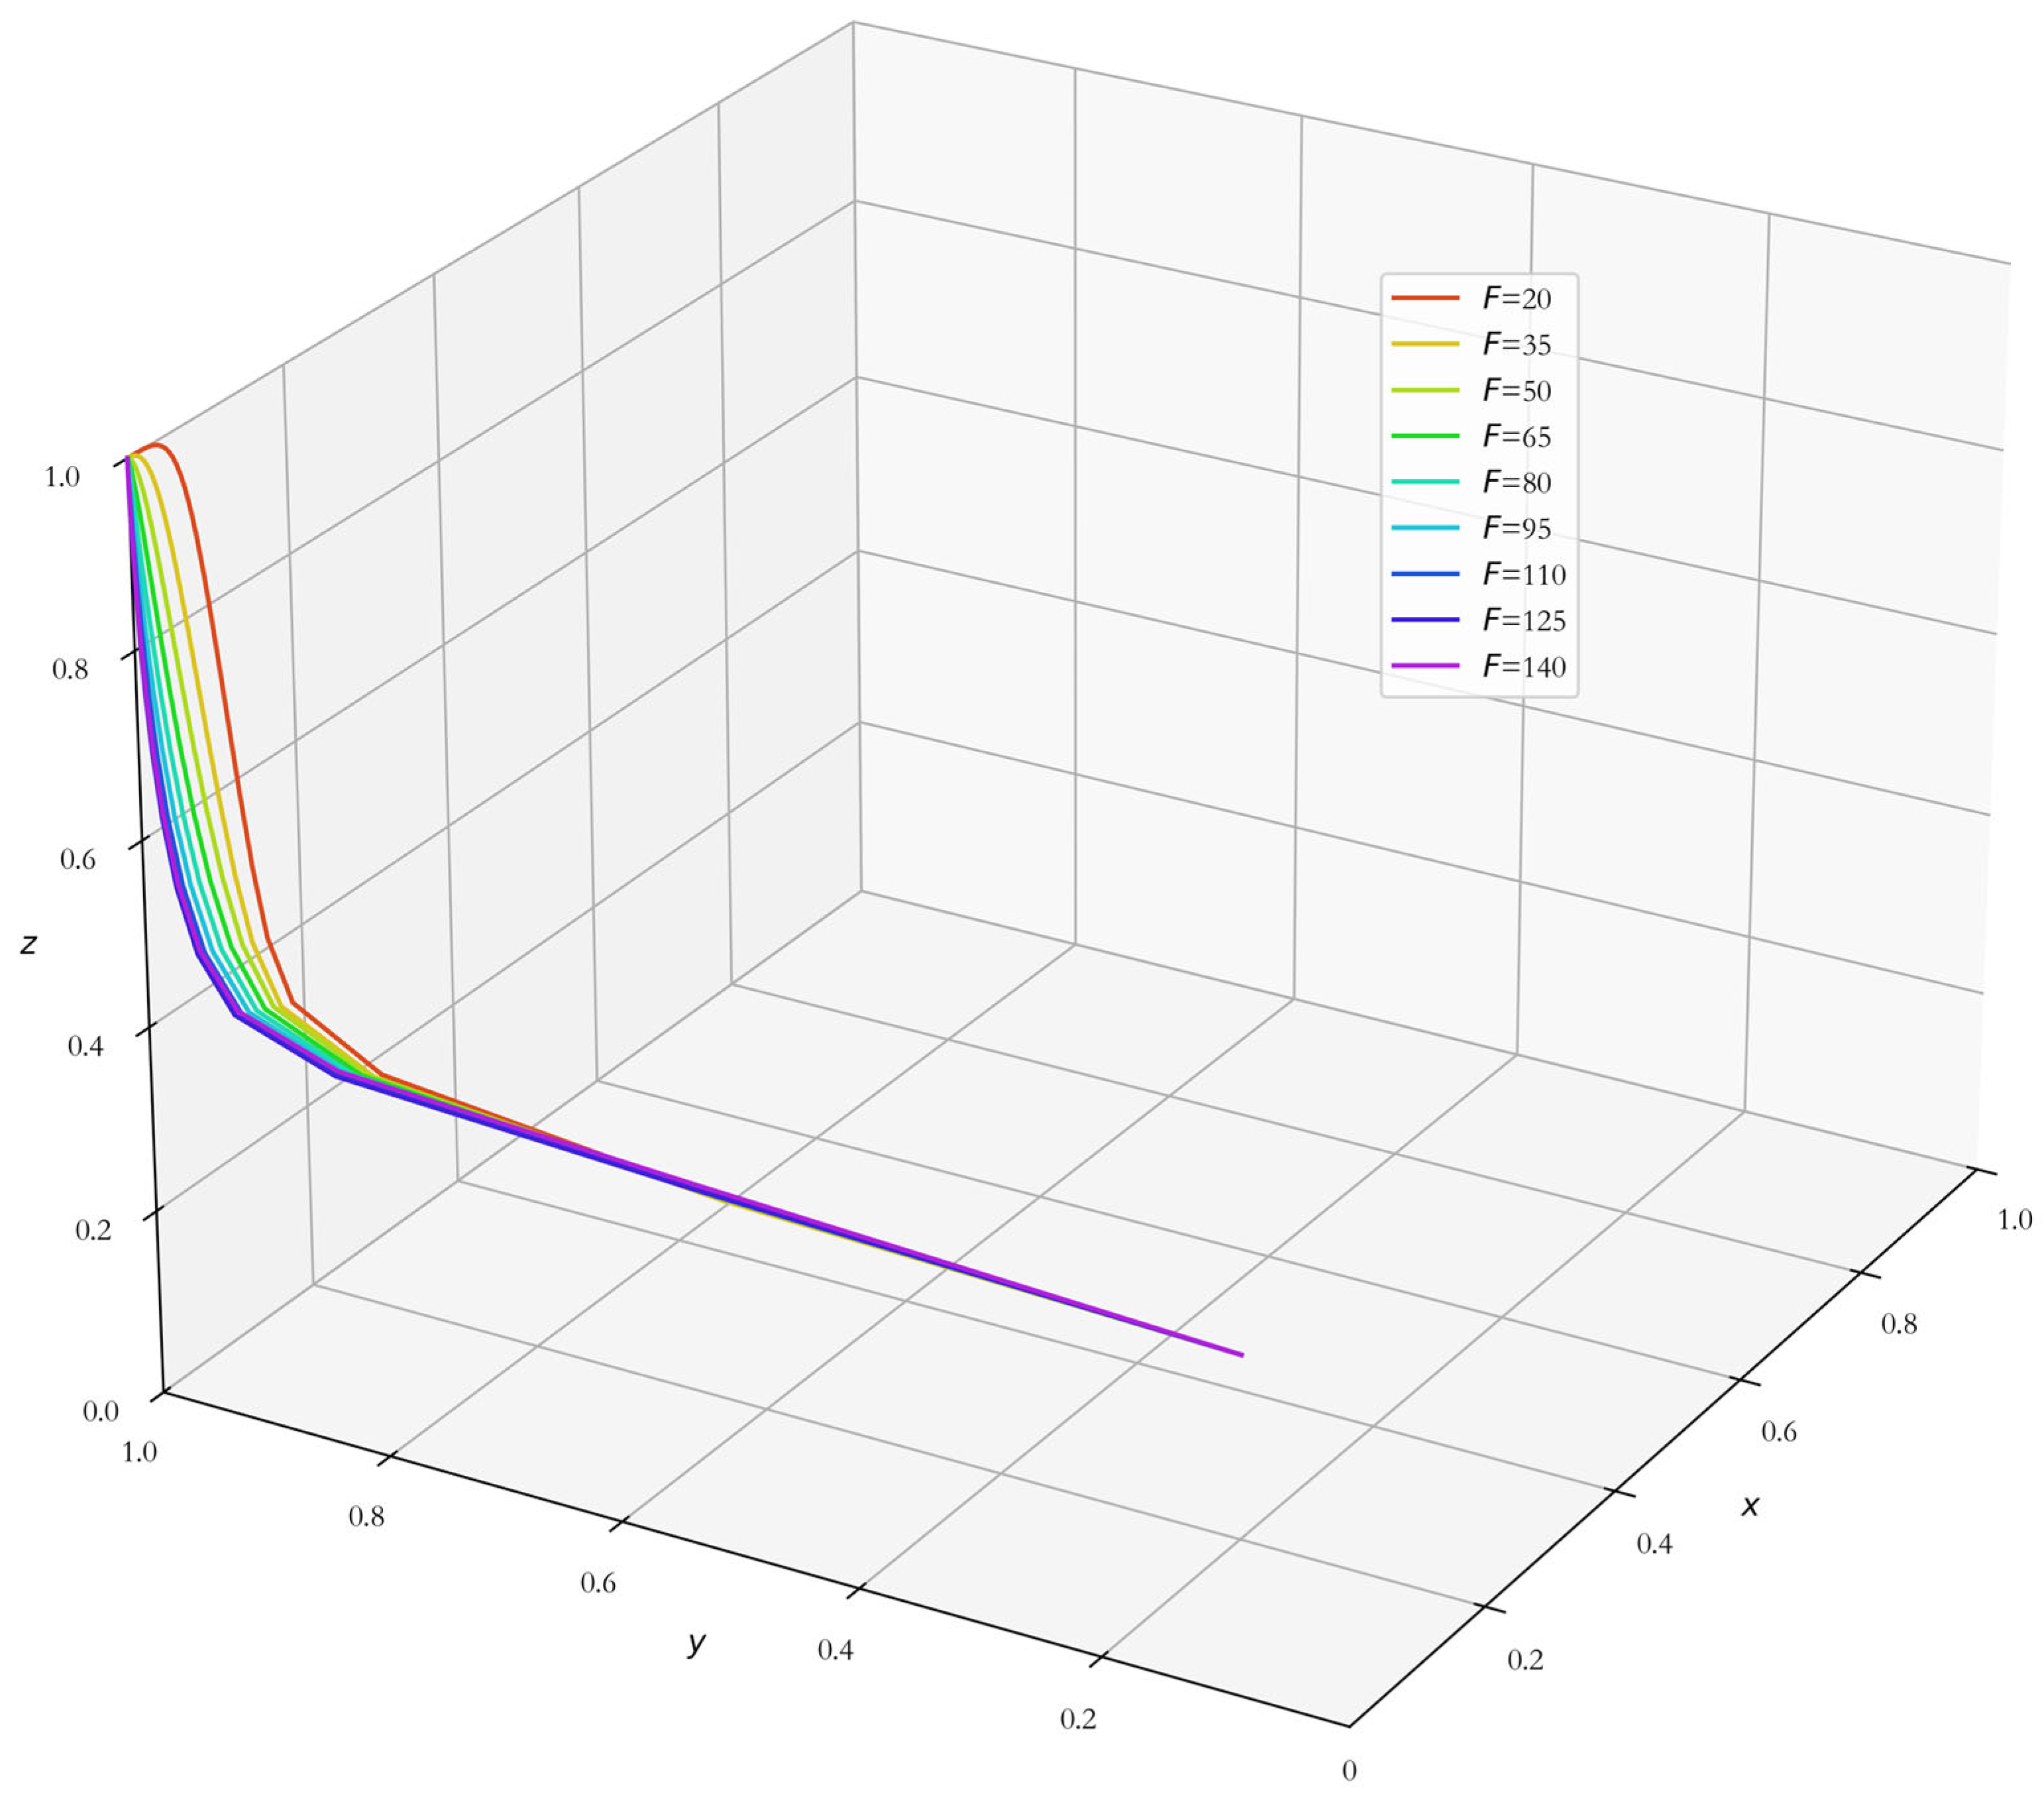
Figure 3 presents the evolutionary trajectories of government intervention x, enterprise transformation y, and consumer adoption z under varying levels of government fines F, ranging from F = 20 to F = 140. All scenarios eventually converge to the optimal equilibrium (0,1,1), consistent with the theoretical condition S1 + S2 < αA + βB.
The slopes of the trajectories vary: higher F leads to a sharper initial decline in x (government intervention) and a steeper rise in y (enterprise transformation), but the overall timing of reaching the threshold remains unchanged. This suggests that once fines exceed a credible threshold (F > αA), further increases do not accelerate the transition; the credible deterrence already suffices to motivate timely transformation. The differences in slope reflect transient responses, but the speed of the market relay is insensitive to the exact fine level.
For each policy instrument (α, β, F), all tested intensity levels lead to the same convergence time, indicating that once a minimal effective level is reached, further increases do not accelerate the transition. Nevertheless, the evolutionary trajectories exhibit variations in slope, suggesting that the transient dynamics differ while the overall speed remains unchanged. This finding highlights that policy interventions act as reliable catalysts, but their marginal impact on transition speed saturates quickly; the design choice among different intensity levels may affect the path but not the pace of market relay. Mathematically, this is possible because the time to reach a threshold depends on the entire trajectory, not only on initial slopes. Consequently, policy design should focus on achieving credible baseline levels rather than escalating intensity, which would only increase costs without accelerating the desired outcome.

4.4.3. Market Relay: Multi Parameter Interaction Analysis

Policy Mix: Interaction Between Fines and Subsidies (F × β)

Figure 4 presents the convergence times for nine policy combinations with fines F (20, 60, and 120) and subsidy intensities β (0.2, 0.5, and 0.8). All combinations converge to the optimal equilibrium (0,1,1) with identical convergence time, indicating that once a minimal credible level of either instrument is present, further increases in policy intensity—whether in fines, subsidies, or their combination—do not accelerate the transition.
This result reveals a saturation effect: policy interventions are effective at catalyzing the market, but beyond a threshold, additional intensity yields no marginal gain in speed. It also suggests that the specific mix of fines and subsidies is less critical than the presence of a credible policy framework. The findings reinforce the core narrative that policy acts as a catalyst rather than a persistent driver; once the initial conditions are set, the market relay proceeds at a pace determined by product fundamentals and platform transparency, not by the fine-tuning of policy intensity.

Product Value: Interaction Between Consumer Utility and Premium (U1 × GP)

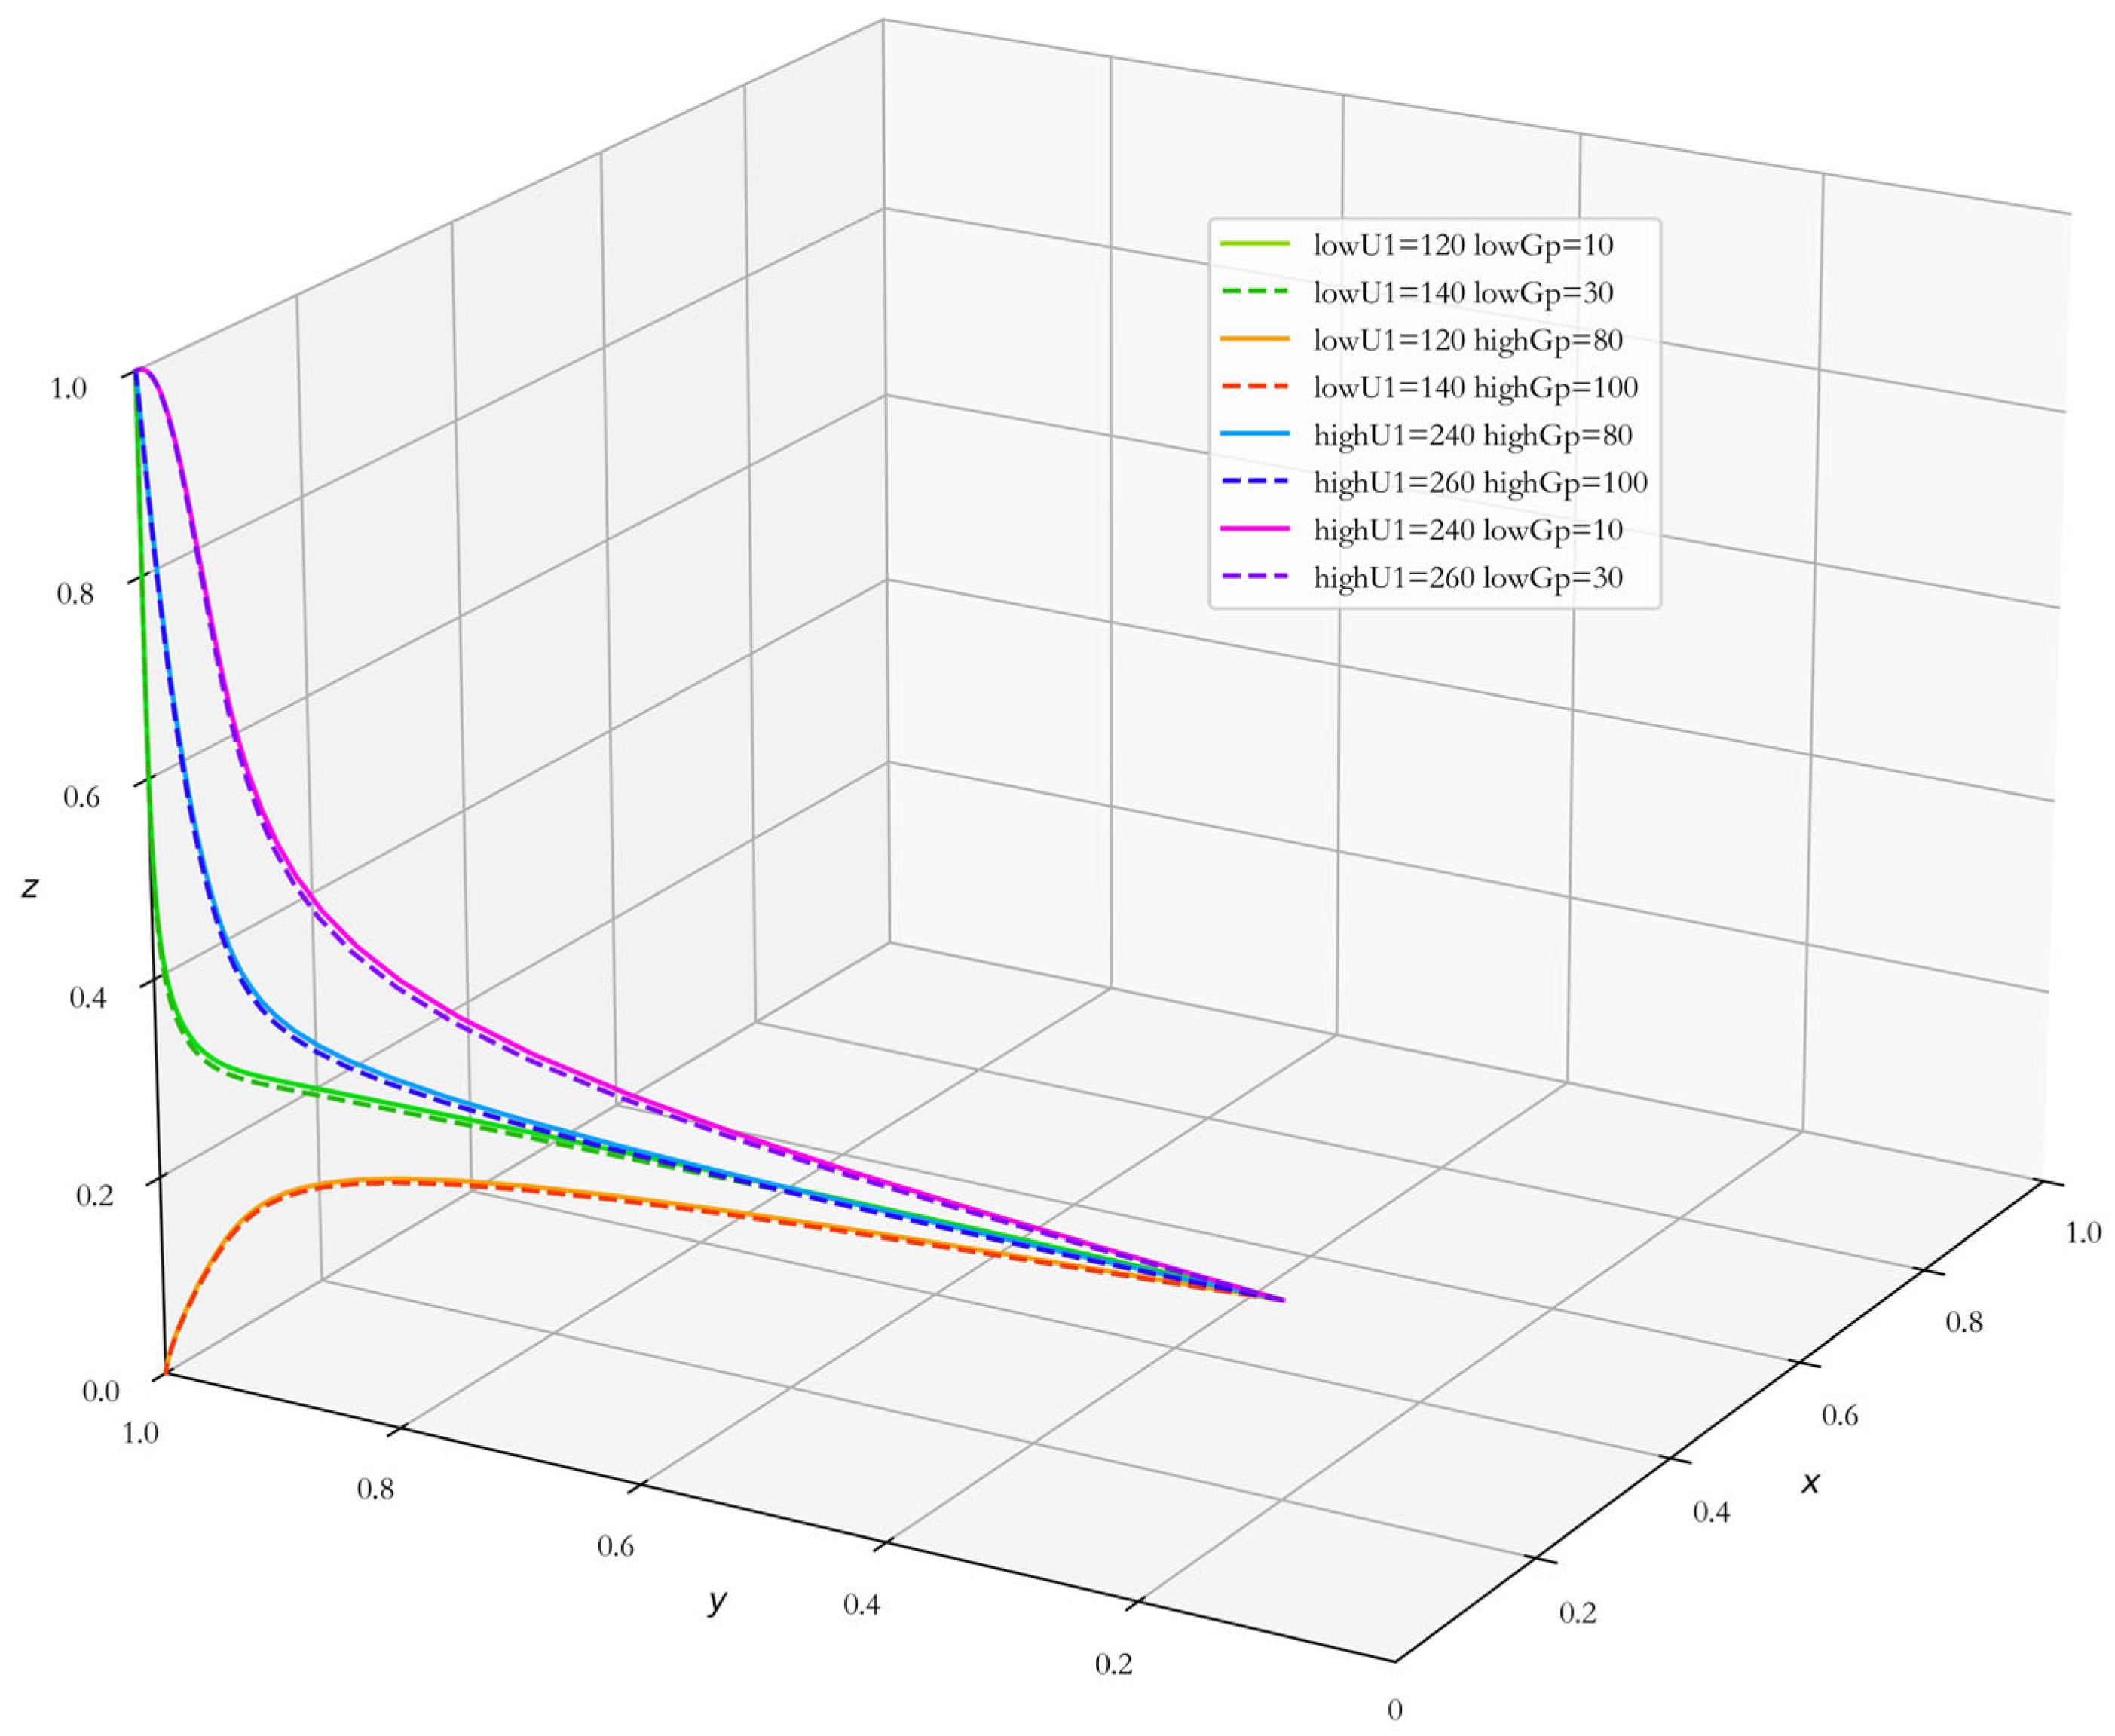
Figure 5 presents the evolutionary trajectories under different combinations of consumer utility U1 and product premium GP. The results reveal a critical threshold determined by net consumer value (U1 − GP).
When the net value is too low (e.g., low U1 paired with high GP), the system does not achieve full market synergy. Instead, it converges to the equilibrium (0,1,0), where enterprises successfully transform but consumers do not adopt digital–green products. This outcome highlights a fundamental boundary condition for the “market relay”: even if enterprises are willing to change, the market will not self-sustain unless consumers perceive sufficient value.
For all other combinations, the system converges to the optimal equilibrium (0,1,1). Among these, the convergence speed increases monotonically with net consumer value. High-utility, low-premium scenarios exhibit the fastest transition, followed by high-utility, high-premium and low-utility, low-premium scenarios, which converge at intermediate speeds. The slowest convergence occurs when net value is positive but minimal.
These findings confirm that product value is the primary driver of market self-regulation. When the net value perceived by consumers is sufficiently high, the market can achieve full synergy (0,1,1) efficiently; when it falls below a critical threshold, even enterprise transformation fails to generate consumer demand, and the market relay stalls. This underscores the central role of product fundamentals in enabling a self-sustaining market, which is the ultimate goal of the “policy catalysis → market relay” narrative. Once product value is attractive, the market can take over without continued external support.

Platform Transparency: Interaction Between Product Value and Platform Dimensions

  • Greenwashing Detection (U1 × GP × θ)
Figure 6 presents the evolutionary trajectories under different combinations of consumer utility U1 (high = 210, low = 170), product premium GP (low = 25, high = 45), and greenwashing detection probability θ (high = 0.8, low = 0.2). All scenarios converge to the optimal equilibrium (0,1,1), consistent with the theoretical condition S1 + S2 < αA + βB.
The convergence times show that θ has a modest effect on transition speed, primarily when product value is least favorable. For the high utility, low premium combination (U1 = 210, GP = 25), convergence times are identical (0.0490) under both θ levels. For the moderately favorable scenarios (U1 = 210, GP = 45 and U1 = 170, GP = 25), convergence times are also identical (0.0610 and 0.0810, respectively). In the least favorable product scenario (U1 = 170, GP = 45), a higher θ yields a slightly faster convergence (0.1250 vs. 0.1260). These results indicate that greenwashing detection mechanisms can provide a marginal acceleration when product value is very low, but their effect is otherwise negligible. Nonetheless, the presence of any measurable difference confirms that θ influences the dynamics, and higher detection probability is beneficial in the most challenging market conditions.
These findings highlight that platform transparency, through improved detection of deceptive claims, supports the market relay process, particularly when product fundamentals are weak. This complements the core narrative that platform governance plays a supportive role alongside product value.
  • Premium Loss Coefficient (U1 × GP × η)
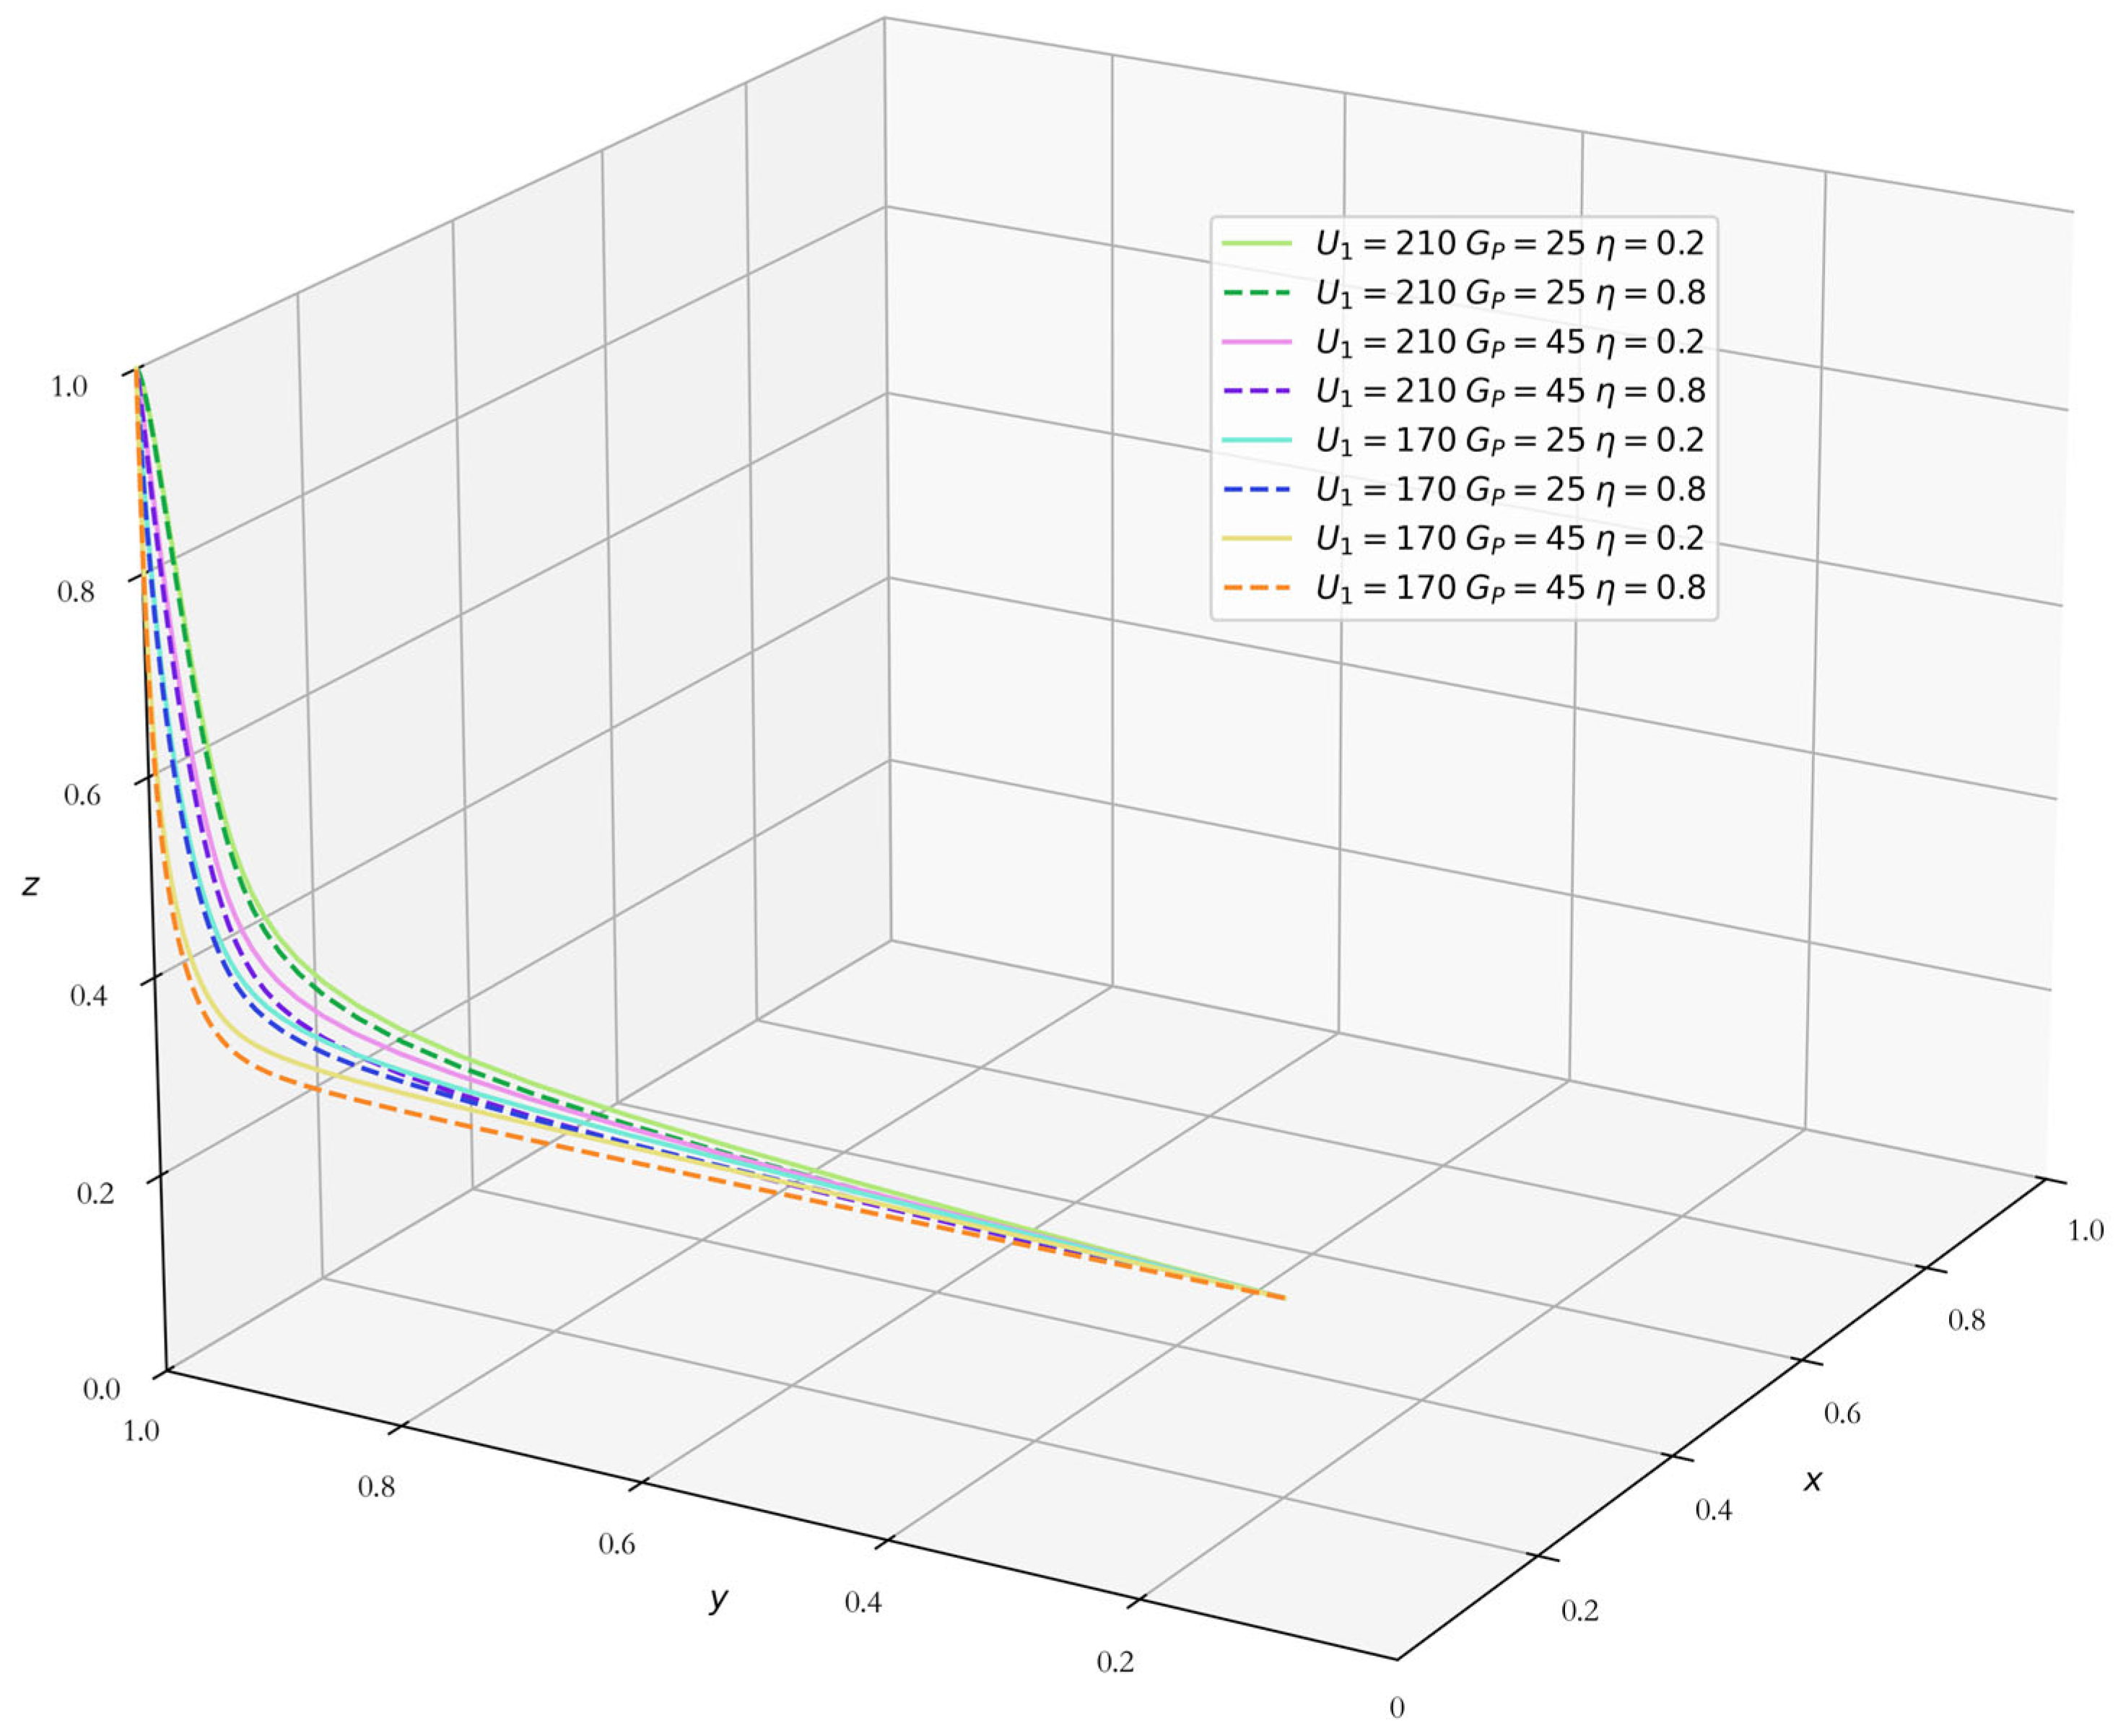
Figure 7 presents the evolutionary trajectories under different combinations of consumer utility U1 (high = 210, low = 170), product premium GP (low = 25, high = 45), and premium loss coefficient η (high = 0.8, low = 0.2). All scenarios eventually converge to the optimal equilibrium (0,1,1), consistent with the theoretical condition S1 + S2 < αA + βB.
The convergence times (the first time when both y and z exceed 0.95) show that η affects the transition speed. For the high utility, low premium combination (U1 = 210, GP = 25), convergence times are identical (0.0490) under both η levels. For the moderately favorable scenarios (U1 = 210, GP = 45 and U1 = 170, GP = 25), a higher η leads to slightly longer convergence times (0.0620 vs. 0.0600, and 0.0820 vs. 0.0800). In the least favorable product scenario (U1 = 170, GP = 45), a higher η also yields longer convergence times (0.1270 vs. 0.1240). These results indicate that a higher η (consumers being less sensitive to greenwashing) can marginally slow down the transition, because it weakens the market signal that rewards genuine transformation. Conversely, reducing η—which is a key objective of platform transparency mechanisms (e.g., reliable certifications and traceability)—helps accelerate the market relay by enabling consumers to better identify and reward authentic digital–green products.
These findings reinforce the core narrative: platform governance that reduces information asymmetry (lower η) supports faster and more efficient market self-regulation, complementing the role of product value.
  • Information Screening Cost (U1 × GP × CD)
Figure 8 presents the evolutionary trajectories under different combinations of consumer utility U1 (high = 210, low = 170), product premium GP (low = 25, high = 45), and information screening cost CD (low = 8, high = 30). All scenarios eventually converge to the optimal equilibrium (0,1,1), consistent with the theoretical condition S1 + S2 < αA + βB.
The convergence times (the first time when both y and z exceed 0.95) demonstrate that lower information screening cost (higher platform transparency) accelerates the transition. For the high utility, low premium combination (U1 = 210, GP = 25), convergence is very fast under both CD levels (0.0480 vs. 0.0490). For the moderately favorable scenarios (U1 = 210, GP = 45 and U1 = 170, GP = 25), lower CD yields faster convergence (0.0600 vs. 0.0620, and 0.0800 vs. 0.0820). In the least favorable product scenario (U1 = 170, GP = 45), lower CD also reduces convergence time (0.1240 vs. 0.1270). These results confirm that reducing information screening costs—enabled by platform transparency mechanisms such as standardized green labels and accessible traceability interfaces—meaningfully supports the market relay process by allowing consumers to verify product claims more easily, building trust faster, and thus accelerating adoption and enterprise transformation.
These findings highlight that platform governance, through lowering information barriers, plays an active and constructive role in facilitating market self-regulation, complementing product value to achieve a more efficient transition.

4.4.4. Robustness to Initial Conditions

To test whether the convergence to the optimal equilibrium (0,1,1) depends on the initial strategy probabilities, we repeated the baseline simulation under seven different initial points: (0.1,0.1,0.1), (0.2,0.2,0.2), (0.5,0.5,0.5), (0.8,0.2,0.2), (0.2,0.8,0.2), (0.2,0.2,0.8), and (0.1,0.9,0.1). In all cases, the system converged to (0,1,1) with qualitatively similar dynamics. Convergence times varied slightly (ranging from 0.07 to 0.09), with more optimistic initial adoption rates leading to faster transitions, but the final equilibrium remained unchanged. This confirms that the qualitative results are robust to initial conditions, and the system exhibits a global attraction toward the market-driven equilibrium.


5. Conclusions

5.1. Main Findings and Contributions

This study moves beyond the traditional linear perspective of environmental governance by constructing a series of evolutionary game models—from two-party to tripartite—to dissect the strategic interactions among government, enterprises, and consumers in the digital–green synergistic transition.
The analysis yields three main findings. In the government–enterprise dyad, the long-term evolutionary trajectory is fundamentally determined by the intrinsic economic viability of corporate transformation; government intervention acts as an equilibrium selector rather than a definitive driver. In the enterprise–consumer dyad, the system’s evolution hinges on the alignment between consumer preference intensity and the net benefits of corporate transformation. Integrating these dynamics, the tripartite model reveals that under conditions where the government’s net performance benefit is negative, the system can still achieve the optimal outcome—full enterprise transformation and consumer adoption—without sustained government intervention. This highlights the potential for market self-regulation to sustain digital–green synergy once policy has catalyzed the initial conditions.
These findings contribute to the literature in three ways. First, unlike prior dyadic evolutionary game models, the tripartite framework captures the full feedback loop among government, enterprises, and consumers, revealing that market self-regulation can achieve the optimal equilibrium without continuous policy intervention. Second, whereas existing studies treat policy intensity as static, this analysis demonstrates that government intervention serves primarily as an equilibrium selector; its role is to catalyze rather than to drive the transition. Third, by embedding platform-mediated transparency through parameters θ (greenwashing detection), η (premium loss coefficient), and CD (information screening cost), the model provides a theoretical foundation for understanding how e-commerce platforms can complement public policy. This extends evolutionary game theory beyond traditional environmental governance contexts to digitally mediated markets.

5.2. Policy and Platform Implications

The results carry several implications for policymakers and e-commerce platform operators.
For policymakers, the findings suggest that intervention should focus on establishing a credible baseline (e.g., a non-negligible fine and a moderate subsidy) rather than on optimizing the exact intensity of instruments, as the marginal gain from further increases is limited. The “policy catalysis” role is most effective when it creates favorable initial conditions; after that, the market can sustain itself.
For e-commerce platform operators, the model offers three specific, actionable insights. First, reducing information screening costs (CD) accelerates consumer adoption. Platforms can achieve this by standardizing green labels, providing one click access to product traceability histories (e.g., blockchain-based records), and consolidating certification information into user friendly interfaces. Second, enhancing greenwashing detection (θ) supports market self-regulation, particularly when product value is low. Platforms can implement mandatory third-party audits, blockchain-based traceability, or algorithmic monitoring to detect deceptive claims and increase the credibility of green certifications. Third, lowering the premium loss coefficient (η) helps consumers distinguish genuine green products. This can be accomplished through reliable platform-endorsed certifications, such as “green label” or “certified sustainable” badges, and by making these certifications prominently visible during the purchase process.
These implications should be interpreted as theoretical insights derived from the model’s assumptions. Empirical validation in real-world e-commerce settings is needed before drawing definitive policy or platform conclusions. Nonetheless, the model provides a structured framework for understanding how e-commerce platforms can act as governance intermediaries in the sustainability transition.

5.3. Limitations and Future Research

This study has several limitations. First, the model parameters are assumed to be fixed, whereas in reality they may evolve over time (e.g., transformation costs may decrease with technological learning). Future research could incorporate dynamic parameter systems. Second, the model treats enterprises and consumers as homogeneous groups; introducing heterogeneity (e.g., large vs. small enterprises, environmentally sensitive vs. price sensitive consumers) would yield richer insights. Third, the research focuses on a closed domestic system; expanding the framework to an open economy context, considering international competition and global supply chain pressures, could be a fruitful extension.

Author Contributions

Conceptualization, Y.W.; Methodology, Y.W.; Software, Y.W.; Validation, Y.W. and L.X.; Formal analysis, R.H. and L.X.; Investigation, R.H.; Resources, Y.W.; Data curation, Y.W. and L.X.; Writing—original draft, Y.W.; Writing—review & editing, R.H. and L.X.; Visualization, R.H. and L.X.; Supervision, R.H.; Project administration, R.H. All authors have read and agreed to the published version of the manuscript.

Funding

This research received no external funding.

Institutional Review Board Statement

Not applicable.

Informed Consent Statement

Not applicable.

Data Availability Statement

The original contributions presented in this study are included in the article Further inquiries can be directed to the corresponding author.

Conflicts of Interest

The authors declare no conflict of interest.

Appendix A

Appendix A provides the eigenvalue expressions for the eight boundary equilibrium points of the tripartite evolutionary game, along with the stability conditions used in the main text.
Table A1. Eigenvalues of the Jacobian matrix at boundary equilibrium points.
Equilibrium PointGov.λ1Ent.λ2Cons.λ3
E1(0,0,0)FαAP1P3C1 + C2 + WU2ηGPCDU0
E2(0,0,1)S2 + FαAP1 − (1 − θ)P2C1 + C2 + GP + W−(U2ηGPCDU0)
E3(0,1,0)S1αAβB−(P1P3C1 + C2 + W)U1GPDU0
E4(1,0,0)−(FαA)P1P3C1 + C2 + βB + F + WU2ηGPCDU0 + αA
E5(1,0,1)−(S2 + FαA)P1 − (1 − θ)P2C1 + C2 + βB + F + GP + W−(U2ηGPCDU0 + αA)
E6(1,1,0)−(S1αAβB) −(P1P3C1 + C2 + βB + F + W)U1GPDU0
E7(0,1,1)S1 + S2αAβB−(P1 − (1 − θ)P2C1 + C2 + GP + W)−(U1GPDU0)
E8(1,1,1)−(S1 + S2αAβB)−(P1 − (1 − θ)P2C1 + C2 + βB + F + GP + W)−(U1GPDU0)
Stability conditions
Based on the model assumptions, we have: C1 > C2, P1 > P3, U1 > U2 > U0, and all parameters are positive.
The eigenvalues in Table A1 are expressed in terms of the model parameters. Their signs are generally ambiguous without additional assumptions, as they depend on the relative magnitudes of costs, benefits, and policy intensities.
In this study, we focus on a realistic policy context where:
  • Government intervention is costly relative to its direct performance benefits (S1 + S2 − αA − βB < 0).
  • Fines are set at a level that makes regulation credible (F − αA > 0).
  • Even when the government does not actively intervene, the environmental benefits from consumers’ voluntary adoption of green products, together with fine revenues, are sufficient to cover the government’s basic publicity costs (S2 + F − αA > 0).
  • Corporate transformation is economically viable when consumers respond (P1 − P3 − C1 + C2 + W > 0).
  • Consumers derive positive net utility from digital–green products when combined with government publicity (U1 − GP − D − U0 > 0).
  • Consumers experience disutility from greenwashing (U2 − ηGP − CD − U0 < 0).
These conditions reflect a typical scenario in which the digital–green synergy is potentially achievable but requires appropriate policy and market conditions. Under these conditions, the eigenvalues take the signs reported in Table 4 of the main text, and the only asymptotically stable equilibrium is E7 when S1 + S2 < αA + βB (or E8 when the inequality is reversed). These conditions are consistent with Theorem 1 and are used in the simulation analysis in Section 4.3.

References

  1. Aiginger, K.; Rodrik, D. Rebirth of industrial policy and an agenda for the twenty-first century. J. Ind. Compet. Trade 2020, 20, 189–207. [Google Scholar] [CrossRef]
  2. Mazzucato, M. Mission-oriented innovation policies: Challenges and opportunities. Ind. Corp. Change 2018, 27, 803–815. [Google Scholar] [CrossRef]
  3. Ministry of Industry and Information Technology of the People’s Republic of China. Five Departments, Including Cyberspace Administration of China and MIIT, Jointly Launch Comprehensive Pilot Program for Coordinated Digital-Green Transformation (Dual-Transformation Synergy). 2022. Available online: https://wap.miit.gov.cn/jgsj/jns/nyjy/art/2022/art_71c10fcad7cc40f6bacd64293281fbc6.html (accessed on 22 September 2025).
  4. The China Council for International Cooperation on Environment and Development (CCICED). 2024 Report on Coordinated Digital-Green Transformation Development; CCICED: Beijing, China, 2024. [Google Scholar]
  5. Huang, B.; Dai, J.; Lim, J.J. Blockchain technology as a driver for sustainability? A consumer purchase intention perspective. Int. J. Oper. Prod. Manag. 2025, 45, 1402–1425. [Google Scholar] [CrossRef]
  6. Li, M.; Gao, X. Implementation of enterprises’ green technology innovation under market-based environmental regulation: An evolutionary game approach. J. Environ. Manag. 2022, 308, 114570. [Google Scholar] [CrossRef] [PubMed]
  7. Yi, M.; Fang, X.; Wen, L.; Guang, F.; Zhang, Y. The heterogeneous effects of different environmental policy instruments on green technology innovation. Int. J. Environ. Res. Public Health 2019, 16, 4660. [Google Scholar] [CrossRef]
  8. Wang, L.; Long, Y.; Li, C. Research on the impact mechanism of heterogeneous environmental regulation on enterprise green technology innovation. J. Environ. Manag. 2022, 322, 116127. [Google Scholar] [CrossRef]
  9. Ma, Z.; Wang, X.; Zhang, Y. Regional innovation policy mix complexity and enterprise technology innovation: Evidence from China. Bus. Process Manag. J. 2026, 32, 245–267. [Google Scholar] [CrossRef]
  10. Dongmin, Y.; Yongyi, Z. Guiding for Promotion or “Icing on the Cake”: Reexamine Causal Relationship between China Government’s Financial Subsidy and Enterprises’ R&D Input. Manag. Rev. 2019, 31, 77. [Google Scholar]
  11. Shao, W.; Yang, K.; Bai, X. Impact of financial subsidies on the R&D intensity of new energy vehicles: A case study of 88 listed enterprises in China. Energy Strategy Rev. 2021, 33, 100580. [Google Scholar] [CrossRef]
  12. Zhong, K.; Cheng, X.; Xiao, X.; Zheng, L. Do macroeconomic policies affect corporate innovation investment? Evidence from financing constraints and financing sources. Nankai Bus. Rev. 2017, 20, 4–14. [Google Scholar]
  13. Wei, S.; Xiao, P. Tax Preference, Fiscal Subsidy and Enterprise R&D Investment—An Empirical Analysis based on Shanghai and Shenzhen A-share Listed Companies. Tax. Res. 2021, 5, 40–46. [Google Scholar] [CrossRef]
  14. Wang, X.; Wang, Y. Research on the green innovation promoted by green credit policies. J. Manag. World 2021, 37, 173–188. [Google Scholar]
  15. Xing, Y.; Lingshan, C.; Yongzhong, Z. The carbon trading mechanism and corporate green innovation in China: A study based on the DDD model. Sci. Res. Manag. 2022, 43, 43. [Google Scholar]
  16. Lin, B.; Huang, C. Analysis of emission reduction effects of carbon trading: Market mechanism or government intervention? Sustain. Prod. Consum. 2022, 33, 28–37. [Google Scholar] [CrossRef]
  17. Yu, H.; Jiang, Y.; Zhang, Z.; Shang, W.-L.; Han, C.; Zhao, Y. The impact of carbon emission trading policy on firms’ green innovation in China. Financ. Innov. 2022, 8, 55. [Google Scholar] [CrossRef]
  18. Gilliland, D.I.; Manning, K.C. When Do Firms Conform to Regulatory Control? The Effect of Control Processes on Compliance and Opportunism. J. Public Policy Mark. 2002, 21, 319–331. [Google Scholar] [CrossRef]
  19. Yiqiang, Z.; Lianghua, C.; Yan, Z.; Ziyuan, S. Selective Incentive or Function Construction? Government Innovation Policy and Strategic Catering of Enterprises. Sci. Sci. Manag. S&T 2024, 45, 21–39. [Google Scholar] [CrossRef]
  20. Tang, P.; Wang, C.; Jiang, Q.; Liu, X.; Wang, J. Symbol or substance? Environmental regulations and corporate environmental actions decoupling. J. Environ. Manag. 2023, 346, 118950. [Google Scholar] [CrossRef]
  21. Albayrak, T.; Aksoy, Ş.; Caber, M. The effect of environmental concern and scepticism on green purchase behaviour. Mark. Intell. Plan. 2013, 31, 27–39. [Google Scholar] [CrossRef]
  22. Chen, C.; Zhang, D.; Zhu, L.; Zhang, F. Promoting green choices: How price premium displays influence consumer preference for green products. Resour. Conserv. Recycl. 2024, 207, 107682. [Google Scholar] [CrossRef]
  23. Lingrong, Z.; Bo, P.; Chunqi, C. Research on Government Subsidy Strategy of Low-carbon Supply Chain Based on Block-chain Technology. Chin. J. Manag. Sci. 2023, 31, 49–60. [Google Scholar] [CrossRef]
  24. Nygaard, A.; Silkoset, R. Sustainable development and greenwashing: How blockchain technology information can empower green consumers. Bus. Strat. Environ. 2023, 32, 3801–3813. [Google Scholar] [CrossRef]
  25. Peng, B.; Tu, Y.; Elahi, E.; Wei, G. Extended Producer Responsibility and corporate performance: Effects of environmental regulation and environmental strategy. J. Environ. Manag. 2018, 218, 181–189. [Google Scholar] [CrossRef] [PubMed]
  26. Wong, E.Y.C.; Chan, F.F.Y.; So, S. Consumer perceptions on product carbon footprints and carbon labels of beverage merchandise in Hong Kong. J. Clean. Prod. 2020, 242, 118404. [Google Scholar] [CrossRef]
  27. Sheeran, P.; Webb, T.L. The intention–behavior gap. Soc. Personal. Psychol. Compass 2016, 10, 503–518. [Google Scholar] [CrossRef]
  28. Yin, S.; Xu, Y.; Chen, M. Consumers purchase decisions and affecting factors on organic food. China Popul. Resour. Environ. 2013, 23, 136–141. [Google Scholar]
  29. Guo, Y.; Wu, J.; Wang, C.; Li, K. The Formation Mechanism of Consumer Channel Selection Intention during Multi-channel Retailing Environment—Moderating Role of Product Categories Characteristics. Chin. J. Manag. Sci. 2018, 26, 158–169. [Google Scholar] [CrossRef]
  30. Chang, T.-W.; Chen, Y.-S.; Yeh, Y.-L.; Li, H.-X. Sustainable consumption models for customers: Investigating the significant antecedents of green purchase behavior from the perspective of information asymmetry. J. Environ. Plan. Manag. 2021, 64, 1668–1688. [Google Scholar] [CrossRef]
  31. Wu, B.; Liu, P.; Xu, X. An evolutionary analysis of low-carbon strategies based on the government–enterprise game in the complex network context. J. Clean. Prod. 2017, 141, 168–179. [Google Scholar] [CrossRef]
  32. Sun, Z.; Zhang, W. Do government regulations prevent greenwashing? An evolutionary game analysis of heterogeneous enterprises. J. Clean. Prod. 2019, 231, 1489–1502. [Google Scholar] [CrossRef]
  33. Shi, Y.; Wen, Z.; Zhang, Z. Evolutionary game analysis of empowering smes’ digital transformation by core manufacturing enterprises under government subsidies. Systems 2025, 13, 225. [Google Scholar] [CrossRef]
  34. Li, J.; Gao, L.; Tu, J. Evolutionary Game Analysis of Governments’ and Enterprises’ Carbon-Emission Reduction. Sustainability 2024, 16, 4216. [Google Scholar] [CrossRef]
  35. Wu, X.; Wang, Y. Research on evolutionary game theory of green packaging selection for platform enterprises considering consumer green preferences. Environ. Dev. Sustain. 2025, 1–25. [Google Scholar] [CrossRef]
  36. Guo, K.; Zhan, C.; Niu, M.; Sharma, A. Analysis of green transformation pathways for express packaging recycling based on tripartite evolutionary game: The role of consumer carbon responsibility. Environ. Dev. Sustain. 2025, 28, 10397–10432. [Google Scholar] [CrossRef]
  37. Kong, D.; Xia, Q.; Xue, Y.; Zhao, X. Effects of multi policies on electric vehicle diffusion under subsidy policy abolishment in China: A multi-actor perspective. Appl. Energy 2020, 266, 114887. [Google Scholar] [CrossRef]
  38. Zhu, J.; Baker, J.S.; Song, Z.; Yue, X.-G.; Li, W. Government regulatory policies for digital transformation in small and medium-sized manufacturing enterprises: An evolutionary game analysis. Humanit. Soc. Sci. Commun. 2023, 10, 1–18. [Google Scholar] [CrossRef]
  39. Xu, R.; Wang, Y.; Wang, W.; Ding, Y. Evolutionary game analysis for third-party governance of environmental pollution. J. Ambient Intell. Humaniz. Comput. 2019, 10, 3143–3154. [Google Scholar] [CrossRef]
  40. Mohammadi Darani, M.; Aghaie, S. Recommender systems impact on Platform’s content and outcomes: The role of providers and algorithm designs. J. Res. Interact. Mark. 2025, 19, 917–935. [Google Scholar] [CrossRef]
  41. Heo, W. Revisiting Algorithmic Bounded Rationality with Potential Solutions: How Recommendation Systems Amplify Cognitive Biases in Consumer Decision-Making. J. Consum. Aff. 2025, 59, e70032. [Google Scholar] [CrossRef]
  42. Adewusi, A.O.; Chikezie, N.R.; Eyo-Udo, N.L. Blockchain technology in agriculture: Enhancing supply chain transparency and traceability. Financ. Account. Res. J. 2023, 5, 479–501. [Google Scholar] [CrossRef]
  43. Sunny, J.; Undralla, N.; Pillai, V.M. Supply chain transparency through blockchain-based traceability: An overview with demonstration. Comput. Ind. Eng. 2020, 150, 106895. [Google Scholar] [CrossRef]
  44. Sgroi, F. Digital technologies to remove the information asymmetry in the food market. Smart Agric. Technol. 2023, 5, 100326. [Google Scholar] [CrossRef]
  45. Xue, H.; Jin, S.; Wu, Q.; Geng, X. How does platform certification affect the marketing performance of sellers in food e-commerce? Interaction with reputation mechanisms. China Agric. Econ. Rev. 2023, 15, 758–776. [Google Scholar] [CrossRef]
  46. North, D.C. The new institutional economics. J. Institutional Theor. Econ. (Jite) Z. Für Die Gesamte Staatswiss. 1986, 142, 230–237. [Google Scholar]
  47. Wang, S.; Li, X.; Li, Z.; Ye, Y. The effects of government support on enterprises’ digital transformation: Evidence from China. Manag. Decis. Econ. 2023, 44, 2520–2539. [Google Scholar] [CrossRef]
  48. Chen, D.; Hu, H.; Wang, N.; Chang, C.-P. The impact of green finance on transformation to green energy: Evidence from industrial enterprises in China. Technol. Forecast. Soc. Change 2024, 204, 123411. [Google Scholar] [CrossRef]
  49. Chen, W. Can low-carbon development force enterprises to make digital transformation? Bus. Strat. Environ. 2023, 32, 1292–1307. [Google Scholar] [CrossRef]
  50. Lovallo, D.; Brown, A.L.; Teece, D.J.; Bardolet, D. Resource re-allocation capabilities in internal capital markets: The value of overcoming inertia. Strateg. Manag. J. 2020, 41, 1365–1380. [Google Scholar] [CrossRef]
  51. Akerlof, G.A. The market for “lemons”: Quality uncertainty and the market mechanism. In Uncertainty in Economics; Elsevier: Amsterdam, The Netherlands, 1978; pp. 235–251. [Google Scholar]
  52. Zhang, X.M.; Wang, X.N. Research on the influence of eco-label on the purchase intention of green products with the mediating role of consumer perceived value. Ecol. Econ. 2019, 35, 63–68. [Google Scholar]
  53. Gadema, Z.; Oglethorpe, D. The use and usefulness of carbon labelling food: A policy perspective from a survey of UK supermarket shoppers. Food Policy 2011, 36, 815–822. [Google Scholar] [CrossRef]
  54. Vanclay, J.K.; Shortiss, J.; Aulsebrook, S.; Gillespie, A.M.; Howell, B.C.; Johanni, R.; Maher, M.J.; Mitchell, K.M.; Stewart, M.D.; Yates, J. Customer Response to Carbon Labelling of Groceries. J. Consum. Policy 2011, 34, 153–160. [Google Scholar] [CrossRef]
  55. McVey, C.; Elliott, C.T.; Cannavan, A.; Kelly, S.D.; Petchkongkaew, A.; Haughey, S.A. Portable spectroscopy for high throughput food authenticity screening: Advancements in technology and integration into digital traceability systems. Trends Food Sci. Technol. 2021, 118, 777–790. [Google Scholar] [CrossRef]
  56. Merkle, R.C. A Digital Signature Based on a Conventional Encryption Function. In Advances in Cryptology—CRYPTO ’87; Pomerance, C., Ed.; Springer: Berlin/Heidelberg, Germany, 1988; pp. 369–378. [Google Scholar]
  57. Madumere, N. Public enlightenment and participation—A major contribution in mitigating climate change. Int. J. Sustain. Built Environ. 2017, 6, 9–15. [Google Scholar] [CrossRef]
  58. Fetting, C. The European Green Deal; ESDN Report; European Commission: Brussels, Belgium, 2020; p. 53.
  59. Hainsch, K.; Löffler, K.; Burandt, T.; Auer, H.; del Granado, P.C.; Pisciella, P.; Zwickl-Bernhard, S. Energy transition scenarios: What policies, societal attitudes, and technology developments will realize the EU Green Deal? Energy 2022, 239, 122067. [Google Scholar] [CrossRef]
  60. Jia, X.; Zhang, Y.; Tan, R.R.; Li, Z.; Wang, S.; Wang, F.; Fang, K. Multi-objective energy planning for China’s dual carbon goals. Sustain. Prod. Consum. 2022, 34, 552–564. [Google Scholar] [CrossRef]
  61. Zhu, Y.; Hu, Y.; Zhu, Y. Can China’s energy policies achieve the “dual carbon” goal? A multi-dimensional analysis based on policy text tools. Environ. Dev. Sustain. 2024, 28, 5551–5590. [Google Scholar] [CrossRef]
  62. Zhou, X.; Lu, H.; Kumar Mangla, S. The impact of digital traceability on sustainability performance: Investigating the roles of sustainability-oriented innovation and supply chain learning. Supply Chain. Manag. An. Int. J. 2024, 29, 497–522. [Google Scholar] [CrossRef]
  63. Damberg, S.; Saari, U.A.; Fritz, M.; Dlugoborskyte, V.; Božič, K. Consumers’ purchase behavior of Cradle to Cradle Certified® products—The role of trust and supply chain transparency. Bus. Strat. Environ. 2024, 33, 8280–8299. [Google Scholar] [CrossRef]
  64. Darnall, N.; Ji, H.; Iwata, K.; Arimura, T.H. Do ESG reporting guidelines and verifications enhance firms’ information disclosure? Corp. Soc. Responsib. Environ. Manag. 2022, 29, 1214–1230. [Google Scholar] [CrossRef]
  65. De Vries, G.; Terwel, B.W.; Ellemers, N.; Daamen, D.D.L. Sustainability or Profitability? How Communicated Motives for Environmental Policy Affect Public Perceptions of Corporate Greenwashing. Corp. Soc. Responsib. Environ. Manag. 2015, 22, 142–154. [Google Scholar] [CrossRef]
  66. Kolcava, D. Greenwashing and public demand for government regulation. J. Public Policy 2023, 43, 179–198. [Google Scholar] [CrossRef]
  67. Friedman, D. Evolutionary games in economics. Econom. J. Econom. Soc. 1991, 59, 637–666. [Google Scholar] [CrossRef]
Figure 1. Evolutionary dynamics under varying levels of government publicity intensity α.
Jtaer 21 00117 g001
Figure 2. Evolutionary dynamics under varying levels of government subsidy intensity β.
Jtaer 21 00117 g002
Figure 3. Evolutionary dynamics under varying levels of government fine F.
Jtaer 21 00117 g003
Figure 4. Evolutionary dynamics under different policy mix scenarios (F × β).
Jtaer 21 00117 g004
Figure 5. Evolutionary dynamics under different product value scenarios (U1 × GP).
Jtaer 21 00117 g005
Figure 6. Evolutionary dynamics under different combinations of U1, GP, and greenwashing detection probability θ.
Jtaer 21 00117 g006
Figure 7. Evolutionary dynamics under different combinations of U1, G, and premium loss coefficient η.
Jtaer 21 00117 g007
Figure 8. Evolutionary dynamics under different combinations of U1, GP, and information screening cost CD.
Jtaer 21 00117 g008
Table 1. Payoff matrix of the two-party evolutionary game between government and enterprise.
PlayersPromotes Digital–Green Synergy
(E1)
Maintain Conventional Operations
(E2)
Perform duty
(G1)
T1 + λE − βB − γC
P0 + ΔP − C1 + βB + μE
T2 + F − γC − CE
P0 − C0 − F
Not perform duty
(G2)
T1 + λE
P0 + ΔP − C1 + μE
T2 − CE
P0 − C0
Table 2. Payoff matrix of the two-party evolutionary game between enterprise and consumer.
PlayersPromotes Digital–Green Synergy
(E1)
Maintain Traditional Development Model
(E2)
Adopt digital–green products actively
(R1)
P0 + ΔP + G − C1
U0 + ΔU − P0 − ΔP
P0 − C0 − L2
U0 − ΔU − P0
Maintain conventional consumption
(R2)
P0 + λΔP − C1 − L1
U0 + λΔU − P0 − λΔP
P0 − C0
U0 − P0
Table 3. Payoff matrix of the tripartite evolutionary game among government, enterprise, and consumer.
PlayersConsumer R1
z(t)
Consumer R2
1 − z(t)
Government
G1
x(t)
Enterprise E1
y(t)
T1 + S1 + S2 − αA − βB;
P1 + GP + βB + W − C1;
U1 + αA − GP
T1 + S1 − αA − βB;
P1 + βB + W − C1;
U0 + D+γαA
Enterprise E2
1 − y(t)
T2 + S2 + F − αA;
(1 − θ)P2 − C2 − F;
U2 + αA − ηGP − CD
T2 + F − αA;
P3 − C2 − F;
U0 + γαA
Government
G2
1 − x(t)
Enterprise E1
y(t)
T1;
P1 + GP + W − C1;
U1 − GP
T1;
P1 + W − C1;
U0 + D
Enterprise E2
1 − y(t)
T2;
(1 − θ)P2 − C2;
U2 − ηGP − CD
T2;
P3 − C2;
U0
Table 4. Stability analysis of equilibrium points.
Equilibrium PointEigenvaluesStability
Gov.λ1Ent.λ2Cons.λ3
E1(0,0,0)>0<0Saddle Point
E2(0,0,1)>0>0>0Unstable Point
E3(0,1,0)<0>0Saddle Point
E4(1,0,0)>0Saddle Point
E5(1,0,1)<0>0Saddle Point
E6(1,1,0)<0>0Saddle Point
E7(0,1,1)<0<0Stable Point if S1 + S2 < αA + βB; Otherwise, Saddle Point
E8(1,1,1)<0<0Stable Point if S1 + S2 > αA + βB; Otherwise, Saddle Point
Disclaimer/Publisher’s Note: The statements, opinions and data contained in all publications are solely those of the individual author(s) and contributor(s) and not of MDPI and/or the editor(s). MDPI and/or the editor(s) disclaim responsibility for any injury to people or property resulting from any ideas, methods, instructions or products referred to in the content.