Article

Brand Image of Beijing’s Time-Honored Restaurants: An Analysis Through Large Language Model-Driven Review Mining

1
College of Applied Arts and Science, Beijing Union University, Beijing 100191, China
2
Laboratory of Urban Cultural Sensing & Computing, Beijing Union University, Beijing 100191, China
*
Author to whom correspondence should be addressed.
J. Theor. Appl. Electron. Commer. Res. 2025, 20(4), 300; https://doi.org/10.3390/jtaer20040300
Submission received: 31 August 2025 / Revised: 3 October 2025 / Accepted: 13 October 2025 / Published: 2 November 2025

Abstract

Understanding consumer perceptions of brand image is vital for the sustainable development of China Time-honored Brands, which combine cultural heritage with commercial value. This study aims to systematically analyze the brand image of Beijing’s time-honored restaurants by developing a large language model (LLM)-driven framework that advances beyond the limits of traditional text mining in semantic depth and adaptability. Using Dianping reviews from 2016 to 2022, we apply the Qwen3-32B model to map consumer feedback onto a Functional–Experiential–Symbolic (F–E–S) framework. Sentiment quantification and clustering analysis are employed to generate brand image profiles and identify common brand types, while topic modeling is used to uncover the specific consumer concerns shaping these perceptions. The results reveal a dual structure: the symbolic dimension, rooted in cultural heritage, is consistently high and stable, whereas the functional and experiential dimensions, associated with daily operations, are relatively low and highly volatile. Clustering further distinguishes two significantly different categories: comprehensive performers and heritage struggler brands. The key difference lies in whether brands can transform symbolic capital derived from historical legacy into positive consumer experiences through excellent operational performance. By integrating dynamic and structural perspectives, this study advances brand image research and provides data-driven insights to guide the targeted management and modernization of heritage brands.

1. Introduction

China Time-honored Brands (CTHBs) refer to enterprises with a long history that have preserved traditional products, techniques, or services across generations. These brands embody distinctive elements of Chinese cultural heritage, enjoy broad social recognition, and maintain a strong reputation. They span a wide range of industries, including catering, food processing, brewing, pharmaceuticals, and household services, among which restaurants account for the largest proportion [1,2]. Beyond their economic role, CTHBs also serve as important carriers of collective memory [3] and as vital vehicles for the transmission of intangible cultural heritage [4].
The seminal framework for brand image, developed by Park et al. [5], conceptualizes consumer perception through three distinct dimensions: functional, experiential, and symbolic. This theoretical lens is exceptionally well-suited for analyzing CTHBs, as they inherently combine utilitarian value with deep cultural significance. Consequently, investigating consumer perceptions of these heritage restaurant brands offers a dual contribution. It not only yields critical insights for strategic management [5,6] but also carries profound implications for the dynamic preservation and sustainable development of traditional Chinese cultural heritage.
Traditional studies on brand image have primarily relied on surveys and interviews to collect data [7,8]. However, such conventional approaches are constrained by limited sample sizes, high costs, and potential biases, making them inadequate for capturing the voices of contemporary consumers at scale [9,10]. Consequently, an increasing number of studies have turned to user-generated content (UGC) on online review platforms, leveraging text mining techniques to construct consumer perceptions of brands [10,11,12]. As a dominant form of electronic word of mouth (eWOM), UGC can be automatically collected via client-side APIs, which substantially reduces data acquisition costs. Moreover, since UGC is largely based on consumers’ spontaneous expressions, the information it conveys tends to be more authentic and trustworthy [13,14]. Although a number of studies have sought to extract various aspects of consumer perceptions from textual data [15,16,17,18], research remains limited in moving beyond the aspect-level perspective to capture brand image types within a Functional–Experiential–Symbolic (F–E–S) framework.
The rise in deep learning, particularly the remarkable contextual understanding ability demonstrated by pre-trained models such as BERT, has substantially advanced text mining applications [19,20]. Nevertheless, these models often require extensive annotated data for domain-specific fine-tuning [21], and still face challenges in handling complex sentences involving multiple aspects and sentiment polarities [22]. This methodological limitation underscores the need for a more powerful, flexible, and transferable approach to capture the rich and nuanced information embedded in textual data [23].
In the era of large language models (LLMs), their unprecedented capabilities have catalyzed transformative advances across numerous fields [24,25,26]. With their vast parameter scales, LLMs excel in zero-shot and few-shot learning, complex reasoning, and instruction-following tasks [27]. They are capable of comprehending intricate linguistic structures and inferring sentiment from subtle contextual cues without requiring extensive task-specific training [28]. This creates a transformative opportunity to transcend the limitations of earlier methods and models, enabling more accurate, fine-grained, and comprehensive analyses of brand image. Despite their immense potential, the application of LLMs to constructing brand image perceptions from UGC remains an underexplored research frontier [23].
In summary, current research on brand image in the time-honored restaurant industry faces several key limitations:
  • Perspective limitation: Most existing studies remain at a descriptive level, failing to uncover different brand image typologies from a holistic and structural perspective. In other words, while we may know “which brands perform better or worse,” we still lack an understanding of “what types of ‘good’ brand images exist, and how these types are constructed.”
  • Methodological limitation: Prior studies primarily rely on traditional machine learning or deep learning models (e.g., BERT), without fully leveraging the remarkable potential of LLMs in handling complex semantics, multi-faceted sentiment, and zero-shot learning. As a result, existing analyses fall short of delivering more precise, fine-grained insights.
To address this research gap, the present study aims to systematically delineate the brand image of Beijing’s time-honored restaurants within the F-E-S framework by leveraging LLM. Utilizing a dataset of online reviews collected from Dianping between 2016 and 2022, we employ the open-source LLM Qwen-32B to conduct fine-grained, aspect-based sentiment analysis (ABSA). The identified aspects are then mapped onto the three dimensions of the F–E–S framework, with the net sentiment scores of each dimension serving as quantitative indicators of brand image. By applying K-Means clustering to these brand image scores, we aim to reveal distinct brand image typologies. Furthermore, we conduct BERTopic topic modeling on the opinion words associated with representative brands from each cluster, in order to uncover the specific consumer concerns underlying brand perceptions. This enables us to provide actionable, fine-grained insights for brand image management.
The rest of this paper is organized as follows: Section 2 reviews the relevant literature, Section 3 details the research methodology, Section 4 presents the research findings, Section 5 discusses the implications of the research, and Section 6 concludes the study.

2. Related Research

2.1. China Time-Honored Brands

China Time-honored Brands (CTHBs) are widely recognized as symbols of traditional Chinese business culture and are regarded as the most resilient brands [29,30]. From a global perspective, these entities align closely with the concept of heritage brands, as both are defined by their deep historical legacy, unique artisanal value, and cultural authenticity.
Heritage brands globally face challenges stemming from societal shifts [31,32], a phenomenon that is particularly acute in China. According to data from the Ministry of Commerce, the number of CTHBs has plummeted from over 10,000 in the mid-20th century to just 1128 [33], with only 10% remaining profitable. The existing literature largely attributes this decline to a central tension: the conflict between brand authenticity and brand innovation. On one hand, authenticity is the cornerstone of a heritage brand and positively influences consumer word-of-mouth [30], with its perceived dimensions spanning historical culture, nostalgia, and physical environment [34]. On the other hand, if innovation is perceived by consumers as a departure from—rather than a refinement of—tradition, it can erode the brand’s foundation and negatively impact purchase intentions [35]. In this context, balancing the preservation of traditional cultural essence with the diverse demands of modern consumers has become a critical existential challenge for CTHBs [36,37].
A growing body of research indicates that CTHBs generally face severe survival challenges in contemporary markets [4,37,38], with their greatest dilemma lying in striking a balance between maintaining brand authenticity and pursuing innovation. In some cases, attempts at innovation risk drifting toward “inauthenticity” [30]. When consumers perceive innovation as a departure from rather than a refinement of tradition, it can disrupt the brand’s historical continuity and undermine perceptions and purchase intentions [35].
In response, scholars have explored feasible pathways for the modernization of CTHBs from multiple perspectives. In terms of brand authenticity, Zhang et al. [30] confirmed that authenticity exerts a significant positive effect on consumer word-of-mouth, both online and offline. Chen et al. [34] further demonstrated that consumers’ perceptions of authenticity in traditional restaurants are influenced by a variety of factors—including historical and cultural value, brand value, nostalgia, environment, and food authenticity—and that these perceptions enhance the experiential value of dining. With respect to brand innovativeness, researchers have proposed diverse strategies, such as reshaping brand images through new media and social platforms to effectively attract younger generations [39], and leveraging digital interaction as a novel approach to brand identity formation amid intensifying domestic and international competition [40]. Moreover, “creative nostalgia” has been identified as an innovative strategy that organically integrates elements of the past and present, simultaneously evoking historical themes while projecting modernity and novelty [41]. Collaborative branding with emerging or fashion brands has also been suggested as an effective means of revitalizing CTHBs and reinvigorating their market image [37].
Although these studies provide valuable insights into enhancing the vitality of CTHBs, there remains a notable lack of research on how to systematically characterize and evaluate their brand image, particularly in ways that capture its multidimensional features. As a crucial bridge linking consumer cognition and emotion, brand image plays an irreplaceable role in strengthening the market competitiveness of CTHBs [4]. An accurate deconstruction of this image is a prerequisite for the success of any revitalization strategy. This study, therefore, aims to fill this gap by exploring how emerging computational methods can be used to mine the brand image of CTHBs from UGC data, thereby providing an empirical foundation for their modernization.

2.2. Brand Image

As a critical component of brand management, the concept of brand image has evolved from a broad notion into a multidimensional cognitive model. The earliest systematic discussion can be traced back to Gardner and Levy’s seminal article in 1955, where they keenly observed that consumers purchase brands not only for their physical attributes or functional performance, but also for their “social and psychological nature” [42]. This perspective shifted the focus from products per se to consumers’ perceptions of them. By the 1990s, with the systematic contributions of scholars such as Aaker and Keller [43,44], brand image was defined as the set of brand associations held by consumers, organized and stored in memory in multilayered and multidimensional ways.
Building on the consensus that brand image represents a network of multidimensional associations, scholars have proposed various deconstructive frameworks. Among these, the three-dimensional framework dividing brand image into functional, experiential, and symbolic dimensions has gained wide acceptance in marketing research due to its conceptual clarity and explanatory power [5,45,46]. This framework not only delineates the different pathways through which brands satisfy consumer needs at multiple levels, but also provides a robust theoretical foundation for analyzing the complex case of time-honored restaurants in this study.
To evaluate brand performance across these dimensions, researchers have developed a wide range of traditional assessment methods, which can be broadly categorized into qualitative and quantitative approaches [9]. Qualitative methods, such as in-depth interviews, focus groups, and free association techniques, excel in exploring and generating deeper layers of brand associations and emotions. For instance, Persson [47] identified six dimensions of B2B brand image by interviewing 12 corporate purchasing decision-makers. Brečić et al. [48] used 12 focus groups to discover that the same brand had a significantly different image in its home market compared to foreign markets. Quantitative methods, including Likert scaling, semantic differential scaling, free-choice technique, and dichotomous scaling, are widely used to measure, evaluate, and compare the strength and importance of known brand attributes and associations. For example, Grohs et al. [49] used semantic differential scales to rate sponsor brand image in event sponsorship settings. In a different study, Singh et al. [50] used Likert scales in surveys at national parks in the U.S., South Korea, and India. They measured visitors’ perceptions of the parks’ functional, symbolic, and experiential images, revealing how these perceptions influence revisit intentions through mechanisms moderated by national culture.
However, in the era of big data, these traditional methods have inherent limitations. First, their small sample sizes often lack representativeness. Second, the design of structured questionnaires can impose a preconceived framework, which may restrict the spontaneous and authentic expression of consumer thoughts. Finally, these methods are static and conducted infrequently, making it difficult to capture the dynamic evolution of brand image over time. These limitations highlight an urgent need for new approaches that can process large-scale, unstructured, and spontaneous consumer feedback.

2.3. Application of UGC Data in Brand Image Research

With the widespread adoption of Web 2.0, UGC has emerged as a crucial data source for capturing consumers’ authentic experiences and emotions, significantly enriching the perspectives of brand image research. eWOM derived from UGC platforms such as Dianping, Yelp, and TripAdvisor provides a valuable empirical foundation for examining consumers’ perceptions of brand attributes, service experiences, and emotional associations [51,52,53,54].
However, the scale and unstructured nature of UGC data present analytical challenges. Researchers have largely employed methods from Natural Language Processing (NLP) and text mining. The evolution of these methods reveals a progressive deepening of analytical capabilities but also highlights persistent gaps [55]. We can classify the development of these analytical techniques into three stages.
The first stage is macro level analysis using dictionaries and traditional topic models. For instance, Park et al. [56] used UGC data from TripAdvisor, adopted a structural topic model (STM) to uncover the most salient and memorable attributes of green restaurants. Their findings revealed that food-related green practices were more frequently mentioned and positively recalled than environmental practices. Similarly, Kim et al. [57] combined Latent Dirichlet Allocation (LDA) topic modeling with the sentiment analysis tool VADER on 110,000 Yelp hotel reviews. They discovered that service attributes had a varying impact on satisfaction across different brand tiers. A key limitation of these methods is their shallow semantic understanding. They struggle with complex, context-dependent meanings, and the results are often just collections of words, leading to a coarse level of analysis.
The second stage is fine-grained analysis using supervised deep learning. This phase is characterized by Transformer-based models like BERT, which can capture context and identify sentiment at a more detailed level [58]. Studies have combined UGC with ABSA to identify core dimensions of the dining experience, such as food, value, service, and ambiance [59,60,61]. This represented a significant leap from sentence-level to aspect-level analysis. However, this approach has a clear bottleneck: a heavy reliance on expensive, manually annotated data. Creating high quality labeled datasets for specific domains is costly and time-consuming, and the resulting models have poor transferability to new scenarios [62].
The third stage is few-shot information extraction using LLMs. LLMs like the GPT series offer a new path to overcome the limitations of previous methods [27]. Their primary advantage is an exceptional zero-shot learning ability, allowing researchers to guide them through various NLP tasks using only prompt engineering, without model fine-tuning [24,25]. This has already shown potential in marketing research [63,64,65]. LLMs also demonstrate a superior understanding of complex sentences and domain-specific terms, yielding more precise results. This significantly lowers the barrier to conducting large-scale, high-accuracy ABSA in specialized fields.
In summary, while past research has used UGC and NLP to explore brand image, most studies remain in the first two technological stages and have not fully leveraged the potential of LLMs. A specific gap exists in developing an analytical framework that combines the advanced capabilities of LLMs with classic brand theory, tailored to the unique attributes of CTHBs. To fill this gap, our study constructs a brand image framework based on the functional, experiential, and symbolic dimensions. Using an LLM, we perform a detailed ABSA on online reviews of Beijing’s time-honored restaurants. This framework aims to enrich the research on CTHBs’ brand image and provide data-driven support for brand management, facilitating the modernization and sustainable growth of heritage brands.

3. Materials and Methods

3.1. Research Framework

This study establishes an LLM-driven research framework (Figure 1) to investigate the brand image of CTHBs in the catering industry.
First, a large volume of consumer reviews from China’s Dianping platform was programmatically collected via its API, followed by rigorous data cleaning and filtering to ensure analytical accuracy. To extract structured insights from these reviews, we employed ABSA method, which utilizes the Qwen3-32B open-source LLM and implements structured information extraction from review texts through prompt engineering. The framework focuses on three core dimensions of brand image: functional (Food, Price, Location), experiential (Service, Environment, Queue), and symbolic (Culture). To quantify sentiment tendencies, we calculated the Net Sentiment Score (NSS) for each dimension of the brands and performed K-Means clustering based on these scores. On the basis of the clustering results, we applied the BERTopic topic model to the opinion words extracted from typical brands, aiming to reveal the specific topics that consumers care about behind each brand’s aspects, providing a more detailed perspective on consumer attitudes.

3.2. Data Sources and Preprocessing

The data for this study were obtained from Dianping (dianping.com), China’s leading local life service platform, which functions similarly to Yelp or TripAdvisor and serves as a critical data source for studying urban consumption behavior in China [66]. The platform aggregates extensive merchant information and hosts an active user community, where consumer reviews and star ratings form a rich repository of eWOM that reflects authentic experiences and satisfaction levels [14,67]. Due to its vast data scale, detailed textual content, and significant influence on consumer decision-making, Dianping is a highly reliable data source for assessing market reputation and brand image in the restaurant industry.
Based on the official directory of CTHBs released by the Ministry of Commerce, we used the official API to collect all reviews of relevant brands in Beijing between 1 January 2016, and 31 March 2021. The initial dataset covered 54 brands and 432 restaurants, totaling 603,668 reviews, including attributes such as restaurant ID, name, address, per capita spending, review text, star rating, sub-dimension ratings (taste, environment, service), and timestamps. To ensure data quality, we removed empty reviews and duplicates, and excluded restaurants with insufficient review volume, retaining only those with at least one review every month during the study period. The final dataset comprised 42 brands, 399 restaurants, and 570,357 reviews.

3.3. Aspect Selection and Dimension Mapping

To construct a comprehensive brand image model, this study adopted the Functional–Experiential–Symbolic (F–E–S) framework [5]. Based on a systematic review of relevant studies in the restaurant sector [10,68] and an exploratory analysis of our dataset, we identified eight aspects that comprehensively capture consumer perceptions of time-honored restaurants: Food, Service, Price, Location, Environment, Queue, Culture, and Others.
For theoretical analysis and subsequent quantification, we mapped the seven identified aspects onto the three core brand image dimensions based on the empirical findings and theoretical logic of existing research, as shown in Table 1.
Additionally, we established Others aspect to avoid forcing scattered or ambiguous comments not directly relevant to brand image assessment into the framework. This is a common practice in ABSA and related research [76,77], as it effectively filters out noise and ensures the focus and validity of the final dataset used for brand image modeling.

3.4. ABSA

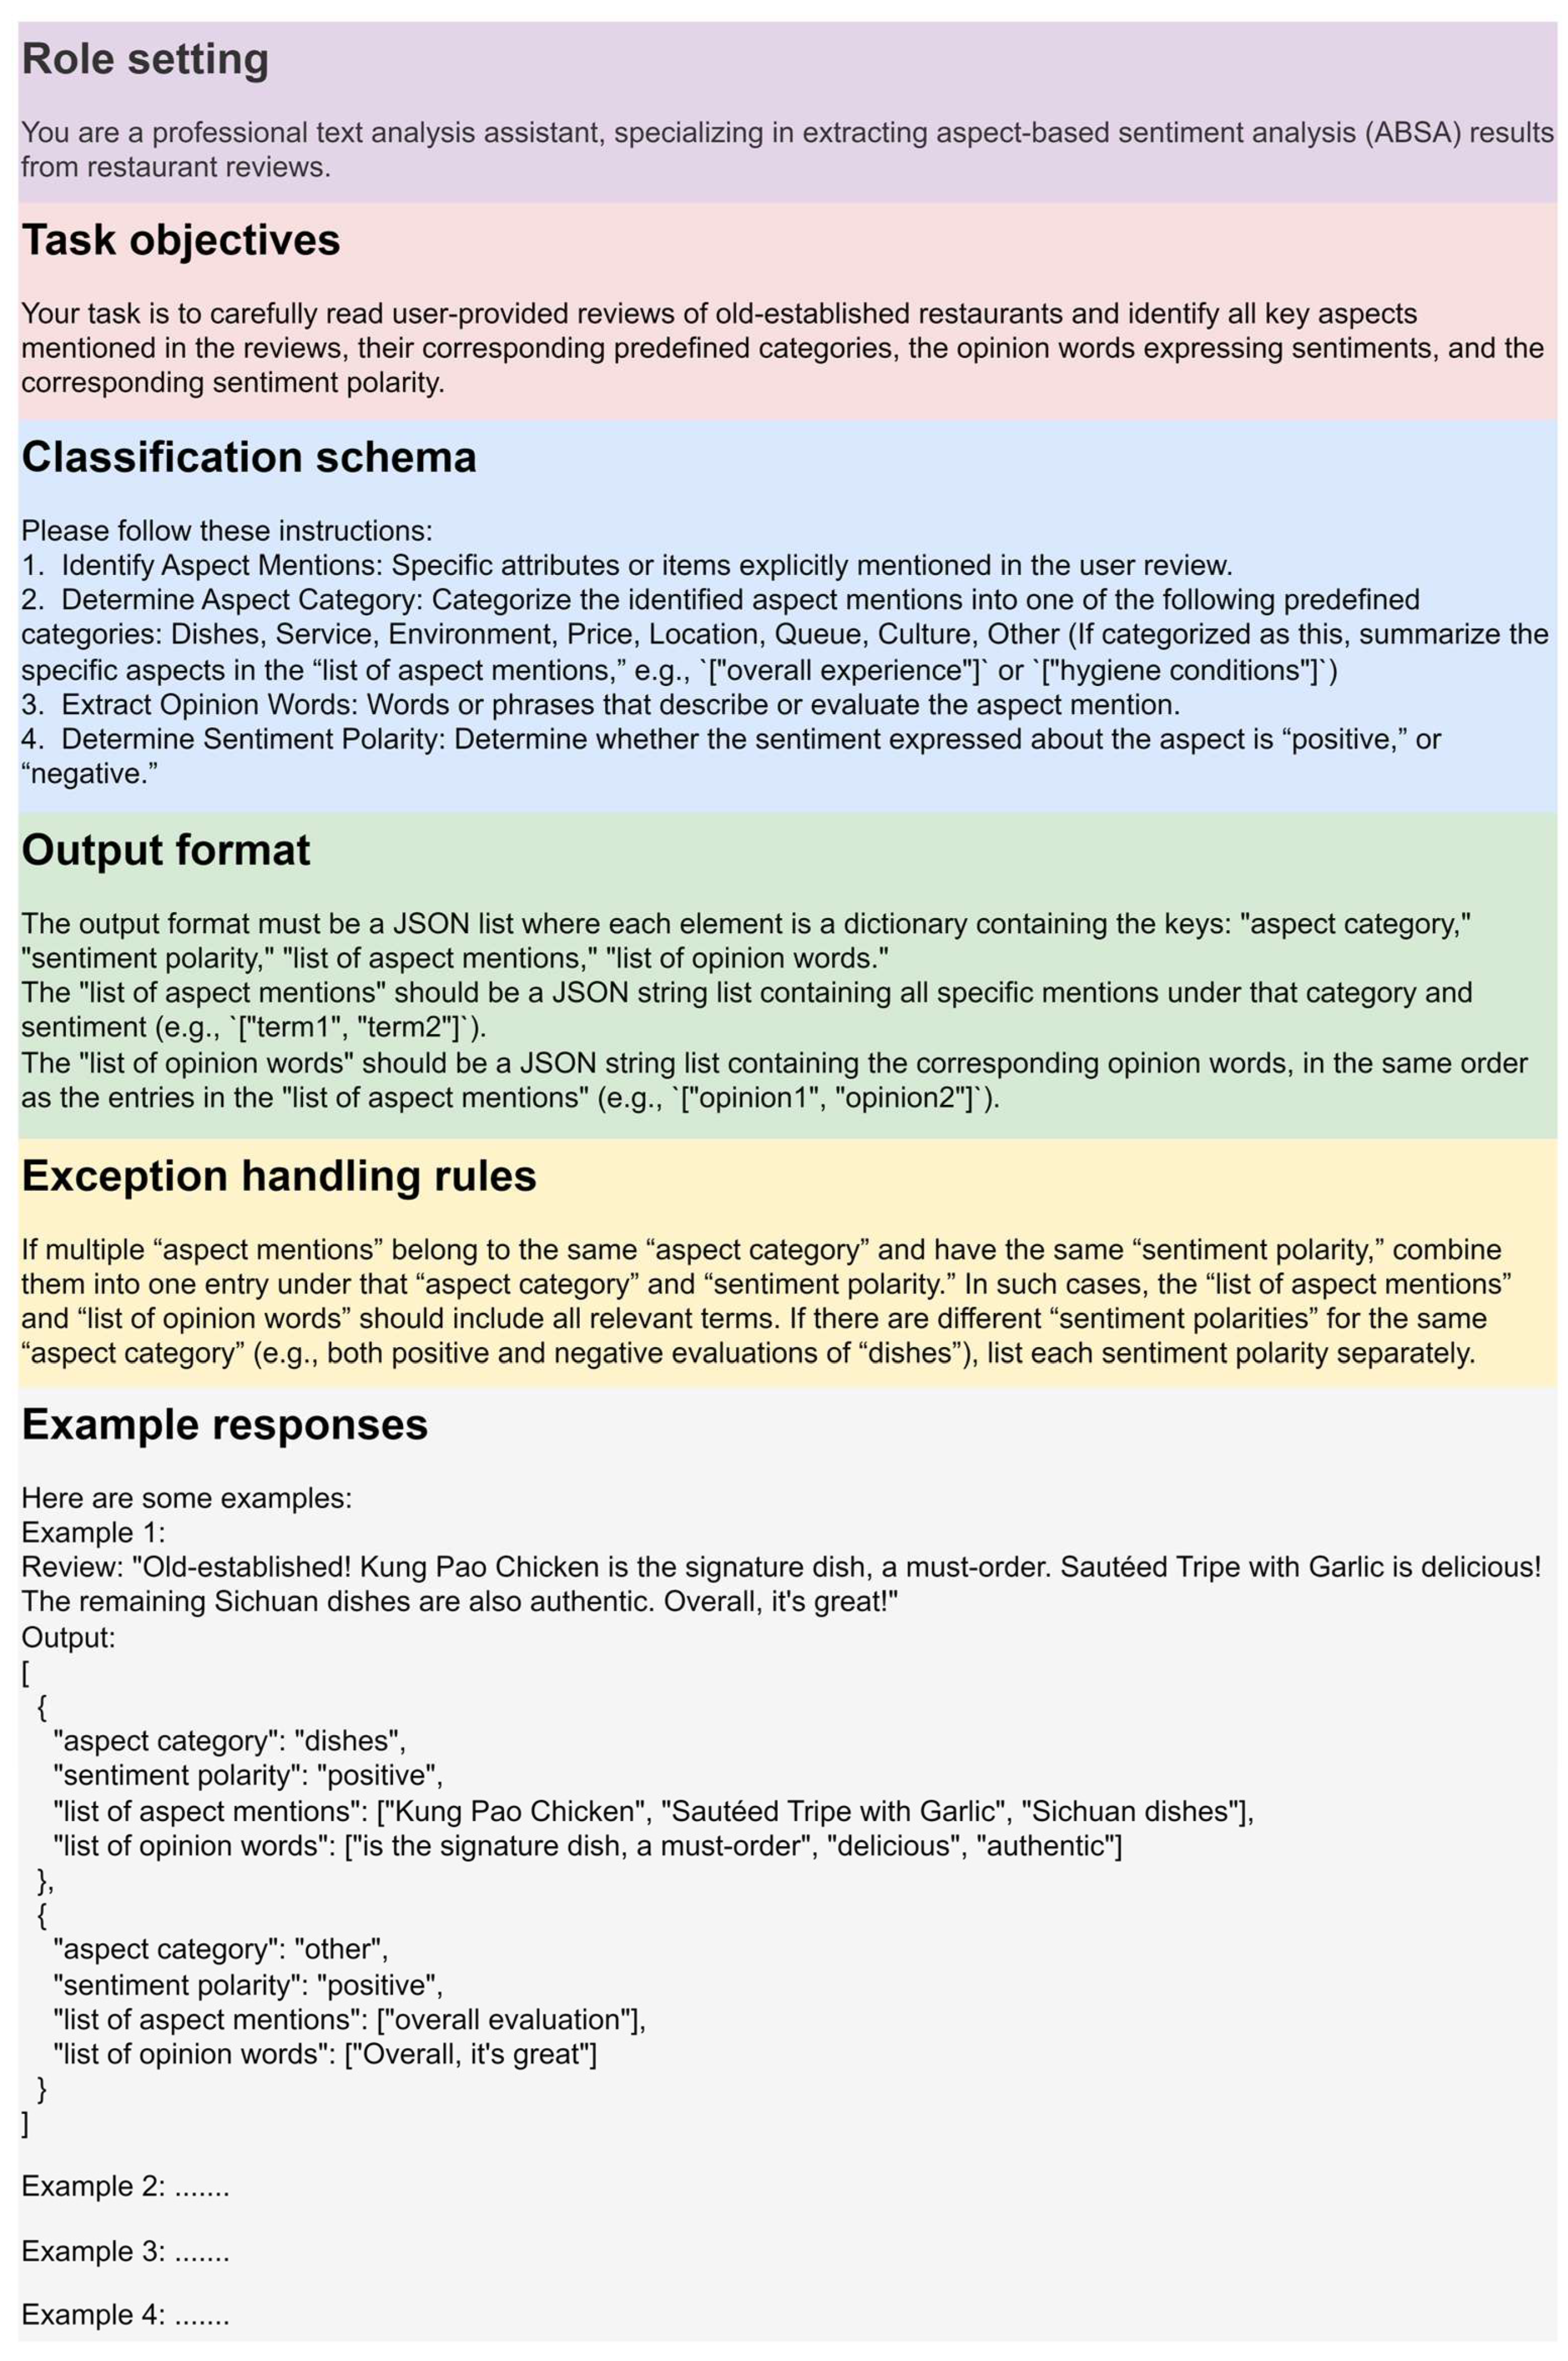
To quantify brand image at a fine-grained level, this study employed the open-source LLM Qwen3-32B [78], which demonstrates strong performance in Chinese language understanding and instruction following, to conduct ABSA. To ensure stable and reproducible results, the model’s temperature parameter was set to 0. The LLM’s strong zero-shot and few-shot learning capabilities allow it to identify aspects and sentiments directly from instructions, bypassing the costly manual annotation and model fine-tuning required by traditional methods. Furthermore, it can directly output structured JSON data, significantly reducing post-processing efforts.
We designed prompts through prompt engineering [79] to guide the model in performing ABSA tasks. The detailed prompt design, specific prompts, and computational environment are provided in Appendix A. During validation, we randomly sampled 200 reviews and had three volunteers independently annotate them. Discrepancies were resolved by introducing a fourth expert annotator, whose judgment determined the final ground truth. Using this validation set, the model achieved a precision of 0.874, a recall of 0.883, and an F1-score of 0.878, demonstrating the model’s effectiveness in executing the ABSA task.

3.5. Quantifying Brand Image Dimension Scores

After extracting structured aspect–sentiment data with the LLM and completing the mapping to corresponding dimensions, we further quantified the brand image of each time-honored restaurant across the three core dimensions. First, sentiment polarity data were aggregated at the brand level: for each brand, we calculated the total number of positive and negative mentions of each aspect throughout the study period. Then, a standardized Net Sentiment Score (NSS) [80,81] was computed for each dimension as the brand’s image score. The calculation is as follows:
S c o r e dimension , b = a D   P o s a , b N e g a , b a D   P o s a , b + N e g a , b  
where S c o r e dimension , b denotes the final image score of brand b on a given dimension (functional, experiential, or symbolic). D represents the set of aspects mapped to that dimension (e.g., D = {Food, Price, Location} for functional); P o s a , b and N e g a , b indicate the total number of positive and negative mentions, respectively, of aspect a for brand b . The score ranges from [−1, 1]: a positive value indicates that consumer perceptions are predominantly positive, whereas a negative value suggests a dominance of negative perceptions.

3.6. Identifying Brand Image Types via Clustering Analysis

K-means clustering is one of the most widely used partition-based methods in market research and data mining [82]. A central challenge in this analysis is determining the optimal number of clusters (K), as a single metric is often insufficient for a reliable judgment. Therefore, this study adopted a multi-criteria decision process to determine K and evaluate the robustness of the results.
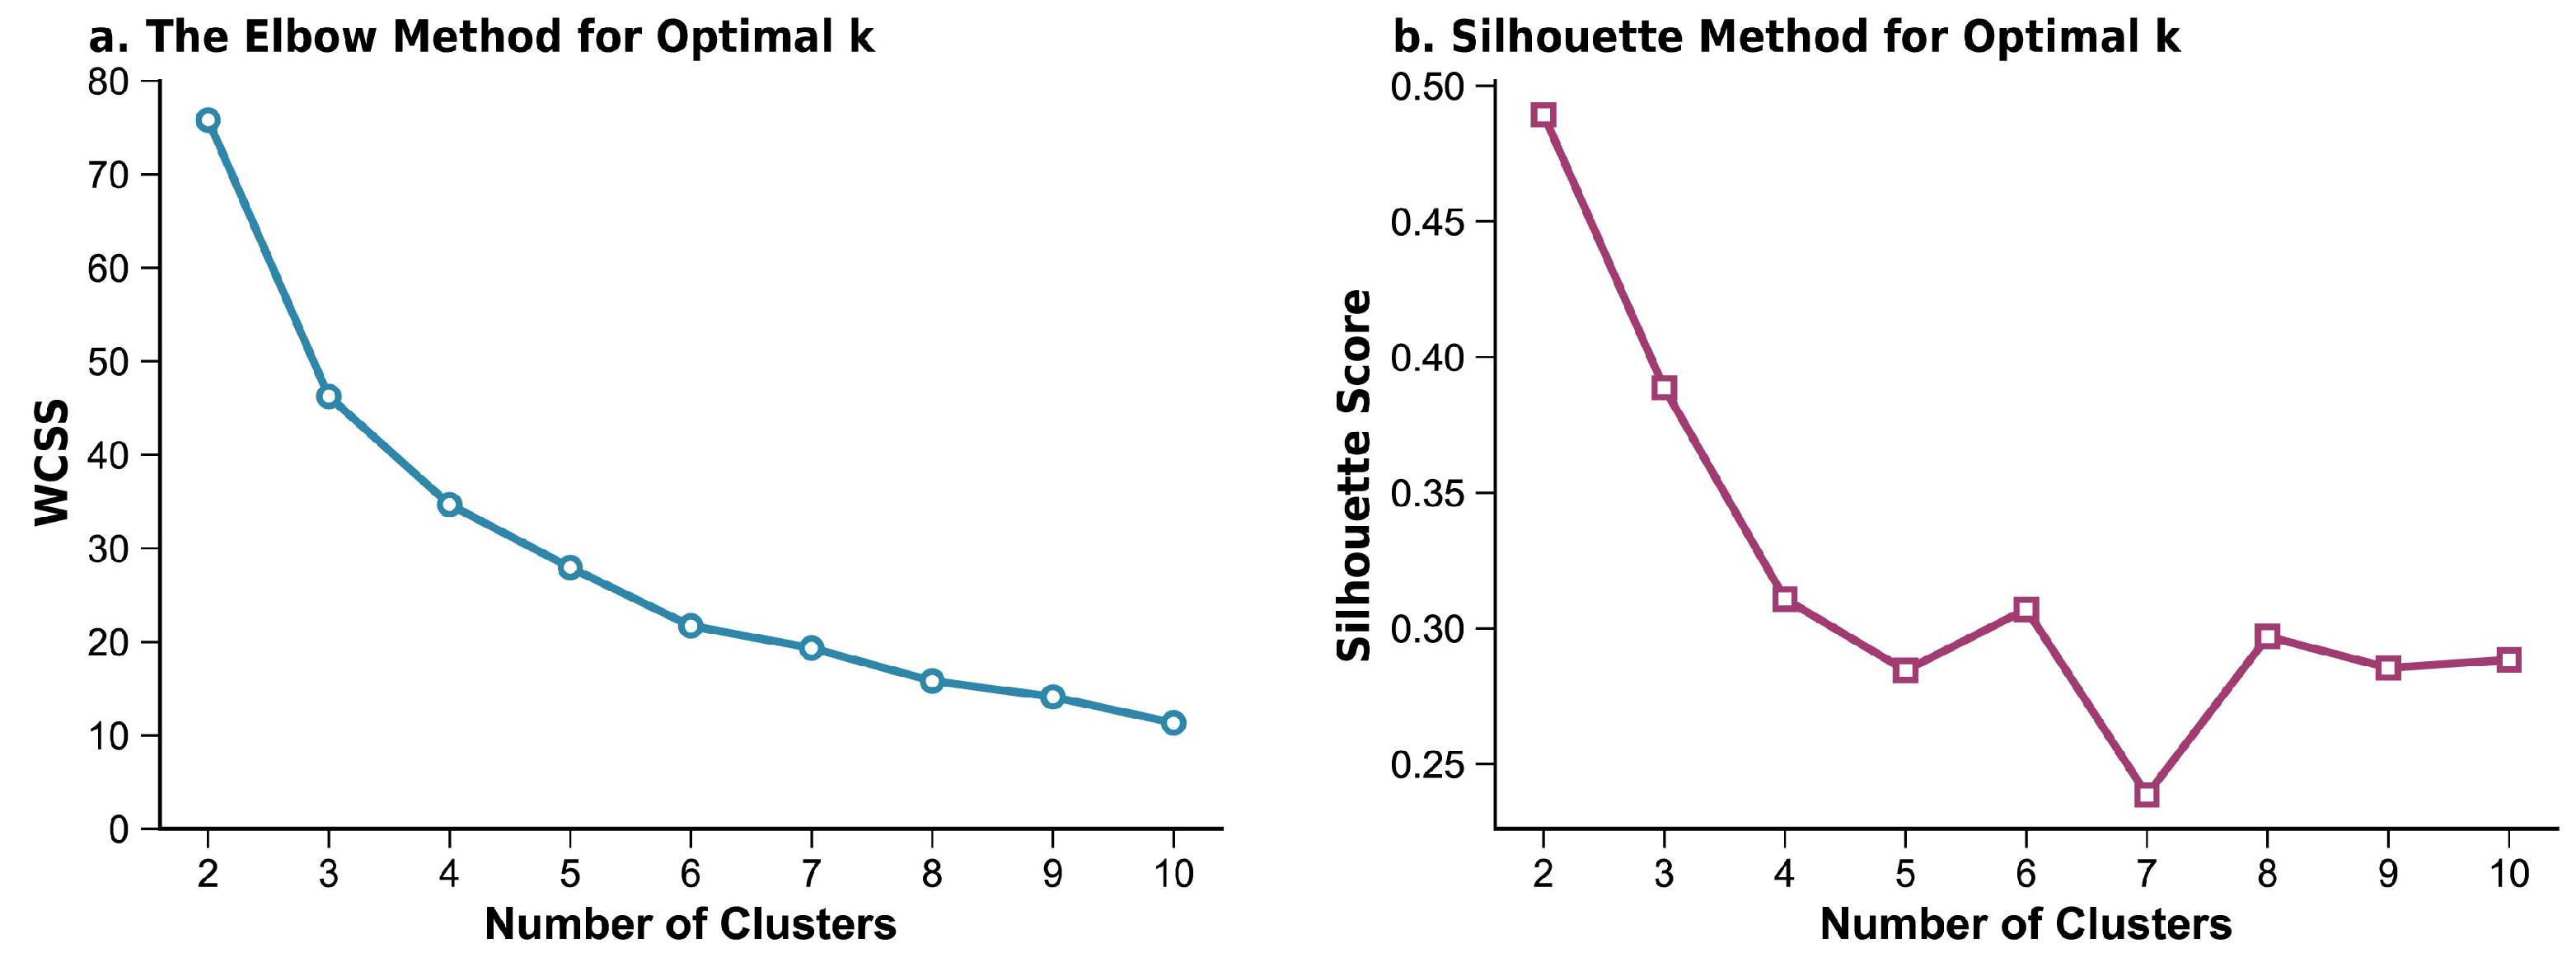
First, we explored two complementary and commonly used metrics. The Elbow Method seeks the optimal grouping by iteratively minimizing the Within-Cluster Sum of Squares (WCSS) to find an elbow point. Concurrently, we calculated the Silhouette Score, an index that assesses both the cohesion and separation of clusters, where a higher score indicates better clustering quality.
The formula for the WCSS is:
WCSS = k = 1 K   x i C k   x i μ k 2  
where C k is the set of samples in cluster k , and μ k is its centroid.
The formula for the average Silhouette Score is:
s i = b i a i max a i , b i
where a i is the average distance between sample i and all other samples in the same cluster, and b ( i ) is the average distance between sample i and samples in the nearest neighboring cluster. A silhouette coefficient closer to 1 indicates a better clustering result.
After preliminarily identifying candidate values for K, we will use a one-way analysis of variance (ANOVA) to test whether there are statistically significant differences among the clusters in their functional, experiential, and symbolic dimension scores. An effective clustering solution must produce groups that are distinct on these key dimensions.

3.7. BERTopic for Topic Modeling

BERTopic is a topic modeling technique based on deep semantic embeddings, which leverages contextual representations generated by pre-trained language models such as BERT and applies class-based TF-IDF (c-TF-IDF) to measure the importance of terms within clusters, thereby achieving more precise topic representation [83]. Compared with traditional LDA, BERTopic is more effective at capturing semantic nuances and latent structures in short texts, offering clear advantages in semantic aggregation and interpretability [84,85].
In this study, BERTopic was applied to the opinion word lists extracted from ABSA. Specifically, we focused on representative brands identified in the clustering analysis and conducted topic modeling of consumer opinions across different aspects. This approach further revealed specific strengths and weaknesses within each dimension, thereby supporting more refined brand diagnostics.

4. Results

4.1. Descriptive Statistics

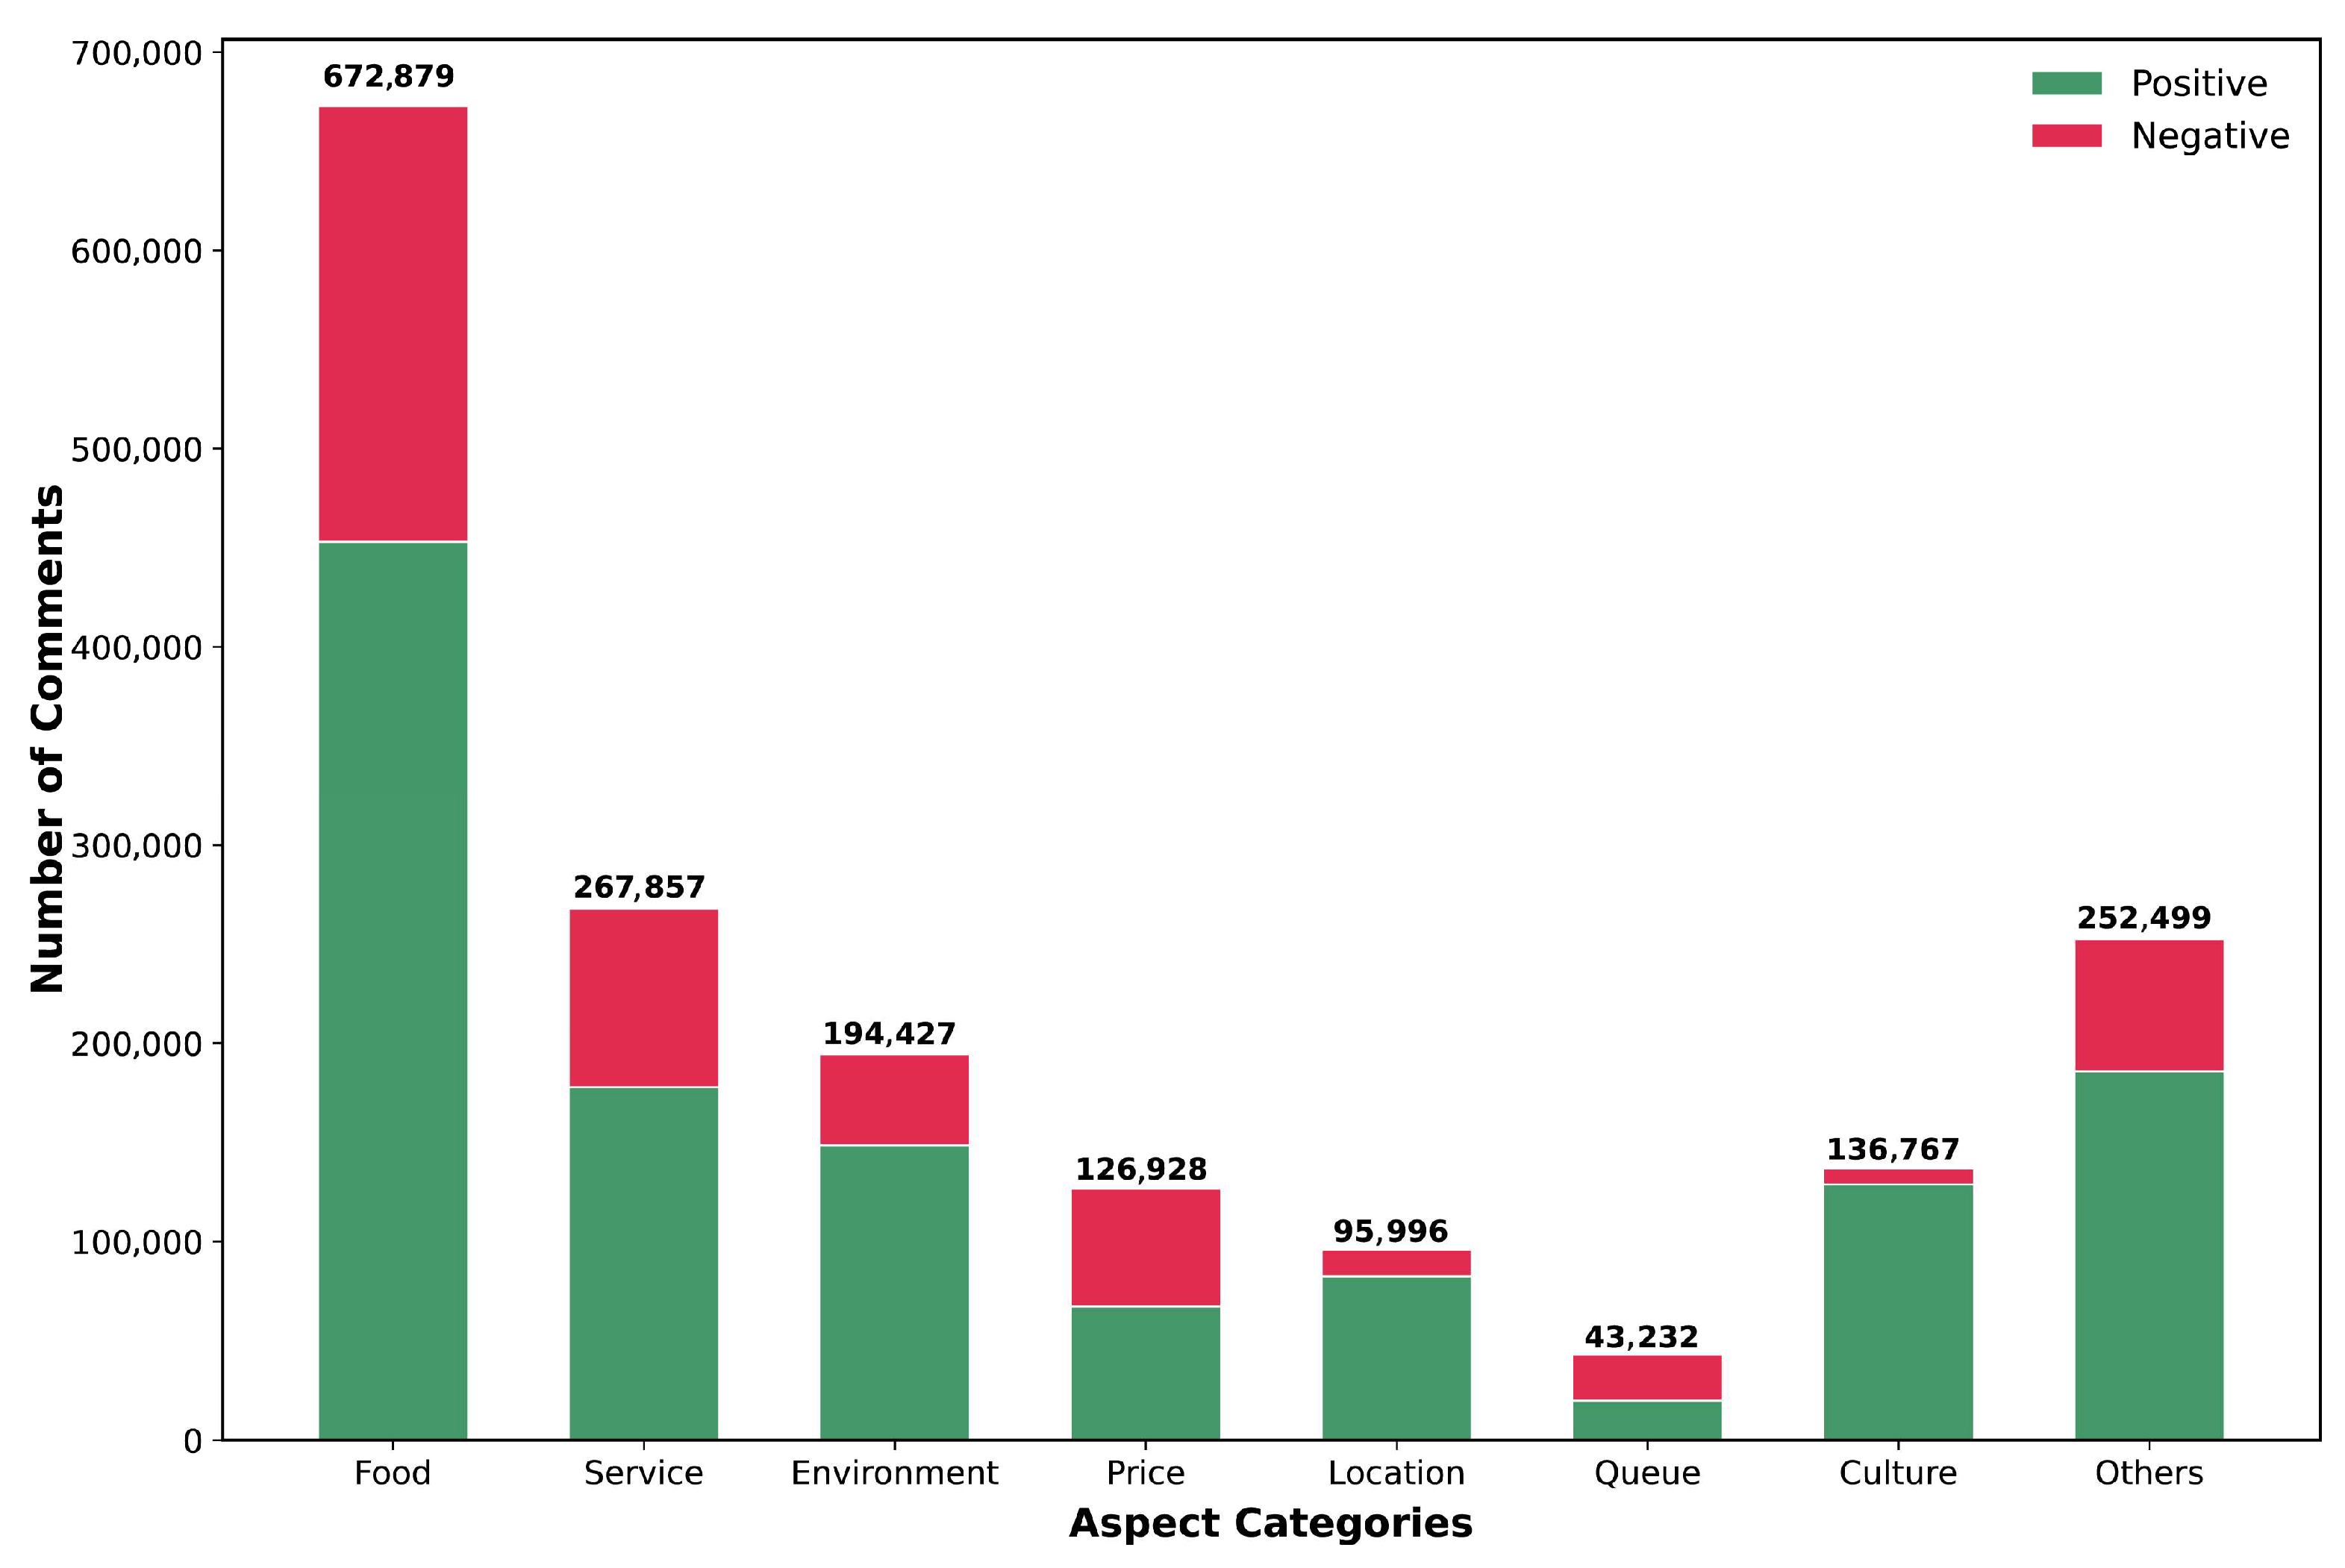
Using LLMs for aspect identification and sentiment analysis, this study categorized consumer reviews into aspect-based groups, with the distribution of review counts and sentiment polarities illustrated in Figure 2. In terms of absolute frequency, significant differences emerged in consumer attention across aspects. Food attracted the greatest volume of discussion, with 672,879 related reviews, far exceeding all other aspects. This was followed by Service (267,857) and Others (252,499). By contrast, Location and Queue received relatively little attention, with Queue being the least-discussed aspect overall.
From a sentiment perspective, consumer evaluations of Beijing’s time-honored restaurants were generally positive. The Culture aspect received the highest proportion of positive feedback at 94.18%. Location and Environment also received positive reviews from the majority of consumers, suggesting that convenient accessibility and distinctive dining atmospheres constitute major strengths. In contrast, Queue was the only aspect where negative sentiment outweighed positive sentiment, with a negative proportion of 53.98%, highlighting long waiting times as a key pain point undermining the dining experience. Furthermore, although Food and Service—the two most central aspects—were predominantly positively evaluated, they also received substantial negative feedback, accounting for 32.67% and 33.62%, respectively, indicating notable room for improvement in these core areas.
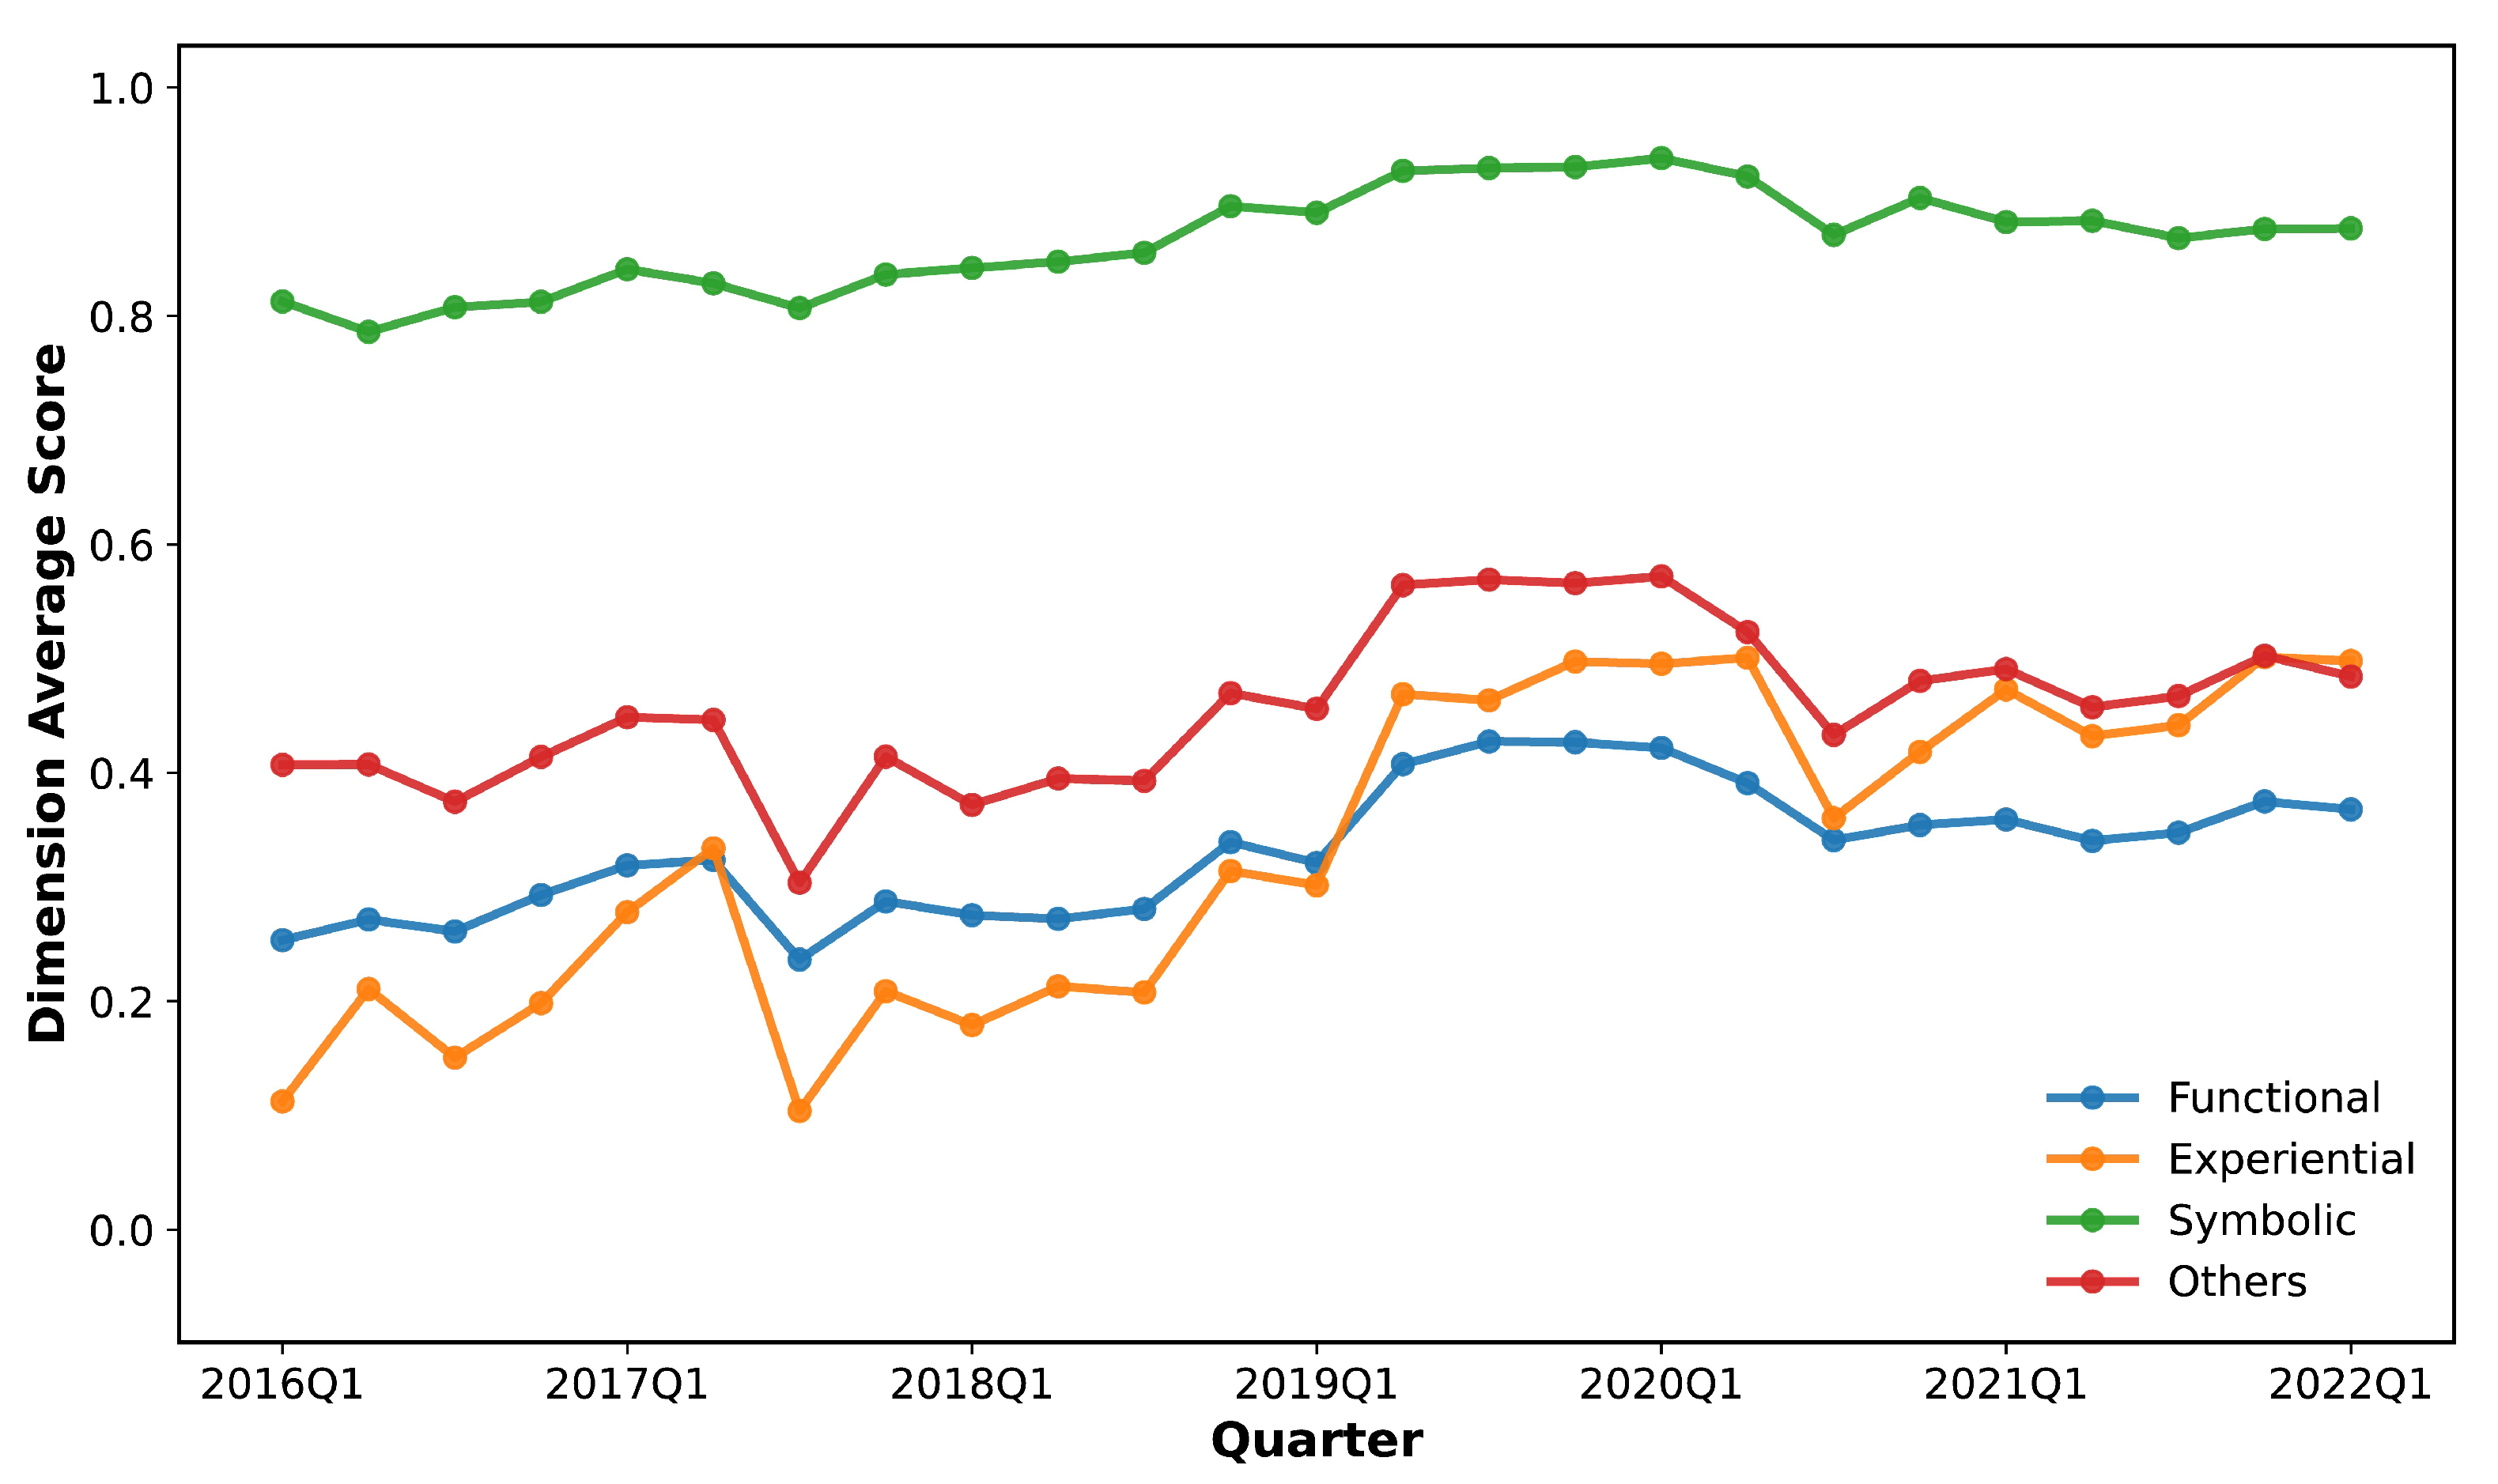
To further explore the dynamic evolution of consumer perceptions of brand image, we computed quarterly average scores for each dimension from 2016 Q1 to 2022 Q1, as shown in Figure 3.
To further explore the dynamic evolution of consumer perceptions of brand image, we computed quarterly average scores for each dimension from 2016 Q1 to 2022 Q1, as shown in Figure 3. Overall, the six-year trends reveal a clear hierarchical structure across dimensions. The Symbolic dimension consistently achieved the highest and most stable scores, with minimal fluctuations and sustained positivity. This persistent strength underscores that cultural and historical value remains the most stable and highly recognized core asset of time-honored brands. In contrast, the Functional and Experiential dimensions exhibited lower and more volatile scores. Both dimensions displayed an upward trajectory from 2016, peaking in late 2019 and early 2020. This suggests that prior to the COVID-19 outbreak, consumer perceptions of restaurant operations (e.g., Food, Price) and customer-facing experiences (e.g., Service, Environment) were in a phase of notable improvement. Around 2020 Q2, however, scores across the Functional, Experiential, and Other dimensions experienced a sharp and simultaneous decline. This downturn coincided with the severe disruptions caused by the COVID-19 pandemic in the restaurant industry, reflecting consumer dissatisfaction linked to changes in service modes, operational restrictions, and safety concerns. The ability of our analytical framework to capture this exogenous shock demonstrates its sensitivity and reliability. Following this trough, scores across these dimensions rebounded and stabilized but did not fully recover to their pre-pandemic peaks, instead entering a new equilibrium.
It is also noteworthy that at the beginning of the study period, the Experiential dimension generally scored lower than the Functional dimension. However, its growth momentum proved stronger over time, and from 2019 onward it consistently surpassed Functional scores. This shift indicates that consumers have increasingly prioritized dining experiences in time-honored restaurants, and that improvements in this domain have gradually gained consumer recognition.

4.2. Clustering Results Analysis

4.2.1. Determination of the Optimal K

To identify the most appropriate number of clusters, this study employed both the elbow method and the silhouette coefficient. As shown in Figure 4, the WCSS curve in Figure 4a exhibits a clear “elbow” between K = 3 and K = 4, suggesting that this range might be reasonable. However, further examination of Figure 4b reveals that the silhouette coefficient reaches its maximum at K = 2, indicating that two clusters yield the most distinct and well-separated grouping.
The results of ANOVA show that only when K = 2 do all three dimensions exhibit highly significant differences (p < 0.001), with effect sizes (η2) of 0.31, 0.46, and 0.35, respectively, all within the large effect range. This indicates that the two-cluster solution effectively distinguishes the groups. In contrast, for the K = 3 solution, one of the clusters had a sample size that was too small, failing to meet the prerequisites for ANOVA.
Based on a comprehensive review of the Elbow Method’s inflection point, the cluster validity metrics, and the post hoc significance tests, we selected K = 2 as the optimal number of clusters. This choice ensures both cluster compactness and significant differentiation while maintaining a simple and interpretable model structure.

4.2.2. Cluster Characteristics of CTHBs Restaurants

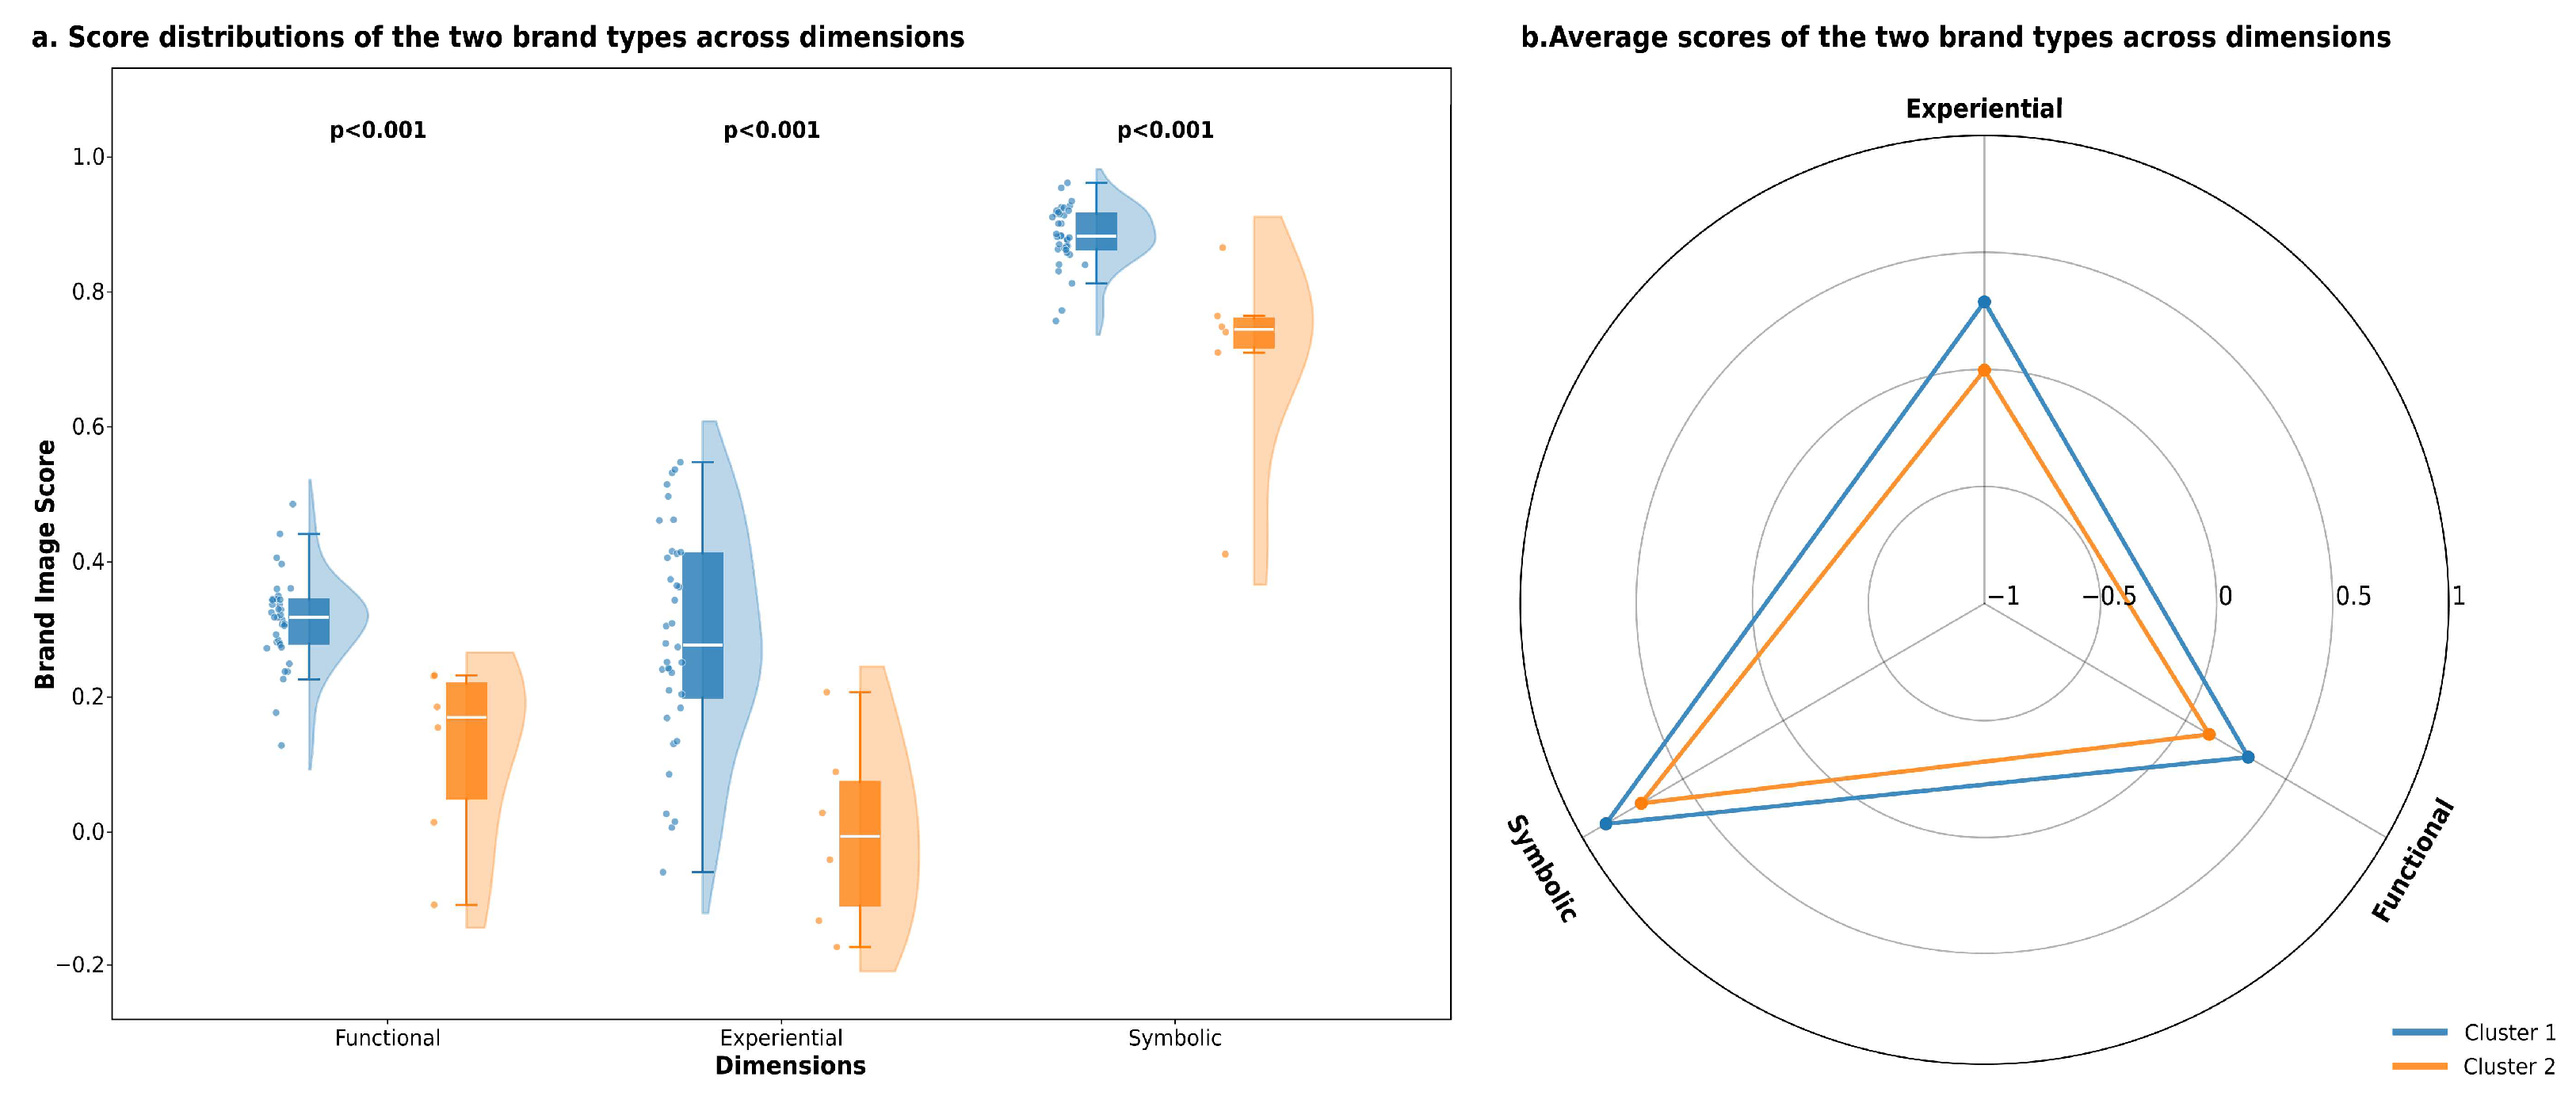
The clustering analysis divided the 42 CTHBs into two distinct groups. As shown in Figure 5, there are clear and significant differences in performance characteristics between the two clusters. Cluster 1 consistently outperformed Cluster 2 across all dimensions. This observation was statistically confirmed by the significance tests, which showed that the differences for each dimension were highly significant.
The clusters can be characterized as follows:
  • Cluster 1: Comprehensive Performers (n = 36).
This larger cluster, comprising 36 restaurants, represents the mainstream image of Beijing’s time-honored brands. The average scores across all dimensions exceed the overall sample mean, suggesting that these restaurants have successfully maintained a balanced and positive brand image. They perform well not only in symbolic cultural capital but also in functional and experiential dimensions, thereby meeting general consumer expectations.
  • Cluster 2: Heritage Strugglers (n = 6).
This smaller cluster includes six restaurants with significantly weaker brand images across all dimensions. Their scores fall well below the sample average, with the experiential dimension even registering a negative score (−0.0032). This points to critical deficiencies in service quality, dining environment, and customer flow management. The functional dimension also performs poorly (0.1184), reflecting issues related to Food, Price, or Location. Although the symbolic dimension score (0.7069) remains positive in absolute terms, it is far lower than that of Cluster 1, implying that even historical and cultural appeal is no longer sufficient or is being eroded by serious operational shortcomings. Figure 5b presents the mean dimensional scores of the two clusters.

4.3. Fine-Grained Diagnosis of Brand Image Based on Topic Modeling

Although the preceding clustering analysis successfully differentiated groups of brand images, dimensional sentiment scores alone are insufficient for brand managers seeking effective brand enhancement. To uncover the specific drivers of brand image and to identify the core “praise points” and “pain points” in consumer experiences, this study further employed BERTopic for topic modeling. We conducted in-depth topic extraction on positive and negative opinions for representative brands within each of the two image clusters identified in Section 4.2.
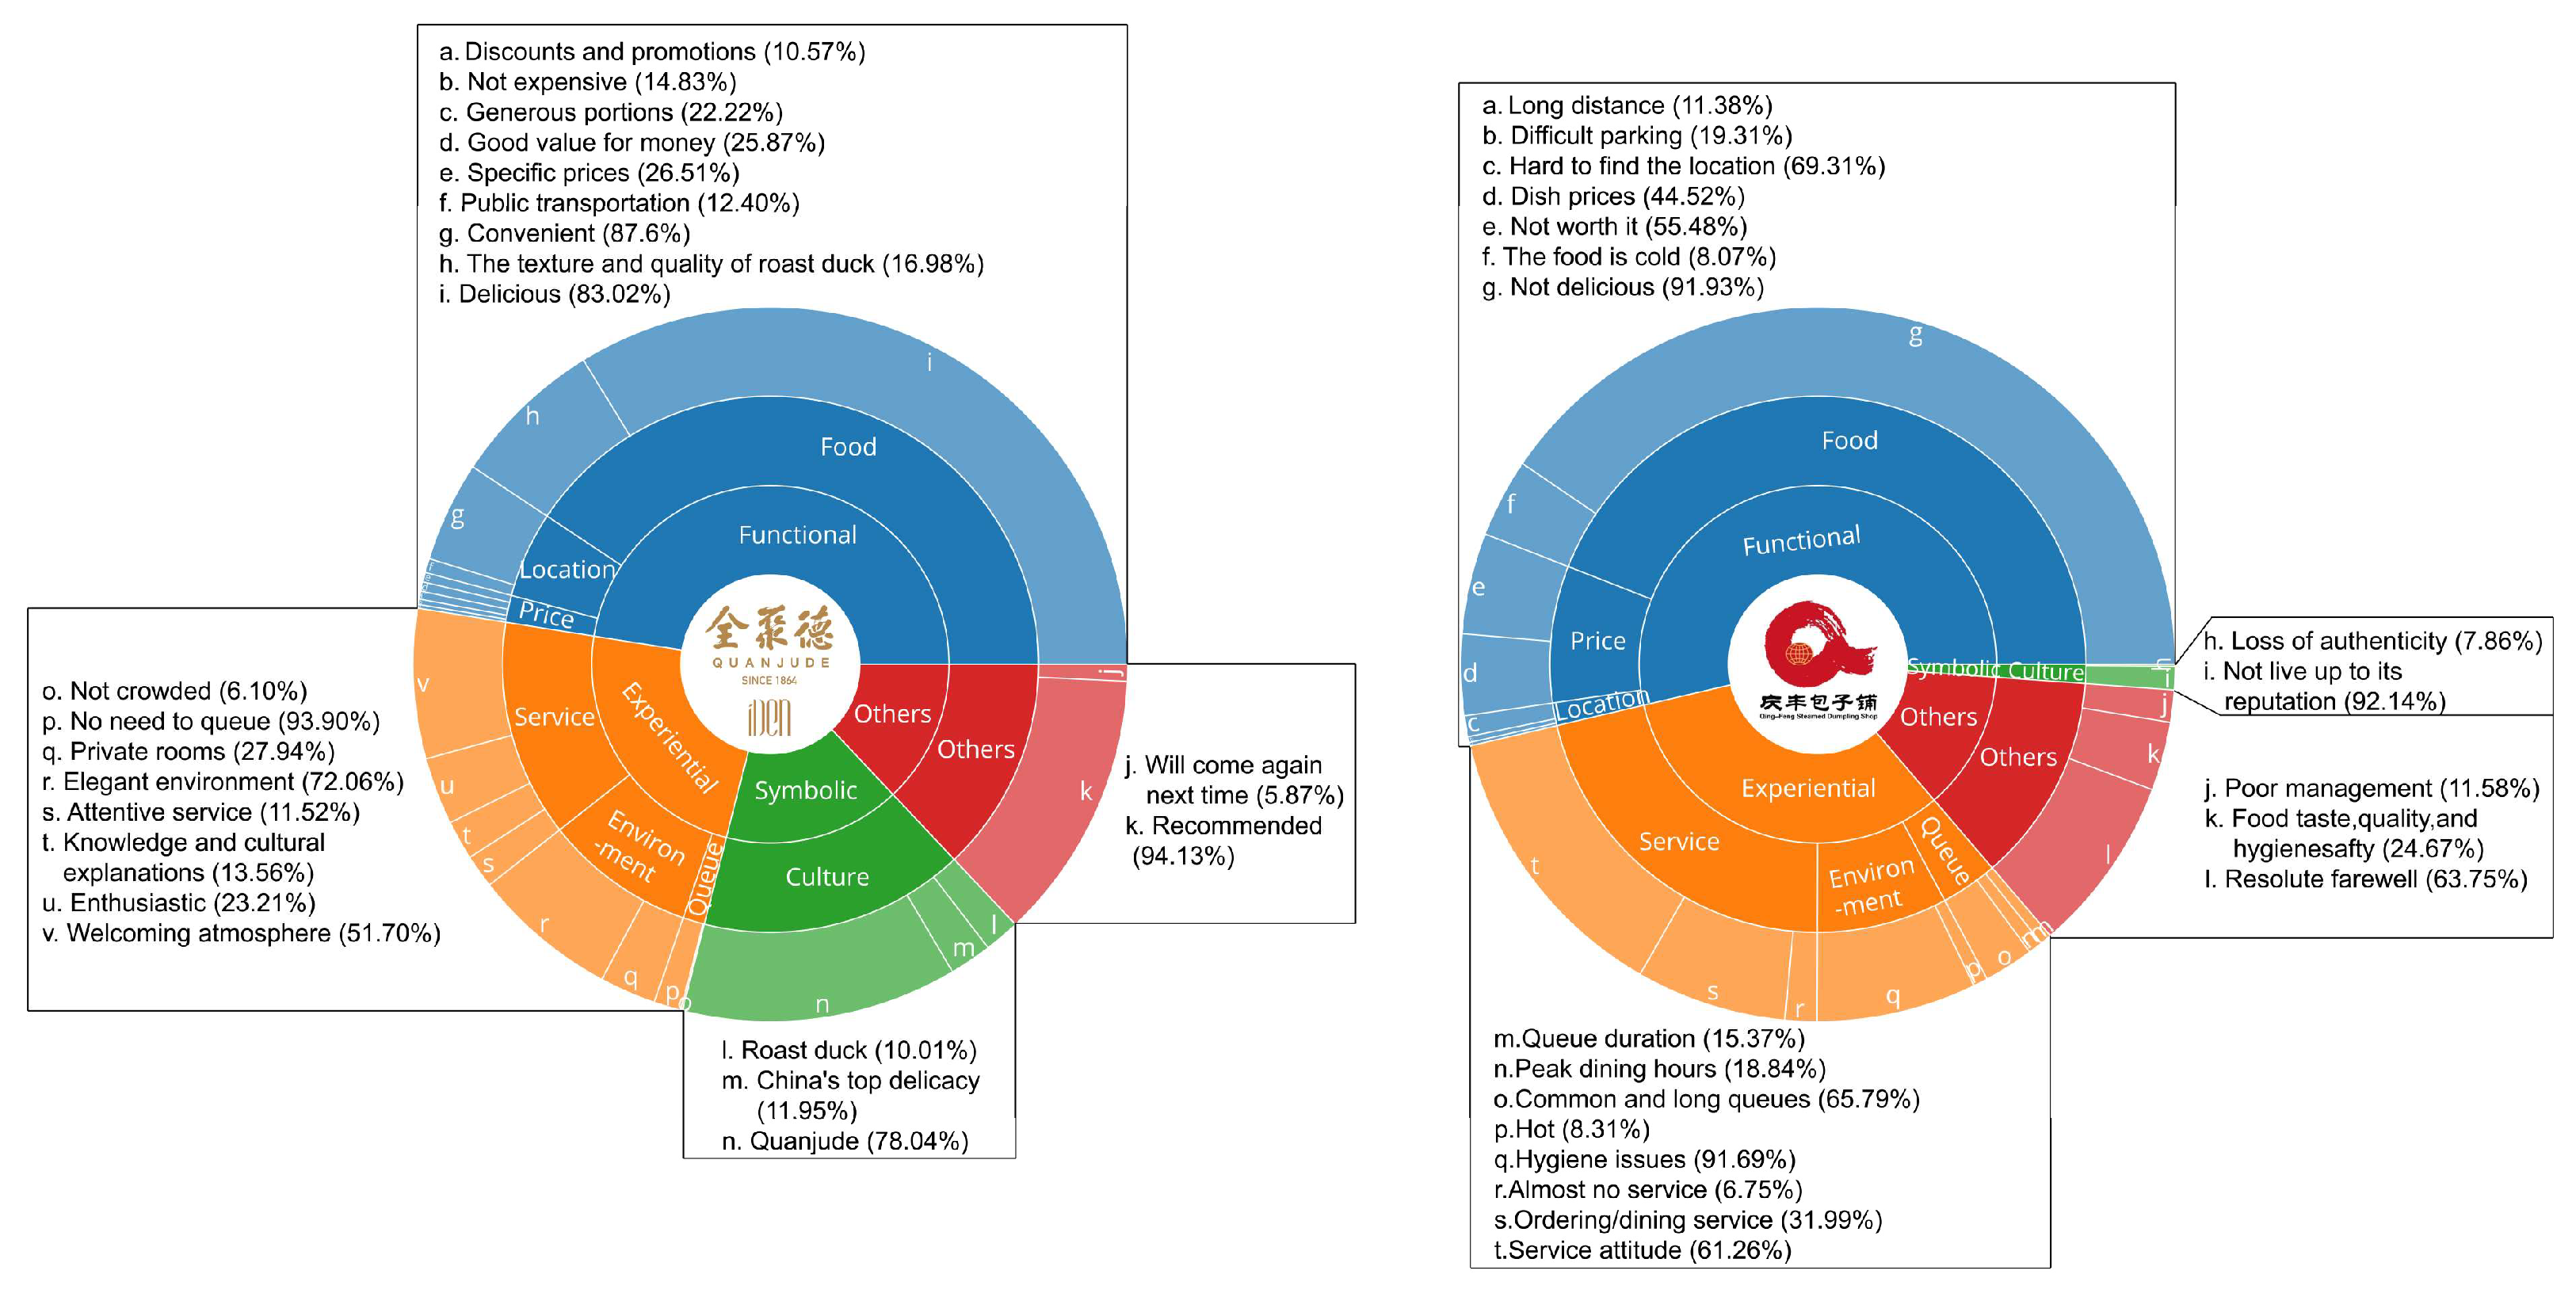
Specifically, we selected Quanjude from Cluster 1 (Comprehensive Performers) and analyzed positive opinions across all aspects to distill the critical elements underpinning its success. In contrast, we selected Qingfeng Stuffed Bun House from Cluster 2 (Heritage Strugglers) and analyzed negative opinions across all aspects to diagnose the fundamental causes of its brand image deterioration. The proportions of identified topics are shown in Figure 6.

4.3.1. Success Factors of Comprehensive Performers: The Case of Quanjude

In the Food aspect, consumer praise primarily centers on two topics. The first is a broad “delicious” topic (83.02%), with keywords such as “not greasy” and “melts in the mouth” reflecting strong approval of taste. The second is more specific “the texture and quality of roast duck” (16.98%), where “crispy duck skin” emerges as the most frequent compliment, highlighting the unique craftsmanship of the signature dish.
Service constitutes another major strength of Quanjude’s brand image, with positive evaluations spanning multiple layers. The most notable is the “welcoming atmosphere” (51.70%). Staff “enthusiasm” (23.21%) and “attentiveness” (11.52%) are also frequently emphasized. Of particular note is the distinctive topic of “knowledge and cultural explanations” (13.56%), where staff introduce the carving method and consumption rituals of roast duck. This not only enhances the dining experience but also strengthens the cultural dimension of the brand, skillfully integrating service with symbolic value.
In the Environment aspect, “elegant environment” (72.06%) dominates positive perceptions, with keywords such as “grand” and “luxurious” aligning with its positioning as a high-end dining venue. Positive evaluations of “private rooms” (27.94%) further suggest that spatial design meets diverse needs, from business banquets to family gatherings.
Although Quanjude is often perceived as expensive, its positive reviews reveal favorable pricing perceptions. Consumers highlighted “good value for money” (25.87%), “generous portions” (22.22%), and benefits from “discounts and promotions” (10.57%). This demonstrates that through thoughtful menu design and marketing initiatives, Quanjude has successfully managed consumer price expectations.
Additionally, convenience emerges as a strong advantage, with “convenient” (87.60%) and “no need to queue” (93.90%) jointly reducing decision-making and time costs. Lastly, regarding its cultural heritage, consumers proudly mentioned “Quanjude’s” status as a time-honored brand (78.04%) and its reputation as “China’s top delicacy” (11.95%), reflecting strong brand identity and cultural pride.

4.3.2. Diagnosing the Pain Points of “Heritage Strugglers”: The Case of Qingfeng Stuffed Bun House

In sharp contrast, the topic modeling of negative reviews for Qingfeng Stuffed Bun House highlights severe challenges rooted in failures of basic operations.
Food as the primary source of criticism. The overwhelming negative topic is “not delicious” (91.93%), with specific complaints such as “small fillings” and “greasy.” Another critical issue is “the food is cold” (8.07%), which seriously undermines product experience.
Service problems are equally pronounced. Consumers frequently complain about poor “service attitude” (61.26%), report disorder and neglect in “ordering/dining service” (31.99%), and even describe “almost no service” (6.75%). This lack of service stands in stark contrast to expectations of hospitality associated with time-honored brands.
Environmental feedback is dominated by “hygiene issues” (91.69%), with “dirty” being a common descriptor that exposes weak store management. Additionally, complaints about “hot” (8.31%) during summer due to “no air conditioning” further highlight neglect of basic customer comfort.
On pricing, the central negative perception is “not worth it” (55.48%), as consumers feel that the quality does not justify the price, often leaving them with a sense of being “cheated.” This indicates that poor product and service experiences undermine the legitimacy of its pricing strategy.
Location is another weak point, with complaints about “hard to find” (69.31%), “difficult parking” (19.31%), “common and long queues” (65.79%), and “queue duration” (15.37%), all compounding consumer frustration.
Most critically, these operational shortcomings are severely eroding the brand’s cultural value. Topics such as “not live up to its reputation” (92.14%) and “loss of authentic” (7.86%) frequently appear, with consumers lamenting that such practices are “tarnishing the reputation of Beijing’s time-honored brands.” Reviews expressing “never coming back” underscore that brand loyalty has plummeted to a critical low.

5. Discussion

5.1. Interpreting Brand Image: The Dual Structure of CTHBs

This study reveals a core dual structure underlying the brand image of Beijing’s time-honored restaurants: a pronounced tension between their profound symbolic value and their fluctuating operational performance. Unlike ordinary brands that must build brand equity from scratch, CTHBs naturally inherit a substantial reserve of symbolic capital rooted in historical legacy and cultural identity [86,87,88]. This inheritance constitutes their unique market advantage.
However, the findings also indicate that symbolic capital is not a panacea. The functional and experiential dimensions generally scored relatively low and demonstrated high sensitivity to external shocks (e.g., the COVID-19 pandemic), highlighting their vulnerability. This stark contrast between innate advantages (cultural heritage) and acquired performance (operational outcomes) provides a critical lens for understanding the current challenges faced by time-honored brands. The clustering analysis further empirically supports this dual structure, clearly dividing the market into two distinct groups: the comprehensive performers, who successfully sustain and activate their cultural symbols through strong operational performance, and the heritage strugglers, whose operational shortcomings are seriously eroding their historical halo.
It is worth noting that the experiential dimension has played an increasingly prominent role in shaping brand image. Around 2019, its sentiment scores surpassed those of the functional dimension, reflecting both the growing emphasis on customer experience by industry managers and the evolving expectations of consumers [89,90]. In the case of the comprehensive performers, the experiential dimension serves as a crucial amplifier of symbolic value. When high-quality service, elegant environments, and meaningful cultural interpretation are effectively coupled, abstract symbolic value is activated and transformed into tangible experiential value that consumers can perceive, immerse in, and eagerly share. Conversely, for the heritage strugglers, once experiential performance falls below consumer expectations, symbolic capital not only fails to offset operational weaknesses but also backfires due to the substantial expectation gap, triggering a negative halo effect [91,92]. The process of consumers “coming with high expectations but leaving disappointed” generates intense disconfirmation and accelerates brand reputation loss.
Therefore, the brand image of a time-honored brand is not a single dimensional cultural symbol but rather a dynamic system jointly constructed by functional, experiential, and symbolic dimensions. Although symbolic capital provides an initial advantage, its value realization is highly dependent on functional and experiential performance. This finding offers a clear stratified logic for differentiated governance of time-honored brands.

5.2. Theoretical and Methodological Contributions

This study makes valuable contributions on both theoretical and methodological fronts.
On the theoretical side, it develops a three-dimensional analytical framework of “F–E–S” that provides a more comprehensive and multi-level characterization of brand image. This framework integrates several classic perspectives in branding research while particularly aligning with the dual commercial–cultural attributes of complex brands such as CTHBs [4,30]. More importantly, this research moves beyond the static perspective of traditional brand image studies, which often rely on cross-sectional data. By incorporating time-series analysis, we introduce a valuable dynamic lens to brand image theory. Our findings clearly reveal the heterogeneous resilience of different brand image dimensions. This discovery deepens the understanding of the dynamic evolution of brand image and provides an empirical foundation for future models that can explain the varying response speeds and recovery capabilities of its different dimensions.
On the methodological side, this study demonstrates an integrated analytical pathway, driven by LLMs, to distill actionable business insights from massive unstructured textual data. We propose and operationalize a closed-loop framework of “UGC → aspect → dimension → clustering → topic retracing.” This stepwise and retracing framework ensures both scalability and objectivity, while also securing interpretability and traceability of the conclusions. It offers a systematic and transparent chain from data to managerial action, illustrating how massive consumer voices can be translated into structured, actionable brand management insights.

5.3. Managerial Implications

The findings of this study provide several important managerial insights.
For heritage strugglers, the priority is not to overemphasize their cultural history but to return to the operational fundamentals and strengthen their foundation. Topic modeling results have already identified clear areas for improvement. Managers should prioritize resolving the most frequent consumer complaints, for instance, by establishing Standard Operating Procedures (SOPs) to ensure consistency in product quality and taste, or by introducing modern employee training systems to address the widely criticized indifferent service attitudes. Only after the functional and experiential dimensions—such as product quality, service standards, and the consumption environment—meet or exceed industry averages can their symbolic cultural capital once again become an asset rather than an ironic reminder of unfulfilled promises. Until then, any grand brand storytelling is likely to be counterproductive.
The success of the comprehensive performers offers valuable lessons. The case of Quanjude demonstrates that the key to success lies in the effective conversion of cultural capital. By integrating cultural stories into service details, the brand not only conveys information but also creates unique, memorable moments and emotional connections. These brands should continue to deepen this fusion, positioning themselves as destinations for cultural experiences, not merely as restaurants that serve food. For example, they could explore more deeply embedding cultural narratives into the service process, such as designing a unique serving ritual to explain the historical anecdotes behind signature dishes. Alternatively, they could use digital technologies like in-store interactive screens or AR applications to allow customers to vividly step back into the brand’s history while waiting for their meal. At the same time, this research serves as a warning that even leading brands face non-trivial negative feedback on core dishes and services. This reminds managers that continuous investment in quality control and employee training is essential to prevent the risk of service standards declining as the brand expands or rests on its reputation.
For industry associations and government agencies, the proposed analytical framework provides methodological reference for building dynamic monitoring and early-warning systems. CTHBs should not be treated as static honors but as living brands requiring continuous evaluation. Where necessary, mechanisms for rectification or even delisting should be implemented to safeguard the collective reputation of the category.

5.4. Limitations and Future Research Directions

While this study makes several contributions, it is not without limitations, which also point to promising directions for future research.
First, regarding the data, our study relies exclusively on UGC from Dianping. Although this provides a large-scale, naturalistic source of consumer feedback, it is subject to potential sampling bias [66,93]. The user base of Dianping skews toward a younger demographic, meaning our dataset may not fully represent consumer groups who are less active online, particularly middle-aged and older customers [94]. This bias has a dual implication for our findings. On one hand, our characterization of the brand’s symbolic dimension, especially aspects related to historical memory and nostalgia, may be incomplete. On the other hand, this focus allows for a precise depiction of the brand image among the digitally active consumer segment—a core future market—thereby more sharply revealing the real challenges and opportunities these brands face in adapting to a younger market.
Second, at the methodological level, our study faces the inherent challenges of applying LLMs. The first challenge relates to analytical accuracy; while LLMs demonstrate powerful semantic understanding, they can still misinterpret complex, implicit, or sarcastic language, which may lead to ambiguity or bias [95]. The second challenge concerns reproducibility and robustness. To ensure determinacy and reproducibility within our research framework, we employed an open-source model, fixed the temperature parameter at 0, and disclosed prompts in the Appendix A. Nevertheless, we acknowledge that LLM-based analysis is highly sensitive to model versions and prompt design [96]. Different models or prompts may yield varying results, a challenge widely recognized in current LLM research. Furthermore, the 200 manually annotated samples used for performance validation are limited in scale relative to the entire dataset. Future work could enhance the robustness of the findings by expanding the scale of manual validation and incorporating cross-annotation or expert review.
Finally, regarding the research scope, our sample is limited to CTHBs restaurants in Beijing, which possess distinct regional and cultural characteristics. This limits the external validity of our conclusions, and caution should be exercised when generalizing the findings to heritage brands in other regions or countries. Future research could conduct cross-city or even cross-national comparative studies to identify commonalities and differences in brand image. Additionally, longitudinal case studies would be valuable for tracking the evolution of heritage strugglers and assessing the real-world effectiveness of managerial interventions. It would also be beneficial to integrate an internal corporate perspective, for example, through in-depth interviews with managers, to link consumer perceptions with corporate strategy and build a more complete model of brand image evolution.

6. Conclusions

This study employs LLM-driven text mining techniques to quantitatively portray and critically diagnose the multidimensional brand image of time-honored restaurants in Beijing. The findings clearly reveal the key elements shaping brand image, its dynamic evolution, and the intrinsic heterogeneity within the group.
The results indicate a distinctive dual structure: while the symbolic dimension remains stable and resilient over time, the functional and experiential dimensions fluctuate considerably, showing particular vulnerability during the COVID-19 pandemic. Cluster analysis further categorizes CTHBs into two groups: comprehensive performers, which excel in both operations and cultural heritage transmission, and heritage strugglers, which struggle to translate symbolic value into positive experiences due to operational weaknesses.
Case analysis reveals that brand success hinges not only on strong control of core products and services but also on the effective integration of cultural elements into the customer experience. In doing so, heritage brands can simultaneously meet the dual goals of cultural preservation and modern consumer demand. Based on these findings, three managerial implications are proposed:
  • Strengthen operations before emphasizing heritage: Ensure that products, services, and environments exceed consumer expectations.
  • Embed culture into experiences rather than treating it as ornamentation: Innovate service processes to transform history and culture into tangible consumer experiences.
  • Use dynamic data as a mirror for continuous improvement: Establish long-term monitoring mechanisms for brand image health through real-time data such as online reviews.
It is important to note that the conclusions are subject to limitations regarding data sources, research scope, and methodological tools. Dianping’s user base carries demographic biases, the sample is restricted to Beijing, and LLMs may encounter challenges in handling complex semantics. Therefore, caution should be exercised when generalizing the findings beyond this context.
Overall, this study not only provides empirical support for the self-diagnosis and strategic categorization of time-honored brands but also demonstrates the potential of LLM-driven text mining in brand research. Future applications and validations of this analytical framework in cross-city or cross-national contexts may offer new academic and practical insights for the preservation and innovation of heritage brands worldwide.

Author Contributions

Conceptualization, methodology, data curation, writing—review and editing: X.L. and A.Z.; software, visualization, formal analysis: X.L.; validation, visualization, writing—original draft: X.L. and R.W.; funding acquisition, supervision and project administration: A.Z. and B.M. All authors have read and agreed to the published version of the manuscript.

Funding

This research was funded by Academic Research Projects of Beijing Union University (BJXJD-KT2022-YB06), National Natural Science Foundation of China (42471272), Academic Research Projects of Beijing Union University (No. ZKZD202305) and Team-building subsidy of “Xuezhi Professorship” of the College of Applied Arts and Science of Beijing Union University (BUUCAS-XZJSTD-2024005).

Institutional Review Board Statement

Not applicable.

Informed Consent Statement

Not applicable.

Data Availability Statement

The data presented in this study are available on request from the corresponding author. The data are not publicly available due to privacy.

Acknowledgments

We sincerely appreciate the editor and anonymous reviewers for their valuable comments.

Conflicts of Interest

The authors declare no conflicts of interest.

Abbreviations

The following abbreviations are used in this manuscript:
LLMsLarge Language Models
ABSAAspect-Based Sentiment Analysis
CTHBsChina Time-honored Brands
UGCUser-generated content
eWOMElectronic Word of Mouth
F-E-SFunctional–Experiential–Symbolic
BERTBidirectional Encoder Representations from Transformers
c-TF-IDFclass-based Term Frequency-Inverse Document Frequency
NLPNatural Language Processing
WCSSWithin-Cluster Sum of Squares
COVID-19Coronavirus Disease 2019
LDALatent Dirichlet Allocation

Appendix A

Appendix A.1. ABSA Prompts

To ensure the LLM could accurately and consistently perform the ABSA task, we designed a structured prompt composed of several key components. We explicitly defined the role setting, task objectives, classification schema, output format, and exception handling rules. The classification schema was strictly limited to the eight aspect categories. The output format was specified as a JSON list, where each record contained the aspect term, opinion term, and sentiment polarity, facilitating subsequent parsing and statistical analysis. For complex cases, two rules were defined: (1) opinions of the same sentiment under the same aspect were merged, while (2) different sentiments under the same aspect were retained separately. Additionally, the prompt included four illustrative examples covering different levels of difficulty, thereby leveraging few-shot learning to enhance model consistency and accuracy. The final prompt design is shown in Figure A1.
Figure A1. ABSA Prompts (The bold parts are for understanding the structure of the prompt, not for model input. The prompts are translated from Chinese).
Jtaer 20 00300 g0a1

Appendix A.2. Model Links and Computing Environment

To ensure reproducibility, we list below the large model download link and the computational resources used in this study.
Large language model: Qwen-32B (https://huggingface.co/Qwen/Qwen3-32B-AWQ, accessed on 3 May 2025).
Table A1. Hardware configuration.
ComponentSpecificationQuantity
CPUHygon 7390 32C/64T @ 2.7 GHz2
GPUNVIDIA A6000 (48 GB VRAM)2
RAM32 GB 3200 MHz DDR4 ECC RDIMM16
StorageEnterprise SSD (SATA) 1 TB2
Enterprise SSD (SATA) 4 TB3
RAID cardLSI9361-8i1
Using the above configuration, processing the complete dataset for this study required approximately 500 h.

References

  1. Notice of the Ministry of Commerce and 14 Other Departments on Issuing the “Several Opinions on Protecting and Promoting the Development of Time-Honored Brands. Available online: https://www.mofcom.gov.cn/zcfb/zgdwjjmywg/art/2008/art_5d39c753700f475ab2b21680eeeff129.html (accessed on 8 June 2025).
  2. Zhang, H.; Sun, M.; Zhang, H.; Zhang, L.; Wang, Z. Spatial Distribution and Influencing Factors of Chinese Time-Honored Catering Brands in the Five Northwestern Provinces. Sustainability 2021, 13, 3755. [Google Scholar] [CrossRef]
  3. Song, H.; Xu, J.B.; Kim, J.-H. Nostalgic Experiences in Time-Honored Restaurants: Antecedents and Outcomes. Int. J. Hosp. Manag. 2021, 99, 103080. [Google Scholar] [CrossRef]
  4. Li, C.; Cui, Z.; Chen, J.; Zhou, N. Brand Revitalization of Heritage Enterprises for Cultural Sustainability in the Digital Era: A Case Study in China. Sustainability 2019, 11, 1769. [Google Scholar] [CrossRef]
  5. Park, C.W.; Jaworski, B.J.; MacInnis, D.J. Strategic Brand Concept-Image Management. J. Mark. 1986, 50, 135–145. [Google Scholar] [CrossRef]
  6. Kato, T.; Tsuda, K. A Management Method of the Corporate Brand Image Based on Customers’ Perception. Procedia Comput. Sci. 2018, 126, 1368–1377. [Google Scholar] [CrossRef]
  7. Chan, K.; Leung Ng, Y.; Luk, E.K. Impact of Celebrity Endorsement in Advertising on Brand Image among Chinese Adolescents. Young Consum. 2013, 14, 167–179. [Google Scholar] [CrossRef]
  8. Chen, Y.-S. The Drivers of Green Brand Equity: Green Brand Image, Green Satisfaction, and Green Trust. J. Bus. Ethics 2010, 93, 307–319. [Google Scholar] [CrossRef]
  9. Plumeyer, A.; Kottemann, P.; Böger, D.; Decker, R. Measuring Brand Image: A Systematic Review, Practical Guidance, and Future Research Directions. Rev. Manag. Sci. 2019, 13, 227–265. [Google Scholar] [CrossRef]
  10. Yang, T.; Wu, J.; Zhang, J. Knowing How Satisfied/Dissatisfied Is Far from Enough: A Comprehensive Customer Satisfaction Analysis Framework Based on Hybrid Text Mining Techniques. Int. J. Contemp. Hosp. Manag. 2023, 36, 873–892. [Google Scholar] [CrossRef]
  11. Jiang, X.; Lin, J.; Wang, C.; Zhou, L. How Far Is Reality from Vision: An Online Data-Driven Method for Brand Image Assessment and Maintenance. Inf. Process. Manag. 2024, 61, 103769. [Google Scholar] [CrossRef]
  12. Romero-Rodriguez, L.M.; Castillo-Abdul, B. Toward State-of-the-Art on Social Marketing Research in User-Generated Content (UGC) and Influencers. JMD 2023, 42, 425–435. [Google Scholar] [CrossRef]
  13. Alzate, M.; Arce-Urriza, M.; Cebollada, J. Mining the Text of Online Consumer Reviews to Analyze Brand Image and Brand Positioning. J. Retail. Consum. Serv. 2022, 67, 102989. [Google Scholar] [CrossRef]
  14. Rahaman, M.A.; Hassan, H.M.K.; Asheq, A.A.; Islam, K.M.A. The Interplay between eWOM Information and Purchase Intention on Social Media: Through the Lens of IAM and TAM Theory. PLoS ONE 2022, 17, e0272926. [Google Scholar] [CrossRef]
  15. Guan, C.; Hung, Y.-C.; Liu, W. Cultural Differences in Hospitality Service Evaluations: Mining Insights of User Generated Content. Electron. Mark. 2022, 32, 1061–1081. [Google Scholar] [CrossRef]
  16. Rasool, G.; Pathania, A. Reading between the Lines: Untwining Online User-Generated Content Using Sentiment Analysis. J. Res. Interact. Mark. 2021, 15, 401–418. [Google Scholar] [CrossRef]
  17. Yang, S. Deep Learning Mechanism and Big Data in Hospitality and Tourism: Developing Personalized Restaurant Recommendation Model to Customer Decision-Making. Int. J. Hosp. Manag. 2024, 121, 103803. [Google Scholar] [CrossRef]
  18. Yang, S.; Liao, H.; Kóczy, L.T. Preference Mining and Fuzzy Inference for Hotel Selection Based on Aspect-Based Sentiment Analysis from User-Generated Content. J. Oper. Res. Soc. 2025, 76, 1414–1431. [Google Scholar] [CrossRef]
  19. Devlin, J.; Chang, M.-W.; Lee, K.; Toutanova, K. BERT: Pre-Training of Deep Bidirectional Transformers for Language Understanding 2019.
  20. Zhou, C.; Li, Q.; Li, C.; Yu, J.; Liu, Y.; Wang, G.; Zhang, K.; Ji, C.; Yan, Q.; He, L.; et al. A Comprehensive Survey on Pretrained Foundation Models: A History from BERT to ChatGPT. Int. J. Mach. Learn. Cyber. 2024, 1–65. [Google Scholar] [CrossRef]
  21. Kastrati, Z.; Imran, A.S.; Kurti, A. Weakly Supervised Framework for Aspect-Based Sentiment Analysis on Students’ Reviews of MOOCs. IEEE Access 2020, 8, 106799–106810. [Google Scholar] [CrossRef]
  22. Zhang, W.; Li, X.; Deng, Y.; Bing, L.; Lam, W. A Survey on Aspect-Based Sentiment Analysis: Tasks, Methods, and Challenges. IEEE Trans. Knowl. Data Eng. 2023, 35, 11019–11038. [Google Scholar] [CrossRef]
  23. Wei, W.; Hao, C.; Wang, Z. User Needs Insights from UGC Based on Large Language Model. Adv. Eng. Inform. 2025, 65, 103268. [Google Scholar] [CrossRef]
  24. Kumar, P. Large Language Models (LLMs): Survey, Technical Frameworks, and Future Challenges. Artif. Intell. Rev. 2024, 57, 260. [Google Scholar] [CrossRef]
  25. Wu, T.; He, S.; Liu, J.; Sun, S.; Liu, K.; Han, Q.-L.; Tang, Y. A Brief Overview of ChatGPT: The History, Status Quo and Potential Future Development. IEEE/CAA J. Autom. Sin. 2023, 10, 1122–1136. [Google Scholar] [CrossRef]
  26. Yang, J.; Jin, H.; Tang, R.; Han, X.; Feng, Q.; Jiang, H.; Zhong, S.; Yin, B.; Hu, X. Harnessing the Power of LLMs in Practice: A Survey on ChatGPT and Beyond. ACM Trans. Knowl. Discov. Data 2024, 18, 160. [Google Scholar] [CrossRef]
  27. Hu, D.; Liu, B.; Zhu, X.; Lu, X.; Wu, N. Zero-Shot Information Extraction from Radiological Reports Using ChatGPT. Int. J. Med. Inform. 2024, 183, 105321. [Google Scholar] [CrossRef]
  28. Thapa, S.; Shiwakoti, S.; Shah, S.B.; Adhikari, S.; Veeramani, H.; Nasim, M.; Naseem, U. Large Language Models (LLM) in Computational Social Science: Prospects, Current State, and Challenges. Soc. Netw. Anal. Min. 2025, 15, 4. [Google Scholar] [CrossRef]
  29. Liu, Y. How to Revitalize China Time-Honored Brand through Marketing. In Advances in Economics, Business and Management Research, Proceedings of the 2022 4th International Conference on Economic Management and Cultural Industry (ICEMCI 2022), Chongqing, China, 14–16 October 2022; Appolloni, A., Caracciolo, F., Ding, Z., Gogas, P., Huang, G., Nartea, G., Ngo, T., Striełkowski, W., Joshi, S., Eds.; Atlantis Press International BV: Dordrecht, The Netherlands, 2023; Volume 231, pp. 1391–1399. ISBN 978-94-6463-097-8. [Google Scholar]
  30. Zhang, S.-N.; Li, Y.-Q.; Liu, C.-H.; Ruan, W.-Q. A Study on China’s Time-Honored Catering Brands: Achieving New Inheritance of Traditional Brands. J. Retail. Consum. Serv. 2021, 58, 102290. [Google Scholar] [CrossRef]
  31. Cooper, H.; Miller, D.; Merrilees, B. Restoring Luxury Corporate Heritage Brands: From Crisis to Ascendency. J. Brand. Manag. 2015, 22, 448–466. [Google Scholar] [CrossRef]
  32. Sørensen, A.R.; Korsager, E.M.; Heller, M. A Bittersweet Past: The Negative Equity of Corporate Heritage Brands. J. Consum. Cult. 2021, 21, 200–218. [Google Scholar] [CrossRef]
  33. The Economic Daily. How Do Chinese Time-Honored Brands Unleash New Vitality. 2016. Available online: http://paper.ce.cn/jjrb/html/2016-12/09/content_319795.htm (accessed on 10 June 2025).
  34. Chen, Q.; Huang, R.; Hou, B. Perceived Authenticity of Traditional Branded Restaurants (China): Impacts on Perceived Quality, Perceived Value, and Behavioural Intentions. Curr. Issues Tour. 2020, 23, 2950–2971. [Google Scholar] [CrossRef]
  35. Bu, H.; Huang, R.; Liang, S.; Liao, X. Consumer Perceived Brand Innovativeness and Authenticity of Chinese Time-Honored Brand Restaurants: The Moderated Mediation Effect of Personal Traits. Psychol. Res. Behav. Manag. 2023, 16, 2481–2498. [Google Scholar] [CrossRef]
  36. He, J.; Xiang, J.; Wang, J. Extension of Heritage Brands and Consumer Purchase Intention with the Moderating Role of Pop Culture Involvement: An Empirical Analysis of Time-Honoured Brands in China. Asia Pac. J. Mark. Logist. 2023, 36, 1131–1149. [Google Scholar] [CrossRef]
  37. Zhang, Y.; Guo, X. “New and Old”: Consumer Evaluations of Co-Branding between New Brands and Chinese Time-Honored Brands. J. Retail. Consum. Serv. 2023, 73, 103293. [Google Scholar] [CrossRef]
  38. Zhou, L.; Hui, M.K.; Zhou, L.; Li, S. Cultural Congruity and Extensions of Corporate Heritage Brands: An Empirical Analysis of Time-Honored Brands in China. J. Consum. Behav. 2022, 21, 1092–1105. [Google Scholar] [CrossRef]
  39. Sishun, H. The Reshaping of the Time-Honored Brand Image under the New Media Environment; Atlantis Press: Dordrecht, The Netherlands, 2019; pp. 633–636. [Google Scholar]
  40. Yu, M.; He, C.; Ma, Y. Research on the Visual Image Design and Communication Studies of China’s Time-Honored Brands; Athena Publishing: Amsterdam, The Netherlands, 2022; pp. 149–155. [Google Scholar]
  41. DuBois, D.T. China’s Old Brands: Commercial Heritage and Creative Nostalgia. Int. J. Asian Stud. 2021, 18, 45–59. [Google Scholar] [CrossRef]
  42. Gardner, B.B.; Levy, S.J. The Product and the Brand. Harv. Bus. Rev. 1955, 33, 33–39. [Google Scholar]
  43. Aaker, D.A. Managing Brand Equity; Free Press: New York, NY, USA, 1991; ISBN 978-0-02-900101-1. [Google Scholar]
  44. Keller, K.L. Conceptualizing, Measuring, and Managing Customer-Based Brand Equity. J. Mark. 1993, 57, 1–22. [Google Scholar] [CrossRef]
  45. Mamat, M.N.; Noor, N.M.; Noor, N.M. Purchase Intentions of Foreign Luxury Brand Handbags among Consumers in Kuala Lumpur, Malaysia. Procedia Econ. Financ. 2016, 35, 206–215. [Google Scholar] [CrossRef]
  46. Das, M.; Jebarajakirthy, C.; Sivapalan, A. How Consumption Values and Perceived Brand Authenticity Inspire Fashion Masstige Purchase? An Investigation. J. Retail. Consum. Serv. 2022, 68, 103023. [Google Scholar] [CrossRef]
  47. Persson, N. An Exploratory Investigation of the Elements of B2B Brand Image and Its Relationship to Price Premium. Ind. Mark. Manag. 2010, 39, 1269–1277. [Google Scholar] [CrossRef]
  48. Brečić, R.; Filipović, J.; Gorton, M.; Ognjanov, G.; Stojanović, Ž.; White, J. A Qualitative Approach to Understanding Brand Image in an International Context: Insights from Croatia and Serbia. Int. Mark. Rev. 2013, 30, 275–296. [Google Scholar] [CrossRef]
  49. Grohs, R.; Reisinger, H. Sponsorship Effects on Brand Image: The Role of Exposure and Activity Involvement. J. Bus. Res. 2014, 67, 1018–1025. [Google Scholar] [CrossRef]
  50. Singh, N.; Yu, J.; Ariza-Montes, A.; Han, H. Exploring the Impact of Functional, Symbolic, and Experiential Image on Approach Behaviors among State-Park Tourists from India, Korea, and the USA. Humanit. Soc. Sci. Commun. 2023, 10, 36. [Google Scholar] [CrossRef]
  51. Augusto, M.; Torres, P. Effects of Brand Attitude and eWOM on Consumers’ Willingness to Pay in the Banking Industry: Mediating Role of Consumer-Brand Identification and Brand Equity. J. Retail. Consum. Serv. 2018, 42, 1–10. [Google Scholar] [CrossRef]
  52. Hasan, G.; Elviana, E. Effect of Brand Image, Celebrity Endorsement, EWOM, Brand Awareness and Social Media Communication on Purchase Intention with Brand Trust as a Mediation Variable on Smartphone Users in Batam City. Conf. Bus. Soc. Sci. Technol. (CoNeScINTech) 2022, 2, 153–161. [Google Scholar]
  53. Kudeshia, C.; Kumar, A. Social eWOM: Does It Affect the Brand Attitude and Purchase Intention of Brands? Manag. Res. Rev. 2017, 40, 310–330. [Google Scholar] [CrossRef]
  54. Liu, X.; Ren, P.; Lv, X.; Li, S. Service Experience and Customers’ eWOM Behavior on Social Media Platforms: The Role of Platform Symmetry. Int. J. Hosp. Manag. 2024, 119, 103735. [Google Scholar] [CrossRef]
  55. Mustak, M.; Hallikainen, H.; Laukkanen, T.; Plé, L.; Hollebeek, L.D.; Aleem, M. Using Machine Learning to Develop Customer Insights from User-Generated Content. J. Retail. Consum. Serv. 2024, 81, 104034. [Google Scholar] [CrossRef]
  56. Park, E.; Kwon, J.; Chae, B.; Kim, S.-B. What Are the Salient and Memorable Green-Restaurant Attributes? Capturing Customer Perceptions From User-Generated Content. SAGE Open 2021, 11, 21582440211031546. [Google Scholar] [CrossRef]
  57. Kim, D.Y.; Seo, H.J.; Song, T.H. Do All the Service Attributes Matter? Application of Customer Review-Based Attribute Extraction Considering Brand Status. J. Retail. Consum. Serv. 2025, 87, 104345. [Google Scholar] [CrossRef]
  58. Ray, B.; Garain, A.; Sarkar, R. An Ensemble-Based Hotel Recommender System Using Sentiment Analysis and Aspect Categorization of Hotel Reviews. Appl. Soft Comput. 2021, 98, 106935. [Google Scholar] [CrossRef]
  59. Carrasco, P.; Dias, S. Enhancing Restaurant Management through Aspect-Based Sentiment Analysis and NLP Techniques. Procedia Comput. Sci. 2024, 237, 129–137. [Google Scholar] [CrossRef]
  60. Li, H.; Yu, B.X.B.; Li, G.; Gao, H. Restaurant Survival Prediction Using Customer-Generated Content: An Aspect-Based Sentiment Analysis of Online Reviews. Tour. Manag. 2023, 96, 104707. [Google Scholar] [CrossRef]
  61. Shahhosseini, M.; Khalili Nasr, A. What Attributes Affect Customer Satisfaction in Green Restaurants? An Aspect-Based Sentiment Analysis Approach. J. Travel. Tour. Mark. 2024, 41, 472–490. [Google Scholar] [CrossRef]
  62. Qiu, Y.; Jin, Y. ChatGPT and Finetuned BERT: A Comparative Study for Developing Intelligent Design Support Systems. Intell. Syst. Appl. 2024, 21, 200308. [Google Scholar] [CrossRef]
  63. Arora, N.; Chakraborty, I.; Nishimura, Y. AI–Human Hybrids for Marketing Research: Leveraging Large Language Models (LLMs) as Collaborators. J. Mark. 2025, 89, 43–70. [Google Scholar] [CrossRef]
  64. Ghatora, P.S.; Hosseini, S.E.; Pervez, S.; Iqbal, M.J.; Shaukat, N. Sentiment Analysis of Product Reviews Using Machine Learning and Pre-Trained LLM. Big Data Cogn. Comput. 2024, 8, 199. [Google Scholar] [CrossRef]
  65. Pantano, E.; Serravalle, F.; Priporas, C.-V. The Form of AI-Driven Luxury: How Generative AI (GAI) and Large Language Models (LLMs) Are Transforming the Creative Process. J. Mark. Manag. 2024, 40, 1771–1790. [Google Scholar] [CrossRef]
  66. He, X.; Zhou, Y.; Yuan, Y. Exploring the Relationship between Urban Polycentricity and Consumer Amenity Development: An Empirical Study Using Dianping Data in China. Cities 2025, 166, 106197. [Google Scholar] [CrossRef]
  67. Babić Rosario, A.; de Valck, K.; Sotgiu, F. Conceptualizing the Electronic Word-of-Mouth Process: What We Know and Need to Know about eWOM Creation, Exposure, and Evaluation. J. Acad. Mark. Sci. 2020, 48, 422–448. [Google Scholar] [CrossRef]
  68. Jia, S. (Sixue) Measuring Tourists’ Meal Experience by Mining Online User Generated Content about Restaurants. Scand. J. Hosp. Tour. 2019, 19, 371–389. [Google Scholar] [CrossRef]
  69. Cankül, D.; Kaya, S.; Kızıltaş, M.Ç. The Effect of Gastronomic Experience on Restaurant Image, Customer Perceived Value, Customer Satisfaction and Customer Loyalty. Int. J. Gastron. Food Sci. 2024, 36, 100908. [Google Scholar] [CrossRef]
  70. García-Salirrosas, E.E.; Escobar-Farfán, M.; Esponda-Perez, J.A.; Millones-Liza, D.Y.; Villar-Guevara, M.; Haro-Zea, K.L.; Gallardo-Canales, R. The Impact of Perceived Value on Brand Image and Loyalty: A Study of Healthy Food Brands in Emerging Markets. Front. Nutr. 2024, 11, 1482009. [Google Scholar] [CrossRef]
  71. Ho, T.V.; Phan, T.N.; Le-Hoang, V.P. Positioning Customer-Based Convenience Store Image: A Multidimensional Scaling Approach via Perceptual Map. J. Distrib. Sci. 2021, 19, 15–24. [Google Scholar] [CrossRef]
  72. Jin, N.; Lee, S.; Huffman, L. Impact of Restaurant Experience on Brand Image and Customer Loyalty: Moderating Role of Dining Motivation. J. Travel Tour. Mark. 2012, 29, 532–551. [Google Scholar] [CrossRef]
  73. Heung, V.C.S.; Gu, T. Influence of Restaurant Atmospherics on Patron Satisfaction and Behavioral Intentions. Int. J. Hosp. Manag. 2012, 31, 1167–1177. [Google Scholar] [CrossRef]
  74. De Vries, J.; Roy, D.; De Koster, R. Worth the Wait? How Restaurant Waiting Time Influences Customer Behavior and Revenue. J. Oper. Manag. 2018, 63, 59–78. [Google Scholar] [CrossRef]
  75. Lai, M.Y.; Khoo-Lattimore, C.; Wang, Y. Food and Cuisine Image in Destination Branding: Toward a Conceptual Model. Tour. Hosp. Res. 2019, 19, 238–251. [Google Scholar] [CrossRef]
  76. Pontiki, M.; Galanis, D.; Papageorgiou, H.; Androutsopoulos, I.; Manandhar, S.; Al-Smadi, M.; Al-Ayyoub, M.; Zhao, Y.; Qin, B.; de Clercq, O.; et al. SemEval-2016 Task 5: Aspect Based Sentiment Analysis. In Proceedings of the 10th International Workshop on Semantic Evaluation (SemEval 2016), San Diego, CA, USA, 16–17 June 2016; pp. 19–30. [Google Scholar]
  77. Pontiki, M.; Galanis, D.; Pavlopoulos, J.; Papageorgiou, H.; Androutsopoulos, I.; Manandhar, S. SemEval-2014 Task 4: Aspect Based Sentiment Analysis. In Proceedings of the 8th International Workshop on Semantic Evaluation (SemEval 2014), Dublin, Ireland, 23–29 August 2014; Nakov, P., Zesch, T., Eds.; Association for Computational Linguistics: Kerrville, TX, USA, 2014; pp. 27–35. [Google Scholar]
  78. Yang, A.; Li, A.; Yang, B.; Zhang, B.; Hui, B.; Zheng, B.; Yu, B.; Gao, C.; Huang, C.; Lv, C.; et al. Qwen3 Technical Report. arXiv 2025, arXiv:2505.09388. [Google Scholar] [CrossRef]
  79. Chen, B.; Zhang, Z.; Langrené, N.; Zhu, S. Unleashing the Potential of Prompt Engineering for Large Language Models. Patterns 2025, 6, 101260. [Google Scholar] [CrossRef]
  80. Lappeman, J.; Clark, R.; Evans, J.; Sierra-Rubia, L.; Gordon, P. Studying Social Media Sentiment Using Human Validated Analysis. MethodsX 2020, 7, 100867. [Google Scholar] [CrossRef]
  81. Vidya, N.A.; Fanany, M.I.; Budi, I. Twitter Sentiment to Analyze Net Brand Reputation of Mobile Phone Providers. Procedia Comput. Sci. 2015, 72, 519–526. [Google Scholar] [CrossRef]
  82. Ikotun, A.M.; Ezugwu, A.E.; Abualigah, L.; Abuhaija, B.; Heming, J. K-Means Clustering Algorithms: A Comprehensive Review, Variants Analysis, and Advances in the Era of Big Data. Inf. Sci. 2023, 622, 178–210. [Google Scholar] [CrossRef]
  83. Sánchez-Franco, M.J.; Rey-Moreno, M. Do Travelers’ Reviews Depend on the Destination? An Analysis in Coastal and Urban Peer-to-Peer Lodgings. Psychol. Mark. 2022, 39, 441–459. [Google Scholar] [CrossRef]
  84. Li, X.; Yang, T.; Meng, B.; Chen, S.; Zhang, S. Analysis of Tourist Behavior Patterns and Perceptions in Beijing Based on User-Generated Content Data. Appl. Spat. Anal. 2025, 18, 108. [Google Scholar] [CrossRef]
  85. Raman, R.; Pattnaik, D.; Hughes, L.; Nedungadi, P. Unveiling the Dynamics of AI Applications: A Review of Reviews Using Scientometrics and BERTopic Modeling. J. Innov. Knowl. 2024, 9, 100517. [Google Scholar] [CrossRef]
  86. Aaker, D.A. Should You Take Your Brand to Where the Action Is? Harv. Bus. Rev. 1997, 75, 135–144. [Google Scholar]
  87. Dion, D.; Mazzalovo, G. Reviving Sleeping Beauty Brands by Rearticulating Brand Heritage. J. Bus. Res. 2016, 69, 5894–5900. [Google Scholar] [CrossRef]
  88. Urde, M.; Greyser, S.A.; Balmer, J.M.T. Corporate Brands with a Heritage. J. Brand. Manag. 2007, 15, 4–19. [Google Scholar] [CrossRef]
  89. Kuppelwieser, V.G.; Klaus, P.; Manthiou, A.; Hollebeek, L.D. The Role of Customer Experience in the Perceived Value–Word-of-Mouth Relationship. J. Serv. Mark. 2022, 36, 364–378. [Google Scholar] [CrossRef]
  90. Sykora, M.; Elayan, S.; Hodgkinson, I.R.; Jackson, T.W.; West, A. The Power of Emotions: Leveraging User Generated Content for Customer Experience Management. J. Bus. Res. 2022, 144, 997–1006. [Google Scholar] [CrossRef]
  91. Nicolau, J.L.; Mellinas, J.P.; Martín-Fuentes, E. The Halo Effect: A Longitudinal Approach. Ann. Tour. Res. 2020, 83, 102938. [Google Scholar] [CrossRef]
  92. Richetin, J.; Demartini, E.; Gaviglio, A.; Ricci, E.C.; Stranieri, S.; Banterle, A.; Perugini, M. The Biasing Effect of Evocative Attributes at the Implicit and Explicit Level: The Tradition Halo and the Industrial Horn in Food Products Evaluations. J. Retail. Consum. Serv. 2021, 61, 101890. [Google Scholar] [CrossRef]
  93. Shen, X.; Pan, B.; Hu, T.; Chen, K.; Qiao, L.; Zhu, J. Beyond Self-Selection: The Multilayered Online Review Biases at the Intersection of Users, Platforms and Culture. J. Hosp. Tour. Insights 2021, 4, 77–97. [Google Scholar] [CrossRef]
  94. Liu, R.; Xiao, J. Factors Affecting Users’ Satisfaction with Urban Parks through Online Comments Data: Evidence from Shenzhen, China. Int. J. Environ. Res. Public Health 2021, 18, 253. [Google Scholar] [CrossRef] [PubMed]
  95. Bhargava, N.; Radaideh, M.I.; Kwon, O.H.; Verma, A.; Radaideh, M.I. On the Impact of Language Nuances on Sentiment Analysis with Large Language Models: Paraphrasing, Sarcasm, and Emojis 2025. arXiv 2025, arXiv:2504.05603. [Google Scholar]
  96. Razavi, A.; Soltangheis, M.; Arabzadeh, N.; Salamat, S.; Zihayat, M.; Bagheri, E. Benchmarking Prompt Sensitivity in Large Language Models. In Advances in Information Retrieval; Hauff, C., Macdonald, C., Jannach, D., Kazai, G., Nardini, F.M., Pinelli, F., Silvestri, F., Tonellotto, N., Eds.; Springer Nature: Cham, Switzerland, 2025; pp. 303–313. [Google Scholar]
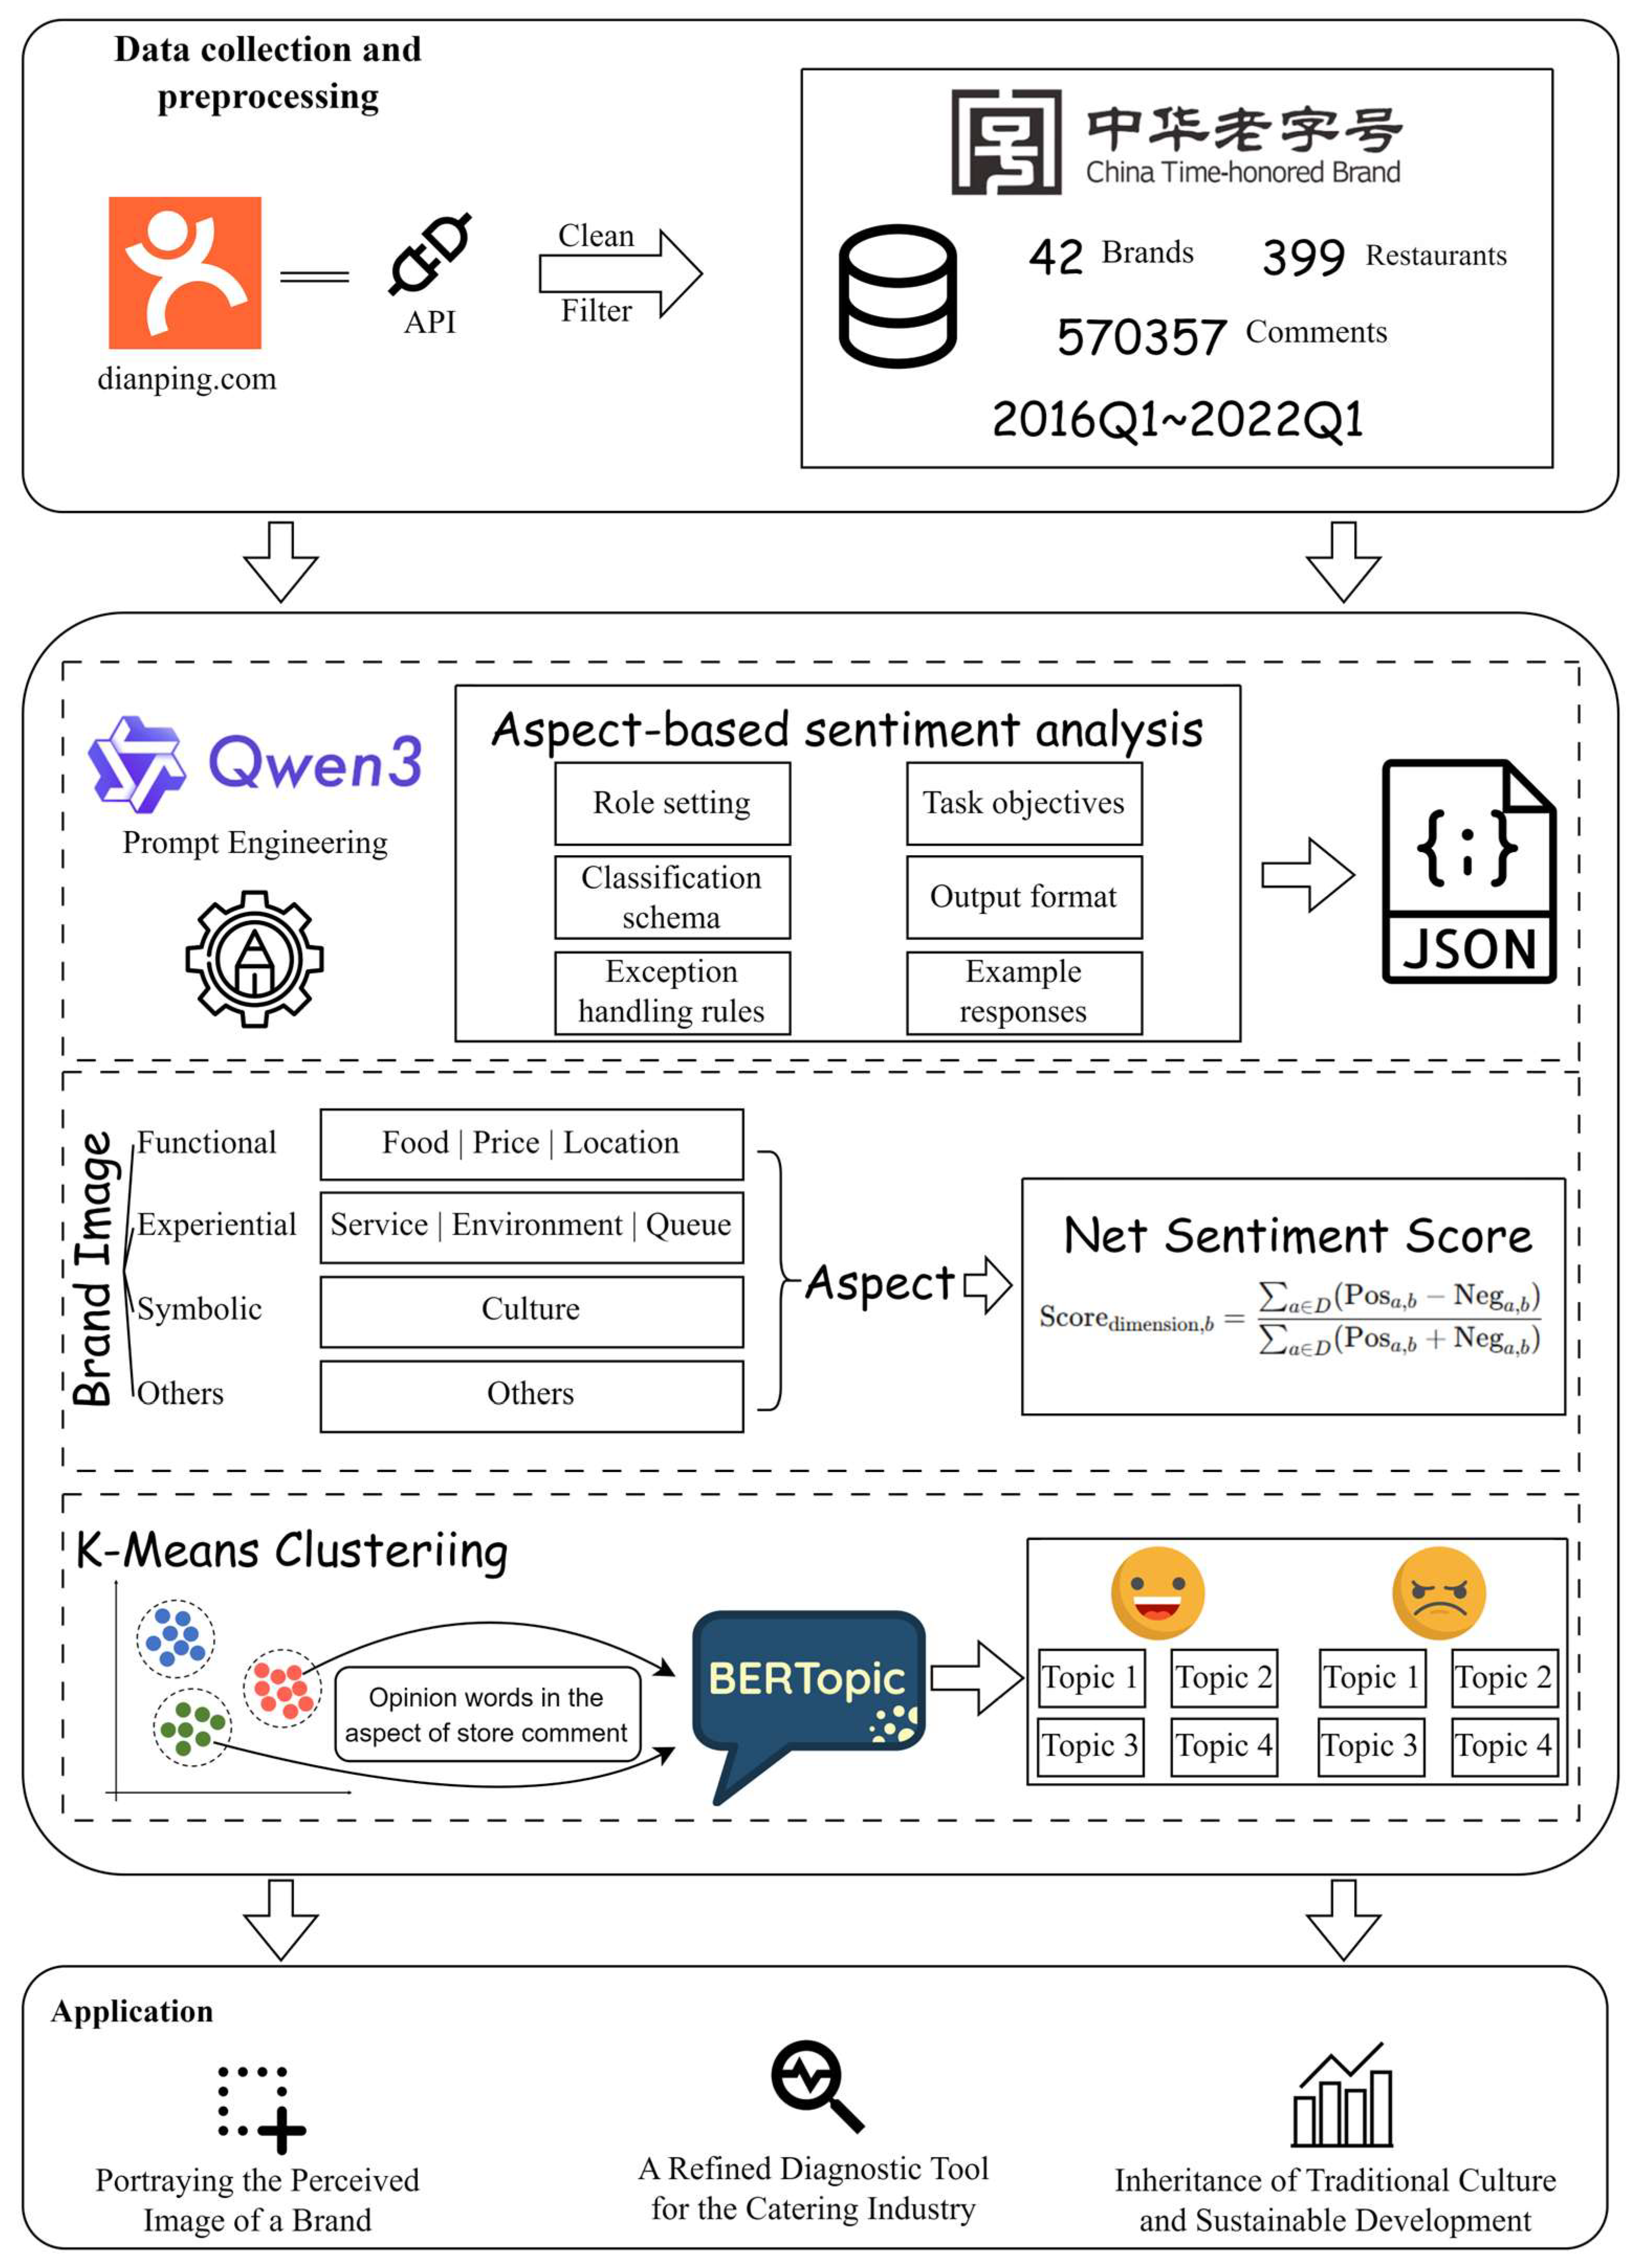
Figure 1. Research framework.
Jtaer 20 00300 g001
Figure 2. Distribution of review counts and sentiment polarity across aspects.
Jtaer 20 00300 g002
Figure 3. Temporal variations in dimension scores.
Jtaer 20 00300 g003
Figure 4. (a) Changes in WCSS and (b) changes in silhouette coefficient with varying numbers of clusters.
Jtaer 20 00300 g004
Figure 5. (a) Score distributions of the two brand types across dimensions and (b) average scores of the two brand types across dimensions.
Jtaer 20 00300 g005
Figure 6. Topic modeling results.
Jtaer 20 00300 g006
Table 1. Mapping of perceptual aspects to brand image dimensions.
DimensionsAspect
FunctionalFood [69], Price [70], Location [71]
ExperientialService [72], Environment [73], Queue [74]
SymbolicCulture [75]
Disclaimer/Publisher’s Note: The statements, opinions and data contained in all publications are solely those of the individual author(s) and contributor(s) and not of MDPI and/or the editor(s). MDPI and/or the editor(s) disclaim responsibility for any injury to people or property resulting from any ideas, methods, instructions or products referred to in the content.