Article

Optimizing Furniture Retail Strategies: Insights from Cross-Platform Consumer Sentiment and Topic Modeling

1
Research Center of Management Science and Engineering, Jiangxi Normal University, Nanchang 330022, China
2
School of Statistics, Xi’an University of Finance and Economics, Xi’an 710049, China
3
School of Economics and Management, China University of Mining and Technology, Xuzhou 221116, China
*
Author to whom correspondence should be addressed.
J. Theor. Appl. Electron. Commer. Res. 2025, 20(4), 258; https://doi.org/10.3390/jtaer20040258
Submission received: 4 June 2025 / Revised: 30 August 2025 / Accepted: 18 September 2025 / Published: 1 October 2025

Abstract

Rapid advancements in artificial intelligence and the Internet of Things (IoT) have fueled the growth of furniture, transforming traditional home environments into intelligent living spaces. As consumer adoption accelerates, understanding user concerns and sentiment trends becomes crucial for brands to refine product offerings and enhance market competitiveness. This study systematically investigates consumer concerns and sentiment trends toward furniture products by analyzing user-generated reviews across two major e-commerce platforms: Jingdong and Taobao. Leveraging advanced text-mining methods including TF-IDF keyword extraction, hierarchical clustering, Graph of Words–Latent Dirichlet Allocation (GoW-LDA) topic modeling, and BERT-based sentiment analysis, this research identifies critical user preferences, product satisfaction factors, and platform-specific behavioral patterns. Results reveal distinct cross-platform differences; Jingdong users prioritize service quality, brand trust, and logistical efficiency, whereas Taobao users emphasize product aesthetics, material selection, and cost-effectiveness. The sentiment analysis demonstrates that Jingdong users exhibit more consistent and positive feedback, while sentiment on Taobao displays higher variability due to product-quality discrepancies and price sensitivity.

1. Introduction

In recent years, the e-commerce industry has continued to experience rapid growth, with the furniture sector emerging as a significant focal point for consumers due to its integration of home furnishing solutions, innovative designs, and advancements in material technology [1,2,3]. As consumer demand for intelligence, convenience, and personalization increases, furniture products are expected not only to fulfill basic functional requirements but also to incorporate elements of design aesthetics, intelligent interaction, and enhanced user comfort [4,5,6,7]. Meanwhile, e-commerce platforms have become a crucial channel for furniture sales. Users share their experiences, service evaluations, and purchasing decisions through online reviews, which contain valuable insights [8]. These reviews not only reflect users’ core needs but also exert a profound influence on the purchasing decisions of potential consumers [9,10,11]. However, due to the diversity of e-commerce platforms, significant differences exist among user demographics, review structures, and expression styles across different platforms [12]. This diversity poses a critical challenge: how to comprehensively and systematically mine user review data to reveal the market performance of furniture products and key consumer concerns. Addressing this issue has become an urgent research priority in the field [13,14,15].
The value of user review data extends beyond direct feedback on product advantages and disadvantages; it also provides insights into consumers’ latent needs and behavioral patterns [16,17,18,19]. In recent years, text mining methods based on natural language processing (NLP) techniques have rapidly evolved. Methods such as term frequency-inverse document frequency (TF-IDF), hierarchical clustering, and topic modeling techniques like latent Dirichlet allocation (LDA) have been widely applied to user review analysis, enabling the identification of core keywords, extraction of thematic categories, and revelation of consumer concerns [20,21,22,23]. At the same time, advancements in sentiment analysis techniques allow researchers to quantitatively assess the emotional tendencies expressed in user reviews, thereby evaluating consumer satisfaction and product perception. However, despite significant progress in the analysis of e-commerce user reviews, several key challenges remain [24,25,26,27].
First, most existing studies focus on a single e-commerce platform, lacking comparative analyses of consumer concerns across different platforms. Given that user demographics, purchasing habits, and evaluation standards vary significantly across platforms, single-platform studies fail to comprehensively capture market trends [28,29,30,31]. Second, in terms of text analysis methods, while traditional keyword extraction and topic modeling approaches can identify high-frequency terms and latent topics, they exhibit limitations in handling complex semantics, metaphorical expressions, and cross-topic interactions [32,33,34]. Lastly, most sentiment analysis research still relies on rule-based matching or shallow machine learning techniques, which struggle to accurately detect implicit sentiment tendencies in user reviews. This challenge is particularly evident when dealing with sarcasm, irony, or highly subjective expressions, where traditional methods often yield substantial misclassifications [35,36,37,38,39]. Therefore, a key research challenge is how to develop a precise and efficient user review analysis framework based on multi-platform data to achieve a more comprehensive understanding of consumer needs and market dynamics.
To address the aforementioned challenges, this study focuses on user review data from two major e-commerce platforms, Jingdong and Taobao, and conducts an in-depth exploration of user concerns, sentiment tendencies, and consumer behavior patterns related to furniture products. Leveraging NLP and deep learning techniques, this research adopts a multi-level text analysis approach to systematically extract key information from user reviews.
Building on this foundation, a user concern model and a sentiment analysis framework are developed to uncover differences in user needs across platforms and the factors influencing these differences. Furthermore, this study aims to integrate data-driven methodologies to provide optimization strategies for e-commerce platforms and furniture manufacturers. By doing so, it seeks to help businesses more accurately identify target users, enhance product design, improve service quality, and formulate more targeted marketing strategies.
The innovation of this study is reflected in three key aspects:
First, in terms of research scope, this study overcomes the limitations of traditional single-platform analyses by conducting a comparative study of user data from Jingdong and Taobao. By exploring user behavior patterns and focal concerns across different e-commerce ecosystems, this cross-platform analytical perspective not only helps to understand inter-platform differences but also provides data-driven insights for merchants to formulate effective market strategies on different platforms.
Second, in methodological design, this research establishes a multi-level text analysis framework that integrates TF-IDF, GoW-LDA topic modeling (this method will be described in the next chapter), and hierarchical clustering to systematically extract core information from user reviews. This structured approach enables a more comprehensive understanding of consumer purchasing motivations, key concerns, and experiential feedback.
Finally, in sentiment analysis, this study incorporates the BERT model, a deep learning-based approach, to enhance the recognition of complex emotional expressions. By addressing the limitations of traditional sentiment analysis methods in handling metaphors, sarcasm, double negatives, and other nuanced semantic expressions, this approach significantly improves the accuracy of sentiment classification.
Through these innovations, this study not only provides a scientific methodology for analyzing user needs in the furniture industry but also offers practical guidance for e-commerce platforms to optimize products and services, ultimately driving the industry toward greater intelligence and precision.

2. Research Methodology

2.1. Research Framework

With the rapid development of e-commerce platforms, user review data has become an important source of information for understanding consumers’ perception of commodities. In order to explore users’ perceptions of product images on e-commerce platforms through online reviews, and to reveal users’ main concerns and emotional tendencies towards products, this study analyzes online reviews generated by users on two e-commerce platforms, Jingdong and Taobao. This hybrid analysis method identifies high-frequency words and potential themes in user reviews and quantifies users’ sentiment tendencies through text mining techniques such as TF-IDF analysis, hierarchical clustering, and LDA modeling, thus helping merchants to understand users’ core needs, as shown Figure 1. Specifically, the method consists of three phases:
Stage 1: Data collection and preprocessing. In the initial stage, this paper selected three e-commerce platforms, Jingdong and Taobao, as the data source, and identified five representative stores from which 120,000 user-generated review data were collected. In order to ensure the quality of the data, data preprocessing such as deleting invalid comments, removing deactivated words, tokenization, spelling correction and lowercase conversion were performed on the data.
Stage 2: Deep learning-based text data analysis. This phase is divided into five steps to deeply analyze user reviews through text mining techniques. In the first step, the preprocessed comment data is analyzed by TF-IDF (Word Frequency-Inverse Document Frequency) to identify the key factors in user comments. In the second step, high-frequency words are visualized by generating a word cloud map to help understand users’ main concerns. In the third step, based on the keyword matrix obtained from the TF-IDF analysis, a hierarchical clustering algorithm is applied to cluster analyze the reviews, and the reviews of 12 stores are classified into different clusters to reveal the potential structure of user reviews. In the fourth step, the LDA (Latent Dirichlet Allocation) model is used to mine the potential themes in the reviews, and identify the themes mentioned by the users related to each store through the sentence-level analysis to deeply understand the specific needs and preferences of the users. In the fifth step, the sentiment analysis model based on deep learning analyzes the sentiment tendency of user reviews, determines the positive, negative or neutral sentiment of the reviews, and applies the results of the sentiment analysis to practical scenarios, such as product improvement or user satisfaction evaluation.
Stage 3: Data-driven conclusion and discussion. On the basis of the second stage, corresponding conclusions are drawn, and the main concerns of users on e-commerce platform goods are identified through multi-angle keyword demand analysis, and their theoretical and practical implications are discussed.
The research comprehensively mines the information in user reviews through systematic data collection, deep learning and text analysis, and draws conclusions with theoretical and practical value by combining practical application scenarios. This research framework not only provides data-driven decision support for e-commerce platforms but also provides new ideas and methods for research in the field of text analysis.

2.2. Related Models

2.2.1. TF-IDF Keyword Extraction

The core information in textual data is often embedded within high-frequency keywords, and TF-IDF (Term Frequency-Inverse Document Frequency) is a statistical method used to measure the importance of words within a document [20,40,41]. It is widely applied in text mining and information retrieval. In this study, TF-IDF is employed to extract high-weighted words from user reviews on platforms such as Jingdong and Taobao, thereby identifying key consumer concerns.
TF-IDF consists of two components: Term Frequency (TF) and Inverse Document Frequency (IDF). Term Frequency (TF) represents the frequency of a specific word t appearing in a document d and is calculated using the following formula:
T F ( t , d ) = f ( t , d ) t d f ( t , d )
where f ( t , d ) represents the number of times the word t appears in document d , and the denominator denotes the total number of words in the document.
Inverse Document Frequency (IDF) is used to measure the importance of a word across the entire document corpus. Its calculation formula is as follows:
I D F ( t , D ) = log | D | 1 + | { d D : t d } |
where | D | is the total number of documents in the document set, and { d D : t d } is the number of documents containing the word t . The denominator is incremented by 1 to avoid division by zero errors.
Finally, the TF-IDF value is calculated as follows:
T F I D F ( t , d , D ) = T F ( t , d ) × I D F ( t , D )
After performing text preprocessing on user reviews (such as removing stopwords, tokenization, and eliminating special characters), this study calculates the TF-IDF values and visualizes the important keywords to reveal consumers’ key concerns regarding furniture products.

2.2.2. Hierarchical Clustering

Hierarchical clustering is an unsupervised learning method that constructs a tree-like hierarchical structure (dendrogram) to reveal the semantic relationships within review data [42,43,44]. In this study, user review texts are first represented as TF-IDF vectors, and then the similarity between texts is computed based on these vectors. Cosine similarity is a commonly used metric for measuring text similarity, and its calculation formula is as follows:
cos ( θ ) = i = 1 n A i B i i = 1 n A i 2 i = 1 n B i 2
where A and B represent the TF-IDF vectors of two reviews, and θ is the angle between them. After computing similarity, Agglomerative Hierarchical Clustering (AHC) is applied for analysis. This method starts from individual samples and progressively merges the most similar texts until a tree-like structure is formed.
In practical implementation, hierarchical clustering adopts different merging strategies, including single linkage, complete linkage, and average linkage. These methods determine how clusters are merged and directly impact the final clustering results. Single Linkage is based on the minimum distance principle, where the closest two data points between two clusters serve as the merging criterion. This approach tends to form “chain-like” structures during clustering, making it suitable for non-spherical datasets. However, it may lead to elongated cluster patterns, which can affect interpretability. Complete Linkage follows the maximum distance principle, where the farthest two data points between two clusters are used as the merging criterion. This method produces more compact and balanced clusters but may result in clustering instability when dealing with noisy data. Average Linkage calculates the average distance between all data points in two clusters as the merging criterion. This approach strikes a balance between Single Linkage and Complete Linkage, avoiding the elongated structures of Single Linkage while reducing the overly compact clustering effect of Complete Linkage.
In the specific application of hierarchical clustering, the choice of distance measurement is also a critical factor affecting clustering performance. This study adopts Euclidean Distance and Cosine Similarity as the primary metrics. Euclidean Distance measures the straight-line distance between text vectors in a high-dimensional space. It is particularly suitable for assessing the similarity between short texts, where the number of words and their frequencies significantly impact distance computation, especially in TF-IDF vector representation. The formula for Euclidean Distance is as follows:
d ( A , B ) = i = 1 n ( A i B i ) 2
where A and B represent the TF-IDF vectors of two user reviews, and n denotes the dimensionality of the word vectors. In practical analysis, Euclidean Distance may lead to high-dimensional sparsity issues when dealing with long text data. Therefore, in certain cases, Cosine Similarity is more suitable. Cosine Similarity measures text similarity based on the angle between vectors, and its formula is as follows:
cos ( θ ) = i = 1 n A i B i i = 1 n A i 2 i = 1 n B i 2
The value range of Cosine Similarity is [0, 1], where a value closer to 1 indicates higher similarity between the two texts. Compared to Euclidean Distance, Cosine Similarity can eliminate the influence of text length and focus more on semantic similarity, making it highly suitable for the text clustering tasks in this study. To enhance the stability and interpretability of hierarchical clustering, this study adopts Ward’s Method, a clustering approach based on minimizing within-cluster variance. When merging two clusters, the method selects the merging scheme that results in the smallest increase in within-cluster variance. The formula is as follows:
D ( A , B ) = | A | | B | | A | + | B | | | A ¯ B ¯ | | 2
where A and B represent the number of samples, | A | and | B | denote the centroid vectors of the clusters, and | | A ¯ B ¯ | | 2 represents the Euclidean distance between the two cluster centroids.
Furthermore, to provide a more intuitive representation of the hierarchical clustering results, this study utilizes dendrograms for visualization. A dendrogram is a hierarchical structure diagram that illustrates how data points are progressively merged into larger clusters. The horizontal axis represents different text data points, while the vertical axis indicates the similarity or distance at the point of merging. By setting a reasonable cut-off distance, the final number of clusters can be determined, allowing for an analysis of the key characteristics within each cluster. For example, in the analysis of furniture user reviews, the dendrogram can reveal the hierarchical structure of user concerns, distinguishing users who prioritize product quality from those more concerned with after-sales service, as well as uncovering the hierarchical relationships among different consumer groups regarding furniture demands.
To further enhance the performance of hierarchical clustering, this study introduces K-means initialization as an auxiliary step. Before performing hierarchical clustering, the K-means algorithm is first applied to coarsely classify the data, and then hierarchical clustering is conducted within each initial category. This approach effectively reduces the computational complexity of hierarchical clustering and improves clustering stability. By implementing this optimization strategy, we can maintain the high interpretability of hierarchical clustering while reducing computation time and improving text classification accuracy. Through these methods, we can effectively identify the demand differences among different consumer groups, reveal the structural hierarchy of furniture user concerns, and provide data-driven insights for businesses to optimize their product and service strategies.

2.2.3. Graph of Words-Latent Dirichlet Allocation (GoW-LDA) Topic Modeling

LDA (Latent Dirichlet Allocation) is a probabilistic topic model that can extract hidden topic structures from large-scale text data. LDA assumes that each document is generated by a probabilistic distribution of multiple topics, and each topic consists of a probabilistic distribution of different words. The mathematical model of LDA can be expressed as follows:
p ( w | z ) = n = 1 N p ( w n | z n ) p ( z n | θ )
where w n represents the n -th word in the document, z n denotes the topic to which the word belongs, p ( w n | z n ) represents the probability of generating word w n under topic z n , and p ( z n | θ ) is the topic distribution of the document.
LDA employs the Gibbs Sampling method to estimate topic distributions. In this study, LDA modeling is used to perform topic analysis on user reviews, identifying key consumer concerns and their differences across different platforms. This provides valuable insights for the improvement of furniture products.
Graphs are essential visualization and analytical tools. Nodes and edges within a network or graph clearly reflect objects and relationships within the network. Recently, considerable research has integrated graph-mining techniques with natural language processing by extracting concepts or terms from textual data as graph nodes, with their relationships forming edges. Text is converted into language networks or text graphs, and the text relationships are analyzed through graph or network mining methods inspired by social network analysis techniques [45,46]. The authors in [47] proposed a textual network modeling approach called “Graph of Words” (GoW).
Based on the assumption that shorter distances between words indicate stronger relevance (GoW), the unstructured text data are converted into structured text networks carrying structural information, capturing the sequential order and contextual dependency between word pairs. Guided by this feature-modeling concept, before conducting LDA modeling, features from the text are initially extracted as nodes in a graph network, where relationships between two features define edges in the graph. The direction of each edge is determined according to the order of appearance of words within a sentence, and the edge weights are determined by the frequency of co-occurrence. Consequently, a weighted directed text feature network is constructed.
The text network graph itself inherently possesses rich statistical features, describing the characteristics of the network structure and the significance of nodes (features) within it. To comprehensively capture both feature semantics and structural sequential dependencies, this paper adopts an enhanced node degree centrality algorithm, which integrates edge weight information. The computation of weights of feature words utilized in the subsequent modified LDA modeling is thus as follows:
W k = i = 1 n D k i × W k i + j = 1 m D k j × W k j k = 1 N i = 1 n D k i × W k i + j = 1 m D k j × W k j
where N denotes the total number of feature words, k represents the k -th feature word, D k i denotes the first-order incoming relationship for the k -th feature word, W k i represents the weight of this incoming edge, n represents the depth of the feature-word connection, D k j denotes the first-order outgoing relationship for the k -th feature word, W k j represents the weight of this outgoing edge, and W k j indicates the active weight of the given feature word, representing its likelihood of being selected. By constructing a semantic text network graph to obtain weighted values for feature words, this approach integrates textual semantic structure and relevance into the LDA topic modeling process in a modified form (Illustrated in Figure 2). Consequently, the resulting topic identification achieves enhanced semantic coherence and improved accuracy.

2.2.4. BERT-Based Sentiment Analysis

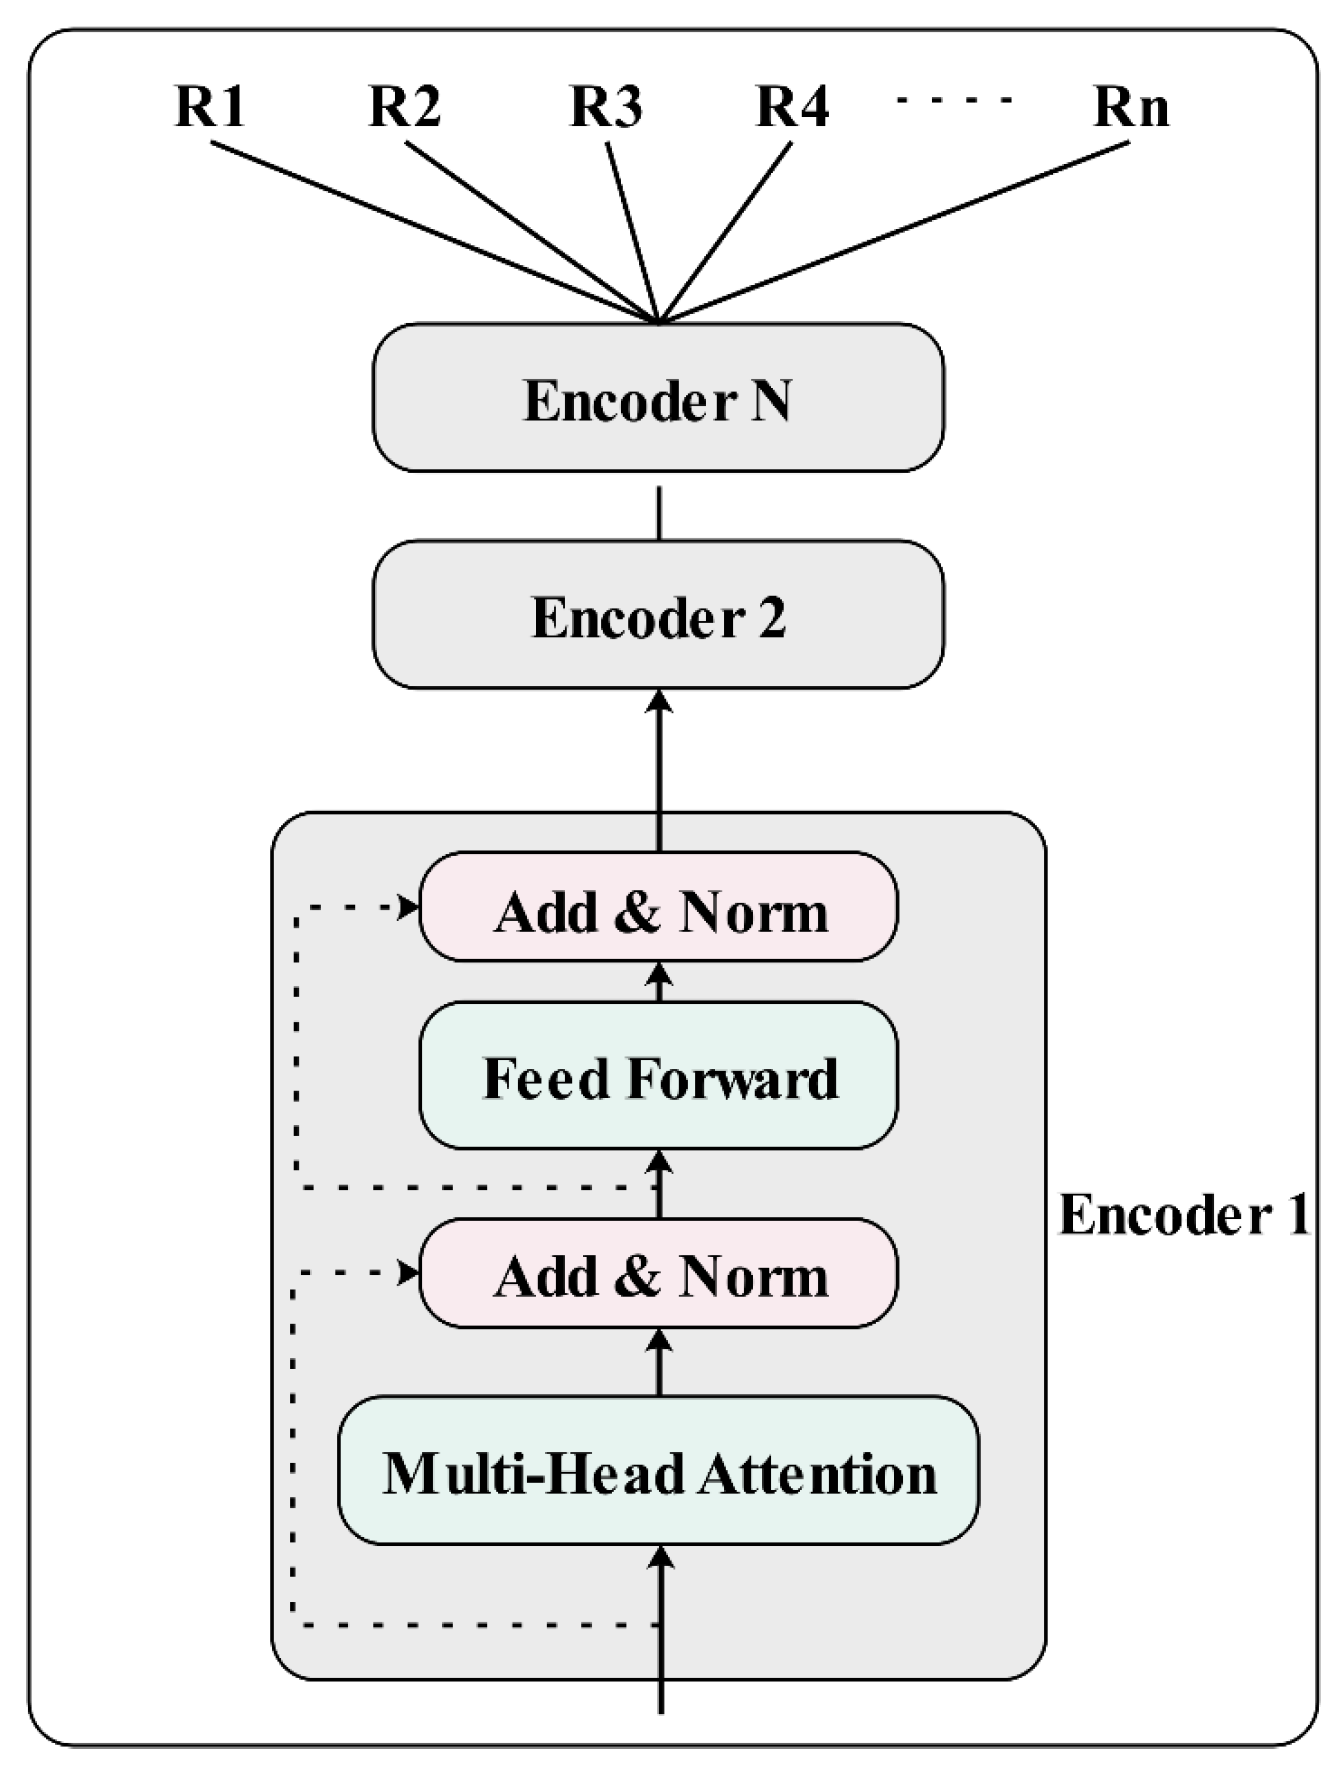
Bidirectional Encoder Representations from Transformers (BERT), introduced by [48], represents a significant advancement in natural language processing (NLP). It utilizes transformer architecture with multi-headed self-attention mechanisms (as shown in Figure 3), enabling the model to understand context from both preceding and following words simultaneously, which is particularly advantageous for tasks requiring contextual comprehension, such as sentiment analysis.
Formally, given an input sequence of tokens X = x 1 , x 2 , , x n   , BERT first maps each token x i to its corresponding embedding representation e i . Subsequently, positional embeddings are added to preserve sequential information:
H 0 = e 1 + p 1 , e 2 + p 2 , , e n + p n
where p n denotes the positional embedding corresponding to the token position.
The transformer layers in BERT then iteratively transform these embeddings through multiple self-attention layers and feed-forward neural networks:
H l = TransformerLayer H l 1 , l 1 , L
where L is the total number of transformer layers.
For sentiment analysis, a special classification token ( C L S ) is prepended to the input sequence. The final hidden state corresponding to this classification token h [ C L S ] L is used as the aggregate representation for the entire input text. A sentiment classifier (typically a fully connected neural network followed by a softmax activation) is subsequently applied:
y ^ = softmax W h [ C L S ] L + b
where y ^ is the predicted sentiment label distribution, W and b are learnable parameters, and the softmax function is defined as:
softmax z i = e z i j e z j
The entire model is fine-tuned end-to-end on sentiment-labeled datasets by minimizing the cross-entropy loss function:
L = k = 1 K y k log y ^ k
where y k represents the ground truth label for class k , and K denotes the total number of sentiment classes.
This BERT-based sentiment analysis approach leverages pre-trained contextual knowledge to effectively capture nuanced linguistic features, resulting in superior performance compared to traditional sentiment classification methods.

3. Data Collection and Pre-Processing

This study collected a total of 91,055 user online review data from five major furniture stores (including listed companies such as Lin Shi, Yuan Shi, Quan You, and Yuan Shi Yao Su) on 2 e-commerce platforms, Taobao and Jingdong (as shown in Table 1). There are two main reasons for choosing these platforms as data sources: first, these platforms have large user groups and massive user reviews from different e-commerce dimensions, which provide researchers with a rich and extensive information base; second, these platforms implement strict review release and management mechanisms, which can ensure the authenticity and quality of the data to a certain extent. For example, both Taobao and Jingdong employ advanced algorithms to identify and filter fake reviews and allow users to report suspicious content, thus improving the reliability of review data. Therefore, online reviews on these platforms can be considered valid and suitable as a source of research data.
There are three main reasons for choosing these five stores. First, they represent different product types and design styles in the field of furniture, covering a wide range of styles from modern simplicity to traditional classics, which can reflect the diversified needs of consumers for furniture. Second, the products of these stores have high visibility and user base in the market, which can provide a lot of real user feedback and help us better understand consumers’ experience and satisfaction with furniture. Third, the products of these stores cover different price ranges and functional characteristics, providing a comprehensive perspective for studying the market performance and user preferences of furniture. For example, Lin shi mu yu is known for its cost-effective and multi-functional design, while Source Furniture is favored by users for its high-end customization and intelligent experience.

4. Analysis of Results

4.1. TF-IDF Results

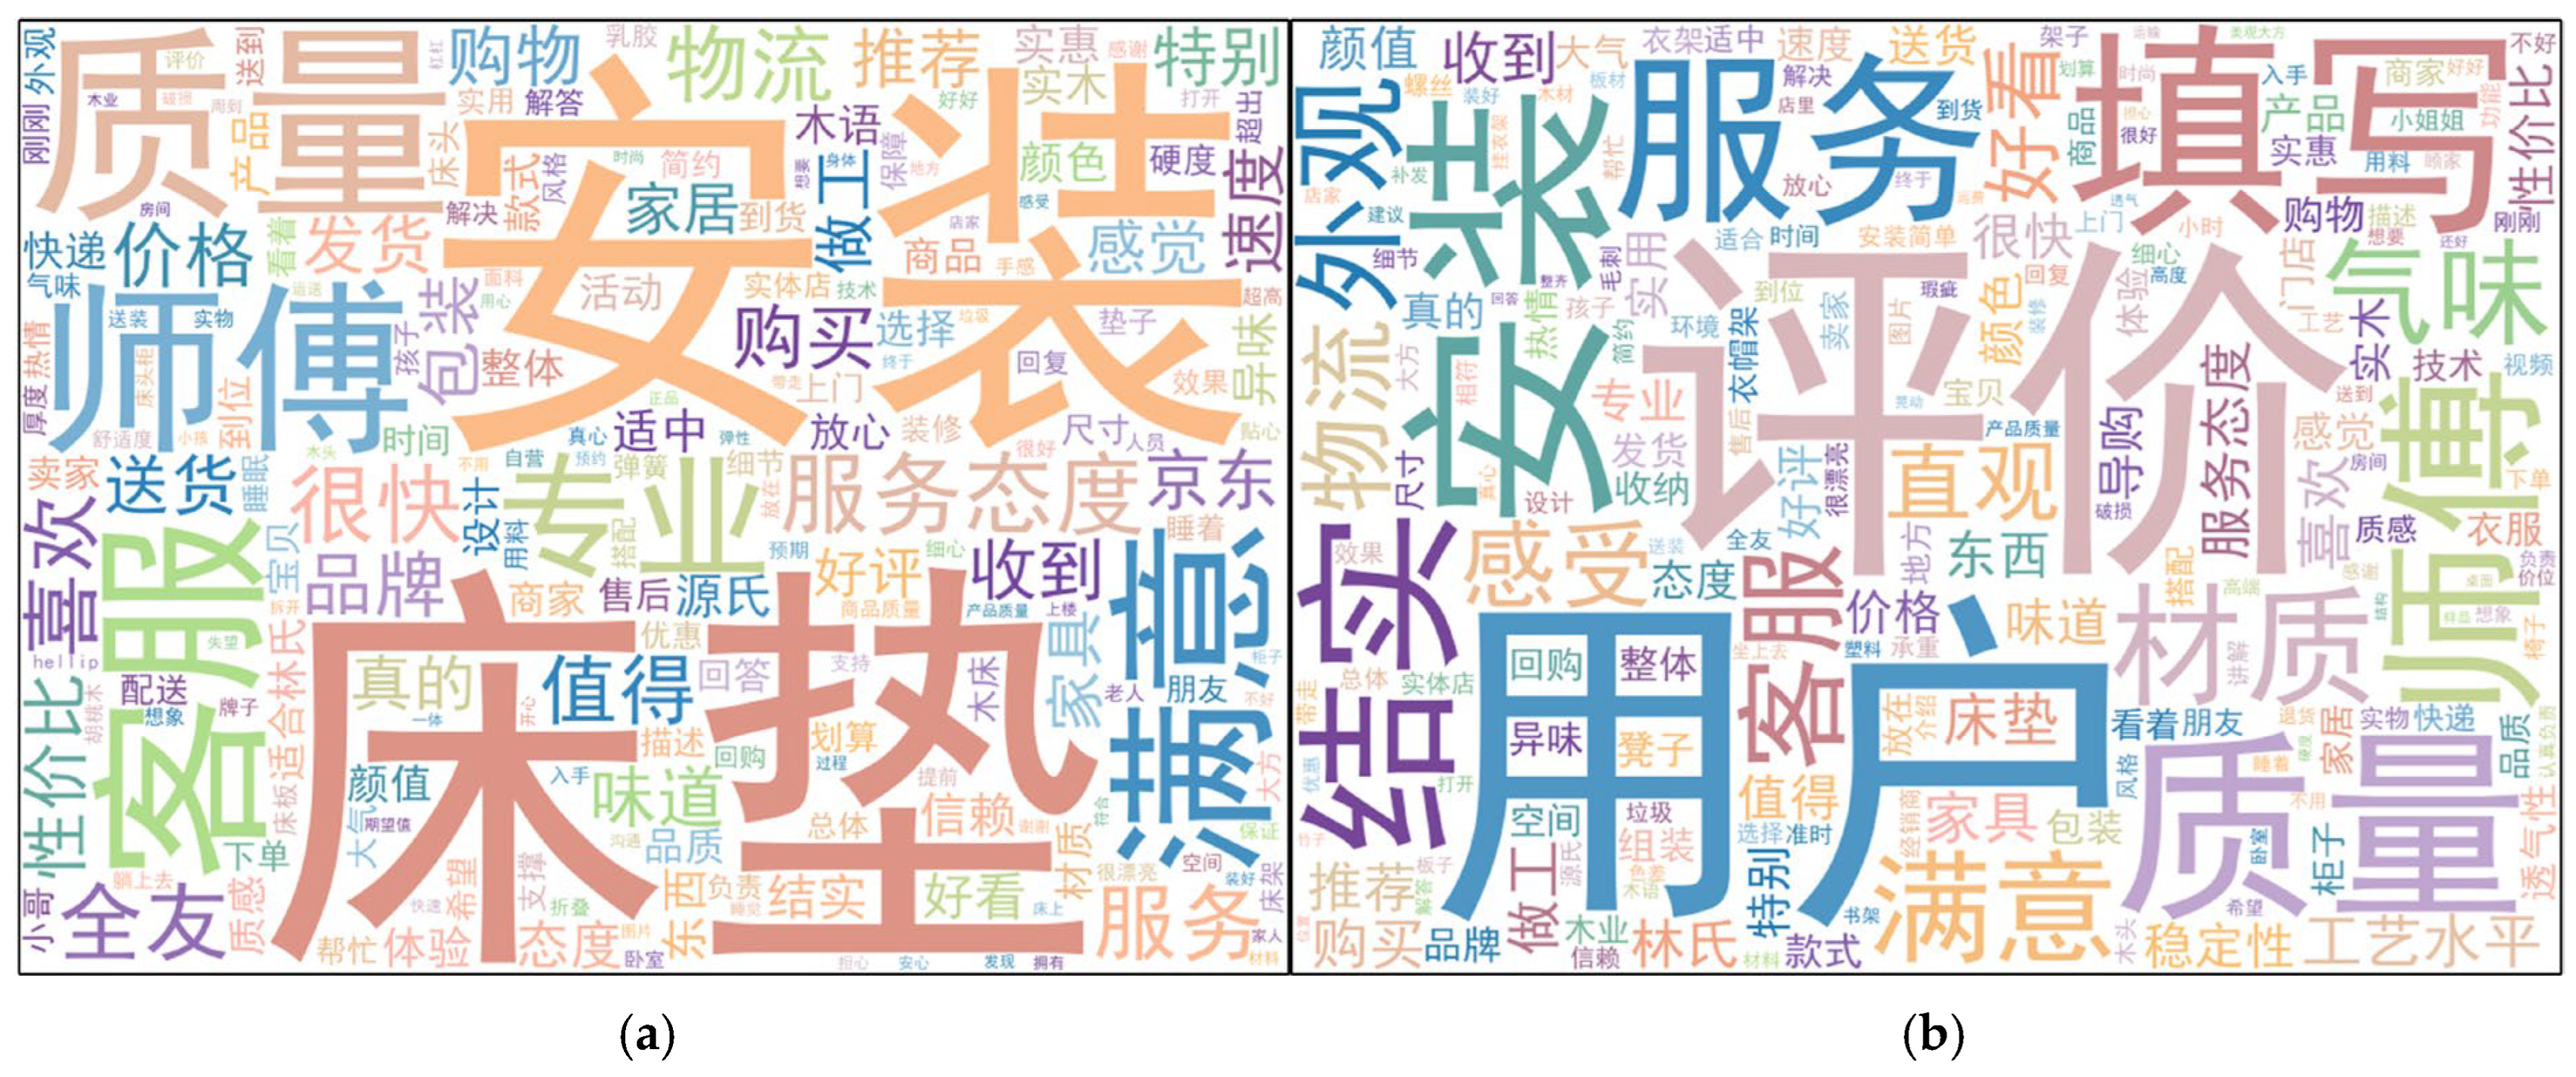
After applying the TF-IDF algorithm to the furniture review datasets from Jingdong and Taobao, a set of keywords are extracted based on the weighted frequency of the products, which reflect the main concerns and preferences of consumers when purchasing furniture. As shown in Figure 4 (the Chinese translation of Figure 4 is shown in Table 2), by arranging and normalizing these keywords in descending order, the most important terms related to furniture products can be identified. The most important words extracted from the TF-IDF analysis are effectively represented using WordCloud visualization, where a larger font size indicates a higher weight, thus presenting the important terms in a visually appealing way.
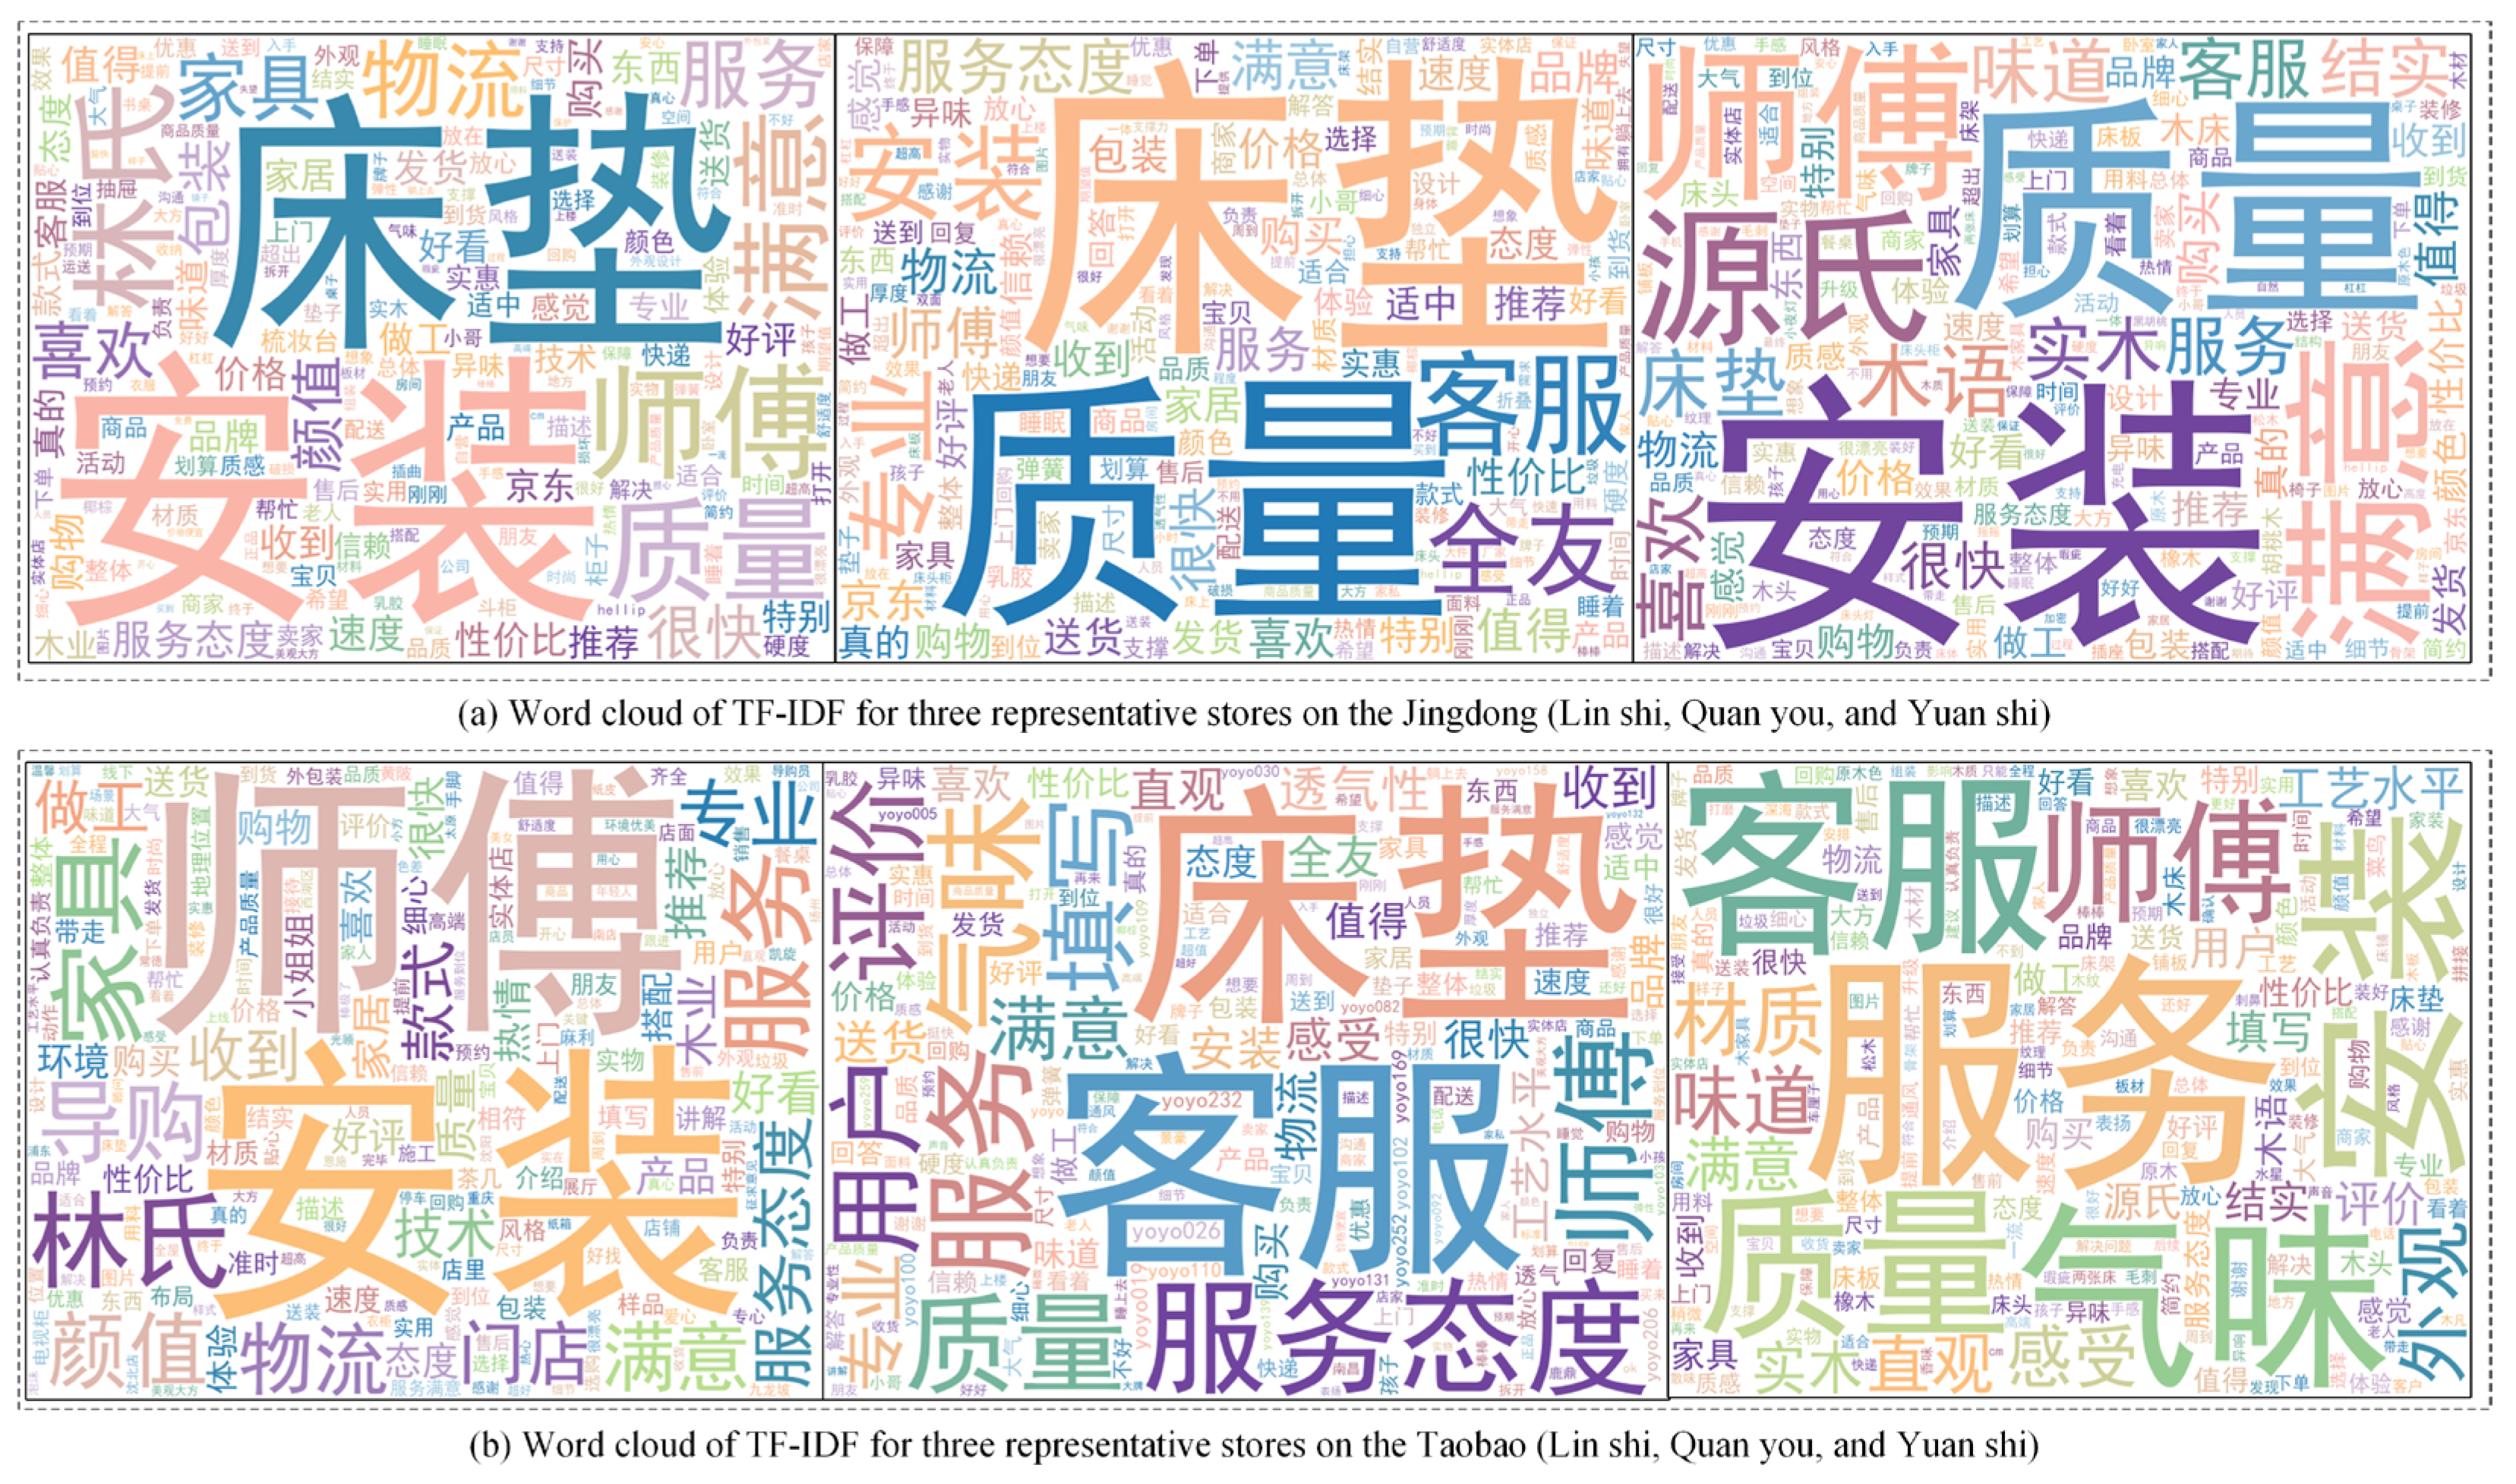
As shown in Figure 5 (the Chinese translation of Figure 5 is shown in Table 3), Jingdong’s analysis shows that consumers’ attention to furniture products is mainly focused on installation services, customer service quality, logistics speed and cost-effectiveness. The prominence of these keywords indicates that consumers attach great importance to the installation service and customer service quality of furniture and also expect fast logistics service and cost-effective products. In addition, brand reputation is also an important factor for consumers to consider in their purchasing decisions.
Taobao’s wordcloud reveals other consumer concerns about furniture products, such as product quality, exterior design and material selection. These keywords show that consumers are not only concerned about the functionality of furniture, but also appreciate its exterior design and material choices, which highlights the balance between aesthetics and practicality. In addition, behaviors related to the use of furniture, such as installation and operation, as well as services provided by the product, such as after-sales and warranty, were also mentioned as keywords, which implies that the dataset contains discussions about the practical aspects of purchasing and using furniture.
Synthesizing the results of the analysis of these three platforms, it can be found that when purchasing furniture, consumers not only pay attention to the basic function and quality of the product, but also pay attention to the quality of the service and experience during the purchase process, as well as the appearance and design of the product. Together, these factors influence consumers’ purchasing decisions and brand loyalty. Through these analyses, furniture manufacturers and sellers can better understand consumer needs and expectations, so that they can optimize product design, improve service quality, and develop more effective marketing strategies to meet market demand and enhance brand image.

4.2. Results of Hierarchical Clustering

This study on semantic analysis of text data from different platforms aims to mine the intrinsic connection between words by technical means. First, the TF-IDF algorithm is utilized to extract keywords from the massive text and screen out the words that are representative and important in each platform. Subsequently, these keywords are transformed into high-dimensional vectors with the help of Word2Vec technology, and endowed with semantic and syntactic quantitative features, so that the similarity between words can be accurately measured. On this basis, the word vectors are deeply analyzed using hierarchical clustering methods to construct the hierarchical structure of the words, thus revealing the semantic associations and thematic distributions of the words in the texts of different platforms. This method not only makes up for the limitations of traditional TF-IDF but also provides a more detailed and comprehensive perspective for semantic analysis of text data through the dynamics of hierarchical clustering.
A dendrogram for hierarchical clustering is a visualization method to show the similarity between data points, where each leaf node represents a word, and the degree of similarity between words is shown by the merging distance represented by the vertical axis. The smaller the distance, the more similar the words are. Branches of different colors represent different clusters to help identify the clustering relationships of words. By setting a distance threshold, the dendrogram can be cut to determine the number of clusters, revealing the theme of the text or the characteristics of the product.
Figure 6 and Table 3 depicts the results of the clustering analysis of the main words in the consumer reviews on the Jingdong platform, with each category mainly expressing the different concerns and evaluations of consumers in the shopping experience. From Figure 6, it is obvious that the results are divided into five categories. The first category of words relates to consumers’ overall satisfaction and evaluation of products or services, including the evaluation of product quality, price, shopping experience, and seller or merchant services, which reflects consumers’ expectations of the purchased goods and the degree of satisfaction after actually receiving the goods. The second category of words is mainly related to logistics and delivery services, covering the whole process from ordering to receiving, such as delivery speed, logistics services, packaging quality, door-to-door installation services and after-sales services, reflecting consumers’ concern and evaluation of logistics efficiency and service quality. The third category of words is related to brand trust and purchase decision, including consumers’ trust in the brand, willingness to recommend, and purchase choices, showing consumers’ trust and recognition of a specific brand or home furniture. The fourth category of words describes the appearance and material of the product, covering product features such as design, material, color and workmanship, as well as consumers’ evaluation of the appearance and texture of the product, reflecting consumers’ concern for the aesthetics and practicality of the product. The fifth category of words focuses on the use experience and applicability of the product, covering product hardness, the appropriateness of the size and overall comfort, reflecting consumers’ evaluation of whether the product meets their personal needs and comfort. These word categories in Jingdong reviews reflect consumers’ concerns and evaluations of product quality, logistics services, brand trust, product design, and use experience during the shopping process.
Figure 7 and Table 4 depicts the results of the clustering analysis of the main words in Taobao platform consumer reviews, from which it is clear that the results are divided into six categories, each reflecting a different focus of consumers in the shopping experience. Words in the first category, such as “really”, “like”, “affordable”, etc., directly express consumers’ satisfaction and personal preference for goods or services. The second category includes “recommend”, “buy” and “brand”, which reveal consumers’ recognition of product quality and brand value as well as their purchasing decisions. The third category, such as “merchants”, “positive feedback” and “logistics”, involves consumers’ evaluation of merchant services and logistics during the shopping process. The fourth category centers around words like “customer service”, “passion”, “service”, etc., focusing on consumers’ feelings about customer service attitude and professionalism. The fifth category contains only the words “experience” and “satisfaction”, which summarizes consumers’ subjective evaluation of the overall shopping experience. The last category describes specific product features, such as “flavor”, “material”, and “value”, reflecting consumers’ specific feedback on the product’s appearance, texture, and functionality. Together, these words paint a complete picture of consumers’ evaluation of the product from purchase to after use, covering a variety of dimensions such as personal emotion, brand loyalty, service experience and product features.

4.3. GoW-LDA Results

As e-commerce platforms flourish, Jingdong and Taobao have attracted a large number of users with their unique market positioning and service models. Jingdong is known for its high-quality goods and efficient logistics, attracting consumers who focus on quality and service, while Taobao, with its rich and diverse goods and flexible pricing strategy, has become the first choice of consumers who pursue cost-effective and personalized choices. In order to better understand users’ needs and experiences on different platforms, this study analyzes user feedback on Jingdong and Taobao with GoW-LDA themes. The core themes are extracted from the massive number of comments through GoW-LDA, revealing users’ concerns and differences in product quality, service experience, and value for money. This kind of comparative analysis not only helps brands and merchants to accurately grasp user needs but also provides data support for optimizing product strategies and improving service quality, so as to better satisfy consumers and enhance brand competitiveness in the fierce market competition. Table 5 and Table 6 show the corresponding analysis results, respectively.
As can be seen from Table 5, in the current market competition with relatively transparent information, product quality and user experience are undoubtedly the key to brand success. From the point of view of user feedback, the evaluation of product quality shows a diversified trend. On the one hand, many users spoke highly of the product’s appearance, design and materials, especially the product’s color, texture and overall effect, and the careful design of these details won wide recognition from users. For example, some users mentioned that the “texture” and “overall effect” of the products were satisfactory, which shows that the brand has achieved remarkable results in detail control. However, some users were also dissatisfied with the quality of the products, especially the odor and workmanship details, which may affect the user experience and even lead to disappointment. This reflects that in terms of product quality control, there are still some details that need to be further optimized to ensure that the products can fully meet users’ expectations.
Meanwhile, service experience occupies an extremely important position in user satisfaction. Users spoke highly of the professionalism of customer service, the efficiency of logistics and the convenience of installation services. For example, many users mentioned the “professionalism” and “service attitude” of customer service, as well as the “quickness” and “speed” of logistics. These all show that the brand has formed a good reputation in the service sector. Especially the installation service, users are satisfied with the professionalism and service efficiency of the installer, which not only enhances the user experience, but also strengthens the brand’s trust in the hearts of users. In addition, the brand’s performance on e-commerce platforms has also been recognized by users, such as Jingdong’s door-to-door service and fast delivery, which provide users with a convenient shopping experience. This quality service experience not only enhances user satisfaction, but also promotes the long-term development of the brand, as users are more willing to choose those brands that can provide a full range of quality services.
In terms of price and value for money, users show a high level of concern. Many users will compare the price of online products with brick-and-mortar stores when purchasing products, and they expect to obtain high-quality products within a reasonable price range. Therefore, brands need to optimize their pricing strategies to meet users’ expectations of value for money. At the same time, brands can further enhance user acceptance of price by improving product quality and service experience. For example, by offering more promotions and value-added services, brands can increase user satisfaction and loyalty while remaining competitive.
Logistics and distribution, as an important part of the shopping experience, has also received extensive attention from users. Users were more positive about the speed of logistics and the quality of packaging, and they were satisfied with the fast logistics and distribution and the good quality of packaging. However, some users also mentioned the possibility of improper packaging or product damage during logistics, which requires brands to further optimize logistics packaging to ensure that products are not damaged during transportation. Brands can further improve logistics speed and service quality through cooperation with high-quality logistics partners, while paying attention to the details of the logistics process, such as the choice of packaging materials and protective measures during transportation, in order to reduce the negative experience of users in the logistics process.
In summary, the brand has made remarkable achievements in product quality, service experience, pricing strategy and logistics, but there are also some areas for improvement. By further optimizing product quality, strengthening service experience, focusing on product details, optimizing pricing strategy, and improving logistics experience, the brand can better meet users’ needs and enhance user satisfaction and brand competitiveness. These improvements will not only enhance users’ trust and loyalty to the brand but also lay a solid foundation for the brand’s long-term development.
The GoW-LDA analysis of user reviews on Taobao platform reveals multi-dimensional evaluations of products and services (as shown in Table 6), which cover various aspects from product quality, appearance and design to service experience and cost-effectiveness. Overall, users show high satisfaction with the shopping experience and the product itself, while also suggesting some areas for improvement. Specifically, first of all, users’ overall satisfaction with the shopping process is high, which is reflected in their anticipation of receiving the goods as well as their positive comments on the shopping experience. Many users mentioned words such as “satisfied”, “received”, “shopping”, “goods”, etc., which showed their affirmation of the whole shopping process. Many users mentioned words such as “satisfied”, “received”, “shopping”, “goods”, etc., showing their affirmation of the whole shopping process. Meanwhile, users’ initial impression of product quality is also relatively positive, but some users also mentioned the problem of product odor, which may imply that there is still room for improvement in product quality control. In addition, users are very concerned about price and value for money, and they want to obtain high-quality products within a reasonable price range. This can be seen in the frequent mention of terms such as “price”, “affordable” and “favorable”. Users spoke highly of the product’s appearance and practicality, especially in terms of the product’s face value, color, style, and storage function. This feedback shows that users are not only concerned about the practicality of the products but also have high requirements for the visual effect and design style of the products.
In addition, in terms of service quality, users’ comments on logistics, customer service and installation services are particularly prominent. Fast logistics, professional customer service and efficient installation services are highly recognized by users. Users frequently mentioned words such as “logistics”, “service”, “customer service” and “installation”, showing the importance of these services to the user experience. This shows the importance of these service links to the user experience. In particular, logistics speed and service attitude are considered to be the key factors to improve user satisfaction. In addition, users are more positive about after-sales service, mentioning that customer service is able to solve problems in a timely manner, which further enhances users’ trust in the brand.
However, there are some areas for improvement in the user feedback. Although users have positive comments about the appearance and quality of the product, some users still mention the problem of odor, which may affect the user experience. In addition, individual users put forward higher requirements for the level of detail and craftsmanship of the product, which indicates that there is still room for improvement in the brand’s product quality control and detail polishing. Users also mentioned the experience of using the evaluation system, which may imply that the brand needs to further optimize the user feedback mechanism in order to better collect and utilize user opinions.
Overall, users showed high satisfaction with the brand’s products and services, especially in terms of product quality, exterior design, logistics and customer service support. This positive feedback has laid a good market foundation for the brand. However, users also raised some areas for improvement, such as product odor, detail optimization and improvement of the evaluation system. Brands can make targeted improvements in response to this feedback to further enhance user satisfaction and brand competitiveness. By continuously optimizing its products and services, the brand will be able to better meet user needs and win more user recognition and trust.
After GoW-LDA analysis of user feedback from both Jingdong and Taobao platforms, some commonalities as well as differences between the platforms were found. This feedback covers a wide range of user evaluations of product quality, shopping experience, service, logistics, and other aspects. First of all, the overall user satisfaction with the shopping experience is more positive on both platforms. The frequent occurrence of words such as “satisfied”, “received”, “shopping”, “quality”, etc., shows the affirmation of shopping process and recognition of product quality. However, some users also mentioned the problem of “bad odor”, which may suggest that quality control of some products could be improved. In contrast, the terms “worth”, “buy”, “recommended” and “brand” in Taobao show a high level of interest in brand and value for money. This difference may be related to the user group characteristics and platform positioning of the two platforms.
In terms of product quality, users of both platforms showed a high level of attention to detail. Jingdong’s users gave high marks to the material, design and functionality of the product. Terms such as “solid wood”, “sturdy” and “design” show the importance users place on product durability and design. However, some users also mentioned the problem of “odor”, which may be a weak link in product quality control. Taobao users are more concerned about the appearance, material and practicality of the product. Words such as “good-looking”, “color”, “style” and “practicality” appear frequently. In addition, Taobao users’ reference to “cost-effective” also reflects their sensitivity to the balance between price and quality.
Service and logistics experience is another important aspect of user feedback. Jingdong’s users gave high marks to such service-related terms as “customer service”, “service attitude”, “professional” and “very fast”. This shows Jingdong’s strength in logistics and customer service. This advantage may be closely related to Jingdong’s logistics system and after-sales service strategy. Taobao users are also concerned about the speed of logistics and the quality of packaging, but they are relatively more likely to mention cost-effective terms such as “price”, “affordable” and “favorable”. This suggests that Taobao users may pay more attention to the price factor when choosing products.
Product appearance and practicality is another key point in user feedback. Whether on Jingdong or Taobao, users want products that are not only aesthetically pleasing, but also functional and practical. Users on Jingdong commented positively on the size, feel and atmospheric design of the products, while users on Taobao paid more attention to the color, style and practicality of the products. This difference may be related to the product categories and user needs of the two platforms. For example, Jingdong may be more inclined to sell high-quality home products, while Taobao covers a wider range of product types and users are more concerned about value for money.
By comparing the user feedback of the two platforms, we can find some significant differences. Service and logistics experience are high-frequency words in Jingdong’s user feedback, showing Jingdong’s strength in these areas. However, product quality issues (such as odor) also need to be taken seriously. In contrast, cost-effectiveness and price are high-frequency words in Taobao’s user feedback, showing that Taobao users are more price-sensitive. This difference may be related to the market positioning and user group characteristics of the two platforms.
Finally, all things considered, users of both Jingdong and Taobao have high expectations for product quality, service experience and value for money. Jingdong is excellent in logistics and customer service but needs to further optimize product quality control and reduce problems such as odor. Taobao users are more concerned about price and cost-effective, the platform can further optimize the price strategy to improve the user’s buying experience. For brands and merchants, no matter which platform, they need to focus on product quality and service experience, while optimizing product strategies and marketing programs according to the characteristics of platform users. For example, on the Jingdong platform, you can further improve the quality of products and service quality; on the Taobao platform, you can focus on cost-effective and brand building to meet the different needs of users. By continuously focusing on user feedback and making targeted improvements, brands and merchants can better meet user needs on both platforms and enhance user satisfaction and loyalty.

4.4. Sentiment Analysis Results

The study chooses box plots and bar charts as a comparison of the calculated results of sentiment analysis on different platforms, and these two charts can visualize the distribution and comparison of the data from different perspectives. Box plots can clearly reflect the concentration trend, the degree of dispersion, and the outliers of the sentiment scores, which is suitable for analyzing the overall distribution characteristics of the data; whereas bar charts can directly compare the proportions of different sentiment classifications (positive, neutral, and negative), which is suitable for demonstrating the differences in the categorized data.
Figure 8 shows the distribution of sentiment scores for the two platforms, Jingdong and Taobao. As can be seen from the figure, the median sentiment score value of Jingdong is slightly higher than that of Taobao, indicating that the sentiment tendency of users of Jingdong is more positive overall. At the same time, Jingdong’s sentiment score distribution is more centralized, with a smaller interquartile range, indicating that users are more consistent in their emotional evaluation of Jingdong. On the other hand, Taobao’s median sentiment score is slightly lower, and the distribution is more decentralized, with a larger interquartile range, indicating that users’ sentiment evaluations of Taobao are more varied, with both positive and negative evaluations. In addition, there are some extremes in the sentiment score values of both platforms, but overall, the score values are concentrated between 0.4 and 1.0, indicating that the majority of users have positive-sentiment evaluations of both platforms. The figure allows a visual comparison of the differences in user sentiment scores between Jingdong and Taobao, providing a basis for further analysis and decision-making.
Figure 9 shows the percentage of positive, negative and neutral reviews for both Jingdong and Taobao. As can be seen from the figure, in the positive reviews category, Jingdong’s share is slightly higher than Taobao’s, showing that a slightly larger percentage of Jingdong users give positive reviews. This could mean that Jingdong is better able to meet the needs of its users in certain areas, thus earning more positive reviews. In the category of neutral reviews, there is not much difference between Jingdong and Taobao, with both at around 20%. This suggests that the two platforms perform similarly in obtaining neutral reviews, and that there is no clear tendency for users to evaluate both platforms. In the category of bad reviews, Taobao’s share is higher than Jingdong’s, suggesting that Taobao users give a greater proportion of bad reviews. This may reflect Taobao’s shortcomings in certain areas, leading to user dissatisfaction and thus giving more negative reviews. Overall, Jingdong performs better in terms of favorable reviews, while Taobao has a higher percentage of poor reviews. In terms of medium reviews, the performance of the two platforms is closer. These data can provide a reference for e-commerce platforms to improve their services, helping them to better meet user needs and increase user satisfaction.
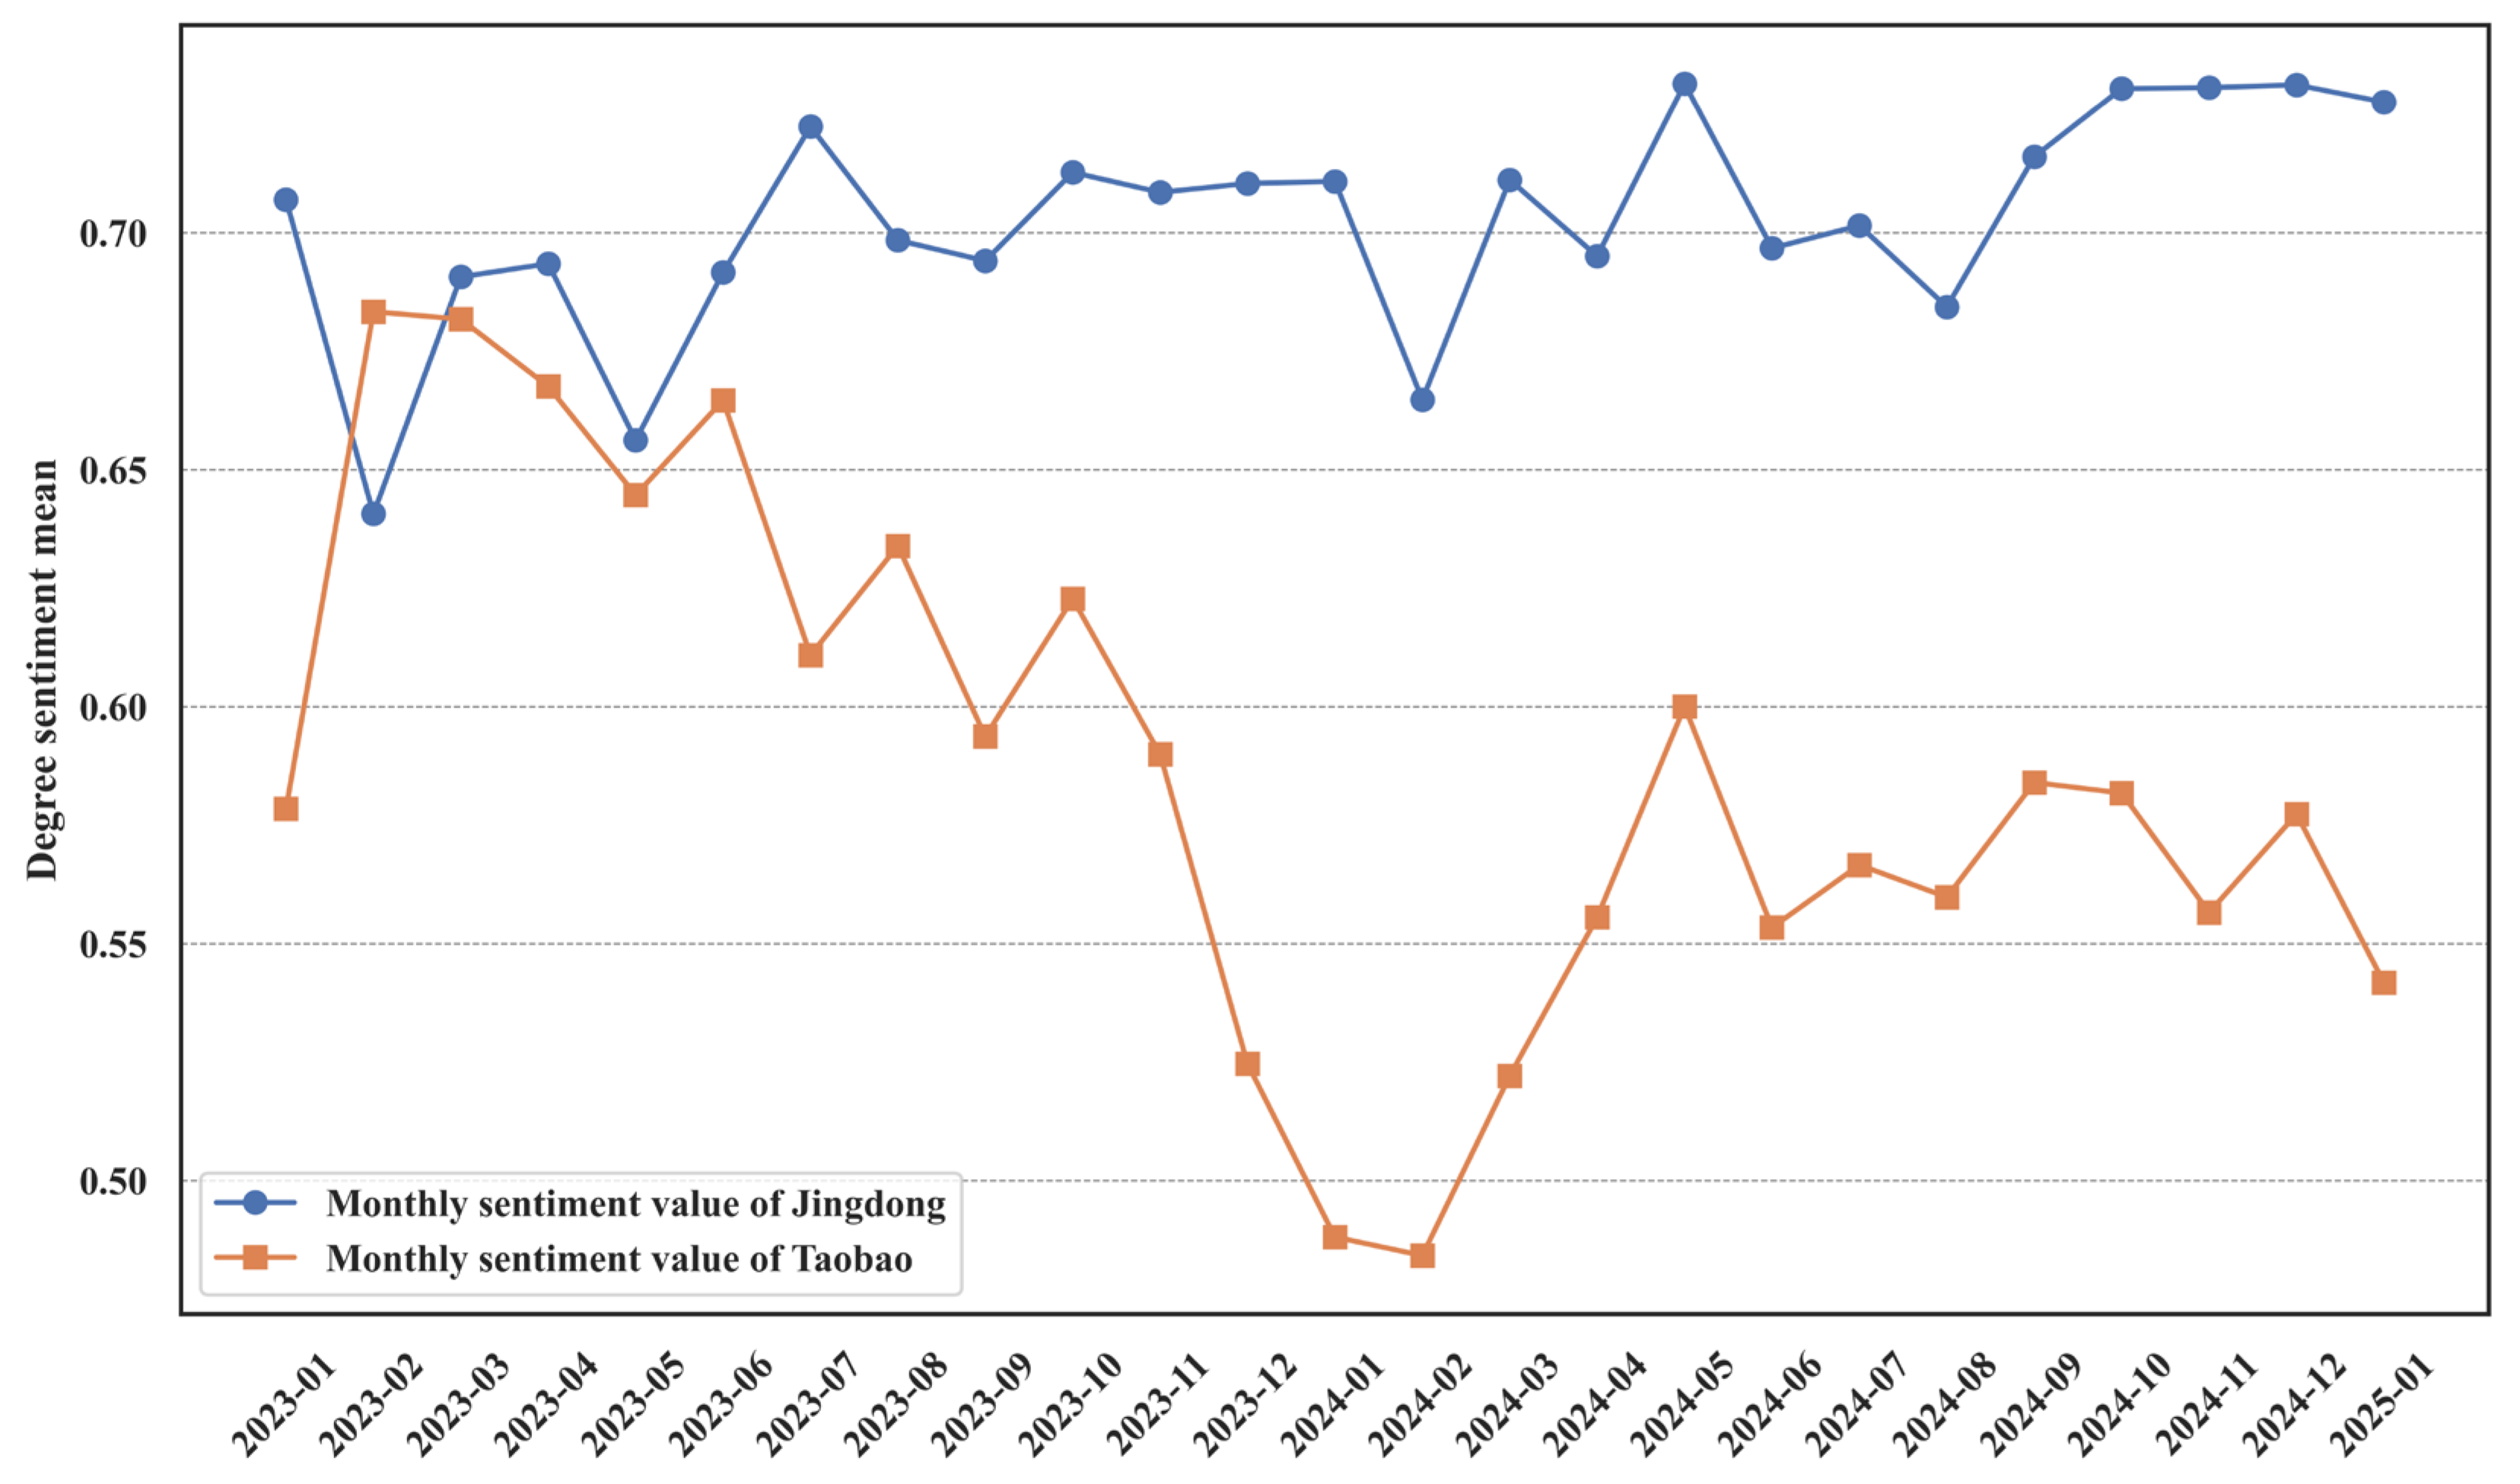
As can be seen in Figure 10, the degree sentiment mean is represented on the y-axis, ranging from 0.50 to above 0.70, while the x-axis indicates the timeline from January 2023 to January 2025. Jingdong’s sentiment value is generally high and stable, mostly fluctuating between 0.65 and 0.72. In January 2023, Jingdong’s sentiment value peaked close to 0.72, followed by minor fluctuations but overall stability. In April 2024, there was a noticeable dip in sentiment, but it quickly rebounded. In contrast, Taobao’s sentiment value is generally lower and more volatile, mostly ranging between 0.55 and 0.65. Starting at around 0.57 in January 2023, Taobao’s sentiment value peaked near 0.68 in February. However, from March onwards, there was a significant decline, reaching close to 0.50 by December. After January 2024, there was a slight recovery, but it remained consistently lower than Jingdong’s, with continued volatility.
The differences may stem from the distinct market strategies of the two platforms. Jingdong might be implementing more effective market strategies or customer service improvements, thus maintaining higher customer satisfaction and sentiment values. Taobao, on the other hand, could be facing increased market competition or internal management issues, leading to greater fluctuations in customer sentiment. Additionally, customer base and brand loyalty could also impact sentiment values. Jingdong may have a more stable customer base and higher brand loyalty, helping to sustain higher sentiment values. Taobao might be encountering challenges in attracting new customers and retaining existing ones, causing fluctuations in sentiment values.
External environmental factors, such as economic conditions, policy changes, or social events, could affect the two platforms differently. Jingdong might be better adapted to or coping with these changes, whereas Taobao could be more adversely affected, like by supply chain issues or logistics delays, impacting customer sentiment. Product and service quality are also crucial factors affecting sentiment values. Jingdong might continuously improve product and service quality, thus maintaining higher customer satisfaction. Taobao might face product quality or service delivery issues at times, leading to a decline in sentiment values.
Lastly, the effectiveness of marketing activities and promotional strategies could also influence sentiment values. Jingdong might more effectively use marketing campaigns and promotions to enhance customer sentiment. Taobao’s marketing efforts might be less effective or fail to consistently attract customers, causing sentiment value fluctuations. These factors, working together, have led to the observed differences and trends in sentiment values between the two platforms as depicted in the chart.

5. Conclusions

This study systematically analyzes user demands and market feedback on furniture products based on user review data from two major e-commerce platforms, Jingdong and Taobao. By leveraging TF-IDF, hierarchical clustering, LDA topic modeling, and BERT-based sentiment analysis, the research yields the following key findings:
Firstly, in terms of user attention analysis, TF-IDF was used to extract keywords, combined with hierarchical clustering, to identify the core concerns of consumers on different e-commerce platforms. On Jingdong, users tend to focus more on installation services, delivery speed, customer service quality, and brand reputation, reflecting the platform’s emphasis on high-quality services and reliability. In contrast, Taobao users prioritize product quality, aesthetic design, material selection, and cost-effectiveness, indicating their sensitivity to personalization and price-performance ratio in purchasing decisions. Additionally, due to the nature of social commerce on the Douyin platform, users are particularly influenced by the visual appeal of furniture, style compatibility, and endorsements from influencers, highlighting their preference for emotional and experience-driven consumption.
Secondly, in the analysis of user review topics, LDA topic modeling was employed to extract the primary discussion themes related to furniture products. This study identified six core categories: product quality and materials, pricing and cost-effectiveness, logistics and delivery, after-sales service and installation experience, brand trust, and overall shopping experience. The findings indicate that consumers of furniture are not only concerned with the functionality and aesthetics of the products but also place significant emphasis on logistics and service quality throughout the purchasing process. Notably, the convenience of the installation process has a substantial impact on user satisfaction. Furthermore, the market segmentation of furniture is relatively distinct—high-end-brand consumers prioritize material quality and design, whereas mass-market consumers focus more on affordability and practicality.
Thirdly, in the aspect of user sentiment analysis, this study employed the BERT model to classify the sentiment polarity of user reviews. The findings reveal that Jingdong exhibits the highest proportion of positive-sentiment reviews, with users highly praising its logistics efficiency and service quality. On Taobao, sentiment distribution is relatively balanced—while positive reviews are predominant, negative feedback mainly stems from discrepancies between product quality and actual user experience. In contrast, sentiment on Douyin demonstrates significant fluctuations, as user evaluations are strongly influenced by social media marketing and product presentation. Some consumers experience a notable expectation gap after purchase, leading to a higher proportion of negative-sentiment feedback. These results suggest that shopping experiences vary across different e-commerce platforms, highlighting the need for brands to optimize user experience based on platform-specific characteristics to enhance customer satisfaction.
Although this study has achieved significant progress in analyzing user reviews across multiple e-commerce platforms, several areas warrant further research. First, this study primarily relies on static user review data, whereas consumer preferences are dynamic and evolve over time. Future research could incorporate time series analysis to explore trends in consumer demand and predict future market developments. Second, the sentiment analysis in this study is based mainly on individual review texts. However, user sentiment is often influenced by pre-purchase expectations, post-purchase experiences, and long-term brand loyalty. Future research could integrate users’ historical behavior data to gain a more comprehensive understanding of sentimental evolution. Additionally, this study focuses on textual data, whereas user feedback on e-commerce platforms also includes multimodal data such as images and videos. Future research could leverage computer vision techniques to analyze sentiment expressions in image-based reviews and short video content, thereby constructing a more holistic model for understanding furniture user demands. Finally, with advancements in artificial intelligence and big data technologies, future research could explore how reinforcement learning and causal inference methods can be effectively applied to user review data to uncover deeper causal relationships. Identifying which product features or service factors have a decisive impact on user satisfaction could help furniture companies develop more forward-looking product strategies and market approaches. This would enable businesses to better adapt to evolving consumer needs and maintain a competitive edge in an increasingly dynamic market environment.

Author Contributions

Y.S. and M.L.: Idea, Conceptualization, Methodology, Writing—review & editing. Y.S. and E.Z.: Software, Visualization, Writing—original draft. All authors provided critical feedback and helped shape the research, analysis and manuscript. All authors have read and agreed to the published version of the manuscript.

Funding

This work was partly supported by the Fundamental Research Funds for the Central Universities (2025QN1164).

Institutional Review Board Statement

Not applicable.

Informed Consent Statement

Not applicable.

Data Availability Statement

Dataset available on request from the authors.

Conflicts of Interest

The authors declare no conflicts of interest.

References

  1. Yu, Y.; Wang, X.; Zhong, R.Y.; Huang, G.Q. E-Commerce Logistics in Supply Chain Management: Implementations and Future Perspective in Furniture Industry. Ind. Manag. Data Syst. 2017, 117, 2263–2286. [Google Scholar] [CrossRef]
  2. Fahmy, H. How Technological Emergence, Saturation, and Rejuvenation Are Re-Shaping the e-Commerce Landscape and Disrupting Consumption? A Time Series Analysis. Appl. Econ. 2021, 53, 742–759. [Google Scholar] [CrossRef]
  3. Zerbini, C.; Bijmolt, T.H.A.; Maestripieri, S.; Luceri, B. Drivers of Consumer Adoption of E-Commerce: A Meta-Analysis. Int. J. Res. Mark. 2022, 39, 1186–1208. [Google Scholar] [CrossRef]
  4. Almutairi, O.; Almarhabi, K. Investigation of smart home security and privacy: Consumer perception in Saudi Arabia. Int. J. Adv. Comput. Sci. Appl. 2021, 12, 614–622. [Google Scholar] [CrossRef]
  5. Zhou, C.; Huang, T.; Luo, X.; Kaner, J.; Fu, X. Recognition and Analysis of an Age-Friendly Intelligent Sofa Design Based on Skeletal Key-Points. Int. J. Environ. Res. Public Health 2022, 19, 11522. [Google Scholar] [CrossRef]
  6. Zheng, K.; Huo, X.; Jasimuddin, S.; Zhang, J.Z.; Battaïa, O. Logistics Distribution Optimization: Fuzzy Clustering Analysis of e-Commerce Customers’ Demands. Comput. Ind. 2023, 151, 103960. [Google Scholar] [CrossRef]
  7. Khan, H.R.; Ahmed, W.; Masud, W.; Alam, U.; Arshad, K.; Assaleh, K.; Qazi, S.A. Design and Experimental Results of an AIoT-Enabled, Energy-Efficient Ceiling Fan System. Sustainability 2024, 16, 5047. [Google Scholar] [CrossRef]
  8. Alzate, M.; Arce-Urriza, M.; Cebollada-Calvo, J.-J. Online Reviews and Product Sales: The Role of Review Visibility. J. Theor. Appl. Electron. Commer. Res. 2020, 16, 638–669. [Google Scholar] [CrossRef]
  9. Huang, M.; Pape, A.D. The Impact of Online Consumer Reviews on Online Sales: The Case-Based Decision Theory Approach. J. Consum. Policy 2020, 43, 463–490. [Google Scholar] [CrossRef]
  10. Varga, M.; Albuquerque, P. The Impact of Negative Reviews on Online Search and Purchase Decisions. J. Mark. Res. 2023, 61, 803–820. [Google Scholar] [CrossRef]
  11. Liu, H.; Jayawardhena, C.; Osburg, V.; Babu, M.M. Do Online Reviews Still Matter Post-Purchase? Internet Res. 2019, 30, 109–139. [Google Scholar] [CrossRef]
  12. Liu, Y.; Jiang, C.; Zhao, H. Assessing Product Competitive Advantages from the Perspective of Customers by Mining User-Generated Content on Social Media. Decis. Support Syst. 2019, 123, 113079. [Google Scholar] [CrossRef]
  13. Zhong, Q.; Liang, S.; Cui, L.; Chan, H.K.; Qiu, Y. Using Online Reviews to Explore Consumer Purchasing Behaviour in Different Cultural Settings. Kybernetes 2019, 48, 1242–1263. [Google Scholar] [CrossRef]
  14. Oh, Y.K.; Yi, J. Asymmetric Effect of Feature Level Sentiment on Product Rating: An Application of Bigram Natural Language Processing (NLP) Analysis. Internet Res. 2022, 32, 1023–1040. [Google Scholar] [CrossRef]
  15. Gulten, A.; Yildirim, B.; Unal, M. Analysis of the Historically Compatibility of AI-Assisted Urban Furniture Design Using the Semantic Differentiation Method: The Case of Elazığ Harput. Sustainability 2025, 17, 3402. [Google Scholar] [CrossRef]
  16. Wu, I.C.; Yu, H.K. Sequential Analysis and Clustering to Investigate Users’ Online Shopping Behaviors Based on Need-States. Inf. Process. Manag. 2020, 57, 102323. [Google Scholar] [CrossRef]
  17. Geetha, M.P.; Karthika Renuka, D. Deep Learning Architecture towards Consumer Buying Behaviour Prediction Using Multitask Learning Paradigm. J. Intell. Fuzzy Syst. 2024, 46, 1341–1357. [Google Scholar] [CrossRef]
  18. Ho, H.F. A Novel Approach for Exploring Channel Dependence of Consumers’ Latent Shopping Intent and the Related Behaviors by Visualizing Browsing Patterns. Data Technol. Appl. 2021, 55, 715–733. [Google Scholar] [CrossRef]
  19. Alantari, H.J.; Currim, I.S.; Deng, Y.; Singh, S. An Empirical Comparison of Machine Learning Methods for Text-Based Sentiment Analysis of Online Consumer Reviews. Int. J. Res. Mark. 2022, 39, 1–19. [Google Scholar] [CrossRef]
  20. Kim, S.W.; Gil, J.M. Research Paper Classification Systems Based on TF-IDF and LDA Schemes. Hum. Centric Comput. Inf. Sci. 2019, 9, 30. [Google Scholar] [CrossRef]
  21. Zhou, Z.; Qin, J.; Xiang, X.; Tan, Y.; Liu, Q.; Xiong, N.N. News Text Topic Clustering Optimized Method Based on TF-IDF Algorithm on Spark. Comput. Mater. Contin. 2020, 62, 217–231. [Google Scholar] [CrossRef]
  22. Rachana Harish, A.; Liu, X.L.; Li, M.; Zhong, R.Y.; Huang, G.Q. Blockchain-Enabled Digital Assets Tokenization for Cyber-Physical Traceability in E-Commerce Logistics Financing. Comput. Ind. 2023, 150, 103956. [Google Scholar] [CrossRef]
  23. Abouelela, A.S.; Al-Saud, K.; Mahmoud, I.; Moneim, D.A.A.; AlAli, R.; Ali, M.A.M. Towards a Sustainable Cultural Identity for Arabic Calligraphy in Furniture Design Through Artificial Intelligence Applications. Sustainability 2025, 17, 4047. [Google Scholar] [CrossRef]
  24. Ruangkanjanases, A.; Hariguna, T. Exploring the Synergy of Guided Numeric and Text Analysis in E-Commerce: A Comprehensive Investigation into Univariate and Multivariate Distributions. PeerJ Comput. Sci. 2024, 10, e2288. [Google Scholar] [CrossRef]
  25. Huang, W.; Lin, M.; Wang, Y. Sentiment Analysis of Chinese E-Commerce Product Reviews Using ERNIE Word Embedding and Attention Mechanism. Appl. Sci. 2022, 12, 7182. [Google Scholar] [CrossRef]
  26. Lee, S.W.; Jiang, G.; Kong, H.Y.; Liu, C. A Difference of Multimedia Consumer’s Rating and Review through Sentiment Analysis. Multimed. Tools Appl. 2021, 80, 34625–34642. [Google Scholar] [CrossRef]
  27. Bellar, O.; Baina, A.; Ballafkih, M. Sentiment Analysis: Predicting Product Reviews for E-Commerce Recommendations Using Deep Learning and Transformers. Mathematics 2024, 12, 2403. [Google Scholar] [CrossRef]
  28. Yin, Q.; Sadowski, S. A Tale of Two Platforms: A Comparative Analysis of Language Use in Consumer Complaints on Reddit and Spotify Community. J. Consum. Behav. 2024, 23, 2071–2086. [Google Scholar] [CrossRef]
  29. Kim, S.S. Purchase Intention in the Online Open Market: Do Concerns for E-Commerce Really Matter? Sustainability 2020, 12, 773. [Google Scholar] [CrossRef]
  30. Huang, W.L.; Hu, P.; Tsai, S.; Chen, X.D. The Business Analysis on the Home-Bias of E-Commerce Consumer Behavior. Electron. Commer. Res. 2021, 21, 855–879. [Google Scholar] [CrossRef]
  31. Jia, Y.; Liu, L.; Lowry, P.B. How Do Consumers Make Behavioural Decisions on Social Commerce Platforms? The Interaction Effect between Behaviour Visibility and Social Needs. Inf. Syst. J. 2024, 34, 1703–1736. [Google Scholar] [CrossRef]
  32. Hu, K.; Luo, Q.; Qi, K.; Yang, S.; Mao, J.; Fu, X.; Zheng, J.; Wu, H.; Guo, Y.; Zhu, Q. Understanding the Topic Evolution of Scientific Literatures like an Evolving City: Using Google Word2Vec Model and Spatial Autocorrelation Analysis. Inf. Process. Manag. 2019, 56, 1185–1203. [Google Scholar] [CrossRef]
  33. Geeganage, D.K.; Xu, Y.; Li, Y. A Semantics-Enhanced Topic Modelling Technique: Semantic-LDA. ACM Trans. Knowl. Discov. Data 2024, 18, 1–27. [Google Scholar] [CrossRef]
  34. Li, X.; Wang, Y.; Zhang, A.; Li, C.; Chi, J.; Ouyang, J. Filtering out the Noise in Short Text Topic Modeling. Inf. Sci. 2018, 456, 83–96. [Google Scholar] [CrossRef]
  35. Šandor, D.; Bagić Babac, M. Sarcasm Detection in Online Comments Using Machine Learning. Inf. Discov. Deliv. 2024, 52, 213–226. [Google Scholar] [CrossRef]
  36. Sykora, M.; Elayan, S.; Jackson, T.W. A Qualitative Analysis of Sarcasm, Irony and Related #hashtags on Twitter. Big Data Soc. 2020, 7, 205395172097273. [Google Scholar] [CrossRef]
  37. Touahri, I.; Mazroui, A. Enhancement of a Multi-Dialectal Sentiment Analysis System by the Detection of the Implied Sarcastic Features. Knowl. Based Syst. 2021, 227, 107232. [Google Scholar] [CrossRef]
  38. Kandasamy, I.; Vasantha, W.B.; Obbineni, J.M.; Smarandache, F. Sentiment Analysis of Tweets Using Refined Neutrosophic Sets. Comput. Ind. 2020, 115, 103180. [Google Scholar] [CrossRef]
  39. Hartmann, J.; Heitmann, M.; Siebert, C.; Schamp, C. More than a Feeling: Accuracy and Application of Sentiment Analysis. Int. J. Res. Mark. 2023, 40, 75–87. [Google Scholar] [CrossRef]
  40. Dai, X.; Dai, H.; Rong, C.; Yang, G.; Xiao, F.; Xiao, B. Enhanced Semantic-Aware Multi-Keyword Ranked Search Scheme Over Encrypted Cloud Data. IEEE Trans. Cloud Comput. 2022, 10, 2595–2612. [Google Scholar] [CrossRef]
  41. Yang, L.; Li, K.; Huang, H. A New Network Model for Extracting Text Keywords. Scientometrics 2018, 116, 339–361. [Google Scholar] [CrossRef]
  42. Cheng, D.; Zhu, Q.; Huang, J.; Wu, Q.; Yang, L. A Local Cores-Based Hierarchical Clustering Algorithm for Data Sets with Complex Structures. Neural Comput. Appl. 2019, 31, 8051–8068. [Google Scholar] [CrossRef]
  43. Yang, W.; Wang, X.; Lu, J.; Dou, W.; Liu, S. Interactive Steering of Hierarchical Clustering. IEEE Trans. Vis. Comput. Graph. 2021, 27, 3953–3967. [Google Scholar] [CrossRef]
  44. Yao, Y. Semantic Feature Hierarchical Clustering Algorithm Based on Improved Regional Merging Strategy. Clust. Comput. 2019, 22, 1495–1503. [Google Scholar] [CrossRef]
  45. Cinque, M.; Della Corte, R.; Moscato, V.; Sperlí, G. A Graph-Based Approach to Detect Unexplained Sequences in a Log. Expert Syst. Appl. 2021, 171, 114556. [Google Scholar] [CrossRef]
  46. Wang, W.; Shang, Y.; He, Y.; Li, Y.; Liu, J. BotMark: Automated Botnet Detection with Hybrid Analysis of Flow-Based and Graph-Based Traffic Behaviors. Inf. Sci. 2020, 511, 284–296. [Google Scholar] [CrossRef]
  47. Rousseau, F.; Vazirgiannis, M. Graph-of-Word and TW-IDF: New Approach to Ad Hoc IR. Int. Conf. Inf. Knowl. Manag. Proc. 2013, 59–68. [Google Scholar] [CrossRef]
  48. Devlin, J.; Chang, M.-W.; Lee, K.; Google, K.T.; Language, A.I. BERT: Pre-Training of Deep Bidirectional Transformers for Language Understanding. In Proceedings of the 2019 Conference of the North American Chapter of the Association for Computational Linguistics: Human Language Technologies, Minneapolis, MN, USA, 2–7 June 2019; Volume 1, pp. 4171–4186. [Google Scholar] [CrossRef]
Figure 1. Research framework.
Jtaer 20 00258 g001
Figure 2. Model diagram of GoW-LDA algorithm.
Jtaer 20 00258 g002
Figure 3. BERT model.
Jtaer 20 00258 g003
Figure 4. Comparison of TF-IDF word cloud on Jingdong and Taobao. (a) Word cloud of Jingdong TF-IDF. (b) Word cloud of Taobao TF-IDF.
Jtaer 20 00258 g004
Figure 5. Comparison of TF-IDF word cloud of different stores on Taobao and Jingdong.
Jtaer 20 00258 g005
Figure 6. Cluster analysis of TF-IDF in Jingdong reviews.
Jtaer 20 00258 g006
Figure 7. Cluster analysis of TF-IDF in Taobao reviews.
Jtaer 20 00258 g007
Figure 8. Box plot of sentiment analysis of Jingdong and Taobao.
Jtaer 20 00258 g008
Figure 9. Histogram of sentiment analysis of Jingdong and Taobao.
Jtaer 20 00258 g009
Figure 10. Monthly analysis of comment sentiment on Jingdong and Taobao.
Jtaer 20 00258 g010
Table 1. Data on different platforms.
E-Commerce PlatformStoreNo. of CommentsComment Timeframe
JingdongLin shi mu yu12,7403 September 2022–10 January 2025
Yuan shi mu yu10,540
Quan you 10,375
TaobaoLin shi mu yu12,0003 January 2023–9 January 2025
Yuan shi mu yu13,050
Quan you12,300
Other stores20,050
Table 2. TF-IDF results.
E-Commerce PlatformTop 15 WordsCo-Occurring Words
JingdongMattress (床垫), installation (安装), quality (质量), master (师傅), customer service (客服), satisfied (满意), professional (专业), service attitude (服务态度), soon (很快), Quan you (全友), logistics (物流), service (服务), like (喜欢), worth (值得), buy (购买).Mattress (床垫), installation (安装), quality, master (师傅), customer service (客服), satisfied (满意), service attitude (服务态度), soon (很快), logistics (物流), service (服务), like (喜欢), worth (值得), workmanship (工艺), feeling (感觉), furniture (家具), sturdy (结实), smell (味道), color (颜色).
TaobaoEvaluation (评价), user (用户), fill (填写), installation (安装), quality (质量), service (服务), master (师傅), sturdy (结实), material (材质), satisfied (满意), appearance (外观), smell (气味), customer service (客服), feeling (感受), logistics (物流).
Note: (*) represents the corresponding Chinese, Google Translate used for the study.
Table 3. Jingdong clustering words.
CategoriesWord
Cluster 1Cost-effective (实惠), Cost-performance ratio (性价比), Cost-effectiveness (划算), Promotion (活动), Price (价格), Peace of mind (放心), Item (东西), JingDong (京东), Like (喜欢), Received (收到), Quality (质量).
Cluster 2Courier (小哥), Delivery (快递), Dispatch (配送), Time (时间), Order (下单), Arrival (到货), Shipping (发货), Speed (速度), Logistics (物流), Packaging (包装), Door-to-door (上门), Installation (安装).
Cluster 3Recommend (推荐), Purchase (购买), Trust (信赖), Choose (选择), Lin shi (林氏), Quan you (全友), Furniture (家具), Brand (品牌), Worthwhile (值得).
Cluster 4Appearance (外观), Material (材质), Design (设计), Wooden bed (木床), Style (款式), Appearance (颜值), Color (颜色), Good-looking (好看), Texture (质感), Overall (整体), Odor (异味), Craftsmanship (做工), Solid wood (实木), Sturdy (结实), Smell (味道).
Cluster 5Hardness (硬度), Moderate (适中), Feel (感觉), Mattress (床垫), Suitable (适合), Size (尺寸).
Note: (*) represents the corresponding Chinese, Google Translate used for the study.
Table 4. Taobao clustering words.
CategoriesWord
Cluster 1Really (真的), Like (喜欢), Cost-effective (实惠), Cost-performance ratio (性价比), Item (东西), Received (收到), Quality (质量), Price (价格), Special (特别).
Cluster 2Recommend (推荐), Purchase (购买), Repurchase (回购), Quality (品质), Product (产品), Worth (值得), Wood industry (木业), Furniture (家具), Brand (品牌).
Cluster 3Merchant (商家), Positive review (好评), Shopping (购物), Speed (速度), Shipping (发货), Logistics (物流), Packaging (包装), Very fast (很快), Technology (技术), Professional (专业), Customer service (客服), Enthusiastic (热情), Service (服务), Attitude (态度).
Cluster 4Taste (味道), Smell (气味), Look (看着), Sturdy (结实), Solid wood (实木), Whole (整体), Stool (凳子), User (用户), Store (门店), Breathability (透气性), Stability (稳定性), Craftsmanship (工艺水平), Intuitive (直观), Storage (收纳), Clothes (衣服), Clothes rack (衣架).
Cluster 5Moderate (适中), Feel (感觉), Mattress (床垫).
Note: (*) represents the corresponding Chinese, Google Translate used for the study.
Table 5. Analysis results of GoW-LDA of Jingdong.
Theme CategoryThematic Expression of KeywordsPercentage of Themes
Product Reviews and ExperiencesMat, skeleton, arrival, discovery, disappointment, solid wood, sturdy, design, odor, quality, practicality, simplicity, appearance, positive feedback, size, atmosphere, feel, style, color difference, high-end, good-looking, color, texture, satisfaction, overall, effect.25.00%
Shopping and Service ExperienceCustomer service, service attitude, professional, attitude, soon, home, answer, solution, quality, service, shopping, satisfaction, experience, quality, goods, after-sales, business, logistics, details, installation, master, service, soon, professional, quality, delivery, satisfaction.20.00%
Product features and detailsDecoration, mattress, room, match, style, assembly, want, product, bedpan, repurchase, reply, structure, enthusiasm, wood, shape, space, place, fitted, texture, two beds, put, texture, like, furniture.20.00%
Logistics and DistributionSmell, stuff, quality, feel, clothes, kids, shipping, satisfied, logistics, very, fast, speed, quality, packaging, received, seller, shopping.15.00%
Price and value for moneyPrice, affordable, discount, quality, physical, physical store, imagine, good Value, cost effective, fast5.00%
Table 6. Analysis results of GoW-LDA of Taobao.
Theme CategoryThematic Expression of KeywordsPercentage of Themes
Other feedbackOverall, feeling, effect, detail, overall, feeling, effect, detail, smell, texture, quality, evaluation, user, fill, stuff, put, storage, space, buy, home, quality.25.00%
Product quality and detailslike, choose, product quality, color, style, value, workmanship, home, atmosphere, simplicity, sturdy, material, appearance, stability, smell, feeling, level of craftsmanship, material.20.00%
Service and logistics experienceDelivery, installation, logistics, packaging, installation, customer service, attitude, logistics, service, service attitude, soon, professional, quality, customer service, after-sales, solution.20.00%
Product appearance and practicalityFurniture, brand, worth, trust, match, recommend, buy, value for money, worth, good looking, color, style, practical, quality.20.00%
Satisfaction and shopping experienceSatisfaction, receive, shopping, quality, odor, service, praise, quality, baby, receive, affordable, discount, quality.15.00%
Disclaimer/Publisher’s Note: The statements, opinions and data contained in all publications are solely those of the individual author(s) and contributor(s) and not of MDPI and/or the editor(s). MDPI and/or the editor(s) disclaim responsibility for any injury to people or property resulting from any ideas, methods, instructions or products referred to in the content.