Article

Risk Assessment of Live-Streaming Marketing Based on Hesitant Fuzzy Multi-Attribute Group Decision-Making Method

1
School of Management Science and Engineering, Beijing Information Science & Technology University, Beijing 100192, China
2
Beijing Key Lab of Big Data Decision Making for Green Development, Beijing 100192, China
*
Author to whom correspondence should be addressed.
J. Theor. Appl. Electron. Commer. Res. 2025, 20(2), 120; https://doi.org/10.3390/jtaer20020120
Submission received: 26 March 2025 / Revised: 13 May 2025 / Accepted: 22 May 2025 / Published: 1 June 2025
(This article belongs to the Special Issue Emerging Technologies and Marketing Innovation)

Abstract

:
(1) Background: With the deep integration of e-commerce and video technology, live-streaming marketing has emerged globally and maintained rapid growth. However, most of the current research on live-streaming e-commerce marketing focuses on merchants’ sales strategies and consumers’ purchase intentions, and there is relatively little research related to the risks of live-streaming e-commerce marketing. Nevertheless, with the development of live-streaming e-commerce marketing and its integration with technologies such as artificial intelligence and virtual reality (VR), live-streaming e-commerce marketing still faces challenges such as unclear subject responsibility, difficulty in verifying the authenticity of marketing information, and uneven product quality. It also harbors problems such as the ethical misbehavior of AI anchors and the excessive beautification of products by VR technology. (2) Methods: This study systematically analyzes the scenarios of live-streaming marketing to elucidate the mechanisms of risk formation. Utilizing fault tree analysis (FTA) and risk checklist methods, risks are identified based on the three core elements of live-streaming marketing: “people–products–scenes”. Subsequently, the Delphi method is employed to refine the initial risk indicator system, resulting in the construction of a comprehensive risk indicator system comprising three first-level indicators, six second-level indicators, and 16 third-level indicators. A hesitant fuzzy multi-attribute group decision-making method (HFMGDM) is then applied to calculate the weights of the risk indicators and comprehensively assess the live-streaming marketing risks in live broadcast rooms of three prominent celebrity anchors in China. Furthermore, a detailed analysis is conducted on the risks associated with the six secondary indicators. Based on the risk evaluation results, targeted recommendations are proposed. This study aims to enhance consumers’ awareness of risk prevention when conducting live-streaming transactions and pay attention to related risks, thereby safeguarding consumer rights and fostering the healthy and sustainable development of the live-streaming marketing industry. (3) Conclusions: The results show that the top five risk indicators in terms of weight ranking are: Ethical Risk of the AI Anchor (A4), VR Technology Promotion Risk (F3), Anchor Reputation (A1), Product Quality (D1), and Logistics Distribution Service Quality (D2). The comprehensive live-streaming marketing risk of each live broadcast room is Y > L > D. Based on the analysis results, targeted recommendations are provided for anchors, MCN institutions, merchants, supply chains, and live-streaming platforms to improve consumer satisfaction and promote sustainable development of the live-streaming marketing industry.

1. Introduction

With the widespread adoption of video technology in e-commerce, live-streaming marketing, as an emerging marketing mode based on the Internet platform, integrates the theories of marketing, consumer behavior, and communication studies, and has gradually become popular worldwide. Live-streaming marketing refers to a business activity model in which products are sold or services are provided through real-time online video broadcasts [1]. From the perspective of marketing, it takes advantage of the real-time nature and interactivity of live streaming to optimize the product display and the consumer decision-making process. From the perspective of consumer behavior, it meets the modern consumers’ needs for entertainment value and the sociality of shopping. From the perspective of communication studies, it makes full use of the communicability of the Internet to quickly disseminate marketing information and reach a broader audience. With its characteristics of instant interaction, content marketing, and online sales, live-streaming marketing brings consumers a brand-new shopping experience. Through real-time live-streaming sales, anchors can display product features and answer consumers’ questions while facilitating transactions. The live-streaming marketing industry has entered a period of rapid development, and its commercial, entertainment, and social attributes have become increasingly prominent, profoundly affecting the network ecology. Live-streaming marketing has innovated the consumption scenarios and enriched the consumption supply, but there are still challenges such as slow logistic speeds, unclear subject responsibilities, indistinguishable authenticity of marketing information, fraudulent orders, and uneven product quality, which affect the healthy development of the live-streaming marketing industry [2].
In 2024, the global e-commerce sales are expected to exceed $6 trillion, and the e-commerce sales in the United States are expected to account for 15.6% of its total retail sales. As of December 2023, China’s online live-streaming users reached 826 million, among which the scale of e-commerce live-streaming users was 597 million, an increase of 82.67 million compared with December 2022, accounting for 54.7% of the total netizens [3]. However, in the past five years, although the market scale of live-streaming marketing in China has increased by 10.5 times. Meanwhile, the increase in complaints has reached as high as 47.1 times, significantly higher than that of traditional e-commerce. Different from traditional sales behaviors, live-streaming marketing has the characteristics of “real-time, performativity, and riskiness” [4]. However, due to the large number of subjects “in front of the stage and behind the scenes”, the long chain of “people, products, and scenes”, and the difficulty in controlling “online and offline”, coupled with the integration of big data, artificial intelligence, AR technology, and VR technology, while achieving precision marketing, enabling artificial customer service to promptly answer consumers’ questions, and allowing consumers to more intuitively experience the usage effects and real scenarios of products, it also endows the consumption field with new characteristics such as technicality, cross-border nature, and concealment. Risks such as AI-deepfake fraud, the “algorithm trap” in live-streaming marketing, and the difficulty in cross-border consumer rights protection endanger consumers’ rights and interests.
In order to strengthen the protection of consumers’ rights and interests, the European Union promulgated the Digital Services Act in 2022, aiming to regulate the behavior of digital service providers, protect the rights and interests of consumers, and promote the transparency and security of the online environment. The Law of the People’s Republic of China on the Protection of Consumer Rights and Interests was officially implemented in July 2024, emphasizing that live streaming must be clear about “who is selling goods” and “whose goods are being sold”, and that platforms, broadcast rooms, and anchors are “all responsible”, among other issues. The promulgation of relevant regulations, to a certain extent, demonstrates the regulatory authorities’ emphasis on regulating the live-streaming marketing industry. However, to effectively reduce the existing risk issues in this industry, it is not only necessary to be constrained by laws and regulations, but also to have a deep understanding of the internal operation mechanism of live-streaming marketing business and clearly identify the possible risk points of each subject and link. Only in this way can a complete risk prevention and control system be established, thereby safeguarding consumers’ rights and interests and promoting the healthy and sustainable development of the live-streaming marketing industry. The prerequisite for achieving this goal is to conduct a comprehensive and in-depth analysis of the live-streaming marketing business.
The live-streaming marketing business mainly involves relevant roles such as live-streaming platform operators, live-streaming room operators, live-streaming marketers (anchors), in-platform operators (merchants), and users (consumers) [1].
Live-streaming marketers (anchors), as an important subject of live-streaming marketing business, can be divided into corporate anchors and celebrity anchors [5]. Corporate anchors are internal employees who only sell products of their own brand, while celebrity anchors are external celebrities with high popularity who sell products of various corporate brands [5]. Distinguished from other offline influencers and social media platform leaders (such as those on Weibo, Instagram, and Twitter), celebrity anchors rely on digital live-streaming platforms, featuring high interactivity and immediacy, but their influence is relatively short-lived. Their commercial value mainly lies in live-streaming marketing, advertising collaborations, and fan donations. Celebrity anchors provide consumers with detailed introductions of products’ functions, features, usage scenarios, etc., through live streams, helping consumers quickly understand product information and reducing consumers’ information search costs. In the cultivation and management of celebrity anchors, domestic MCN (Multi-Channel Network) institutions play a crucial role. Domestic MCN institutions are highly dependent on localized short video and live-streaming platforms (such as Douyin, Kuaishou, and Taobao). By providing services in aspects such as professional incubation, supply chain support, traffic operation, content planning, commercial monetization, and risk management, they assist anchors in growing rapidly and maximizing their commercial value. In contrast, foreign MCN institutions mainly rely on platforms like YouTube, Instagram, and TikTok, with the content forms mainly being short videos and long videos. Due to the relatively low popularity of live-streaming marketing, their commercialization models rely more on advertisements and brand collaborations.
Despite the rapid development of live-streaming marketing and its extensive attention from various sectors, notable research gaps remain in the academic realm. On the one hand, there is a lack of risk analysis in the transaction process of live-streaming marketing. The majority of current studies concentrate on areas such as merchants’ sales strategies and consumers’ purchase intentions. Although some scholars have analyzed the shopping risks of live-streaming e-commerce, their research mainly centers on the risk assessment of live-streaming platforms [2]. As the core scene of live-streaming marketing, the live broadcast room is where most consumers’ purchase decisions are made, and various risks are more concentratedly exposed. Moreover, since celebrity anchors have high popularity and sell products from multiple merchants, evaluating them can provide a more comprehensive analysis of risk factors. On the other hand, deficiencies exist in the quantitative research of transaction risks. Existing quantitative research methods face limitations when addressing the complexity and uncertainty inherent in transaction risks of live-streaming marketing, rendering it arduous to precisely quantify these risks. These research gaps impede the accurate assessment and effective management of these risks, thus highlighting the pressing need for further in-depth research in this domain. In summary, this paper defines the research scope as the risks faced by consumers when trading in the live broadcast rooms of celebrity anchors. On this basis, risk control measures are implemented, which have certain reference significance for protecting consumers’ rights and interests and improving consumer satisfaction.
Our main contributions are as follows: (1) We analyze the live-streaming marketing scenarios and form a business diagram of live-streaming marketing; (2) we study the risk elements in the live-streaming marketing process and establish a risk indicator system for live-streaming marketing; (3) we calculate the weights of the risk indicators and evaluate the live-streaming marketing risks of consumers in the live broadcast rooms of three typical celebrity anchors; and (4) based on the results of the risk assessment, we propose targeted risk control measures and suggestions.
The rest of this paper is structured as follows: Section 2 briefly reviews relevant research achievements of predecessors regarding live-streaming marketing and risk identification and evaluation. Section 3 analyzed the transaction scenarios of live-streaming marketing, and a risk assessment indicator system was constructed. Section 4 introduces the research methods of this paper. Section 5 is empirical analysis, and Section 6 is conclusions and suggestions.

2. Literature Review

With the deep integration of e-commerce and video technology, live-streaming marketing, as an emerging business model, has rapidly risen globally. Through real-time interaction and scene-based display, live-streaming marketing has greatly enhanced consumers’ shopping experience. At the same time, it has also provided merchants with new marketing channels. However, the rapid development of live-streaming marketing is accompanied by a series of risks and challenges. For example, the capital flow management and control of live-streaming transactions are not secure, and the technical experience in the field of live-streaming is not professional. These problems not only affect consumers’ shopping experience but also pose a threat to the healthy development of the industry. Therefore, sorting out the relevant literature on the risks of live-streaming e-commerce, as well as risk assessment and evaluation, is helpful for a more systematic and comprehensive study of the risks of live-streaming marketing.

2.1. Live-Streaming E-Commerce Risk Research

Traditional e-commerce risks include credit risks [6,7], privacy risks [8], network security risks [9,10], etc. In order to effectively evaluate various risks, Song et al. proposed a risk assessment method utilizing text mining and fuzzy rule-based reasoning, which is able to assess CBEC commodity risk quantitatively and semi-automatically [11]. With the help of the structural equation model, Garcia-Salirrosas et al. found that the better consumers’ perception of online retail website design, the lower the perceived risk of online shopping [12]. Urrea et al. apply a fuzzy quality function deployment methodology to identify and map e-commerce risks for the platform [13]. For cross-border e-commerce risks, the academic community has carried out a systematic analysis, mainly focusing on supply chain risks [14], logistics risks [15], tax risks [16], and so on.
In recent years, compared with the research on traditional e-commerce, live-streaming marketing, as an emerging form of e-commerce, has unique characteristics such as “real-time nature, interactivity, and sociality” in addition to the features of traditional e-commerce. This implies that it not only has the risks of traditional e-commerce but also its own specific risks. With the rapid development of live-streaming marketing, the research on its risks has attracted the attention of the academic community. Su et al. helped retailers identify the platform with the lowest risk through evaluating the risks of the platform, and then a risk assessment of the agricultural product live-streaming e-commerce platforms is used as a case study to demonstrate the feasibility and effectiveness of the interval-valued intuitionistic fuzzy multi-criteria group decision-making method [17]. Li et al. construct a multidimensional consumer shopping risk evaluation indicator system by considering different stakeholders involved in live-streaming commerce and then assessing consumer shopping risks based on an IFAHP and cloud model. Finally, their framework is applied to evaluate consumers’ shopping risks on four typical live-streaming commerce platforms in China, i.e., Taobao, Douyin, Kuaishou, and JD.com [2]. Peng et al. assess the failure of AI-oriented live-streaming e-commerce services and help retailers identify various risks, and the results contribute to the literature on live-streaming commerce, service failure, and virtual streamers [18]. Kim et al. examined the effect of value and perceived risk on customer satisfaction and trust, and the influence of this satisfaction and trust on customer loyalty. The results indicated that economic and emotional values played an important role in enhancing customer satisfaction and trust, respectively, while perceived risk did not have a significant impact on either customer satisfaction or trust [19].

2.2. Risk Identification Research

Risk identification serves as the cornerstone of risk management. Only by accurately identifying risks can one proceed to assess the severity and likelihood of risk occurrence through risk evaluation, thereby formulating effective strategies to mitigate potential risks. Common methodologies for risk identification include the Bayesian network method, brainstorming, checklist analysis, the Delphi method, and fault tree analysis, among others.
The Bayesian network method represents causal relationships among random variables through directed graphs, playing a pivotal role in the study of uncertain problems. Ghasemi et al. present a model using Bayesian network (BN) methodology for modeling and analyzing portfolio risks [20]. Xiao et al. propose an approach to modeling the risk of seaplane operation safety using a Bayesian network (BN), and the rough risk factors that may cause seaplane accidents are identified by historical data, the literature review, and interviews with experts [21]. The brainstorming method is suitable for giving full play to the opinions of experts during the risk identification stage and conducting a qualitative analysis of risks. However, this method has high requirements for the quality of participants and is prone to the dispersion of opinions. The Delphi method originated at the end of the 1940s and was initiated and implemented by the RAND Corporation in the United States. Currently, it has been widely applied in the fields of economy, society, and engineering technology [22]. The fault tree analysis (FTA) method uses the backward reasoning method of causal relationship analysis. Taking an accident as the top event, it searches layer by layer from top to bottom for the direct and indirect causes of the occurrence of the top event, and it has now been widely applied in many fields. In the field of supply chain risk analysis, Lei et al. apply dynamic fault trees to model supply chain risk for different types of supply chains. The dynamic fault tree allows a firm to model complex interactions among suppliers and understand how those interactions impact the risk [23]. Sherwin et al. found that a gap exists for solutions that take a systems approach to quantitative risk mitigation decision-making, especially in industries that present unique risks. Then, they address these gaps by representing a supply chain as a system using a fault tree based on the bill of materials of the product being sourced [24]. In the transportation field, Xu et al. used fault tree analysis to investigate the causal relationships between events and causes of extremely serious traffic accidents [25]. Chen et al. proposed a highway alignment safety evaluation method based on the fault tree analysis (FTA) and the characteristics of vehicle safety boundaries, within the framework of dynamic modeling of the driver-vehicle-road system [26].

2.3. Risk Assessment Research

Risk identification is used to understand and recognize risk factors from a qualitative perspective. To grasp the risks, it is necessary to estimate and evaluate them on the basis of risk identification. The main methods of risk assessment include the Analytic Hierarchy Process (AHP), technique for order preference by similarity to an ideal solution (TOPSIS), hesitant fuzzy model, etc.
The AHP was proposed by the American mathematician T.L. Saaty in 1980. It can effectively analyze the ranking relationships among various levels of the indicator system and comprehensively measure and judge the intentions of the evaluators. Kaur et al. used fuzzy analytical hierarchical process (F-AHP) to prioritize various risks in decentralized finance [27]. Li et al. established a risk framework for Human-centered Artificial Intelligence (HCAI) in education by reviewing the literature and adopting the Delphi method and AHP [28]. Fan et al. propose a two-stage technique for order of preference by similarity to an ideal solution (TOPSIS) model based on the Bayesian network (BN), and the model can provide quantitative measurements of strategies for reducing the probability of piracy in a dynamic environment [29]. The concept of hesitant fuzzy sets was proposed by Torra and Narukawa [30] in 2009, that is, the membership degree of an element belonging to a set can be multiple different values, so as to effectively solve the problem that it is difficult for the opinions of multiple decision-making experts to reach an agreement. In 1972, De Luca and Termini [31] substituted the membership function of fuzzy sets for the probability function in information entropy and proposed the non-probabilistic entropy measure of fuzzy sets to measure the uncertainty of fuzzy sets. Kosko [32] proposed a concise non-probabilistic fuzzy entropy formula from the perspective of distance, which is the ratio of the distance between the fuzzy set and the nearest and farthest non-fuzzy set, respectively. In 2024, Tan et al. [33], through in-depth analysis of the essence of hesitant fuzzy elements, found that the multi-valued properties exhibited by the multiple membership degrees of hesitant fuzzy elements were compatible with the multi-dimensionality of Euclidean space. Therefore, based on the geometric analysis of hesitant fuzzy elements, the hesitant fuzzy non-probabilistic entropy measure was proposed. Qu et al. propose a framework using dual hesitant fuzzy linguistic term set (DHFLTS) and hesitant fuzzy linguistic term set (HFLTS) to select green suppliers [34]. Gao et al. used hesitant fuzzy sets to describe the expert evaluation information, and constructed the hesitant fuzzy cotangent entropy to determine the indicator weights. On this basis, a hesitant fuzzy EGRAS method based on the average solution was constructed to evaluate the risk of returning to poverty in various regions [35].
In summary, there is relatively little existing research on the risk analysis in the live-streaming marketing process, and there is a lack of quantitative studies on these risks. Although some scholars have established the consumer shopping risk evaluation indicator system in the field of live-streaming e-commerce in the past [2], it was constructed by analyzing the stakeholders and interrelationships in the live-streaming industry. However, in the risk identification stage of this paper, based on the three elements of live-streaming “people–products–scenes”, the fault tree analysis (FTA) method is selected, which can systematically analyze complex risk events. This is suitable for the risk identification of multiple subjects and multiple links in live-streaming marketing. Subsequently, the Delphi method is used to optimize the initial risk evaluation indicator system, which can enhance the scientificity and authority of the indicator system. In the risk evaluation stage, when consumers need to choose a celebrity anchor’s live broadcast room for shopping, they tend to select the live broadcast room with lower risks. This behavior reflects consumers’ sensitivity to uncertainties and potential losses during the decision-making process. At the same time, considering that there is a lack of objective data for some indicators and it is necessary to rely on the subjective judgments of experts, due to the fact that different decision-making experts have different background knowledge and focus on different aspects, it is easy to generate differences in opinions. When comparing previous studies [2,17], we found that when AHP integrates the opinions of multiple experts, it usually needs to rely on weighted averaging or other simplification methods, which may lose some information. The TOPSIS model requires the pre-determination of weights in multi-expert evaluations and has a weak ability to integrate expert opinions. Moreover, no scholar has conducted quantitative research on the risks of live broadcast rooms after establishing a live-streaming marketing risk indicator system. Based on this, we introduce the hesitant fuzzy model into the evaluation of live-streaming marketing risks, which can effectively express the uncertainties and fuzziness in expert evaluations.

3. Live-Streaming Marketing Risk Analysis

In the wave of the digital age, live-streaming marketing relies on new media platforms. By innovatively reconstructing marketing methods, it has established a value-co-creation ecosystem where all entities work together, achieving a high degree of coupling of interests and a win-win situation among all entities. The live-streaming marketing business encompasses various links such as live-streaming planning and preparation, live-streaming promotion and interaction, transaction facilitation and conversion, user operation and maintenance, data analysis and optimization, etc. It is a new type of e-commerce marketing model that integrates multiple participants and complex interaction relationships. This paper conducts an in-depth analysis of the scenarios in live-streaming marketing and constructs a live-streaming marketing model based on the three components of “people–products–scenes” as shown in Figure 1.
“People” refer to online anchors with traffic and popularity, as well as the MCN institutions that provide services for anchors. MCN institutions establish connections with live-streamers through business empowerment and management, while live-streamers interact with MCN institutions through cooperation and product promotion. Meanwhile, consumers participate by watching live streams, obtaining content output, and receiving price discounts.
“Products” refer to the promoted goods or services, and in this paper, “products” include merchants and supply chains. Merchants and supply chains are responsible for supplying goods and have sales and commission connections with MCN institutions and live-streamers. They also provide after-sales services, release goods from the warehouse, and receive feedback from consumers.
“Scenes” refer to online platforms that gather traffic and popularity. In this paper, “scenes” include live-streaming platforms and consumption scenarios. Platforms, as scene carriers, provide channels for live-streaming activities. Merchants and supply chains supply goods to them and pay commissions. All parties collaborate and influence each other in the live-streaming e-commerce marketing business, jointly building a dynamic business ecosystem.
Currently, live-streaming marketing is developing rapidly. However, the management work in various aspects of live-streaming marketing lags behind, posing a threat to the stable and healthy development of live-streaming marketing. In order to improve consumer satisfaction, the top priority is to identify the risks in the live-streaming marketing process. Live-streaming marketing is affected by a variety of factors, such as the management of live-streaming platforms, the degree of standardization in anchor marketing, product quality, and the management of MCN institutions, etc. These factors are often uncertain, which will bring risks to live-streaming marketing. In order to strengthen the risk control of live-streaming marketing, it is necessary to conduct systematic risk analysis.

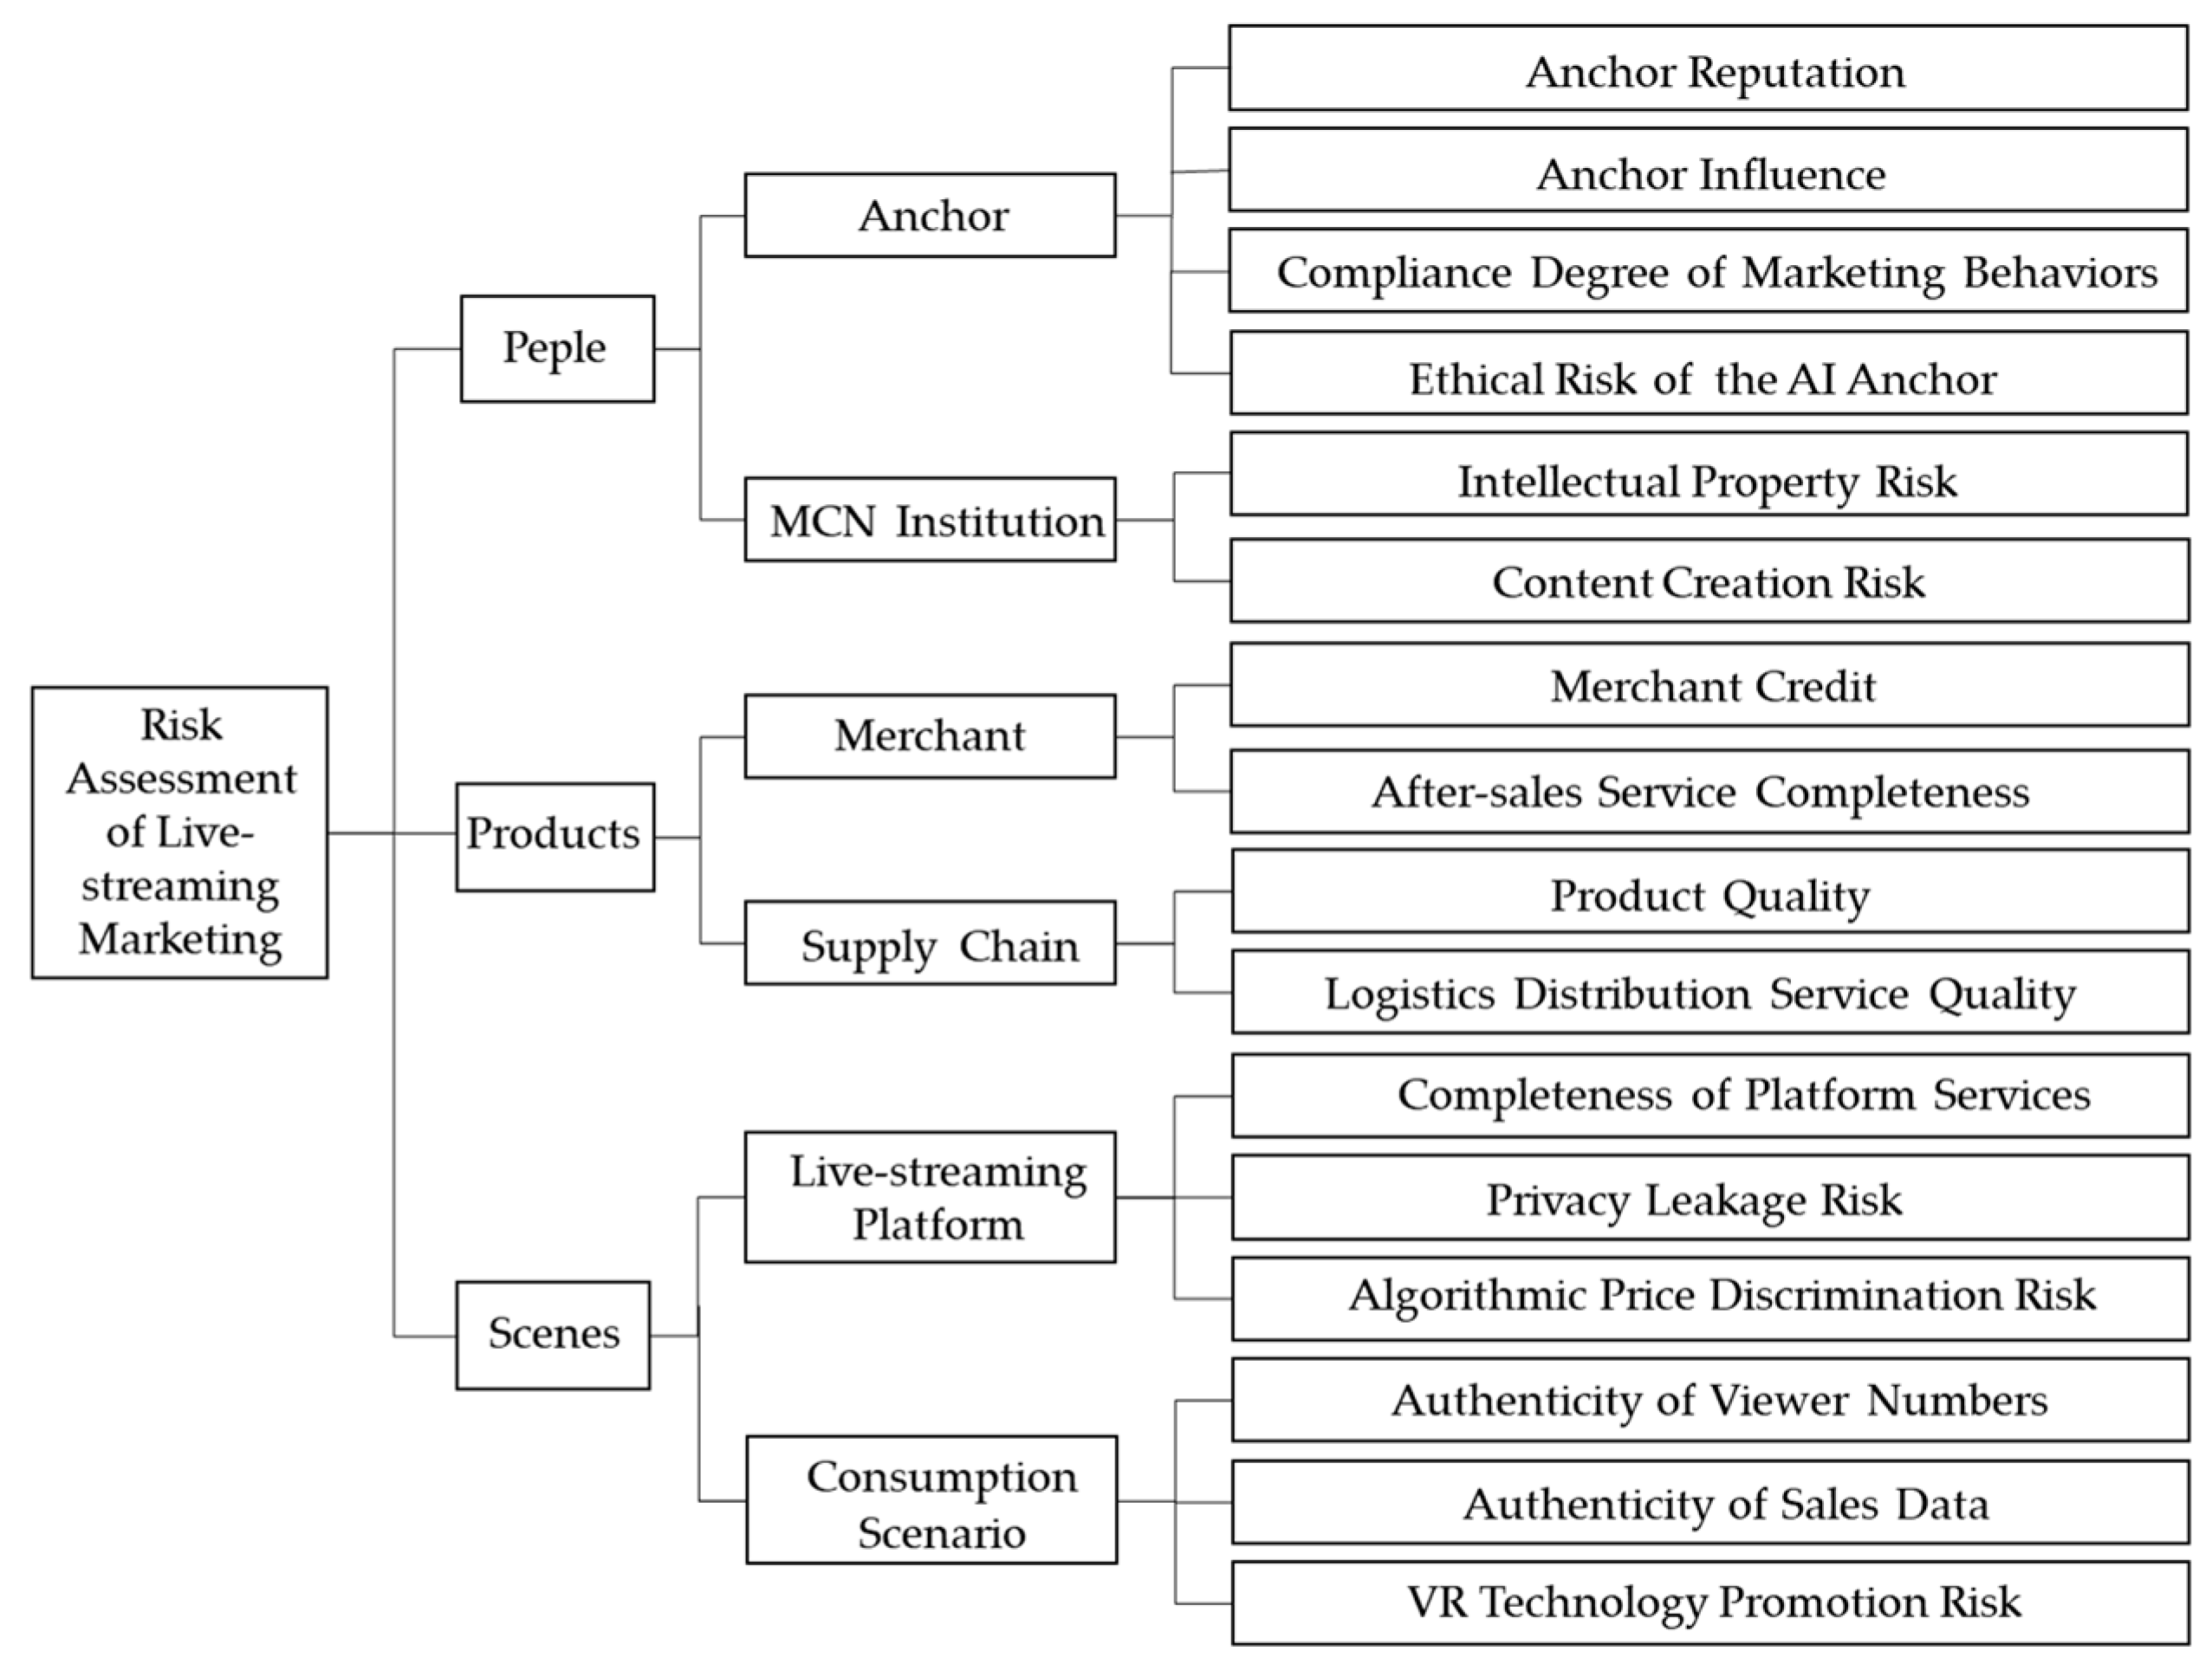
3.1. Identification and Analysis of Risk Factors in Live-Streaming Marketing

There are various risk identification methods. Common risk identification methods include the Delphi method, brainstorming method, checklist method, and so on. After evaluating the advantages and disadvantages of various methods, this paper employs the fault tree analysis (FTA) method and risk checklist method to identify the risks of live-streaming marketing, then constructs an indicator system for live-streaming marketing risks and optimizes it using the Delphi method. Firstly, based on the live-streaming marketing model and in accordance with the principle of fault tree analysis, using the deductive reasoning method, the live-streaming marketing risks are identified and analyzed from three dimensions: people risk, products risk, and scenes risk. Then, based on the risk checklist method, all possible risks in this process of the same type of live-streaming marketing are listed according to previous experience and knowledge, and the risk identification checklist is compiled. Finally, the live-streaming marketing risks to be analyzed are checked one by one, and the initial risk indicator system is obtained; then, the Delphi method is adopted to optimize this indicator system.

3.1.1. Analysis of the “People” Factor Risks in Live-Streaming Marketing

In the live-streaming marketing business, “People” mainly refer to anchors and MCN institutions. As the core roles in the live-streaming marketing scenario [36], they have exerted a significant impact on the sustained and stable development of live-streaming marketing.
The essence of live-streaming marketing is business and credibility [37]. Anchor Reputation is not only for consumers, but also for brands and partners. A reputable anchor can not only attract more consumers to form a loyal user group but also gather more high-quality brand resources on the brand side to form long-term and stable cooperation [37]. The anchor’s personal influence can also attract more fans [38], and the number of fans is related to the number of products purchased. A decline in the anchor’s influence negatively impacts product sales. Huang et al.’s study mentioned that the influence of popular anchors often leads consumers to have higher expectations for products [39]. Additionally, the anchor’s irregular, immoral, and illegal marketing behavior will not only cause consumers to suffer losses but also have a negative impact on society. For example, anchors deliberately spread false propaganda, mislead, deceive or defraud consumers [36], or spread wrong values and improper remarks, etc. Meanwhile, in the current context of the rapid development of artificial intelligence, AI-powered digital human anchors are conducive to reducing the labor costs of companies and alleviating the workload of human anchors [40]. However, as AI anchors are increasingly integrated into people’s daily lives and the gap between the virtual and the real gradually narrows, AI anchors that were originally active in the virtual world will further impact the information ecology of the real world. Therefore, it is necessary to examine AI anchors from an ethical perspective [41].
MCN institutions play an important role in the field of digital content creation and distribution. They can not only provide a series of support and services for co-anchors, but also help anchors expand their influence, increase their income, and optimize their operations. With the current professional development trend in the anchor industry, most anchors will choose to sign with MCN institutions to obtain better training, resources, and supporting facilities [42]. In recent years, the scale of the MCN industry has expanded. However, due to the diverse types of MCN institutions and their roles as brokers, managers, incubators, etc. [3], it is difficult to supervise and mitigate many risks, such as intellectual property risks and content creation risks [43]. All of these have, to a certain extent, had an impact on live-streaming marketing.

3.1.2. Analysis of the “Product” Factor Risks in Live-Streaming Marketing

Merchants are the direct participants in the live-streaming marketing process, and they connect with consumers by displaying and selling products. The supply chain is an important link to support merchants’ sales, including production, logistics, warehousing, and transportation. Merchants are responsible for market and sales, and the supply chain ensures the smoothness and efficiency of transactions. Merchants’ credit has a significant impact on consumers’ purchasing decisions and loyalty. Good merchant credit can build consumers’ trust in brands, reduce purchasing risks, and improve the shopping experience. At the same time, after-sales service of live-streaming marketing is worrying [36]. Efficient return and exchange services and high-quality after-sales service can not only solve consumers’ problems in a timely manner but also enhance consumers’ trust in the brand and reduce negative feedback caused by product and service problems, thus promoting the long-term success and market competitiveness of merchants.
The product quality risk is quite prominent in live-streaming marketing [36]. Product quality is directly related to consumer trust and satisfaction. High-quality products can not only reduce the return rate but also enhance the brand image and market competitiveness, and promote consumers’ repeat purchases and word-of-mouth dissemination. In the process of commodity transportation, the quality of good logistics and distribution services is of vital importance. Efficient and reliable distribution services can deliver products in a timely manner and improve the service level, thereby enhancing consumers’ trust and loyalty towards merchants.

3.1.3. Analysis of the “Scene” Factor Risks in Live-Streaming Marketing

The term “scene” mainly refers to the live-streaming ecology formed by the scene, operation mode, and multi-subject interaction of live-streaming e-commerce [36]. In this study, the “scene” risks are divided into two categories, namely, the risk of live-streaming platforms and the risk of consumption scenarios.
For the live-streaming marketing system, the platform may serve as the overall regulators, which should not only supervise whether the operation of the live-streaming marketing system complies with the relevant platform rules, but also provide corresponding platform guarantees for consumers’ purchasing behaviors, such as handling consumers’ transaction disputes and supervising transactions [44]. Therefore, it is necessary to analyze the risks related to live-streaming platforms. The completeness of platform services not only concerns user experience and trust but also directly affects the platform’s competitiveness and long-term development. Some platforms use algorithms to direct-push “three-no” products to groups such as the elderly and minors, or hide low-price products from users with a high complaint rate through big data screening. For example, platforms may use algorithms to manipulate the background and dynamically adjust after-sales policies based on users’ return records. Users with high-frequency returns may have their rights to “seven-day no-reason return” restricted, or be forced to deduct high shipping fees, or have their after-sales channels automatically closed, or be induced by false inventory and rush-buying [45].
While the momentum of live-streaming marketing is increasing, there has also been negative information, such as the “click farming phenomenon” and traffic fraud. Many head anchors have been suspected of click farming, falsely increasing the number of viewers, and “flooding” sales data. Other influential indicators have also been tampered with [36]. The existence of this phenomenon makes it impossible for merchants to accurately evaluate the market performance and consumer demand of products, and at the same time, it will weaken consumers’ trust and affect long-term customer relationships and brand reputations. Therefore, such influential data in the sales scenarios will also have an impact on the risk of live-streaming marketing. Meanwhile, in some live broadcast rooms, AI technology is also used to forge celebrity endorsements, or VR technology is employed to exaggerate the effects of products, for example, “trying on” virtual clothes and so on [45]. All affect the consumers’ purchase decision-making processes to a certain degree.

3.2. Construction of the Risk Indicator System for Live-Streaming Marketing

Based on the identification and analysis of the risks in live-streaming marketing, this paper constructs a risk indicator system of live-streaming marketing, which includes three first-level indicators, six second-level indicators, and 18 third-level indicators, as shown in Table 1.

4. Methodologies

Based on the construction of the initial risk evaluation indicator system described above, we employ the Delphi method to screen and optimize the initial risk factors. Subsequently, the hesitant fuzzy multi-attribute group decision-making method is adopted to calculate the weights of the risk indicators and measure the comprehensive live-streaming marketing risks in the live broadcast rooms of celebrity anchors.

4.1. Delphi Method

The Delphi method is a type of expert survey method. Through multiple rounds of feedback and discussions among experts, it aims to reach a consensus or predict future events. The key points of using the Delphi method are as follows: Firstly, select experts who are familiar with and proficient in the decision-making problem under consideration. Secondly, ensure the anonymity of the experts. Thirdly, provide them with sufficient and accurate information [47]. Previous studies have shown that the Delphi method exhibits good applicability when optimizing the indicator system. Zhang et al. used the Delphi method to optimize the risk factors in green product certification and determined a formal research framework [47]. Zhang et al. employed the Delphi method to revise and optimize the initial influencing factor indicators of green consumption [48]. Considering the wide range of sources of risk indicators and the fact that the research object is in an emerging field, this study adopts the Delphi method to revise and optimize the initial system. This not only breaks through the limitations of a single perspective, integrates diverse professional knowledge through an anonymous multi-round feedback mechanism, reduces subjective biases, and promotes experts to reach a consensus, but also makes the indicator system more in line with the actual situation of the research object, thereby improving the applicability and scientific nature of the indicators.

4.2. Hesitant Fuzzy Multi-Attribute Group Decision-Making Method

4.2.1. The Definition of Hesitant Fuzzy Non-Probabilistic Entropy

The concept of fuzzy sets was first proposed by Zadeh [49], who expressed the fuzzy characteristics of things with membership functions, thereby breaking through the either-or phenomenon in the classical Cantor set theory. Group decision-making was developed to gain a deeper and more comprehensive understanding of the problem and make scientific decisions. Different decision-making experts have different knowledge backgrounds and can analyze the essence of problems from multiple perspectives. Therefore, group decision-making can effectively reduce decision-making biases and mistakes, thereby improving the quality of decision-making. However, expert opinions often carry individual preferences and are prone to inconsistency. The concept of hesitant fuzzy sets was proposed by Torra and Narukawa [30] in 2009, that is, the membership degree of an element belonging to a set can be multiple different values, so as to effectively solve the problem that it is difficult for the opinions of multiple decision-making experts to reach an agreement and avoid information loss. Just because the number of membership degrees contained in different hesitant fuzzy elements is often different, it brings difficulties to the correct operation of measures such as hesitant fuzzy distance, similarity, and hesitant fuzzy entropy.
Fuzzy entropy is an important concept in fuzzy set theory, which has been studied by many scholars [50,51,52,53], but there are still two deficiencies in the existing studies: first, the hesitant uncertainty is ignored, and only the fuzzy uncertainty is considered; second, when comparing the magnitudes of two hesitant fuzzy entropies, new membership degrees need to be added according to risk preferences.
In 1972, De Luca and Termini [31] substituted the membership function of fuzzy sets for the probability function in information entropy and proposed the non-probabilistic entropy measure of fuzzy sets to measure the uncertainty of fuzzy sets. Kosko [32] proposed a concise non-probabilistic fuzzy entropy formula from the perspective of distance, which is the ratio of the distance between the fuzzy set and the nearest and farthest non-fuzzy set, respectively.
In 2024, Tan et al. [33], through in-depth analysis of the essence of hesitant fuzzy elements, found that the multi-valued properties exhibited by the multiple membership degrees of hesitant fuzzy elements were compatible with the multi-dimensionality of Euclidean space. Therefore, based on the geometric analysis of hesitant fuzzy elements, the hesitant fuzzy non-probabilistic entropy measure was proposed. It has been proven in practice that when this method is compared with the hesitant fuzzy entropy measures in the representative studies of Farhadinia [50], Xu and Xia [51], Wang and Miao [52], as well as Lv, etc. [53], the operation results are more scientific and reasonable. Therefore, this paper adopts the definition of hesitant fuzzy non-probabilistic entropy proposed by Tan.
The formula of the hesitant fuzzy non-probabilistic entropy measure is given as follows.
Definition 1. 
Let α and β be two hesitant fuzzy elements. Denote Enp: H → [0, 1] as the hesitant fuzzy non-probabilistic entropy of α. Then, it satisfies the following four axiomatic criteria:
(1)
Enp (α) = 0, if and only if α = {0}, or α = {1};
(2)
Enp (α) = 1, if and only if α = αc;
(3)
Enp (α) = Enp (αc);
(4)
Enp (α) ≤ Enp (β), then
min { γ α γ 2 , γ α ( 1 γ ) 2 } max { γ α γ 2 , γ α ( 1 γ ) 2 } min { γ β γ 2 , γ β ( 1 γ ) 2 } max { γ β γ 2 , γ β ( 1 γ ) 2 }
Based on the axiomatic definition of the hesitant fuzzy entropy in Definition 1 and combined with the geometric interpretation of hesitant fuzzy elements, the following formula for measuring hesitant fuzzy non-probabilistic entropy is given.
Definition 2. 
Let h ∈ H, h = γ h { γ } , and the definition of the non-probabilistic entropy of the hesitant fuzzy element h is as follows:
E n p ( h ) = a b = min { γ h γ 2 , γ h ( 1 γ ) 2 } max { γ h γ 2 , γ h ( 1 γ ) 2 }
In Formula (1), a and b, respectively represent the Euclidean distances between the hesitant fuzzy element h and the non-fuzzy points ({0} or {1}). Here, a represents the closest distance, and b represents the farthest distance. It has been proven that Formula (1) in Definition 2 satisfies the four axiomatic principles of Definition 1 of the hesitant fuzzy non-probabilistic entropy.
The above is the analysis of a single hesitant fuzzy element. For hesitant fuzzy sets, the average hesitant fuzzy entropy formula is as follows:
E n p ( M ) = 1 n i = 1 n min { γ h ( x i ) γ 2 , γ h ( x i ) ( 1 γ ) 2 } max { γ h ( x i ) γ 2 , γ h ( x i ) ( 1 γ ) 2 }

4.2.2. Hesitant Fuzzy Multi-Attribute Group Decision-Making Method Based on Entropy Weight Method

Since the evaluation and selection of live-streaming marketing risks in celebrity live broadcast rooms belongs to the category of multi-attribute decision-making, let A = {A1, A2, …, Am} represents a group of alternative celebrity live broadcast rooms, the attribute set G = {G1, G2, …, Gn}, weight vector of indicators W = (w1, w2, …, wn)T, which satisfies wj ∈ [0, 1], j = 1, 2, …, n, and j = 1 n w j = 1 . The live-streaming marketing users are invited to evaluate the possible membership values of scheme A under attribute Gj, and the preference information of multiple users is integrated to form a hesitant fuzzy decision matrix H = (hij)m×n. For this typical hesitant fuzzy multi-attribute group decision-making problem, the hesitant fuzzy non-probabilistic entropy measure is applied for decision-making. The decision-making steps are as follows.
Step 1: Calculate the non-probabilistic entropy of all hesitant fuzzy elements according to Formula (1) and aggregate them into the average non-probabilistic entropy Ej (j = 1, 2, …, n) under each attribute.
E j = 1 m i = 1 m min { γ h i j γ 2 , γ h i j ( 1 γ ) 2 } max { γ h i j γ 2 , γ h i j ( 1 γ ) 2 }
Step 2: Determine the attribute weight information based on the entropy minimization principle.
w j = ( 1 E j ) / ( n j = 1 n E j ) , j = 1 , 2 , , n
Step 3: Determine the positive and negative ideal solutions, and calculate the distance between each alternative solution and the positive and negative ideal solutions, respectively. The positive ideal solution is denoted as A+ = {h1+, h2+, …, hn+}, and the negative ideal solution is denoted as A = {h1, h2, …, hn}. When the attribute is a benefit-type attribute, hj+ = {1}, hj = {0}, j =1, 2, …, n. When the attribute is a cost-type attribute, the weighted distance formulas between the alternative solutions and the positive and negative ideal solutions are as follows.
d + ( A i ) = j = 1 n w j d i j + = j = 1 n w j d ( h i j , h j + )
d ( A i ) = j = 1 n w j d i j = j = 1 n w j d ( h i j , h j )
Step 4: Calculate the closeness degree of each trading plan for celebrity live broadcast rooms relative to the positive ideal plan and rank the transaction risk of celebrity anchors’ live broadcast rooms from large to small according to the magnitude of the relative closeness degree. The calculation formula is as follows.
S ( A i ) = d ( A i ) / ( d + ( A i ) + d ( A i ) )
In summary, the evaluation model of live-streaming marketing risks based on the hesitant fuzzy multi-attribute group decision-making method is shown in Figure 2.

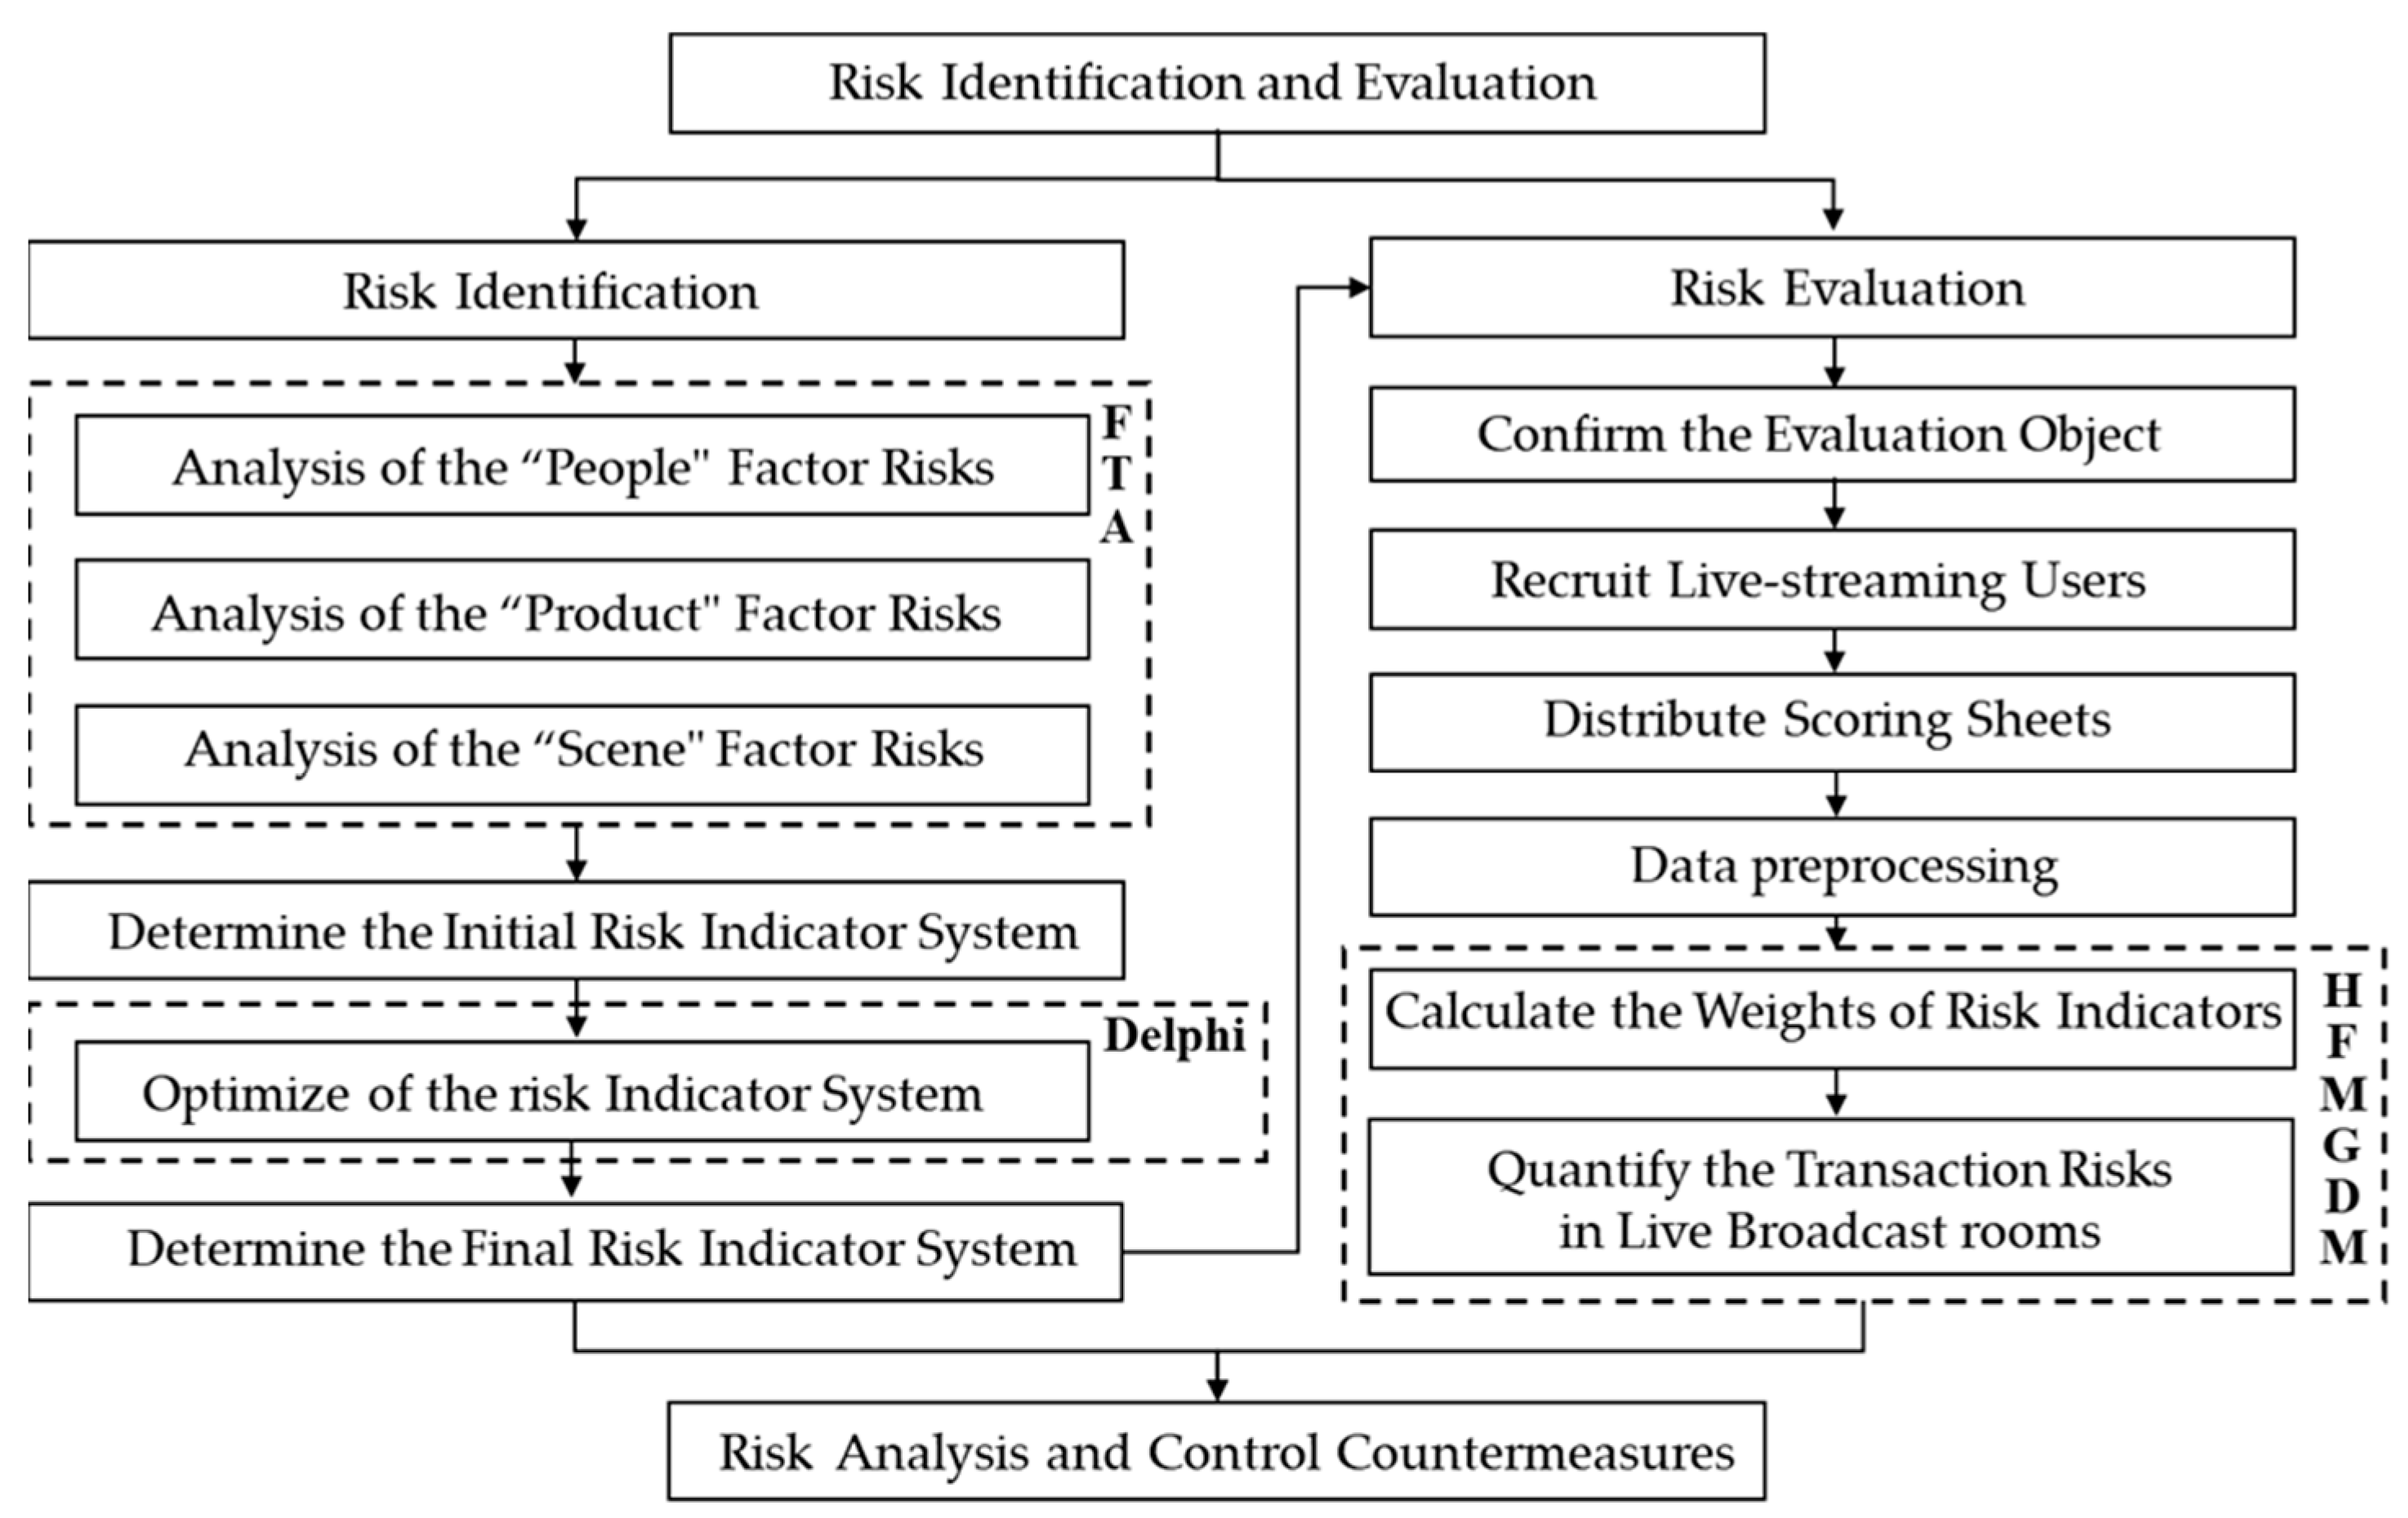
4.3. Risk Identification and Evaluation Model for Live-Streaming Marketing

Based on the above analysis, we establish the live-streaming marketing risk identification and evaluation model as shown in Figure 3.

5. Empirical Analysis of the Evaluation of Live-Streaming Marketing Risks

5.1. Risk Factor Framework Based on the Delphi Method

The initial set of risk factors for live-streaming marketing, summarized in this study, includes three first-level indicators, six second-level indicators, and 18 third-level indicators, as shown in Table 1. To verify the scientificity and effectiveness of the risk indicator system, it is necessary to use the Delphi method to screen the initial risk factor system. We refer to previous studies [47,48] and select six experts with rich practical experience and theoretical backgrounds in the field of live-streaming marketing and risk management, as shown in Table 2. Combining the practical experience in the industry field, the five-point Likert scale questionnaire form was used to screen and summarize the risk factors. In order to obtain a comprehensive understanding of the risk sources and factors of live-streaming marketing, the practical experience subjects selected by the research institute should be able to understand the main responsibilities of live-streaming marketing and have a certain grasp of the possible risk sources of existing live-streaming marketing.
Then, according to the average score and consensus deviation index (CDI), the necessity of risk factors is determined [48]. The calculation is shown in Formula (8).
C D I = σ μ = 1 n i = 1 n x i μ 2 1 n i = 1 n x i
where x i represents the experts’ ratings on the necessity of each influencing factor, n represents the number of experts, σ represents the standard deviation of experts’ ratings, and μ represents the average of experts’ ratings.
In the first round of the Delphi questionnaire, we provided the experts with a preliminary risk indicator system for live-streaming marketing. The experts judged whether the factors in the system were suitable for the risk assessment of live-streaming marketing based on their experience and checked the accuracy of the indicator definitions.
In the second round of the Delphi questionnaire, the experts scored the risk indicators on a scale of 1 to 5. A score of one indicates that the risk factor is completely unnecessary, and a score of five indicates that it is completely necessary. Considering the average score of each risk factor, if the average score is lower than a specific threshold, it indicates that the necessity of this factor is low and it should be excluded from the risk indicator system. The CDI is used to calculate the degree of consensus among the expert group. If the CDI value is too high, it indicates that there is a significant disagreement among the experts regarding the necessity of this factor, and the expert opinions have not reached a consensus. In this case, the next round of the questionnaire filling is required until the experts reach a consensus on all factors. Drawing on previous research [47,48], in this study, the critical value of necessity is set at three, and the critical value of CDI is set at 0.2. Considering that the scoring range of this study is from 1 to 5, setting the critical value to three can reasonably distinguish which risk factors are relatively necessary and which are less necessary. Meanwhile, setting the critical value of CDI at 0.2 can effectively measure the degree of expert consensus and provide a reasonable judgment basis for the implementation of the Delphi method. Then, an evaluation panel composed of six experts and scholars in the relevant fields of live-streaming marketing evaluated the necessity of various risk factors in live-streaming marketing.
The analysis of the necessity of the factors in the second round of the Delphi questionnaire is shown in Table 3. The experts unanimously agreed that the Rationality of Interface Setting in the live-streaming platform dimension is unnecessary and can be directly removed, because the average score of this factor is lower than three, and the CDI value is lower than 0.2. In addition, the average scores of 14 risk factors are greater than three, and the CDI values are less than 0.2, and the experts have reached a consensus on these indicators. The CDI values of the remaining three risk factors are all greater than 0.2. In order to enable the experts to reach a consensus, a third round of the Delphi questionnaire survey was conducted.
Before the start of the third round of the Delphi questionnaire survey, in order to avoid errors caused by unnecessary factors, experts whose second round score is outside the average (plus or minus one standard deviation) are asked to provide reasons for the second round score. The third round of expert ratings is shown in Table 4. After statistical analysis of the questionnaire survey results, it was found that the CDI value of each risk factor in this round was less than 0.2, indicating that each risk factor passed the consistency test of experts. Among them, the average score of the Degree of Account Standardization in the merchant dimension is less than three points, and the factor that experts agree is not needed is finally eliminated.
After three rounds of the Delphi questionnaire survey, the formal research framework of this study was obtained. Finally, the risk indicator system for live-streaming marketing includes three first-level indicators, six second-level indicators, and 16 third-level indicators, as shown in Figure 4.

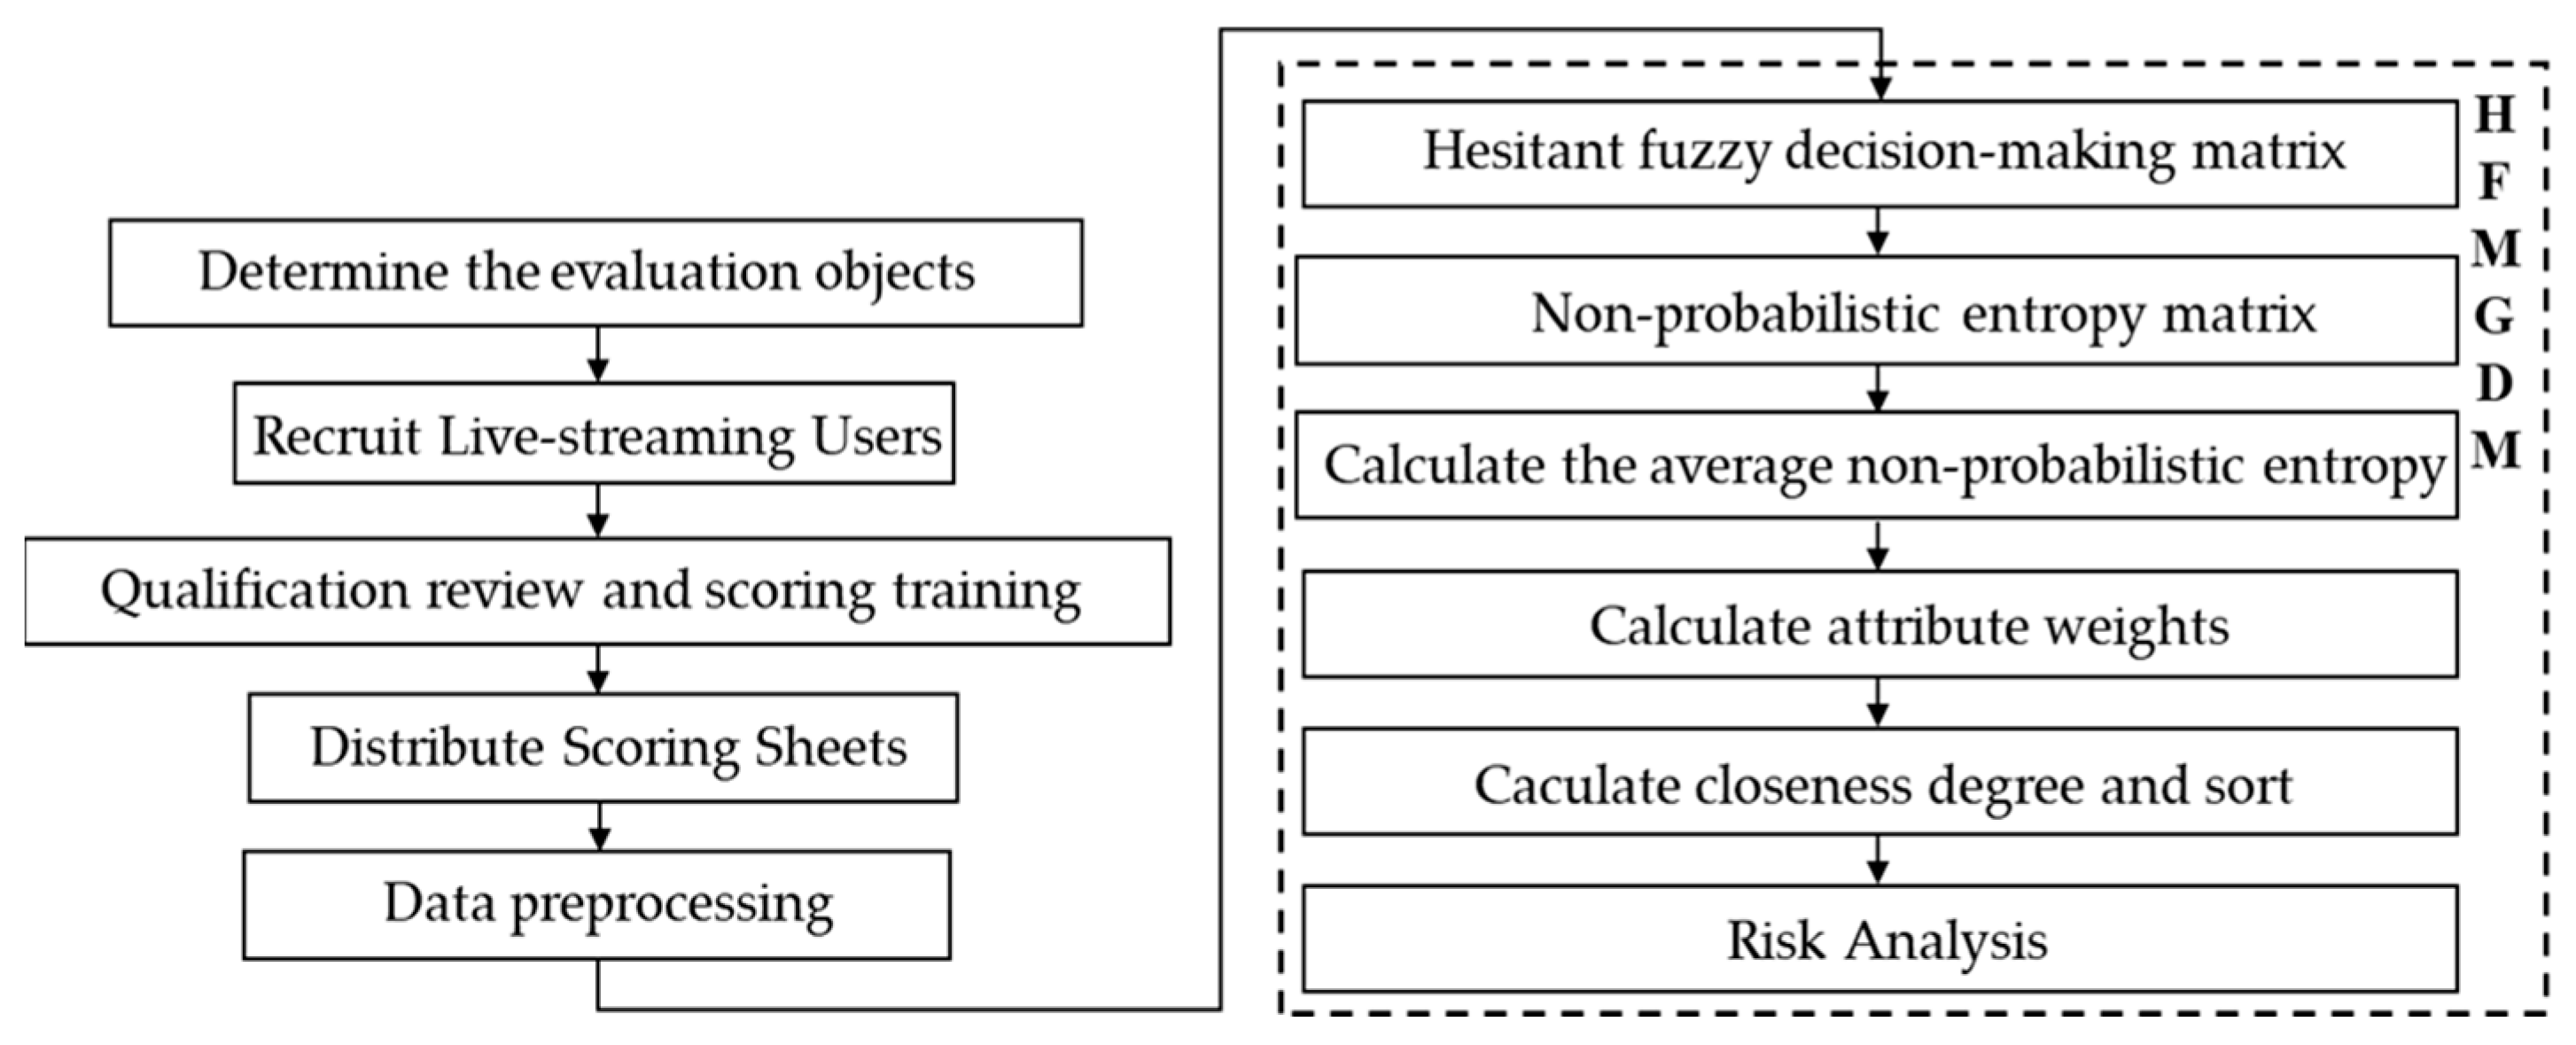
5.2. Comprehensive Evaluation of Live-Streaming Marketing Risks Based on Hesitant Fuzzy Multi-Attribute Group Decision-Making Method

During the process of live-streaming marketing, there are relatively high risks. In this paper, among the top 10 anchors in the latest “China’s Top 100 Goods-promoting Live-streamers List in 2024” released by iiMedia Research, a third-party data mining and analysis institution in the global new economy industry, three representative anchors, namely L, Y and D are selected, and the basic information of the three anchors is shown in Table 5. The process of consumers shopping in the live broadcast room of these three anchors is taken as the evaluation object, which is represented by X1, X2, and X3, respectively. In order to make the evaluation reasonable, this paper invited 50 typical live-streaming users to participate in the live-streaming marketing risk assessment. Invited live-streaming users need to meet the following conditions:
-
They have shopped in the live broadcast rooms of the above three anchors;
-
They have at least two years of online shopping experience;
-
They watch at least three hours of live streaming a week;
-
They make purchases through live streaming at least three times a month;
-
They shop online for at least three commodities every month.
The descriptive statistics of the characteristics of 50 live-streaming users are shown in Figure 4. In Figure 5, the horizontal axis represents “User Age”, “Number of Years of Watching Live-streaming”, “Weekly Duration of Watching Live-streaming”, “Number of Times of Purchasing Goods via Live-streaming per Month”, and “Types of Goods Purchased via Live-streaming per Month” in sequence from left to right.
The 50 users score the live-streaming marketing risk faced by consumers when trading in the live broadcast room of three anchors from a total of 16 aspects, including Anchor Reputation (A1), anchor influence (A2), compliance degree of marketing behaviors (A3), Ethical Risk of the AI anchor (A4), intellectual property risk (B1), content creation risk (B2), merchant credit (C1), after-sales service completeness (C2), Product Quality (D1), Logistics Distribution Service Quality (D2), completeness of platform services (E1), privacy leakage risk (E2), algorithmic price discrimination risk (E3), authenticity of viewer numbers (F1), authenticity of sales data (F2), and VR Technology Promotion Risk (F3).
The scoring range is any number within [0, 1], where (0, 0.2] represents low risk, (0.2, 0.4] represents medium-low risk, (0.4, 0.6] represents medium risk, (0.6, 0.8] represents medium-high risk, and (0.8, 1] means high risk.
(1)
Determine the hesitant fuzzy decision-making matrix.
Fifty live-streaming users rated the live-streaming marketing risks faced by consumers when conducting transactions in the live broadcast rooms of three anchors. Based on the rating results, the hesitant fuzzy decision-making matrix was determined. For example, when users rate the risk factor A1 that they face when conducting transactions in the live broadcast room of anchor L, the scores given by the 50 users are all concentrated among the six numbers of 0.4, 0.5, 0.6, 0.7, 0.8, and 0.9. Then, no matter how many times each number appears, in the decision-making matrix, we record it as {0.4, 0.5, 0.6, 0.7, 0.8, 0.9}, indicating that these 50 users hesitate within these six scores. Similarly, when users rate the risk factor A2 that they face when conducting transactions in the live broadcast room of anchor Y, the scores given by the 50 users are all concentrated among the four numbers of 0.7, 0.8, 0.9, and 1.0. Then, we record it as {0.7, 0.8, 0.9, 1.0}, indicating that these 50 users hesitate within these four scores. In this way, the hesitant fuzzy decision-making matrix, as shown in Table 6, was obtained.
(2)
Calculate the hesitant fuzzy non-probabilistic entropy.
According to Formula (5), calculate the hesitant fuzzy non-probabilistic entropy. By integrating all the non-probabilistic entropies, the matrix shown in Table 7 is obtained.
(3)
Calculate the average non-probabilistic entropy.
According to Formula (3), the average non-probabilistic entropy under the first attribute is calculated: E1 = 1/3 (0.57948 + 0.14286 + 0.51797) = 0.41343. Similarly, the following results can be obtained: E2 = 0.58074, E3 = 0.56140, E4 = 0.26864, E5 = 0.67961, E6 = 0.78602, E7 = 0.72161, E8 = 0.58820, E9 = 0.48863, E10 = 0.51530, E11 = 0.70558, E12 = 0.64453, E13 = 0.73647, E14 = 0.53049, E15 = 0.54931, E16 = 0.38259.
(4)
Calculate the attribute weights.
According to the principle of entropy minimization, the attribute weight information is calculated by Formula (4). w1 = (1 − E1)/(16 − j = 1 16 E j ) = 0.08566. The remaining attribute weight information is shown in Table 8.
The top five risk indicators in terms of weight ranking are Ethical Risk of the AI Anchor (A4), VR Technology Promotion Risk (F3), Anchor Reputation (A1), Product Quality (D1), and Logistics Distribution Service Quality (D2).
(5)
Calculate the weighted distances to the positive and negative ideal solutions.
Since, in this paper, when users conduct evaluations based on the risk scoring range, the higher the score of a risk indicator, the higher the risk, so all the 16 evaluation indicators are all benefit-type indicators and the ideal solutions all exhibit a trend where the closer they are to 1, the better. The positive and negative ideal solutions of the schemes are obtained as follows.
X1+ = ({1,1,1,1,1,1}, {1,1,1,1,1}, {1,1,1,1}, {1,1,1}, {1,1,1,1,1}, {1,1,1,1,1}, {1,1,1,1}, {1,1,1,1,1}, {1,1,1,1}, {1,1,1,1}, {1,1,1,1,1}, {1,1,1,1}, {1,1,1,1}, {1,1,1,1}, {1,1,1,1,1}, {1,1,1,1}),
X1 = ({0,0,0,0,0,0}, {0,0,0,0,0}, {0,0,0,0}, {0,0,0}, {0,0,0,0,0}, {0,0,0,0,0}, {0,0,0,0}, {0,0,0,0,0}, {0,0,0,0}, {0,0,0,0}, {0,0,0,0,0}, {0,0,0,0}, {0,0,0,0}, {0,0,0,0}, {0,0,0,0,0}, {0,0,0,0}).
Use Formulas (5) and (6) to calculate the weighted distances between each evaluation object and the positive and negative ideal solutions, respectively, as shown in Table 9.
(6)
Calculate the comprehensive evaluation value.
Use Formula (7) to calculate the relative closeness degree of each evaluation object. Take it as the comprehensive evaluation value of the live-streaming marketing risks faced by consumers when conducting transactions in the live broadcast rooms of each anchor. The results are shown in Table 10.
According to the given risk level classification, the comprehensive evaluation value of the live-streaming marketing risk in live broadcast room L is 0.38861, falling within the medium-low risk range. The comprehensive evaluation value of the live-streaming marketing risk in live broadcast room Y is 0.55021, which is in the medium risk range. The comprehensive evaluation value of the live-streaming marketing risk in live broadcast room D is 0.35530, also in the medium-low risk range.
Repeat the above steps to calculate the risk evaluation values of the secondary indicator dimensions. The results are shown in Table 11.
The anchor risk assessment value in live broadcast room L is 0.49220, which is at a relatively medium level. The anchor risk assessment value in the live broadcast room Y is as high as 0.62647, belonging to the medium risk level. The anchor risk assessment value in the live broadcast room D is 0.32702, falling within the medium-low risk level. The anchor L mainly sells cosmetics at moderate prices. However, due to the unfriendly remarks made to consumers during the live stream, which damaged his reputation, the risk is at a relatively medium level. Y’s high anchor risk may stem from its exaggerated live-streaming style, as well as controversial incidents such as Product Quality issues and complaints about false advertisements. Meanwhile, D promotes products through knowledgeable explanations, emphasizes consumer education and brand building, and presents a relatively positive professional image; thus, the anchor risk is relatively low.
The MCN institution risk assessment values in live broadcast rooms for L, Y, and D are 0.46661, 0.61505, and 0.51704, respectively. The risks of the three MCN institutions have their own characteristics and focuses. The risks of Y’s MCN institution are relatively the most prominent. In particular, it is necessary to conduct a comprehensive risk investigation and rectification in aspects such as advertising, promotion, and intellectual property. The overall risk of L’s MCN institution is at a medium-low level. The MCN institution is relatively professional but highly dependent on the traffic and product-promotion ability of anchor L. Since D is involved in a large number of product promotions, there may be risks related to intellectual property contracts and the like, and it is necessary to avoid associated risks caused by details.
The merchant risk assessment values in live broadcast room L, Y, and D are 0.33228, 0.47216, and 0.34205, respectively. Among them, the merchant risks in live broadcast rooms L and D are at the medium-low risk level, while the merchant risk in live broadcast room Y is at the medium risk level. L’s high-traffic and influential live broadcast room may face issues in merchant selection due to time and energy constraints, leading to cooperation with less suitable merchants and higher after-sales risks. Y’s live broadcast room, aiming for content novelty, often partners with emerging brands. These brands’ unestablished market reputations and service uncertainties increase cooperation risks. D’s high-end brand-positioned live broadcast room may struggle to find enough high-quality merchants. Excessive expansion to mismatched merchants could damage its brand image and bring risks to both sides.
In terms of the supply chain risk assessment values, those of live broadcast rooms L, Y, and D are 0.32608, 0.52607, and 0.29354, respectively. Among them, live broadcast rooms L and D are at the medium-low risk level, while live broadcast room Y is at the medium risk level. L’s strong promotional power leads to large orders, putting high pressure on the supply chain. Y, when collaborating with various brands, faces diverse supply chain management levels. The weak supply chains of some brands and Y’s limited control increase risks. D mainly sells agricultural products, which means that production is affected by natural factors. Therefore, the lack of a complete cold chain logistics system will increase the risk of the supply chain.
In terms of the live-streaming platforms evaluation values, those of live broadcast rooms L, Y, and D are 0.34350, 0.43363, and 0.43363, respectively. Live broadcast room L is at the medium-low risk level, but those of Y and D are higher than that of L. This may be due to differences in the platforms where the three anchors are settled. It is worth noting that both Y and D are settled on the Douyin platform, and the risk assessment values of the live-streaming platforms for the two are higher than those of L, who is settled on the Taobao platform, which coincides with the research of Li et al. [2]. Therefore, there are also differences in the live broadcast models and the shopping habits of consumer groups. Taobao’s live-streaming is based on a mature e-commerce system with sound rules and strict supervision in Product Quality, merchant qualification, and after-sales service. Taobao users have clear shopping demands, are active in product research, rely less on anchors, and are more rational in decision-making. Douyin, a content-focused social platform, has diverse and fast-updated live-streaming content, which makes content review and supervision difficult. Douyin users enter live broadcast rooms casually while browsing, shop impulsively, and are easily swayed by anchors and the live-streaming atmosphere, neglecting product details.
In terms of the consumption scenarios evaluation values, those of live broadcast room L, Y, and D are 0.30420, 0.55192, and 0.32925, respectively, which are at the medium-low risk level, medium risk level, and medium-low risk level, respectively. L is a beauty product anchor, and if the number of viewers and sales data are not true, it may mislead consumers in judging the popularity and quality of the products. The live broadcast room of Y, which mainly features an entertainment style, may have an inflated number of viewers, which can mislead consumers’ perception of the cost-effectiveness of the products. The live broadcast room where knowledge-based anchor D is located is affected by the authenticity of viewer numbers, which in turn influences his assessment of his own audience positioning and market influence. Furthermore, in these live broadcast rooms, the false product displays conducted through VR technology may deceive consumers and damage the reputation of the live broadcast rooms.

5.3. Risk Analysis and Control Countermeasures

This study focuses on four aspects: the identification of risk factors in live-streaming marketing, the establishment of a risk indicator system, the calculation of the weights of risk factors, and the determination of transaction risk levels in the live broadcast rooms of three representative anchors. It has deeply understood the risks of live-streaming marketing and provided a quantitative basis. Previous studies have identified the risk factors related to anchors, platforms, merchants, and other subjects in live-streaming marketing [2]. However, with the continuous development of live-streaming marketing businesses and the integration of technologies such as artificial intelligence and VR, various emerging risks are constantly emerging. Therefore, it is necessary to establish a risk indicator system in the field of live-streaming marketing. Meanwhile, this study distinguishes the importance of risk factors and quantifies the transaction risk levels of three live broadcast rooms based on this indicator system. The following will analyze the importance and impact of risk indicators.

5.3.1. Anchor Risk Analysis and Control Countermeasures

The risk weight of anchors is high, and the detailed indicators are crucial. The risk weight of the anchor reaches 0.31775, which is the highest proportion. Among them, Ethical Risk of the AI Anchor (A4) has the highest weight, which is 0.10681. With the wide application of AI technology in the live-streaming field, AI anchors have gradually emerged. However, the ethical issues it brings, such as AI anchors possibly spreading inappropriate values or infringing on users’ privacy during data collection and usage, not only mislead consumers but also may trigger a social public opinion crisis, having a negative impact on the sustainable development of the industry. The weight of Anchor Reputation (A1) is 0.08566, which is a key factor related to consumers’ purchasing decisions, merchants’ brand cooperation, and the industry ecosystem. A good reputation as an anchor can promote transactions; conversely, it can increase transaction risks. The weight of anchor influence (A2) is 0.06123, which also affects consumers’ purchasing decisions. The weight of Compliance Degree of Marketing Behaviors (A3) is 0.06405. Standardized marketing behaviors are the basis for ensuring fair and just transactions.
Given the core position and high-risk weight of anchors in live-streaming marketing business, regulatory authorities should establish a qualification review and dynamic assessment mechanism for anchors, requiring them to provide relevant professional background certificates and credit records, and regularly assess anchors in multiple aspects including business capabilities, professional ethics, and knowledge of laws and regulations. The cultivation of various professional live-streaming e-commerce talents [36] should be accelerated. Meanwhile, live-streaming platforms should be urged to strengthen the management of anchors [2] and improve the credit rating system for anchors, incorporating Anchor Reputation (A1), the Compliance Degree of Marketing Behavior (A3), and Ethical Risks of the AI Anchor (A4) into the rating indicators. Based on the rating results, differentiated management should be implemented for the recommended traffic and cooperation opportunities of anchors to encourage them to maintain a good reputation, standardize marketing behavior, and avoid ethical risks.

5.3.2. Consumption Scenarios Risk Analysis and Control Countermeasures

The risks in consumption scenarios are influenced by technology and the authenticity of data. VR technology has relatively high risks. The risk weight of the consumption scenario is 0.22455. Among them, VR Technology Promotion Risk (F3) has the highest weight of 0.09017, indicating the potential risks of emerging technologies in the application of live-streaming marketing. If VR technology is not used properly, such as overly beautifying products or making false displays, it may mislead consumers. The weight of authenticity of viewer numbers (F1) is 0.06857, and the weight of authenticity of sales data (F2) is 0.06582, indicating that during the process of consumers watching live broadcasts, the authenticity of viewer numbers and the authenticity of sales data have a significant impact on consumers’ judgment. False viewer numbers and sales data have an impact on the normal operation of the market and are likely to mislead consumers’ decisions.
To ensure the authenticity of consumption scenario data, regulatory authorities should promote the establishment of unified data monitoring and certification standards in the live-streaming marketing industry, and use big data, blockchain and other technological means to conduct real-time monitoring and evidence preservation of the authenticity of the number of viewers (F1) and the authenticity of sales data (F2). It is required that the platform issue early warnings, conduct investigations on live broadcast rooms with abnormal data, and formulate clear and strict penalty measures for data fraud [36]. Regarding the VR Technology Promotion Risk (F3), relevant departments should promptly formulate normative standards for the application of VR technology in live-streaming marketing, clarify the authenticity requirements and technical parameters of VR display content, strengthen the review of VR technology application, and safeguard consumers’ right to know and choose.

5.3.3. Merchant and Supply Chain Risk Analysis and Control Countermeasures

Merchant risks emphasize after-sales service, while supply chain risks focus on quality and logistics. The merchant risk weight is 0.10079. Among them, the weight of after-sales service completeness (C2) is 0.06014, which is higher than the merchant credit (C1) weight of 0.04066. This indicates that in the live-streaming marketing environment, consumers attach a relatively high degree of importance to after-sales experience. High-quality after-sales service can not only solve the problems consumers encounter after purchase, but also enhance consumers’ trust in the merchants. The supply chain risk weight is 0.14547, among which the weight of Product Quality (D1) is 0.07468 and the weight of Logistics Distribution Service Quality (D2) is 0.07079. The two are similar, and the former is higher. It reflects the crucial role that product quality and logistics distribution play in live-streaming marketing. Product Quality is a key factor in consumers’ purchasing decisions and also the foundation for the long-term development of live-streaming marketing. Low-quality products not only lead to consumer returns and complaints but also affect the reputation of anchors and merchants. The quality of logistics and distribution services should not be ignored either. Efficient and accurate logistics and distribution can enhance consumers’ shopping experience; otherwise, it may lead to the loss of consumers.
In response to merchant risks, market supervision departments and platforms should join forces to strengthen supervision over merchants [2]. For instance, a unified merchant credit information platform should be established, the credit data of merchants on different live-streaming platforms should be integrated, and merchant credit (C1) should be incorporated into key supervision indicators. For merchants with lower credit ratings, their business activities on live-streaming platforms will be restricted, such as limiting promotion resources and increasing the deposit amount. For supply chain risks, regulatory authorities should strengthen supervision and inspection of Product Quality (D1) and the Logistics Distribution Service Quality (D2). On the one hand, a strict product quality random inspection system should be established, the frequency of random inspections should be increased, and severe penalties on merchants and supply chain enterprises with substandard products should be imposed; on the other hand, the logistics industry association should be urged to formulate unified logistics distribution service standards, require logistics enterprises to submit service quality reports regularly, and rectify enterprises that fail to meet the service quality standards.

5.3.4. Live-Streaming Platforms Risk Analysis and Control Countermeasures

The risks of live-streaming platforms cover multiple aspects, and privacy and security are of great concern. The risk weight of the live-streaming platform is 0.13340, and the privacy leakage risk (E2) weight is the highest at 0.05191, reflecting that in live-streaming marketing, user privacy security is of crucial importance. The platform holds a large amount of user information. Once leaked, it will seriously damage the rights and interests of users. The weight of completeness of platform services (E1) is 0.04300, and the weight of algorithmic price discrimination risk (E3) is 0.03849. It indicates that the quality of platform services and the fairness of algorithms cannot be ignored either. Perfect platform services can enhance user experience, while algorithmic price discrimination will undermine market fairness and affect consumer trust.
Live-streaming platforms play a significant role in live-streaming marketing. In response to the risks they face, platforms should enhance the protection of user data [2], adopt advanced encryption technologies to store and transmit user data, conduct regular data security vulnerability detection and repair, and effectively prevent and control the privacy leakage risk (E2). Meanwhile, standardize the application of platform algorithms, establish an algorithm filing and review mechanism, prevent the Algorithm Price Discrimination Risk (E3), and ensure the fairness and impartiality of the platform’s trading rules. In addition, urge the platform to improve its service functions, enhance the completeness of platform services (E1), and handle the problems reported by users in a timely manner.

5.3.5. MCN Institutions Risk Analysis and Control Countermeasures

The risks of MCN institutions focus on specific fields, and intellectual property risks are prominent. The risk weight of the MCN institution is 0.07804, among which the weight of intellectual property risk (B1) is 0.04679 and the weight of content creation risk (B2) is 0.03125. This reflects that as industry competition intensifies, the legal issues existing in MCN institutions have gradually emerged, such as industry compliance risks, intellectual property risks, and content creation risks [43], posing a threat to the healthy development of the live-streaming marketing ecosystem. It is necessary for MCN institutions to strengthen management, risk prevention, and control.
Considering the intellectual property risk (B1) and content creation risks (B2) existing in MCN institutions, relevant departments such as culture and copyright should strengthen the supervision of MCN institutions, regularly review their content creation processes and intellectual property management situations, and require MCN institutions to establish an internal intellectual property review mechanism. Conduct strict copyright screening on the materials used by its own anchors. At the same time, guide MCN institutions to strengthen the standardized management of content creation, formulate content creation standards and review processes, clearly define the types of content prohibited from being disseminated, and reduce the possibility of risks occurring from the source.

6. Conclusions and Suggestions

To effectively improve consumer satisfaction and enhance consumers’ awareness of risk prevention, this paper systematically analyzes the live-streaming marketing business. The fault tree analysis method and the checklist method are adopted to identify the risk factors of live-streaming marketing. A multi-dimensional live-streaming marketing risk indicator system is constructed based on the three core elements of live-streaming marketing, namely “people–products–scenes”. The Delphi method is used to optimize the initial indicator system. Finally, a live-streaming marketing risk indicator system consisting of three first-level indicators, six second-level indicators, and 16 third-level indicators is formed.
Furthermore, the hesitant fuzzy multi-attribute group decision-making method is applied to calculate the weights of each risk indicator and quantify the live-streaming marketing risks in the live broadcast rooms of three influential celebrity anchors in China. The results show that the top five risk indicators in terms of weight ranking are: Ethical Risk of the AI Anchor (A4), VR Technology Promotion Risk (F3), Anchor Reputation (A1), Product Quality (D1), and Logistics Distribution Service Quality (D2). The comprehensive risks of each live broadcast room are as follows: Y > L > D, which are at the medium risk level, medium-low risk level, and medium-low risk level, respectively. Finally, we analyze the importance of risk indicators and give corresponding management suggestions.
In terms of risk identification, considering the complexity, diversity, and other characteristics of the risks in live-streaming marketing, and the rapid development of this industry with the continuous emergence of new transaction models and marketing means, which leads to the continuous change in risks. Compared with Li et al. who constructed a multi-dimensional risk indicator system by starting from different stakeholders in live-streaming e-commerce and combining with literature analysis [2], this paper systematically analyzes the live-streaming marketing, uses the fault tree analysis method and the risk checklist method to sort out the risk factors, and optimizes them with the Delphi method, effectively reducing subjective biases and making the evaluation indicators more scientific. In terms of risk assessment, although there have been previous studies on evaluating the live-streaming risks of consumers on different platforms, the live broadcast room is a specific scenario where consumers directly interact with anchors and products. Evaluating the risks in the live broadcast room can help accurately analyze specific issues, such as anchors’ false propaganda and induced consumption during the live broadcast process. Therefore, this paper uses the hesitant fuzzy multi-attribute group decision-making method to calculate the weights of risk indicators and evaluate the risks when consumers conduct transactions in the live broadcast rooms of celebrity anchors, helping consumers provide scientific and effective decision-making bases when choosing live broadcast rooms for shopping.
At the theoretical level, this paper enriches the risk identification and evaluation system of live streaming. By deeply analyzing the live-streaming marketing business and constructing a risk evaluation system for live-streaming marketing, it not only helps to deeply understand the internal mechanism of live-streaming marketing, making the theoretical system of live-streaming marketing more complete, but also helps subsequent scholars to analyze newly emerging risk factors on this basis, thus promoting the continuous improvement and development of the theoretical system of live-streaming marketing. In terms of practical significance, on the one hand, it provides decision-making references for regulatory authorities. Regulatory authorities can formulate more targeted policies and regulations based on the identified risk points in this study and strengthen the precise supervision of the live-streaming marketing industry. On the other hand, it helps live-streaming platforms optimize their management. Platforms can improve the content review mechanism and perfect the anchor management methods according to the research results, such as establishing a risk early warning system for different types of anchors to reduce consumers’ risks.
Nevertheless, this paper still has some deficiencies, such as risk factors outside the indicator system continue to appear, so the indicator system proposed in this paper is still not flexible enough. In addition, although the indicator system is applied to three typical live broadcast rooms in this paper, more live broadcast rooms can be evaluated in the future to obtain broader conclusions.
In the future, the research on the risks of live-streaming marketing can be deepened from three aspects. At the data level, a real-time monitoring system is constructed based on natural language processing and computer vision technologies to dynamically capture and analyze the data of the live broadcast room and combine the time series model to achieve early risk warning. Meanwhile, federated learning is utilized to integrate multi-source data, construct a dynamic indicator update framework, and regularly optimize the risk assessment model based on industry feedback and technological development to enhance its adaptability. In category risk research, grounded theory and case study methods are employed. For vertical categories such as beauty and digital products, differences in product characteristics and supply chains are analyzed to construct a specific risk identification framework and formulate differentiated prevention and control strategies. In terms of emerging fields, focus on AI anchors, cross-border live-streaming, and platform-specific risks. Study the risk mechanisms, such as ethical risks and false promotion of AI anchors, establish a risk assessment model, and iteratively optimize it. Construct a risk assessment indicator system for cross-border live streaming in combination with international trade rules, etc., and adjust it dynamically in accordance with the situation and policies. Based on the platform algorithm and governance model, analyze the risk transmission path and improve the governance plan. By establishing a full-process dynamic research framework, we can promote the continuous optimization of the risk prevention and control system in the live-streaming marketing industry and facilitate its sustained and healthy development.

Author Contributions

Conceptualization, C.Z. and J.Z.; methodology, Y.W.; software, C.Z. and Y.W.; validation, C.Z., Y.W. and J.Z.; formal analysis, C.Z. and Y.W.; investigation, Y.W.; resources, J.Z.; data curation, Y.W.; writing—original draft preparation, Y.W.; writing—review and editing, C.Z.; visualization, Y.W.; supervision, J.Z.; project administration, J.Z.; funding acquisition, J.Z. All authors have read and agreed to the published version of the manuscript.

Funding

This research was funded by Characteristics of Illegal Online Transactions and Intelligent Supervision Mode [Grant Number: No. 2023YFC3304901] and Beijing Key Lab of Big Data Decision Making for Green Development.

Institutional Review Board Statement

The study was conducted in accordance with the Declaration of Helsinki and approved by the Institutional Review Board of the School of Management Science & Engineering, Beijing Information Science and Technology University (protocol code 11010810838114 and 3 March 2025).

Informed Consent Statement

Informed consent was obtained from all subjects involved in the study.

Data Availability Statement

All data that support the findings of this study are available from the corresponding author upon reasonable request.

Conflicts of Interest

The authors declare no conflict of interest.

References

  1. SB/T 11240-2023; Specification for Management & Service of Live-Streaming E-Commerce Platform. Ministry of Commerce of the People’s Republic of China: Beijing, China, 2023.
  2. Li, H.; Wang, Z.; Yuan, Z.; Yan, X. Multidimensional Evaluation of Consumers’ Shopping Risks under Live-Streaming Commerce. Sustainability 2023, 15, 14060.5. [Google Scholar] [CrossRef]
  3. CNNIC (China Internet Network Information Center). The 53rd Statistical Report on China’s Internet Development Released. 2024. Available online: https://www.cnnic.net.cn/n4/2024/0321/c208-10962.html (accessed on 26 March 2024).
  4. Yu, B. Research on the Criminal Risks of MCN Institutions in Online Live-streaming Marketing Activities. Shandong Soc. Sci. 2021, 35, 187–192. [Google Scholar]
  5. Huang, M.; Ye, Y.; Wang, W. The Interaction Effect of Broadcaster and Product Type on Consumers’ Purchase Intention and Behaviors in Livestreaming Shopping. Nankai Bus. Rev. 2023, 26, 188–198. [Google Scholar]
  6. Zhang, N.; Wei, X.; Zhang, Z. Game theory analysis on credit risk assessment in E-commerce. Inform. Process. Manag. 2022, 59, 102763. [Google Scholar]
  7. Wang, L.; Song, H. E-Commerce Credit Risk Assessment Based on Fuzzy Neural Network. Comput. Intell. Neurosci. 2022, 2022, 10. [Google Scholar] [CrossRef]
  8. Maseeh, H.I.; Jebarajakirthy, C.; Pentecost, R.; Arli, D.; Weaven, S.; Ashaduzzaman, M. Privacy concerns in e-commerce: A multilevel meta-analysis. Psychol. Mark. 2021, 38, 1779–1798. [Google Scholar] [CrossRef]
  9. Karoui, K. Security novel risk assessment framework based on reversible metrics: A case study of DDoS attacks on an E-commerce web server. Int. J. Netw. Manag. 2016, 26, 553–578. [Google Scholar] [CrossRef]
  10. Liu, X.; Ahmad, S.F.; Anser, M.K.; Ke, J.; Irshad, M.; Ul-Haq, J.; Abbas, S. Cyber security threats: A never-ending challenge for e-commerce. Front. Psychol. 2022, 13, 927398. [Google Scholar] [CrossRef]
  11. Song, B.; Yan, W.; Zhang, T. Cross-border e-commerce commodity risk assessment using text mining and fuzzy rule-based reasoning. Adv. Eng. Inform. 2019, 40, 69–80. [Google Scholar] [CrossRef]
  12. García-Salirrosas, E.; Rondon-Eusebio, R. Influence of Retail e-Commerce Website Design on Perceived Risk in Online Purchases. In Proceedings of the 2022 7th International Conference on Business and Industrial Research (ICBIR), Bangkok, Thailand, 19–20 May 2022; pp. 732–737. [Google Scholar]
  13. Urrea, N.T.; Vishkaei, B.M.; De Giovanni, P. Operational Risk Management in E-Commerce: A Platform Perspective. IEEE Trans. Eng. Manag. 2024, 71, 3807–3819. [Google Scholar] [CrossRef]
  14. Zhou, L.; Wang, J.; Li, F.; Xu, Y.; Zhao, J.; Su, J. Risk Aversion of B2C Cross-Border e-Commerce Supply Chain. Sustainability 2022, 14, 8088. [Google Scholar] [CrossRef]
  15. Mu, W. Analysis and Warning Model of Logistics Risks of Cross-Border E-Commerce. Discrete. Dyn. Nat. Soc. 2022, 2022, 10. [Google Scholar] [CrossRef]
  16. Yu, H.; Yu, J. On Tax Risk Management of Cross-Border E-Commerce Export Enterprises. Int. Tax. China 2024, 37, 64–69. [Google Scholar]
  17. Su, J.; Wang, D.; Zhang, F.; Xu, B.; Ouyang, Z. A Multi-Criteria Group Decision-Making Method for Risk Assessment of Live-Streaming E-Commerce Platform. J. Theor. Appl. Electron. Commer. Res. 2023, 18, 1126–1141. [Google Scholar] [CrossRef]
  18. Peng, Y.; Wang, Y.; Li, J.; Yang, Q. Impact of AI-Oriented Live-Streaming E-Commerce Service Failures on Consumer Disengagement—Empirical Evidence from China. J. Theor. Appl. Electron. Commer. Res. 2024, 19, 1580–1598. [Google Scholar] [CrossRef]
  19. Kim, B.; Chen, Y.; Kim, D. Key factors influencing customer loyalty in live commerce: The role of perceived value and perceived risk. Soc. Behav. Personal. 2023, 51, e12656. [Google Scholar] [CrossRef]
  20. Ghasemi, F.; Sari, M.H.M.; Yousefi, V.; Falsafi, R.; Tamosaitiene, J. Project Portfolio Risk Identification and Analysis, Considering Project Risk Interactions and Using Bayesian Networks. Sustainability 2018, 10, 1609. [Google Scholar] [CrossRef]
  21. Xiao, Q.; Luo, F.; Li, Y. Risk Assessment of Seaplane Operation Safety Using Bayesian Network. Symmetry 2020, 12, 888. [Google Scholar] [CrossRef]
  22. Mukherjee, N.; Hugé, J.; Sutherland, W.J.; McNeill, J.; Van Opstal, M.; Dahdouh-Guebas, F.; Koedam, N. The Delphi Technique in Ecology and Biological Conservation: Applications and Guidelines. Methods Ecol. Evol. 2015, 6, 1097–1109. [Google Scholar] [CrossRef]
  23. Lei, X.; MacKenzie, C.A. Assessing risk in different types of supply chains with a dynamic fault tree. Comput. Ind. Eng. 2019, 137, 106061. [Google Scholar] [CrossRef]
  24. Sherwin, M.D.; Medal, H.R.; MacKenzie, C.A.; Brown, K.J. Identifying and mitigating supply chain risks using fault tree optimization. IISE Trans. 2020, 52, 236–254. [Google Scholar] [CrossRef]
  25. Xu, C.; Wang, C.; Ding, Y.; Wang, W. Investigation of extremely severe traffic crashes using fault tree analysis. Transp. Lett. 2020, 12, 149–156. [Google Scholar] [CrossRef]
  26. Chen, Y.; Wang, K.; Xu, C.; Shi, Q.; He, J.; Li, P.; Shi, T. Evaluation of the Safety Performance of Highway Alignments Based on Fault Tree Analysis and Safety Boundaries. Traffic Inj. Prev. 2018, 19, 409–416. [Google Scholar] [CrossRef]
  27. Kaur, S.; Singh, S.; Gupta, S.; Wats, S. Risk Analysis in Decentralized Finance (DeFi): A Fuzzy-AHP Approach. Risk Manag. 2023, 25, 13. [Google Scholar] [CrossRef]
  28. Li, S.; Gu, X. Education: Based on Literature Review and Delphi-AHP Method. Educ. Technol. Soc. 2023, 26, 187–202. [Google Scholar]
  29. Fan, H.; Lu, J.; Chang, Z.; Ji, Y. A Bayesian Network-Based TOPSIS Framework to Dynamically Control the Risk of Maritime Piracy. Marit. Policy Manag. 2024, 51, 1582–1601. [Google Scholar] [CrossRef]
  30. Torra, V.; Narukawa, Y. On hesitant fuzzy sets and decision. In Proceedings of the 18th IEEE International Conference on Fuzzy Systems, Jeju Island, Republic of Korea, 20–24 August 2009; pp. 1378–1382. [Google Scholar]
  31. De Luca, A.; Termini, S. A definition of a non-probabilistic entropy in the setting of fuzzy sets theory. Inf. Control. 1972, 20, 301–312. [Google Scholar] [CrossRef]
  32. Kosko, B. Fuzzy entropy and conditioning. Inf. Sci. 1986, 40, 165–174. [Google Scholar] [CrossRef]
  33. Tan, J.; Liu, G. Study on Non-probabilistic Entropy for Hesitant Fuzzy Set and its Application. Oper. Res. Manag. Sci. 2024, 33, 173–179. [Google Scholar]
  34. Qu, G.; Xue, R.; Li, T.; Qu, W.; Xu, Z. A Stochastic Multi-Attribute Method for Measuring Sustainability Performance of a Supplier Based on a Triple Bottom Line Approach in a Dual Hesitant Fuzzy Linguistic Environment. Int. J. Environ. Res. Public. Health 2020, 17, 2138. [Google Scholar] [CrossRef]
  35. Gao, Z.; Zhang, Z.; Peng, D. The Hesitant Fuzzy EGRAS Method for Evaluating the Risk of Returning to Poverty. Stat. Decis. 2022, 38, 15–19. [Google Scholar]
  36. Zhao, W. Growth and Risk Analysis of Live-streaming E-commerce from the Perspective of Consumer Interests. J. Commer. Econ. 2021, 18, 108–110. [Google Scholar]
  37. Feng, H. Problems Existing in the Live-streaming E-commerce Industry and Governance Countermeasures. People’s Trib. 2023, 32, 104–106. [Google Scholar]
  38. Wang, L. Research on supply chain risk management of Yantai Apple livebroadcast e-commerce based on entropy weight method and OWA. Master’s Thesis, Nanchang University, Nanchang, China, 2023. [Google Scholar]
  39. Huang, Y.; Li, Y.; TEO BSX. The mechanism of e-commerce anchor attributes on consumers′ purchase intention based on grounded theory. Cent. Eur. Manag. J. 2023, 31, 1172–1192. [Google Scholar]
  40. Zhong, D.; Wu, F.; Huang, Z.; Chen, Y. Navigating the human-digital nexus: Understanding consumer intentions with AI anchors in live commerce. Behav. Inform. Technol. 2025, 1–16. [Google Scholar] [CrossRef]
  41. Zhang, S. Ethical Scrutiny and Risk Avoidance of AI Anchors in the Age of Artificial Intelligence. Contemp. TV 2022, 37, 84–87. [Google Scholar]
  42. Han, X. Historicising Wanghong economy: Connecting Platforms through Wanghong and Wanghong Incubators. Celebr. Stud. 2021, 12, 317–325. [Google Scholar] [CrossRef]
  43. Liu, M.; Huo, F. Analysis of Legal Risks in the MCN Industry. Netinfo Secur. 2021, 21, 94–96. [Google Scholar]
  44. Hu, C.; Chen, W.; Zhou, Y.; Chen, C.; Sun, S. Regulation Mechanism of Live-streaming E-commerce Based on Evolutionary Gametheory. J. Manag. Sci. China 2023, 26, 126–141. [Google Scholar]
  45. Hangzhou.com.cn. Consumer Association of Puyang City, Henan Province Issues “3•15” Warning, Exposing Consumer Risks in the Era of AI and Big Data 2025. Available online: https://xiaofei.hangzhou.com.cn/xfjs/content/2025-03/18/content_9780626.html (accessed on 21 March 2025).
  46. Yu, Q.; Jia, R.; Zhang, X. Analysis on the Influencing Factors of Customer Satisfaction under the E-commerce Model of Live Broadcast Assisting Agriculture. China Collect. Econ. 2022, 38, 54–56. [Google Scholar]
  47. Zhang, C.; Zhang, J.; Yang, Q. Identifying Critical Risk Factors in Green Product Certification Using Hybrid Multiple-Criteria Decision-Making. Sustainability 2022, 14, 4513. [Google Scholar] [CrossRef]
  48. Zhang, C.; Tang, L.; Zhang, J.; Wang, Z. Using Social Network Analysis to Identify the Critical Factors Influencing Residents’ Green Consumption Behavior. Systems 2023, 11, 254. [Google Scholar] [CrossRef]
  49. Zadeh, L.A. Fuzzy sets. Inf. Control. 1965, 8, 338–353. [Google Scholar] [CrossRef]
  50. Farhadinia, B. Information measures for hesitant fuzzy sets and interval-valued hesitant fuzzy sets. Inf. Sci. 2013, 240, 129–144. [Google Scholar] [CrossRef]
  51. Xu, Z.; Xia, M. Hesitant fuzzy entropy and cross-entropy and their use in multiattribute decision-making. Int. J. Intell. Syst. 2012, 27, 799–822. [Google Scholar] [CrossRef]
  52. Wang, Y.; Miao, M. Application of exponential hesitation fuzzy entropy in multi-attribute decision making. Control. Decis. 2022, 37, 1460–1468. [Google Scholar]
  53. Lv, J.; Guo, S.; Guo, F. Study on hesitant fuzzy information measures and their clustering application. Comput. Intell. Neurosci. 2019, 2019, 5370763. [Google Scholar] [CrossRef]
Figure 1. Business diagram of live-streaming marketing.
Jtaer 20 00120 g001
Figure 2. Implementation process of the HFMGDM.
Jtaer 20 00120 g002
Figure 3. Risk identification and evaluation model for live-streaming marketing.
Jtaer 20 00120 g003
Figure 4. The risk indicator system of live-streaming marketing.
Jtaer 20 00120 g004
Figure 5. Descriptive statistics of the characteristics of live-streaming users.
Jtaer 20 00120 g005
Table 1. Risk evaluation indicator system for live-streaming marketing.
First-Level Risk IndicatorsSecond-Level Risk IndicatorsThird-Level Risk IndicatorsRisk Description
“People”
Risks
AnchorAnchor Reputation [37]The social evaluation and trustworthiness of the anchor formed based on professionalism, credibility, and public feedback.
Anchor Influence [38,39]The guiding role and social effect of the anchor on the audience’s attitude, decision-making, and behavior through content dissemination, interactive behavior, and public image.
Compliance Degree of Marketing Behaviors [36]The degree of compliance with norms and standards when the anchor is engaged in marketing activities such as product promotion and advertising.
Ethical Risk of the AI Anchor [41]Potential risks of AI anchors violating human values and moral norms in the live-streaming marketing process.
MCN
Institution
Intellectual Property Risk [43]The risks arising from the violation of intellectual property laws due to the unauthorized use of others’ works, trademarks, or patents in live-streaming or promotions.
Content Creation Risk [43]The risks faced due to the violation of laws and regulations by releasing false propaganda, illegal advertisements, or harmful information in live-streaming or content.
“Product” RisksMerchantMerchant Credit [36]The accumulated credit and reputation of the merchant.
Degree of Account Standardization [1]The degree of standardization of various types of information in the merchant’s account.
After-sales Service Completeness [36]The level of support and services provided by the merchant after consumers have purchased products.
Supply ChainProduct Quality [36]The level at which the goods offered by the merchant meet customer needs, expectations, and standards.
Logistics Distribution Service Quality [46]The level of a series of logistics management and distribution services.
“Scene”
Risks
Live-streaming PlatformCompleteness of Platform Services [37]The degree to which the platform systematically meets user needs and continuously optimizes in aspects such as user experience and after-sales service.
Privacy Leakage Risk [2]Platforms rely on big data to analyze users’ behaviors, preferences, and consumption habits, but the collection and storage of a large amount of user data may trigger the risk of privacy leakage.
Algorithmic Price Discrimination Risk [45]Big data analysis may lead to price discrimination through algorithms. The use of algorithms to manipulate the background to offer differentiated prices and other services to different users will damage the rights and interests of consumers.
Rationality of Interface Setting [2]The degree to which the presentation of information and the operation process are optimized through scientific layout and intuitive design, so as to enhance the user experience.
Consumption ScenarioAuthenticity of Viewer Numbers [36]The degree to which technical means and rule-based constraints are utilized to ensure the authenticity of the viewer data in the live-streaming room, the absence of false volume-brushing behaviors, and the accurate reflection of the actual viewer size.
Authenticity of Sales Data [36]The degree to which technical monitoring and rule constraints are used to ensure the authenticity and credibility of transaction data (such as transaction volume and sales amount), and the absence of false order brushing or manipulation behaviors.
VR Technology Promotion Risk [45]The excessive beautification or false presentation of products using VR technology may mislead consumers about the actual effects of the products, resulting in negative impacts.
Table 2. Professional backgrounds of the selected six experts for the Delphi survey.
ExpertDutyGenderAgeSpecialist TopicLocationSeniority
AProfessorMale52Risk ManagementBeijing20–25
BProfessorFemale47Live-streaming MarketingLiaoning15–20
CAssociate ProfessorMale42MarketingBeijing10–15
DProfessorMale57Multi-attribute Decision-makingTaiwan, China10–15
EResearch FellowFemale36Live-streaming MarketingShandong10–15
FSenior ManagerMale49MarketingShanghai15–20
Table 3. Necessity analysis of risk factors in the second round of the Delphi questionnaire.
Second-Level Risk IndicatorsThird-Level Risk IndicatorsNecessity ScoringMean ValueStandard DeviationCDIWhether to Eliminate
ABCDEF
AnchorAnchor Reputation5455544.667 0.471 0.101 No
Anchor Influence3444433.667 0.471 0.129 No
Compliance Degree of Marketing Behaviors5555544.833 0.373 0.077 No
Ethical Risk of the AI Anchor5554554.833 0.373 0.077 No
MCN
Institution
Intellectual Property Risk4455444.333 0.471 0.109 No
Content Creation Risk4344433.667 0.471 0.129 No
MerchantMerchant Credit5454554.667 0.471 0.101 No
Degree of Account Standardization3344323.167 0.687 0.217 No
After-sales Service Completeness4455544.500 0.500 0.111 No
Supply ChainProduct Quality5555544.833 0.373 0.077 No
Logistics Distribution Service Quality5445444.333 0.471 0.109 No
Live-streaming
Platform
Completeness of Platform Services4445544.333 0.471 0.109 No
Privacy Leakage Risk5555555.000 0.000 0.000 No
Algorithmic Price Discrimination Risk4554544.500 0.500 0.111 No
Rationality of Interface Setting2333322.667 0.471 0.177 Yes
Consumption ScenarioAuthenticity of Viewer Numbers3354433.667 0.745 0.203 No
Authenticity of Sales Data4345534.000 0.816 0.204 No
VR Technology Promotion Risk5554454.667 0.471 0.101 No
Table 4. Necessity analysis of risk factors in the third round of the Delphi questionnaire.
Second-Level Risk IndicatorsThird-Level Risk IndicatorsNecessity ScoringMean ValueStandard DeviationCDIWhether to Eliminate
ABCDEF
AnchorAnchor Reputation5455544.667 0.471 0.101 No
Anchor Influence3444433.667 0.471 0.129 No
Compliance Degree of Marketing Behaviors5555544.833 0.373 0.077 No
Ethical Risk of the AI Anchor5554554.833 0.373 0.077 No
MCN
Institution
Intellectual Property Risk4455444.333 0.471 0.109 No
Content Creation Risk4344433.667 0.471 0.129 No
MerchantMerchant Credit5454554.667 0.471 0.101 No
Degree of Account Standardization3333322.833 0.373 0.132 Yes
After-sales Service Completeness4455544.500 0.500 0.111 No
Supply ChainProduct Quality5555544.833 0.373 0.077 No
Logistics Distribution Service Quality5445444.333 0.471 0.109 No
Live-streaming
Platform
Completeness of Platform Services4445544.333 0.471 0.109 No
Privacy Leakage Risk5555555.000 0.000 0.000 No
Algorithmic Price Discrimination Risk4554544.500 0.500 0.111 No
Rationality of Interface Setting2333322.667 0.471 0.177 Yes
Consumption ScenarioAuthenticity of Viewer Numbers3444433.667 0.471 0.129 No
Authenticity of Sales Data4445534.167 0.687 0.165 No
VR Technology Promotion Risk5554454.667 0.471 0.101 No
Table 5. Basic information about three celebrity anchors.
AnchorThe Platform That the Anchor Has Settled inMain Types of Goods for Live-Streaming SalesProduct Promotion Style
LTaobaoBeauty products, maternal and infant products, pet products, etc.Provide professional and detailed explanations, possess great infectiousness, and be proficient in using exaggerated emotions and language to drive the purchasing atmosphere.
YDouyinFood products, daily necessities, etc.Mainly featuring humorous and funny, exaggerated performances, creating joyous scenes through interactions between brothers.
DDouyinAgricultural products, food products, books, etc.Knowledge-based live-selling. The anchor incorporates cultural knowledge and life insights while introducing products.
Table 6. Hesitant fuzzy decision-making matrix.
A1A2A3A4
L{0.4, 0.5, 0.6, 0.7, 0.8, 0.9}{0.4, 0.5, 0.6, 0.7, 0.8}{0.4, 0.5, 0.6, 0.7}{0.1, 0.2, 0.3}
Y{0.8, 0.9, 1.0}{0.7, 0.8, 0.9, 1.0}{0.5, 0.6, 0.7, 0.8, 0.9, 1.0}{0.1, 0.2, 0.3}
D{0.1, 0.2, 0.3, 0.4, 0.6}{0.2, 0.3, 0.4, 0.5, 0.6, 0.7}{0.1, 0.2, 0.3, 0.4, 0.5}{0.1, 0.2, 0.3}
B1B2C1C2
L{0.2, 0.3, 0.4, 0.5, 0.6}{0.3, 0.4, 0.6, 0.7, 0.8}{0.2, 0.3, 0.4, 0.5}{0.1, 0.2, 0.3, 0.4, 0.5}
Y{0.5, 0.6, 0.7, 0.8}{0.3, 0.4, 0.5, 0.7, 0.8, 0.9}{0.3, 0.4, 0.5, 0.6, 0.7}{0.2, 0.3, 0.4, 0.5, 0.6, 0.7}
D{0.3, 0.4, 0.5, 0.6, 0.7, 0.9}{0.2, 0.3, 0.4, 0.5, 0.6, 0.7}{0.1, 0.2, 0.4, 0.5, 0.6}{0.1, 0.2, 0.3, 0.4, 0.5}
D1D2E1E2
L{0.1, 0.2, 0.3, 0.5}{0.2, 0.3, 0.4, 0.5}{0.1, 0.2, 0.3, 0.4, 0.5}{0.2, 0.3, 0.4, 0.5}
Y{0.4, 0.5, 0.6, 0.7, 0.8, 0.9}{0.2, 0.3, 0.4, 0.6}{0.3, 0.4, 0.5, 0.6}{0.2, 0.3, 0.4, 0.5, 0.6}
D{0.1, 0.2, 0.3, 0.4, 0.5}{0.1, 0.2, 0.3, 0.4}{0.3, 0.4, 0.5, 0.6}{0.2, 0.3, 0.4, 0.5, 0.6}
E3F1F2F3
L{0.2, 0.3, 0.4, 0.5}{0.1, 0.3, 0.4, 0.5}{0.1, 0.2, 0.3, 0.4, 0.5}{0.1, 0.2, 0.3, 0.4}
Y{0.3, 0.4, 0.5, 0.6}{0.4, 0.5, 0.6, 0.7, 0.8, 0.9, 1.0}{0.4, 0.5, 0.6, 0.7, 0.8, 0.9, 1.0}{0.1, 0.2, 0.3, 0.4, 0.6}
D{0.3, 0.4, 0.5, 0.6}{0.1, 0.2, 0.3, 0.4, 0.5, 0.6}{0.2, 0.3, 0.4, 0.5, 0.6}{0.1, 0.2, 0.3}
Table 7. Non-probabilistic entropy matrix.
A1A2A3A4B1B2C1C2
L0.579480.688250.826160.268640.688250.809430.557090.46442
Y0.142860.218220.393610.268640.557090.712881.000000.83576
D0.517970.835760.464420.268640.793490.835760.607760.46442
D1D2E1E2E3F1F2F3
L0.422000.557090.464420.557090.557090.516740.464420.36116
Y0.579480.627650.826160.688250.826160.495260.495260.51797
D0.464420.361160.826160.688250.826160.579480.688250.26864
Table 8. Weights of the risk indicator system of live-streaming marketing.
Second-Level Risk IndicatorsWeightThird-Level Risk IndicatorsWeight
Anchor0.31775Anchor Reputation (A1)0.08566
Anchor Influence (A2)0.06123
Compliance Degree of Marketing Behaviors (A3)0.06405
Ethical Risk of the AI Anchor (A4)0.10681
MCN
Institution
0.07804Intellectual Property Risk (B1)0.04679
Content Creation Risk (B2)0.03125
Merchant0.10079Merchant Credit (C1)0.04066
After-sales Service Completeness (C2)0.06014
Supply Chain0.14547Product Quality (D1)0.07468
Logistics Distribution Service Quality (D2)0.07079
Live-streaming Platform0.13340Completeness of Platform Services (E1)0.04300
Privacy Leakage Risk (E2)0.05191
Algorithmic Price Discrimination Risk (E3)0.03849
Consumption Scenario0.22455Authenticity of Viewer Numbers (F1)0.06857
Authenticity of Sales Data (F2)0.06582
VR Technology Promotion Risk (F3)0.09017
Table 9. Weighted distances to the positive and negative ideal solutions.
The Live Broadcast Room of the AnchorDistance to the Positive Ideal Solution (d+)Distance to the Negative Ideal Solution (d)
L1.32390 0.84150
Y1.03439 1.26531
D1.44586 0.79683
Table 10. Comprehensive evaluation of risks.
The Live Broadcast Room of the AnchorComprehensive Evaluation ValueRisk Level
L0.38861medium-low risk
Y0.55021medium risk
D0.35530medium-low risk
Table 11. Risk evaluation values of the secondary indicator dimensions.
Anchor RiskMCN
Institution Risk
Merchant RiskSupply Chain RiskPlatform RiskConsumption Scenario Risk
L0.492200.466610.332280.326080.343500.30420
Y0.626470.615050.472160.526070.433630.55192
D0.327020.517040.342050.293540.433630.32925
Disclaimer/Publisher’s Note: The statements, opinions and data contained in all publications are solely those of the individual author(s) and contributor(s) and not of MDPI and/or the editor(s). MDPI and/or the editor(s) disclaim responsibility for any injury to people or property resulting from any ideas, methods, instructions or products referred to in the content.

