Article

More Haste, Less Speed: How Update Frequency of Mobile Apps Influences Consumer Interest

1
College of Economics and Management, Huazhong Agricultural University, No. 1 Shizishan Street, Honsghan District, Wuhan 430070, China
2
Business School, Huanggang Normal University, Huanggang City Development Zone, Xingang 2nd Road, Huanggang 438000, China
3
Economics and Management School, Wuhan University, 299 Bayi Road, Wuchang District, Wuhan 430072, China
*
Author to whom correspondence should be addressed.
J. Theor. Appl. Electron. Commer. Res. 2021, 16(7), 2922-2942; https://doi.org/10.3390/jtaer16070160
Submission received: 22 July 2021 / Revised: 13 October 2021 / Accepted: 22 October 2021 / Published: 27 October 2021

Abstract

:
The present study proposes a theoretical framework that uncovers the joint effects of the update frequency of apps and product type of the update on consumer interest and its underlying mechanisms. Building on the theory of mental accounting and regulatory focus, we propose that the effects of update frequency on consumer interest are different for hedonic products and utilitarian products. The authors give insights into the main effects with an empirical analysis of a field data set and establish an understanding of the fundamental mechanisms by two laboratory experiments. The findings show that for hedonic products, high update frequency contributes to higher consumer interest by affecting the benefit perception of consumers. For utilitarian products, low update frequency results in higher consumer interest by influencing the risk perception of consumers. Furthermore, the level of update can affect the combined effects of product type and update frequency on consumer interest and, particularly for low update levels, the aforementioned association can be reversed.

1. Introduction

The app industry has grown rapidly in recent years, becoming a pillar industry of global information goods. However, due to low entry barriers and convenient access to a vast customer base, competition in this industry is fierce. More than 4000 new apps are introduced to the current pool of 5 million apps every day, posing challenges to the tech industry. First, consumers are confronted with a large number of apps developed by small businesses with no credibility. This, along with a lack of available information about the product benefits, raises consumer skepticism about the product. Second, as stated by Arora et al. [1], many applications in app stores lack a quality mechanism and contain repetitive content, malware, or violate user privacy [2], resulting in additional undesirable outcomes for potential users. Thus, the issue of attracting and motivating the intrinsic interest of consumers in the product is critical to the success of the product.
To accomplish this goal, a popular strategy used by developers is product enhancement, which entails making changes to existing products, such as fixing defects [3] or upgrading products with newer and more functionalities [4]. Product enhancement strategies target both new and existing consumers [5]. It thus adds value by offering an improved product with new benefits to existing customers, who will then spread positive word of mouth and attract more potential customers [6]. Product enhancement as a strategy is beneficial in many ways, but it has drawbacks when implemented. According to the existing literature on the update decisions of consumers [5,7,8], when faced with an update decision, consumers still compare the value of the improved product to the sunk cost of the current product. In a similar vein, we propose that in cases of app update decision, it is essentially a tradeoff mechanism between gains and losses for customers, where ‘gains’ refer to the benefits provided by the product attributes and ‘losses’ refer to the undesired consequences of the enhanced apps, such as performance risk, time risk, and learning cost, among others. When the undesired consequences outweigh the desired consequences, customers will uninstall the app or simply leave it on their devices without using it or providing feedback to the company.
The majority of recent app enhancement research has focused on app updates. This line of research centers on how the form of update and the update time pattern influence consumer perceptions and decisions [9,10,11]. In addition, previous research has primarily focused on the benefits that a product update brings to customers while ignoring the potential loss perception of customers during the update process. There are few studies focused on the interaction of the two terms, i.e., the form of update and the update time pattern. According to the theory of mental accounting [12,13], frequency of losses and gains can affect the value perceptions of customers, and we argue that update frequency will influence the value perceptions of customers, and therefore their interest based on the degree to which they anticipate gains or losses. Furthermore, consumer goals for gains and losses can be contextually triggered by priming and message framing strategies [14], such as product type. Therefore, in contrast to previous studies, we focus on the combined effect of update frequency and type of update, considering both the benefit and risk perception of consumers in the continuous updating process. Specifically, we examine how update frequency affects consumer interest for different types of updates—that is, whether developers update on a hedonic product vs. a utilitarian product, and we also look at the boundary effect of update level on the former relationship.
We use three studies including field data analysis and laboratory experiments. By using the downloads to measure consumer interest, we find that update frequency can boost consumer interest on some occasions but can also jeopardize consumer interest on other occasions. In order to check the fundamental mechanism, we further conduct two lab experiments to test how the effect of update frequency could be affected by related factors such as product type and update level. It is suggested that product type moderates the effect of update frequency on consumer interest. In particular, frequent updating can increase customer interest in hedonic products by raising their benefit perception, while slower updating promotes consumer interest in utilitarian products by lowering the risk perception of consumers. Furthermore, the level of update can have an effect on this relationship.
The remainder of the article is organized as follows. We begin with a conceptual overview and hypotheses development. We then provide empirical evidence backing up our predictions. We carry out three studies. The first study is a field data analysis to determine the main effect. Studies 2 and 3 are experimental studies designed to investigate psychological mechanisms. Study 4 is a qualitative study that uses the Delphi Method to analyze expert opinions in order to find support for our hypotheses. We conclude with a discussion of the main theoretical and managerial implications of our findings.

1.1. Conceptual Background and Hypothesis Development

Given the importance of product enhancement strategy in a variety of industries, we focus on the app industry to examine how the value perception of consumers affects their interest in products and how this mechanism may be affected by other relevant factors such as product type and update level.

1.1.1. Product Enhancement/Update Strategy

Marketing and information system scholars have defined the product enhancement strategy as the enterprise strategic behavior that includes fixing defects found by consumers or enterprises to improve product quality and upgrading existing products with expanded functionalities or augmented experiences [5,7,8].
We contend that “update” is a distinct term that should be differentiated from “upgrade”, which refers to a type of relationship expansion in which the consumer purchases an enhanced offer—a higher-priced, upgraded good or service [4,7]. The app update is another form of software enhancement strategy that includes the action of the developer in fixing bugs and introducing additional functionalities to the existing app, but an updated product does not necessarily have to be delivered with a higher price or additional features, i.e., it may simply be an improved product with better qualities or fewer defects. For simplicity, we use “update” hereafter to describe the product enhancement strategy for apps.
Despite the importance of the update/enhancement strategy implemented in app innovation, there is a lack of understanding about its impact and mechanism because researchers have paid little attention to product enhancement in the app industry. Recent app research focuses on the impact of monetization strategy [1], product characteristics [15], app portfolios [16], and app updates [11,17,18,19,20] on app success. We will focus on the last one, which is app updates. The related studies for app updates primarily examine the impact of update type and update time patterns such as update speed and update frequency [9,10,11], but neither line of literature has reached a unanimous conclusion. As an example, in the literature on the impact of update type, Fleischmann et al. [19] focus on the benefits perceived by consumers during the update process and find that only updates with new features increase consumer satisfaction and continuous intention, while updates without new features have no effect on consumer continuous intention. However, Tian et al. [10] find that adding new supporting services and functionalities to an update reduces customer evaluation suggesting that consumers may be concerned about the quality or the waiting cost of the update. The impact of the update time pattern and the underlying mechanism is also unclear in this case. To this end, some evidence indicates that update speed has a positive impact on product performance because it provides early-mover advantages, attracts consumer interest, and adds value for consumers [21,22,23]. However, some studies suggest that an excessive update frequency signals poor quality to users, and that there is an inverted “U” shape relationship between update speed and user downloads [9]. Overall, the impact of update style and frequency on consumer product evaluation, as well as the underlying mechanism, remained unclear.
The following are our propositions for the contradictory results and unclear underlying mechanism: First, it is possible that the update type and time pattern have a combined effect on consumer attitude. Fleischmann et al. [19], for example, show that the positive influence of update frequency on consumer satisfaction does not hold true for updates that only correct flaws. However, current research on how the update type and frequency affect consumer attitude and decision-making is limited. Second, previous research has mostly focused on understanding the benefits of updates while ignoring the potential risk or undesirable impact that customers are concerned about during the updates [9,11,19]. In fact, recent research indicates that with new updates consumers might be concerned about product quality, learning costs, usage disruption, and so on [10,17,20,24,25]. Therefore, in this study, we investigate how app update frequency affects consumer interest in terms of update type (including an update on various types of products) while taking into account the potential positive and negative perceptions of consumers. Table 1 contains the related literature reviews on this line of study.

1.1.2. The Role of Update Frequency in the Product Enhancement Process

Product value is often delivered by app developers by subsequent product enhancement via app updates [24]. When developers update their products, they can often choose between various strategies. For example, a developer may enhance the product by delivering each of the new features or bug fixes immediately after the feature has been developed or the bug has been fixed. Another option is to improve the product after a sufficient number of new features and bug fixes have been accumulated and then deliver them in a larger update package [19]. The former option refers to updating with a high frequency over time, while the latter refers to updating with a low frequency. Nevertheless, the number of new features and bugs fixed is equal under both strategies.
The frequency of updates can influence how consumers perceive the product and, as a result, how they evaluate it [19,26]. In general, consumers form their product evaluations by judgments on desired and undesired consequences, such as perceived benefit and perceived risks [27]. Although consumers perceive relevant benefits when developers deliver new product features to consumers through updates, the updates process also entails a range of risks with monetary and nonmonetary costs. In general, monetary cost refers to the financial payment of the consumers for the enhanced versions, while nonmonetary cost refers to the concern of the consumers about extra time spent downloading, learning, and adapting the product, among other things [28]. As a result, in the product iteration, customers will experience benefits and risks simultaneously. Therefore, when all else is equal, updating the product more often would provide customers with a greater understanding of the benefits of the product due to the increased frequency of product-consumer interactions. However, customers can also perceive higher risk for a variety of reasons. For example, frequent updating reduces the fluency of using the product by requiring the user to spend more time installing and learning the product. Furthermore, when a product is updated often, customers are more likely to believe that more patches or bugs will be patched in later versions [29], resulting in a higher risk perception in product enhancement iterations. Similarly, updates that follow a less frequent pattern can reduce both consumer benefit understanding and risk perception, ceteris paribus. Thus, changing the frequency of updates can both improve and damage the perceptions of customers and their product evaluations.

1.1.3. Theory of Mental Accounting as a Conceptual Basis

To study consumer behavior in product enhancement strategy, researchers have primarily used theory of sunk cost [12,30,31], theory of mental accounting [12,13,31], and segmentation theory [32]. We suggest that, among these theories, the theory of mental accounting—a systematic model of consumer decision-making under uncertainty—provides a robust theory-driven framework to answer our research questions appropriately. While some alternative theories can help understand consumer behavioral mechanisms in product enhancement situations from different perspectives, their ability to assess the effect of update frequency on consumer benefits/risk perceptions is limited. The theory of mental accounting, with origins in economics and psychology, provides a strong mathematical foundation for us to derive propositions and compare results more precisely and rigorously.
Building on the theory of mental accounting, we derive our main hypotheses which delineate the impact of product update frequency on consumer adoption intention. Originated from prospect theory, the value function of perceived values from a given offering is coded as gains and losses [13,33], which is highly amenable to considering consumer benefits/risk perceptions in the current research context. Consistent with the standard assumptions of such theoretical models [33,34], the gain function is assumed to be continuous, twice differentiable, increasing, and convex, while the loss function is assumed to be continuous, twice differentiable, decreasing, and concave. Consumers have a clear choice based on these modeling features. First, the concave nature of the loss function indicates that consumers are much more responsive to loss than to the same amount of gain, implying that we cannot disregard loss perception in updates. Second, derived from the value function, the theory of mental accounting explains how consumers assess value based on various mental accounting constitutions. For example, when the total sum of losses is constant, the theory proposes that a single loss of greater magnitude has a less damaging impact on consumer value perceptions than two different losses of lesser magnitude. Correspondingly, separate gains of a smaller magnitude have a greater impact on consumer value perceptions than a single gain of a larger magnitude.
We argue that the valuation process of the product is essentially determining the gain and loss. When faced with a large number of mobile applications, each with substitutional attributes or functionalities, time- and resource-constrained consumers are more likely to select the product with the most benefits offered by its attributes. These benefits can be utilitarian (e.g., better quality, greater convenience, faster delivery) or hedonic (e.g., fun and enjoyment) [35]. Based on this classification, the acceptance of an online service may vary depending upon the type of service. Furthermore, consumers are more likely to choose the product with the lowest risk, such as performance risk [36,37], which has been shown to be the most significant risk influencing consumer update intention, and time risk [38,39], since most people who use mobile applications are concerned with the convenience of using the product. With most app enhancements having zero sunk cost [28], consumers perceive benefit as a sense of gain in cases where what a customer receives exceeds what she/he pays for or expects. In contrast, they perceive risk as a sense of loss, especially when consumers consider the safety and stability of the product. Thus, the consumer benefit/risk perception is well aligned with their perception of gain/loss.

1.1.4. Goals, Product Type, and Consumer Interest

When customers are faced with sequential updates, it is a tradeoff process between gains and losses, as previously stated. However, in the presence of contextual stimuli, consumer goals for gains and losses can be malleable [40,41]. Chitturi et al. [42], for example, show a correlation between benefit type (hedonic vs. utilitarian benefit) and self-regular focus. In addition, there is converging evidence that consumers expect the fulfillment of prevention goals on the utilitarian dimension and promotion goals on the hedonic dimension [40,41,42,43,44].
Naturally enlightened by this line of research, we propose that the types of goals consumers expect utilitarian products to fulfill vary from those they seek from hedonic products. Hedonic goods are characterized by a relatively affective and sensory experience of aesthetic or sensual pleasure, fantasy, and emotional enjoyment [45,46,47]. Utilitarian goods, on the other hand, are characterized by the relatively functional, instrumental, and practical benefits of consumption offerings [42]. The promotion system for hedonic products emphasizes advancement needs and the pursuit of gains [41]; therefore, customers, in this case, are more concerned with the benefits (gains) of the new product. Finally, in accordance with the paradigm of mental accounting theory, when consumers aspire to seek gains for hedonic products, frequent gains are viewed as more beneficial than aggregate gains; conversely, when consumers intend to avoid losses for utilitarian products, loss integration is preferred over loss segregation. Hence in the context of the product enhancement process for app developers, we propose the following:
Hypothesis 1 (H1).
For hedonic products, a higher update frequency results in higher customer interest than a lower update frequency.
Hypothesis 2 (H2).
For utilitarian products, a lower update frequency results in higher consumer interest than a higher update frequency.
Hypothesis 3 (H3).
Benefit perception mediates the effect of update frequency on consumer interest for hedonic products.
Hypothesis 4 (H4).
Risk perception mediates the effect of update frequency on consumer interest for utilitarian products.

1.1.5. Qualifications and Constraints: Update Level

When discussing enhancement or update options, we often ignore the fact that the update level can vary, which is an important aspect that can be managed to influence consumer perception and interest. The level of update can be used as an auxiliary strategy in the app update process. Most of the time, in addition to update frequency, developers must also determine how many features are delivered in each step of enhancement due to the high risk of innovation and upfront costs. We discussed the effect of update frequency by keeping the overall update level constant in the previous sections. Nevertheless, the frequency of updates in each step of enhancement can be linked to the level of update. When the frequency reaches a certain threshold, the update level becomes relatively low, or even no longer beneficial. However, the update frequencies that are usually observed in practice do not reach this point [19]. In reality, the qualitative relationship between update frequency and customer perceived update level is difficult to capture. Therefore, in the current study, we consider the perceived level of update of the consumer in each segregate update.
We suggest that the level of update can influence the joint effect of update frequency and product type on customer interest. Using the same logic as the taxonomy of radical new and incremental new products, we further classify app enhancement into two categories: radical updates and incremental updates, based on customer perceptions of the update level of the enhanced product. Hedonic products, as previously shown, cause people to have high expectations for new benefits. The high expectations of customers are unlikely to be met in situations where consumers perceive the incremental update level to be small. Chitturi et al. [42] propose that failure to foster the enhanced expectations of the consumer will lead to disappointments and dissatisfaction. In addition, when what a customer receives does not match what she or he expects, Sivakumar [26] proposes that it will result in a perceived loss. Deductively, we argue that when the update frequency is relatively high, this negative perception becomes even worse.
In contrast, for utilitarian goods, incremental updates may help reduce the level of uncertainty and risk consumers perceive for their invoked preventive state. Related to our point of view, Luo et al. [14] suggest that radical new products, due to their perceived level of risk and uncertainty, can stimulate the desire of people to ensure security and maintain the status quo (i.e., prevention goals). The incremental new product, on the other hand, promises to gradually improve product features and experience, which could be intrinsically linked to changes in motivation enhancement goals (i.e., promotion goals). Thus, when the perceived update level is incremental, consumers are more likely to focus on the benefits of the enhanced new products rather than the risks of the product. Therefore, we propose the following hypothesis:
Hypothesis 5 (H5).
The former joint relationship between update frequency and product type on consumer interest can be reversed when the update level is perceived to be incremental/tiny (vs. radical/large). Specifically, consumer interest in hedonic products is higher when the update frequency is low (vs. high), while consumer interest in utilitarian products is higher when the update frequency is high (vs. low). Please see Figure 1.

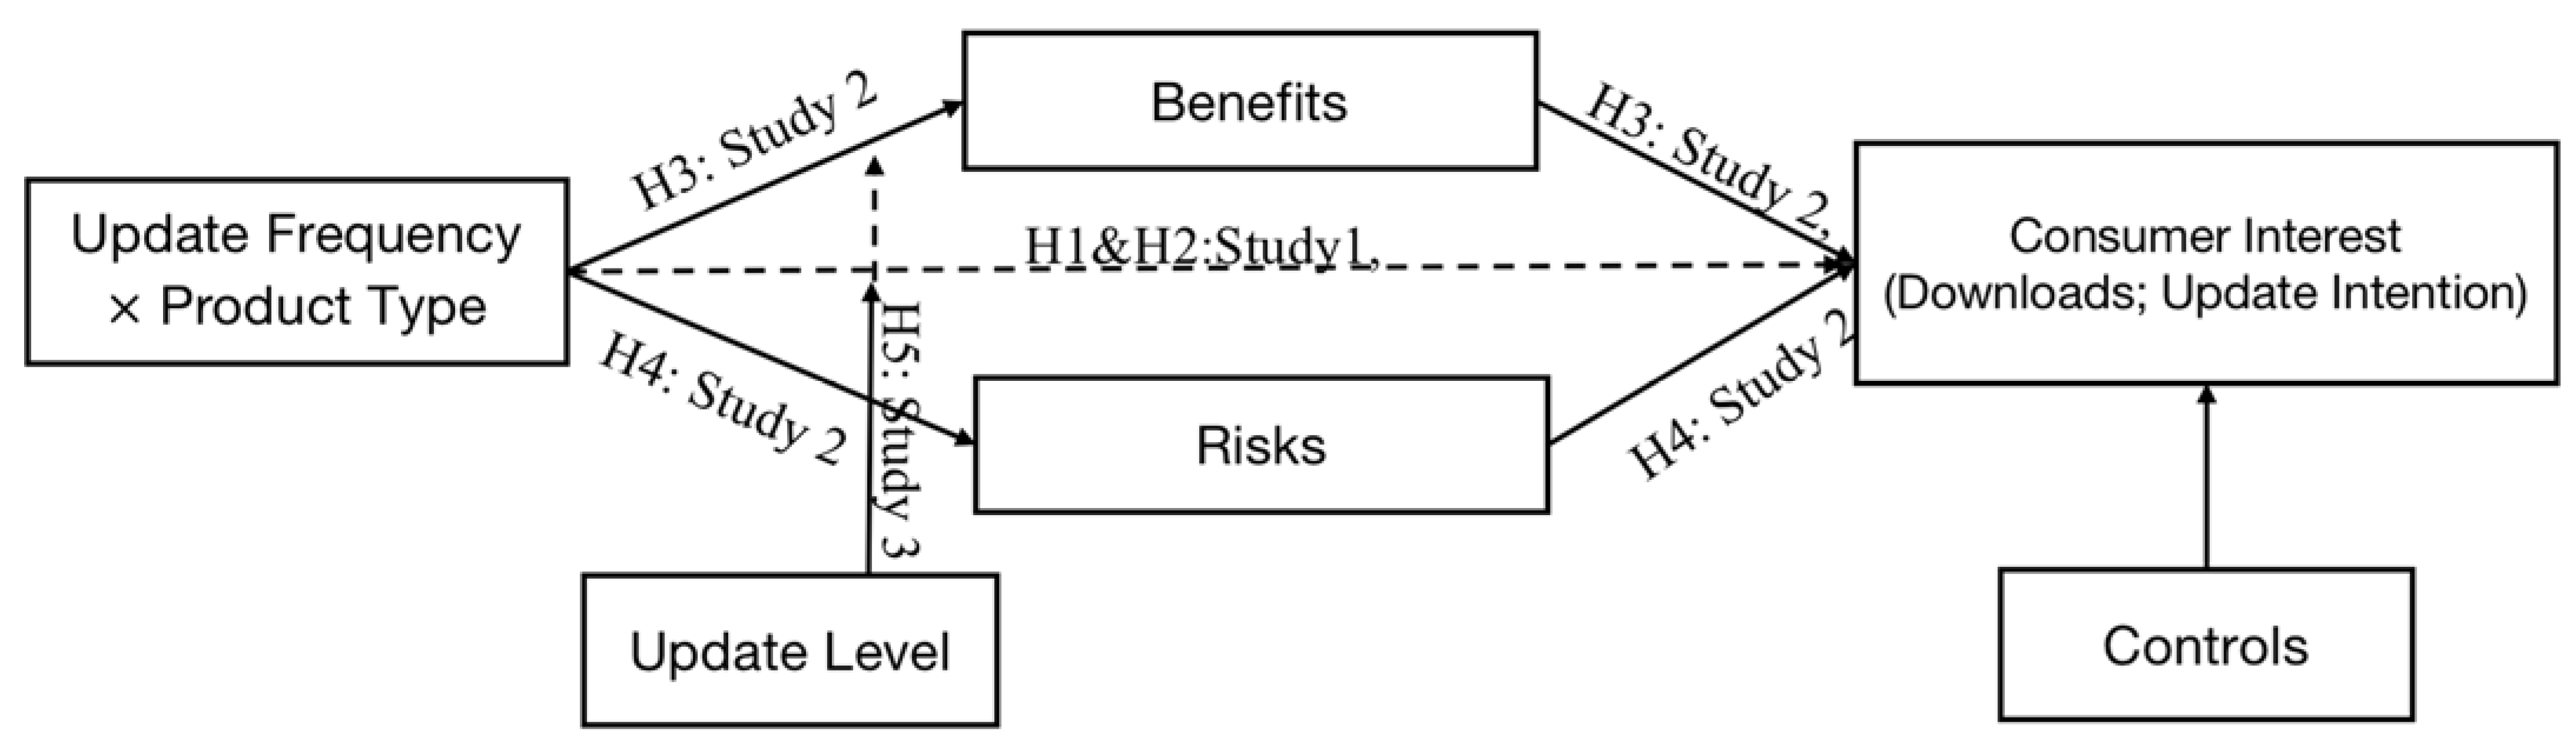
2. Overview of Studies

We conduct three studies to test the hypotheses. Study 1 aims to preliminarily test the main effect in H1 and H2 using field data on app updates. The objective of Study 2 is to validate the robustness of the results in study 1 and to further test the mediation proposed in H3 and H4. Study 3 is conducted to check the boundary conditions and verify H5, as well as to validate the robustness of the previous results. Finally, the results are validated using a qualitative method known as the Delphi Method, in which five experts were interviewed to obtain their opinions on the frequency and level of update of hedonic vs. utilitarian products. Because it is based on personal interviews, the Delphi Method is a powerful technique for identifying expert opinions on a specific phenomenon [48].

3. Study 1: Effect of App Update Frequency on Customer Interest

The relationship between update frequency and product performance was preliminarily investigated in the field. To this end, we analyzed thousands of apps on one of the most popular Chinese app information sites (https://www.qimai.cn, accessed on 21 August 2019), which allows users to query app information from both iOS and Android platforms. The data included app version information, update size and price, customer ratings, number of comments, and the overall number of downloads.
Apps in the platform are organized into various categories based on their intended use. For utilitarian products, we obtained information on apps classified as “system tools”, which are goal-oriented apps downloaded for their practical and functional attributes. For hedonic products, we obtained information on apps classified as “games”, which are pleasure-oriented apps downloaded for their fun and enjoyment value. This classification corresponds to previous research [1].

3.1. Data and Variables

The dataset includes 1193 apps from the “Games” category and 1665 apps from the “System Tools” category, as well as their version information, historical updating date, content, average score, size, user rating information, and aggregate downloads. Table 2, Table 3 and Table 4 summarizes the details of the key variables.

3.1.1. Dependent Variable

We use the given app information data to develop an analytical model of the impact of update frequency on daily consumer interest. User downloads have been commonly used in previous software product surveys as an indicator of consumer interest [9,49,50,51]. Similarly, when analyzing secondary data, we estimate the daily consumer interest by dividing the overall downloads by the life length of an app.

3.1.2. Independent Variables

In study one, the update frequency is calculated as a continuous variable. Operationally, we primitively use the number of versions as a proxy for update frequency by controlling the size of apps. It is reasonable to assume that a larger product size implies a larger set of product features or more workload for the developers. We recognize that this proxy may not be accurate enough to capture the frequency of updates. However, we can approximately capture the update frequency by calculating the number of versions and controlling the size of apps in this context while keeping the total amount of enhancements equal.

3.1.3. Control Variables

First, some product characteristics that may influence adoption should be controlled for in the empirical model. In particular, product type is controlled by a dummy variable, where product “type = 1” indicates that the product belongs to the utilitarian product category and product “type = 0” indicates that the product belongs to the hedonic product category. We also control for the price of the app because it has a significant impact on consumer adoption intention. Furthermore, we control for the age rating and the size of each app, as these two variables can both partially indicate the technical complexity of the product and can be confounding factors. We also control for the product life stage, which may affect overall adoption.
According to previous research [1,52], which uses five aggregated download ranges as different life stages, namely, 500–1000, 1000–5000, 5000–10,000, 10,000–50,000, and 50,000–100,000, we code our data into six levels: level 0–level 5, where stage zero indicates the most initial life stage with overall downloads less than 500, and the remaining levels indicate the same ranges as in previous studies.
In addition to product characteristics, consumer characteristics such as consumer ratings can influence overall adoption because ratings indicate how satisfied consumers are with the product and how much they enjoy the product. Therefore, we add consumer ratings as another control variable in the model. Table 2 depicts variable operationalization.

3.2. Methods

Given that user downloads is a count variable, we first apply the Poisson model. By detecting the problem of over dispersion from Poisson regression, we use the negative binomial regression to account for the over-dispersion of the dependent variable. The conceptual regression model is show below:
η i = e x p ( β 0 + β 1 X i _ u p d a t e   f r e q u e n c y + β 2 X i _ c o n t r o l + β 3 X i _ u p d a t e   f r e q u e n c y × X i p r o d u c t   t y p e )
where η i is the user downloads of app i, X i _ u p d a t e   f r e q u e n c y is the update frequency of product i, X i _ c o n t r o l is a set of control variables, including the price, age rating, size of apps, overall rating, number of ratings for each score, and the product life stage, X i _ u p d a t e   f r e q u e n c y × X i p r o d u c t   t y p e is the interaction term of update frequency and product type such that product type X i p r o d u c t   t y p e is a dummy variable taking the value of 1 for utilitarian product and 0 for the hedonic product. To estimate the parameters, we use the maximum likelihood estimation method.

3.3. Results

Table 5 shows the results of the field data analysis. In Models 1 and 2, we run the regression on the aggregate app data. The results show that the frequency of updates has a significant positive main effect on downloads (p < 0.05). The interaction effect of update frequency and product type on downloads is evidently negative (p < 0.05), indicating that there is possibly an interactive relationship between update frequency and product type on consumer interest. We also explore the main effect of update frequency on hedonic (Model 3) and utilitarian products (Model 4), respectively. Model 3 clearly shows that update frequency for hedonic products has a positive effect on downloads (p < 0.001). However, in Model 4, this effect becomes negative for utilitarian products (p < 0.01). These results are consistent with our intuition, as elucidated in hypotheses H1 and H2.

3.4. Discussion

Field data from thousands of apps validate our assertions and provide preliminary insights into how product type moderates the effect of product update frequency on user downloads. As predicted, there is an interaction effect between product type and update frequency. However, there are several limitations to Study 1. First, we are unable to accurately control the number of new features and bug fixes included in the updates, which may skew our findings. Second, as the dependent variable, user downloads cannot perfectly capture the inherent interest of consumers in app innovation. In addition to one-time downloads, app product revenue is derived primarily from continuous consumer interest, such as update behavior and continuous product engagement. For the following reasons, we capture the inherent consumer interest in the next two studies by analyzing consumer update behavior rather than one-time download behavior. First, user download behavior implies that a consumer has installed the product on their device, but it does not guarantee that the consumer is truly interested in the product (i.e., the apps forgotten in devices have nothing to do with consumer interest). Second, update behavior implies that a consumer pays sustained attention to the app in addition to the download, implying that update behavior is more closely related to inherent consumer interest than download behavior. Therefore, we conduct two additional laboratory experiments to account for the aforementioned limitations and to test the underlying mechanism and boundary condition further.

4. Study 2: The Moderation of Product Type

In Study 2, we manipulated product type in a lab experiment and examined how it moderates the effect of update frequency on consumer interest by implementing A2 (product type: hedonic vs. utilitarian) × 2 (update frequency: high vs. low) between-subject design.

4.1. Participants, Design, and Procedure

We recruited 137 students from a well-known Chinese university (42% female, Mage = 21.65, SD = 3.5) for a small cash incentive (5 RMB, about $0.77). Seven of them were excluded from the analysis due to incomplete information.
We manipulated product type using two fictitious products pretested to be hedonic and utilitarian. To emulate real product settings, we referred to products categorized as game and efficiency (i.e., apps for assisting work and study) in an app store according to a previous study [1]. Our hedonic and utilitarian products were described as an adventure game (Figure S1) and as an audio recording application (Figure S1), respectively. Detailed product information is provided in the Supplementary Materials. Frequency was manipulated in the following way. First, to approximate what occurs in real consumer settings, time cycles were set according to the statistical observation of the field data (given in Study 1): close to the upper quartile for the frequent update condition (15 days ≅ once every two weeks) and close to the lower quantile for the less frequency condition (83 days ≅ once every three months). Second, we controlled the number of features to be equal across groups by stating the same number and content of features in the material about future release plans (details are shown in the Supplementary Materials).
Upon randomly assigning the participants, we first showed them the product information and then provided the release plan for the next three months. We listed a series of new features that would be added by the app developer over that period. Approximating what occurs in real consumer settings, we provided six new features to improve the existing product. In the less frequent group, participants were told that all six features would be released simultaneously three months later in one new product version. In the frequent group, participants were told that the product will be updated and released every two weeks, with each one of the given features (Table 1). We then asked participants to complete a short questionnaire which included items concerning update intention as well as perceived benefits and risks of the product. As control variables, demographic questions regarding age, gender, and education as well as product knowledge and usage frequency of a similar product were included.
The manipulation check was conducted on 45 students from a renowned Chinese university (Mage = 21.28, SD = 1.62). Following Sela and Berger [53], a pretest was conducted prior to the experiment to ensure that the product type was as desired. We asked the students to rate each product on a five-point scale (1 = definitely intended to increase pleasure, 5 = definitely intended to increase practical benefit). Hedonic products received significantly lower ratings than utilitarian products [t(43) = 9.33, p = 0.001, Mhedonic = 2.23, Mutilitarian = 3.76]. The participants also rated their perception of update frequency on a nine-point scale (1 = “very low”; 9 = “very high”) by answering the question: “what do you think about the update frequency of the product?” The high frequency group reported a higher update frequency than the low frequency group (t(43) = 7.58, p = 0.001, Mhigh update frequency = 4.22 > Mlow update frequency = 3.47). These results indicate that the manipulation of the product type and frequency of updates was successful.

4.2. Measures

We used two items to measure product knowledge: “familiar with the features of mobile game apps/mobile efficiency apps”, and “know much about mobile game apps/mobile efficiency apps”. The product usage frequency was measured on a seven-point single item scale (1 = “never”, 2 = “less than once a month”, 3 = “once a month”, 4 = “twice to thrice a month”, 5 = “once a week”, 6 = “twice to thrice a week”, and 7 = “daily”). We estimated the attractiveness of ads by asking participants, “How attractive do you think the advertisement is?” on a scale of 1 to 9 (1 = “not at all attractive”, 9 = “very attractive”). For the mediators, we estimated the perceived benefits with eight items (), including the hedonic and utilitarian attitude items of consumers toward the corresponding benefits [54]. We assessed perceived risks with eight items (=0.81), including the items of performance and time risks of products provided by Feathermana and Pavlou [38]. Update intention (=0.91) was measured with two items scored on a nine-point scale (1 = not at all likely; 9 = extremely likely): “How interested will you be in updating the app?” and “How likely is it that you will update the app?”.

4.3. Analysis and Results

First, contrast analyses show no significant differences in product knowledge, ad attractiveness and usage frequency, or demographic variables between the hedonic and utilitarian product groups. Second, to examine the effect of product type and update frequency on update intention, we conducted A2 (product type) × 2 (update frequency) ANOVA on participant update intention, controlling for product knowledge, ad attractiveness, usage frequency, and demographics. Age, education, gender, usage frequency, and product knowledge had no main effect or interaction effect (ps > 0.1) on product type or update frequency (ps > 0.1).

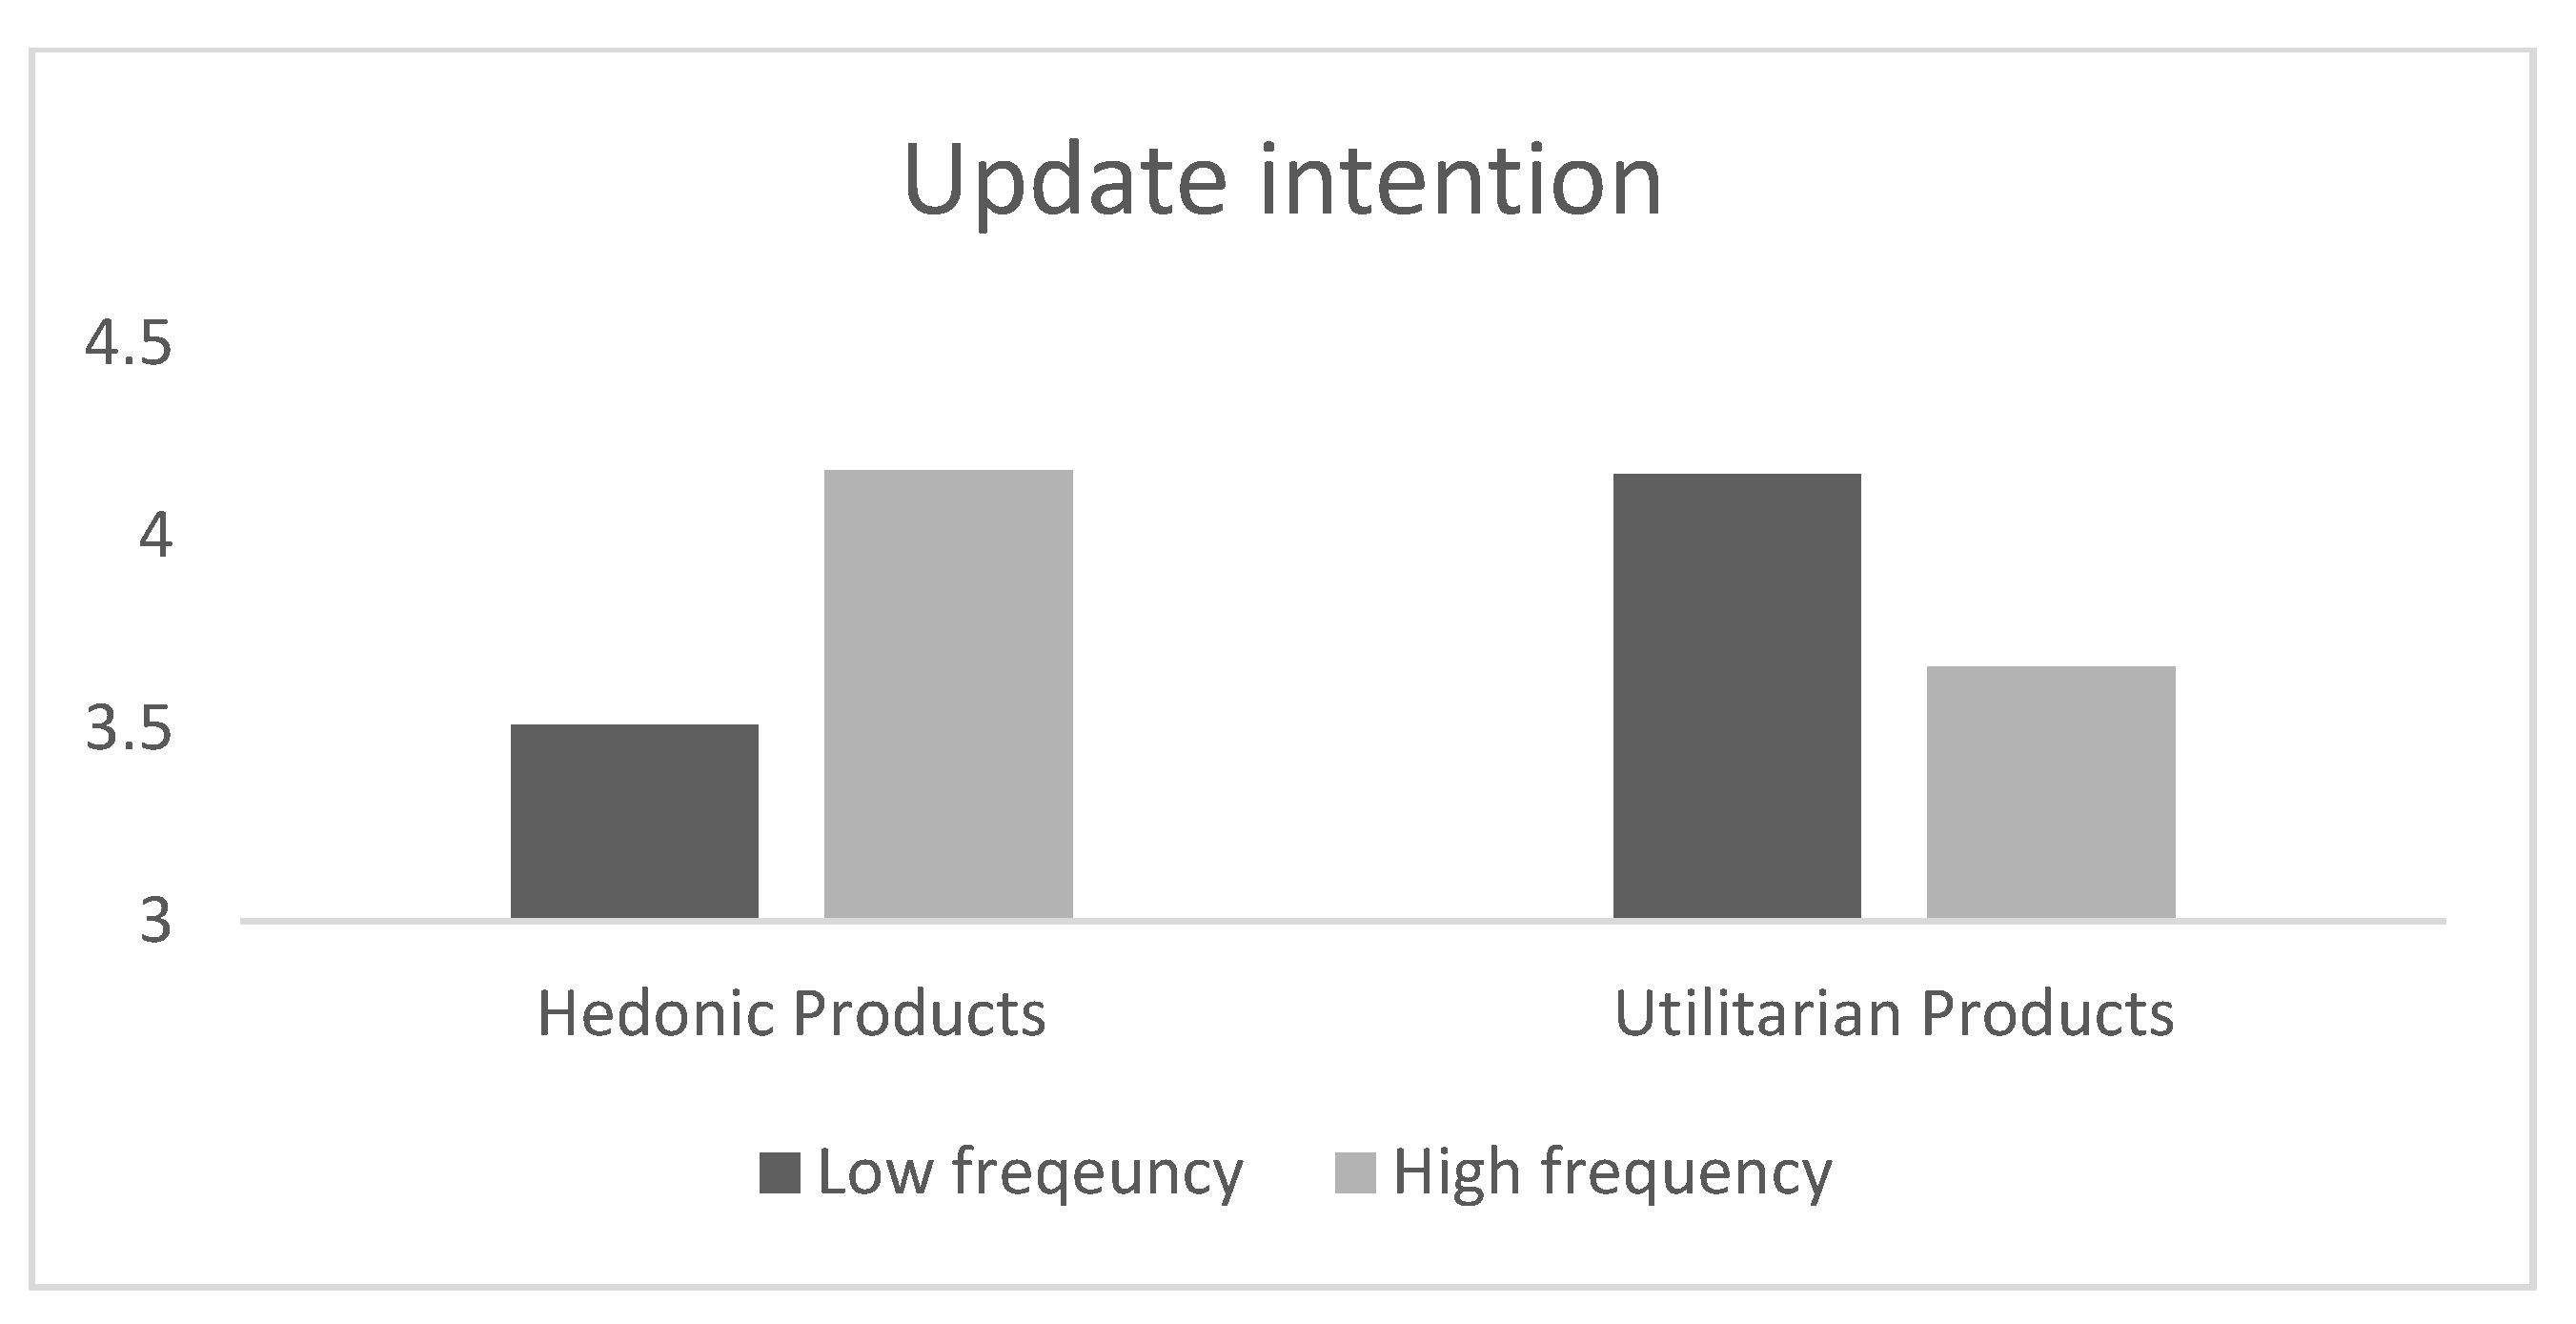
4.3.1. Update Intention

Product type had a significant main effect on update intention (F (1,126) = 5.56, p = 0.019). Ad attractiveness had a significant main effect on update intention (F (1,126) = 25.64, p = 0.001), but did not interact with product type or update frequency (ps > 0.10). The interaction effect of product type and update frequency on update intention was significant (F (1,126) = 8.86, p = 0.003), supporting our line of reasoning. The follow-up contrast analysis revealed that high product update frequency led to high update intention for hedonic products (Mlow = 3.51 Mhigh = 4.17, F (1,126) = 6.10, p = 0.015) (Figure 2). However, subjects reported higher update intention for utilitarian products with low update frequency than products with high frequency (Mlow = 4.16 > Mhigh = 3.66, F (1,126) = 4.51, p = 0.0036). These findings support H1 and H2.
To test the stability of the estimates, we also ran a product type update frequency two-way ANOVA on update intention, excluding ad attractiveness. The interaction effect of product type and update frequency on update intention remained significant (F (1,127) = 19.14, p < 0.001).

4.3.2. Perceived Benefits

A2 (product type) 2 (update frequency) ANOVA on perceived benefits showed only a main effect of update frequency (F (1,127) = 12.88, p = 0.002). Participants perceived more benefits in the high update frequency group than in the low update frequency group (F (1,127) = 9.63, p = 0.002, Mlow update frequency = 3.94 vs. Mhigh update frequency = 4.41). There was no other main effect or interaction effect on perceived benefits.

4.3.3. Perceived Risks

A2 (product type) 2 (update frequency) ANOVA on perceived risks showed a main effect of update frequency (F (1,127) = 5.72, p = 0.018). Participants in the high update frequency group reported higher risk perception than those in the low update frequency group (F (1,127) = 8.22, p = 0.005, Mlow update frequency = 3.43 vs. Mhigh update frequency = 3.74). The two-way interaction effect of product type and product update frequency was significant (F (1,127) = 3.82, p = 0.005), and the follow-up contrast revealed that for utilitarian products, participants reported higher risk perception under the high update frequency condition than under the low update frequency condition (F (1,127) = 10.57, p = 0.001, Mlow update frequency = 3.42 < Mhigh update frequency = 3.88). However, no such significant difference in risk perception for hedonic products was found.

4.3.4. Mediation Analysis

Following the recommendation of mediation analysis [55], we used the PROCESS procedure for SPSS to perform bootstrapping analysis [56]. The dependent variable is update intention, the mediating variables are perceived benefits and risks, and the moderating variable is product type. The Model 8 [56] based on bias-corrected estimates and 5000 resamples produced 95% confidence intervals. The results show that perceived benefits mediate the effect of update frequency on update intention for hedonic products because the indirect mediation effect was significant (LLCI = 0.3625, ULCI = 1.0775). However, for utilitarian products, the indirect effect was insignificant (LLCI = −0.4723, ULCI = 0.2908). Furthermore, perceived risks moderate the effect of update frequency on update intention for utilitarian products (LLCI = −0.5698, ULCI = −0.0305). For hedonic products, this mediated route was insignificant (LLCI = −0.1634, ULCI = 0.1647). The findings support H3 and H4.

4.4. Discussion

This study extended the field observation to a situation in which the update frequency can be manipulated. The study validated H1 and H2, demonstrating that the effect of product update frequency on consumer interest varies depending on the product type for most app products. Hedonic products with a relatively high update frequency elicited higher consumer interest, whereas utilitarian products with a high update frequency stifled consumer interest. These effects are primarily caused by varying consumer benefit and risk perceptions, which support H3 and H4.

5. Study 3: Boundary Conditions: Update Level

Study 3 aims to test the boundary conditions for the previous hypotheses. According to a recent study, the level of the update has a significant impact on consumer attitude [10]. Therefore, we consider factors that may influence the relationship between update frequency and product type, namely the update level. By taking into account the degree of perceived discrepancy between the enhanced app and the existing app, we found different associations between product type and update frequency in terms of consumer interest. Our results provide useful suggestions for managers when planning an update strategy.

5.1. Participant, Design, and Procedure

A total of 250 participants were recruited from the Baidu survey platform (Mage = 28.27, SD = 3.73) for a small fee of 5 RMB (of about $0.77). We implemented A2 (product type: hedonic vs. utilitarian) × 2 (update frequency: low vs. high) × 2 (update level: incremental new vs. radical new) between-subject design (27–33 participants per cell).
The product type and update frequency were set in the same way as in Study 2. We added the update level information by informing the participants in the incremental update group that all previous updates were incrementally new with only minor differences or improvements within each version, and we informed the participants in the radical update group that huge differences in the functions and experiences between each of the versions were found.
The materials were similarly manipulated as those in study 2. In addition, participants were asked to read the product information and were told to imagine the product had already been downloaded for free on their mobile phones for a certain period of time, and then fill out a short questionnaire including product knowledge, usage frequency, the attractiveness of ads, demographics, and their contact information. We also asked them to report their update intention, perceived benefits and risks associated with the app by giving the participants the definition of update level. We also checked the manipulation of the update level by asking participants their perceived update level on a nine-point scale (1 = “very small/incremental new” to 9 = “very large/radical new”) using one question: “what do you think about the update level of apps between each adjacent two versions?”

5.2. Analysis and Results

Data from 13 participants who did not complete certain measures in the experiment were excluded from the analysis, resulting in a final sample size of 237. The radical update group reported a significantly higher perceived update level (M = 4.58) than the incremental update group (M = 2.89) (F = 1,219) = 143.92, p = 0.001), confirming the successful manipulation of update level.
We began with a 2 × 2 × 2 ANOVA on update intention, controlling for product knowledge, usage frequency, ad attractiveness, gender, age, and education. Except for attractiveness, none of the control variables had the main effect. Thus, in the subsequent three-way ANOVA analysis, we only controlled for product attractiveness and excluded the other control variables. The ANOVA of update intention also revealed a main effect of product update level, with participants reporting higher update intention when the update level was high (F (1,228) = 11.89, MLow update level = 3.40 vs. MHigh update level = 4.01). This result also validates the findings of Sela and Leboeuf [53] that the degree of similarity between new and current versions impede upgrade adoption. The two-way interaction between product type and frequency of product updates was significant (F (1,228) = 9.59, p = 0.002). In addition, contrast analysis revealed that for hedonic products, high update frequency contributed to higher update intention compared to low update frequency (F (1,228) = 4.78, p = 0.030, MLow update level = 3.62 vs. MHigh update level = 4.09). For utilitarian products, update intention was higher for low update frequency products than for high update frequency products (F (1,228) = 6.12, p = 0.014, MLow update level = 4.13 vs. MHigh update level = 3.63). The findings support the robustness of previous hypotheses.
Importantly, a three-way interaction effect between product type, update frequency, and update level was found (F (1,228) = 41.94, p = 0.001). No other main effect or interaction effect was detected on update intention. To investigate the moderating effect of the update level further, we looked at the incremental/small and radical/large update level conditions separately. As predicted in Study 1, under the high update level condition, A2 (product type) × 2 (update frequency) ANOVA on update intention was significant (F (1,107) = 39.07, p < 0.001).
However, under the low update level condition, A2 (product type) × 2 (update frequency) ANOVA on update intention was also significant (F (1,122) = 6.41, p = 0.013). The post-hoc contrast analysis revealed, interestingly, that high update frequency resulted in lower update intention for hedonic products than the low update frequency (F (1,122) = 8.64, p = 0.004, MLow update frequency = 3.37 vs. MHigh update frequency = 2.50) (Figure 3). For utilitarian products, higher update frequency produced marginally significant higher update intention than low update frequency (F (1,122) = 3.48, p = 0.065, MLow update frequency = 3.48 vs. MHigh update frequency = 3.83).
We also conducted A2 (product type) × 2 (update frequency) ANOVA benefit and risk perceptions of consumers to gain additional insights into the underlying psychological mechanism for the opposite effect produced for hedonic products under low-level update frequency conditions. The results show that consumer risk perception was not affected by the two-way interaction (F (1,122) = 0.573, p > 0.1). However, the two-way interaction effect of product type and update frequency on benefit perception was significant (F (1,122) = 8.35, p = 0.005). Post-hoc analysis revealed that for hedonic products, participant benefit perception decreased in the high update frequency group (F (1,122) = 4.49, p = 0.04, MLow update frequency = 3.78 vs. MHigh update frequency = 3.18). However, for utilitarian products, participants in the high update frequency group perceived significantly more benefits (F (1,122) = 4.91, p = 0.03, MLow update frequency = 3.57 vs. MHigh update frequency = 4.17). These results support H5.

5.3. Discussion

Study 3 confirmed our hypothesis H5 and provided in-depth insight into the qualification of our main interaction effect of product type and update frequency on consumer interest. Extending on the findings of Studies 1 and 2, Study 3 showed that the interaction effect exists but does not always persist when the update level is changed. Managers can control the update level to match its update frequency to attract more valuable consumers by changing the focus of consumers on benefit and risk perception.

6. Study 4: Expert Opinions on Update Frequency and Update Level of Hedonic and Utilitarian Apps

6.1. Participants, Design, and Procedures

In order to supplement the empirical findings, we used a qualitative approach to test the main hypothesis in this study. The Delphi Method was used in this study as a qualitative method. A senior executive in a popular game industry, a product manager in a video streaming company, an academic professor whose research interests focused on product innovation, a virtual financial industry professional, and a product manager in an internet enterprise were chosen as survey experts. These experts were chosen with the knowledge that we are researching hedonic and utilitarian apps in mind.
A survey questionnaire with three questions was created, and respondents were asked to provide their opinions on factors affecting consumer interests as a result of mobile app updates, the effect of update frequency on consumer interest in the case of hedonic vs. utilitarian apps, and the effect of update level on consumer update intentions. The answers provided by each expert were qualitatively analyzed, and the results are shown below.

6.2. Results and Discussion

In general, all experts agreed that two factors influence consumer interest in an updated app: product benefits and potential risks. Furthermore, participants agreed that in the case of hedonic products, consumers will be more interested in new product benefits and experiences, whereas in the case of hedonic products, they will be more concerned about stability and functional uncertainties. One participant referred to this as “desired and undesired effects,” with desired effects being more relevant to hedonic products and undesired effects being more relevant to utilitarian products. According to a financial industry professional who focuses on financial apps (utilitarian product), “for hedonic apps, consumers are probably more concerned with their excitement or new product features, whereas for utilitarian apps, consumers are concerned with the stability of using the apps”.
Next, we asked participants if they thought there should be a difference in the frequency with which hedonic and utilitarian apps were updated, and if so, which type of app should be updated more frequently. All participants agreed that the update frequency of hedonic and utilitarian apps should differ. In general, update frequency for hedonic apps is higher than for utilitarian apps in order to pique consumer interest. There were two major reasons given by the participants for this. To begin, consumer needs for utilitarian apps and hedonic apps differ. Consumers are more concerned with the experience and stimulation when it comes to hedonic apps. Consumers will become bored and lose interest if product updates are released slowly and with few new benefits. However, this will be different for utilitarian apps, because most consumers download utilitarian apps for the specific function of the apps; they are less concerned with stimulation and more concerned with the stability and utility of the apps. Second, the market environments for hedonic apps and utilitarian apps are very different. A hedonic app is usually confronted with a slew of substitutes that offer consumers a similar experience. As a result, in order to maintain a competitive advantage, developers must frequently update their product. However, because the market structure for utilitarian apps is usually more stable than that of hedonic apps, these apps are updated more slowly than hedonic apps. A product manager from a popular video streaming company stated the following:
“As a video product company, we are primarily interested in apps that fall into the hedonic category. We release our product on a more frequent basis. In the early stages of the life of the app, the most popular of our video apps are released once per week. The update frequency for a utilitarian product is much slower. The most important reason for this difference is that consumers have different thought patterns when it comes to different apps”.
These findings support our hypotheses that for hedonic products, a higher update frequency leads to higher customer interest and for utilitarian products, a lower update frequency leads to higher consumer interest.
Finally, the participants agreed that the level of update affects consumer update intention because the level of update affects the number of benefits and new features a consumer perceives from an updated app. In general, consumers prefer radical updates to tiny updates because radical updates provide more benefits and new functions, especially for hedonic products where consumers are more concerned with playfulness and new experiences. Meanwhile, small updates are welcome in the hot update condition, where consumers do not need to update the app on their own. Tiny hot updates are more likely to be implemented for a utilitarian product where consumers place greater emphasis on app usage fluency and functional utility. These findings support our hypothesis that, for hedonic products, the effect of update frequency on consumer interest may be reversed if the product update level is tiny.

7. General Discussion

The app industry has grown to become an economic pillar of the information goods industry. Due to their limited advertising budgets, many app developers lack appropriate strategies for promoting their product, despite the booming success of small businesses in this field. Product enhancement strategy has been used as a powerful and strategic mechanism for app businesses to attract valuable customers due to the flexibility of app products. Existing literature on product enhancement strategy has investigated how product characteristics such as product type, upgrade contents, or sunk cost influence the effect of enhancement strategy [5,7,8]; however, most of these studies focus on traditional physical products with sunk cost, and little is known about how the update frequency of free versions affects consumer perceptions or product interest.
Our framework leverages the theory of mental accounting and theory of regulatory focus to explain consumer interest in various conditions when it comes to updating frequency, allowing us to analyze important and synthetic manifestations of patterns of losses and gains of consumers in their update decisions and their inherent interest in the product. To answer these research questions, a combination of field data and laboratory experiments were used to investigate how the frequency of app updates affects inherent consumer interest. We found a joint effect of product type and product update frequency on consumer interest (e.g., downloads and consumer update intention). Specifically, for hedonic products, providing new versions in less time would increase consumer interest by increasing their benefit understanding. However, for utilitarian products, updating too frequently causes people to be concerned about the unintended consequences of the product and reduces consumer interest. Furthermore, we found that this interactive effect does not exist, or is even reversed, when consumers perceive the update level to be tiny. The qualitative results based on the Delphi survey also support these findings.

7.1. Theoretical Implications

These findings contribute in a number of ways. First, we contribute to product enhancement research. Previous studies on product enhancement strategy have primarily focused on a single occurrence of benefits/cost [5,8]. Our work, on the other hand, by conceptually deriving the hypothetical propositions on the impact of mixed patterns of consumer perceptions by applying the theory of mental account in the context of product update, adds to theoretical understanding by examining multiple occurrences and aspects of benefits (hedonic and utilitarian benefits) and costs (performance risk and time risk) in the app enhancement process.
Second, we add to the literature on app updates. Existing research primarily focuses on the effect of update type and update time pattern [10], but previous research has not produced consistent results. We add to the existing literature by considering the combined effect of these two relevant factors, and we propose that in some cases (for example, updating a utilitarian product), updating frequently will result in the phenomenon of “more haste, less speed,” and that this effect is due to consumer concerns about the unintended risks of the updates. While in cases when users expect more of the benefits, adopting a frequent update strategy may be a good choice for app developers to attract valuable customers.
Third, we deepen the understanding of “update level”. The level of innovation or enhancement is a significant factor that can influence consumer attitudes [37,56]. Whereas previous research has primarily focused on how similarity between different versions affects consumer update intention while keeping the software update level limited or incremental [5,8]. Thus, the effect of this subtle difference on customer psychology is ignored. The current study combines update level and product type in order to better understand the effect of update frequency on the psychological mechanisms of consumers.

7.2. Managerial Implications

The findings have significant marketing implications. Because most app companies are small businesses with limited budgets to communicate with their potential customers, marketing apps presents unique challenges. Furthermore, when faced with a plethora of products that perform similar functions or have similar attributes, consumers are always hesitant to try new products. This research offers managers useful strategic advice and shows them how to attract valuable customers by implementing a product enhancement strategy.
To entice customers in the highly competitive app market, we classify four relevant enhancement strategies accordingly in Figure 4, in which the horizontal axis describes the level of update frequency, and the vertical axis describes the level of update. We can draw from the findings that for a hedonic product, in accordance with H1, developers can update their product more frequently and at a level higher than the regular expectations of customers (see the first quadrant of Figure 4). However, this improvement is highly dependent on the research and development capabilities of the company. In contrast, when the update level perceived by customers is limited, developers need to maintain the fluency of user experience and update in a less frequent pattern to avoid the loss perception for not meeting their expectations (see the third quadrant of Figure 1). Similarly, according to H2, for utilitarian products, managers can choose to update sparingly with large strides to reduce the risk perceptions of customers. Alternatively, considering the level of update in H5, developers can make minor improvements in each individual enhancement to alleviate customer concerns about the undesired uncertainty and appropriately increase the update frequency (see fourth quadrants of Figure 4). Overall, we hope that our findings will help developers in attracting valuable customers and promoting the product success of the app industry in such a fiercely competitive environment.
Our research also provides useful insights for app managers to achieve their goal of customer acquisition and retention in the competitive app industry. This research suggests that app developers can manage customer value by properly planning their update schedule while taking into account product characteristics, implying an almost zero cost strategy for app managers. This is especially true for complex products with advanced technology that present consumers with a wide range of risks and benefits. However, in order to successfully implement the enhancement strategy, a number of conditions must be met. First, app developers should understand that hedonic or utilitarian is not a strict product classification. Products can be both hedonic and utilitarian at the same time, but it is simple to figure out which benefits consumers value more. More importantly, our findings suggest that when making product enhancements, managers should place a high value on factors that influence consumer expectations. Second, because the term “frequency” is ambiguous, managers struggle to determine whether their strategies belong to a high or low-frequency pattern. However, firms can gain insight into their own update frequency by looking at the overall industry or learning from their competitors. Thus, our work provides app developers with theoretical guidance for managing their update strategy, rather than strict instruction. Finally, this work provides a strategic framework for managers to use in developing an enhancement strategy to improve product performance (Figure 4).
Our findings also offer practical advice for app developers on how to manage a loyalty program, improve brand reputation, and increase customer satisfaction in the long run. Consumers usually determine the worth of an offering by comparing its gain and loss. In addition, consumers can determine the value of a product by weighing the benefits and risks of various options.

7.3. Limitations and Further Research

This study has several limitations that can be addressed in future research. With field data, we first looked at the joint effect of product update frequency and product type on consumer interest. However, demonstrating causality is difficult. Although we gathered a sizable sample of data about app information, it does not represent the entire population of app products. Second, we use standard scales and procedures to measure the relevant outcomes in our experiments, and we find similar results in the field data, proving our hypotheses in the app industry. Future research using field data may be able to extend our findings to other product categories.
Despite its limitations, this study raises a number of intriguing questions for future research. Given that product update frequency influences consumer interest, examining the importance of update frequency to consumer interest in relation to other drivers of consumer attitude, including social influence and word of mouth, could be a worthwhile topic for future research. Regardless of the update level, more work can be done by considering the updating content. One can look at how detailed characteristics of update content and update frequency interact with adoptions, such as whether the content is competent or warm, hedonistic or utilitarian. In addition, this work can be applied to other industries besides the app industry, which could be beneficial.

Supplementary Materials

The following are available online at https://www.mdpi.com/article/10.3390/jtaer16070160/s1, Figure S1: Manipulation of hedonic and utilitarian product; Table S1: Manipulation of frequency; Table S2: Questionnaire Structure.

Author Contributions

Conceptualization, X.G. and A.R.; Data curation, X.G. and A.R.; Formal analysis, X.G.; Funding acquisition, X.G.; Investigation, X.G. and W.W.; Methodology, X.G., A.R. and W.W.; Project administration, X.G. and A.R.; Software, X.G.; Supervision, X.G.; Validation, X.G., A.R. and W.W.; Visualization, A.R.; Writing—original draft, X.G.; Writing—review & editing, A.R. and W.W. All authors have read and agreed to the published version of the manuscript.

Funding

This research was supported by Fundamental Research Funds for the Central Universities under program number 2662021JCQD001, and National Natural Science Foundation of China under Grant number 91746206.

Institutional Review Board Statement

Not applicable.

Informed Consent Statement

Informed consent was obtained from all subjects involved in the study.

Data Availability Statement

The data presented in this study are available on request from the corresponding author.

Conflicts of Interest

The authors declare no conflict of interest.

References

  1. Arora, S.; Ter Hofstede, F.; Mahajan, V. The Implications of Offering Free Versions for the Performance of Paid Mobile Apps. J. Mark. 2017, 81, 62–78. [Google Scholar] [CrossRef]
  2. Perez, S. Nearly 60 K Low-Quality Apps Booted from Google Play Store in February, Points to Increased Spam-Fighting. TechCrunch. 8 April 2013. Available online: https://techcrunch.com/2013/04/08/nearly-60k-low-quality-apps-booted-from-google-play-store-in-february-points-to-increased-spam-fighting/ (accessed on 1 December 2013).
  3. Setia, P.; Rajagopalan, B.; Sambamurthy, V.; Calantone, R. How Peripheral Developers Contribute to Open-Source Software Development. Inf. Syst. Res. 2012, 23, 144–163. [Google Scholar] [CrossRef]
  4. Bolton, R.N.; Lemon, K.N.; Verhoef, P.C. Expanding Business-to-Business Customer Relationships: Modeling the Customer’s Upgrade Decision. J. Mark. 2008, 72, 46–64. [Google Scholar] [CrossRef]
  5. Okada, E.M. Upgrades and New Purchases. J. Mark. 2006, 70, 92–102. [Google Scholar] [CrossRef]
  6. Doğan, K.; Ji, Y.; Mookerjee, V.S.; Radhakrishnan, S. Managing the Versions of a Software Product Under Variable and Endogenous Demand. Inf. Syst. Res. 2011, 22, 5–21. [Google Scholar] [CrossRef]
  7. Bellezza, S.; Ackerman, J.M.; Gino, F. “Be Careless with That!” Availability of Product Upgrades Increases Cavalier Behavior Toward Possessions. J. Mark. Res. 2017, 54, 768–784. [Google Scholar] [CrossRef]
  8. Sela, A.; Leboeuf, R.A. Comparison Neglect in Upgrade Decision. J. Mark. Res. 2017, 54, 556–571. [Google Scholar] [CrossRef]
  9. Dong, J.Q.; Wu, W.; Zhang, Y. The Faster the Better? Innovation Speed and User Interest in Open Source Software. Inf. Manag. 2019, 56, 669–680. [Google Scholar] [CrossRef]
  10. Tian, H.; Grover, V.; Zhao, J.; Jiang, Y. The Differential Impact of Types of App Innovation on Customer Evaluation. Inf. Manag. 2020, 57, 103358. [Google Scholar] [CrossRef]
  11. Zhou, G.; Song, P.; Wang, Q. Survival of the Fittest: Understanding the Effectiveness of Update Speed in the Ecosystem of Software Platforms. J. Organ. Comput. Electron. Commer. Vol. 2018, 28, 234–251. [Google Scholar] [CrossRef]
  12. Heath, C. Escalation and De-escalation of Commitment in Response to Sunk Costs: The Role of Budgeting in Mental Accounting. Organ. Behav. Hum. Decis. Process. 1995, 62, 38–54. [Google Scholar] [CrossRef] [Green Version]
  13. Thaler, R.H. Mental Accounting and Consumer Choice. Mark. Sci. 1985, 4, 199–214. [Google Scholar] [CrossRef]
  14. Luo, Y.E.; Wong, V.; Chou, T.-J. The Role of Product Newness in Activating Consumer Regulatory Goals. Int. J. Res. Mark. 2016, 33, 600–611. [Google Scholar] [CrossRef]
  15. Ghose, A.; Han, S.P. Estimating Demand for Mobile Applications in the New Economy. Manag. Sci. 2014, 60, 1470–1488. [Google Scholar] [CrossRef] [Green Version]
  16. Lee, G.; Raghu, T.S. Determinants of Mobile Apps’ Success: Evidence from the App Store Market. J. Manag. Inform. Syst. 2015, 31, 133–170. [Google Scholar] [CrossRef] [Green Version]
  17. Dunn, K. Automatic Updates: Automatic Update Risks: Can Patching Let a Hacker In? Netw. Secur. 2004, 2004, 5–8. [Google Scholar] [CrossRef]
  18. Fagan, M.; Khan, M.M.H.; Buck, R. A Study of Users’ Experiences and Beliefs about Software Update Messages. Comput. Hum. Behav. 2015, 51, 504–519. [Google Scholar] [CrossRef] [Green Version]
  19. Fleischmann, M.; Amirpur, M.; Grupp, T.; Benlian, A.; Hess, T. The Role of Software Updates in Information Systems Continuance—An Experimental Study from a User Perspective. Decis. Support Syst. 2016, 83, 83–96. [Google Scholar] [CrossRef]
  20. Saffarizadeh, K.; Jabr, W.; Keil, M. Update Assimilation in App Markets: Is There Such a Thing as Too Many Updates? In Proceedings of the 39th International Conference on Information Systems, ICIS 2018, San Francisco, CA, USA, 13–16 December 2018.
  21. Mcilroy, S.; Shang, W.; Ali, N.; Hassan, A.E. User Reviews of Top Mobile Apps in Apple and Google App Stores. Commun. ACM 2017, 60, 62–67. [Google Scholar] [CrossRef]
  22. Roberts, N.; Grover, V. Investigating Firm’s Customer Agility and Firm Performance: The Importance of Aligning Sense and Respond Capabilities. J. Bus. Res. 2012, 65, 579–585. [Google Scholar] [CrossRef]
  23. Tiwana, A. Evolutionary Competition in Platform Ecosystems. Inf. Syst. Res. 2015, 26, 266–281. [Google Scholar] [CrossRef] [Green Version]
  24. Feorderer, J.; Heinzl, A. Product Updates: Attracting New Consumers versus Alienating Existing Ones. In Proceedings of the 38th International Conference on Information Systems (ICIS), Seoul, Korea, 10–13 December 2017. [Google Scholar]
  25. Abolfathi, N.; Santamaria, S. Demand-Side Disruption: Evidence from the US Mobile Dating Application Industry. In Academy of Management Proceedings; Academy of Management: Briarcliff Manor, NY, USA, 2018. [Google Scholar]
  26. Sivakumar, K.; Li, M.; Dong, B. Service Quality: The Impact of Frequency, Timing, Proximity, and Sequence of Failures and Delights. J. Mark. 2014, 78, 41–58. [Google Scholar] [CrossRef]
  27. Kumar, V.; Reinartz, W. Creating Enduring Customer Value. J. Mark. 2016, 80, 36–48. [Google Scholar] [CrossRef]
  28. Bond, S.D.; He, S.X.; Wen, W. Speaking for “Free”: Word of Mouth in Free-and Paid-Product Settings. J. Mark. Res. 2019, 56, 276–290. [Google Scholar] [CrossRef]
  29. Arora, A.; Caulkins, J.P.; Telang, R. Research Note—Sell First, Fix Later: Impact of Patching on Software Quality. Manag. Sci. 2006, 52, 465–471. [Google Scholar] [CrossRef]
  30. Arkes, H.R.; Blumer, C. The Psychology of Sunk Cost. Organ. Behav. Hum. Decis. Process. 1985, 35, 124–140. [Google Scholar] [CrossRef]
  31. Heath, C.; Fennema, M.G. Mental Depreciation and Marginal Decision Making. Organ. Behav. Hum. Decis. Process. 1996, 62, 38–54. [Google Scholar] [CrossRef] [Green Version]
  32. Raghunath, S. Software Editions: An Application of Segmentation Theory to the Packaged Software market. J. Manag. Inf. Syst. 2000, 17, 87–113. [Google Scholar]
  33. Kahneman, D.; Tversky, A. Prospect Theory: An Analysis of Decisions Under Risk. Econometrica 1979, 47, 263–291. [Google Scholar] [CrossRef] [Green Version]
  34. Rust, R.T.; Inman, J.J.; Jia, J.; Zahorik, A. What You Don’t Know About Customer-Perceived Quality: The Role of Customer Expectation Distributions. Mark. Sci. 1999, 18, 77–92. [Google Scholar] [CrossRef] [Green Version]
  35. Lee, H.; Choeh, J.Y. Motivations for Obtaining and Redeeming Coupons from a Coupon App: Customer Value Perspective. J. Theor. Appl. Electron. Commer. Res. 2021, 16, 22–33. [Google Scholar]
  36. Jacoby, J.; Kaplan, L.B. The Components of Perceived Risk. In Proceedings of the Third Annual Conference of the Association for Consumer Research; Venkatesan, M., Ed.; Association for Consumer Research: Chicago, IL, USA, 1972; pp. 382–393. [Google Scholar]
  37. Ma, Z.; Gill, T.; Jiang, Y. Core versus Peripheral Innovations: The Effect of Innovation Locus on Consumer Adoption of New Products. J. Mark. Res. 2015, 52, 309–324. [Google Scholar] [CrossRef]
  38. Feathermana, M.S.; Pavlou, P.A. Predicting E-Services Adoption: A Perceived Risk Facets Perspective. Int. J. Hum.-Comput. Stud. 2003, 59, 451–474. [Google Scholar] [CrossRef] [Green Version]
  39. Tseng, S.-Y.; Wang, C.-N. Perceived Risk Influence on Dual-Route Information Adoption Processes on Travel Websites. J. Bus. Res. 2016, 69, 2289–2296. [Google Scholar] [CrossRef]
  40. Higgins, E.T. Promotion and Prevention Experiences: Relating Emotions to Nonemotional Motivational States. In Handbook of Affect and Social Cognition; Forgas, J.P., Ed.; Lawrence Erlbaum Associates Publishers: Mahwah, NJ, USA, 2001. [Google Scholar]
  41. Higgins, E.T. Beyond Pleasure and Pain. Am. Psychol. 1997, 52, 1280–1300. [Google Scholar] [CrossRef]
  42. Chitturi, R.; Raghunathan, R.; Mahajan, V. Delight by Design: The Role of Hedonic Versus Utilitarian Benefits. J. Mark. 2008, 72, 48–63. [Google Scholar] [CrossRef]
  43. Chernev, A. Goal–Attribute Compatibility in Consumer Choice. J. Consum. Psychol. 2004, 14, 141–150. [Google Scholar]
  44. Chitturi, R.; Raghunathan, R.; Mahajan, V. Form Versus Function: How the Intensities of Specific Emotions Evoked in Functional Versus Hedonic Trade-Offs Mediate Product Preferences. J. Mark. Res. 2007, 44, 702–714. [Google Scholar] [CrossRef]
  45. Hirschman, E.C.; Holbrook, M.B. Hedonic Consumption: Emerging Concepts, Methods and Propositions. J. Mark. 1982, 46, 92–101. [Google Scholar] [CrossRef] [Green Version]
  46. Kivetz, R.; Keinan, A. Repenting Hyperopia: An Analysis of Self-Control Regrets. J. Consum. Res. 2006, 33, 273–282. [Google Scholar] [CrossRef] [Green Version]
  47. Shiv, B.; Fedorikhin, A. Heart and Mind in Conflict: The Interplay of Affect and Cognition in Consumer Decision Making. J. Consum. Res. 1999, 26, 278–292. [Google Scholar] [CrossRef] [Green Version]
  48. Lu, H.-P.; Wung, Y.-S. Applying Transaction Cost Theory and Push-Pull-Mooring Model to Investigate Mobile Payment Switching Behaviors with Well-Established Traditional Financial Infrastructure. J. Theor. Appl. Electron. Commer. Res. 2021, 16, 1–21. [Google Scholar] [CrossRef]
  49. Grewal, R.; Lilien, G.L.; Mallapragada, G. Location, Location, Location: How Network Embeddedness Affects Project Success in Open Source Systems. Manag. Sci. 2006, 52, 1043–1056. [Google Scholar] [CrossRef]
  50. Stewart, K.J.; Ammeter, A.P.; Marupinng, L.M. Impacts of License Choice and Organizational Sponsorship on User Interest and Development Activity in Open Source Software Projects. Inf. Syst. Res. Inf. Syst. Res. 2006, 17, 126–144. [Google Scholar] [CrossRef]
  51. Subramaniam, C.; Sen, R.; Nelson, M.L.; Subramaniama, C.; Senb, M.L. Nelsonc Determinants of Open Source Software Project Success: A Longitudinal Study. Decis. Support Syst. 2009, 46, 576–585. [Google Scholar] [CrossRef]
  52. Golder, P.N.; Tellis, G.J. Will It Ever Fly? Modeling the Takeoff of Really New Consumer Durables. Mark. Sci. 1997, 16, 256–270. [Google Scholar] [CrossRef] [Green Version]
  53. Sela, A.; Berger, J. How Attribute Quantity Influence Option Choice. J. Mark. Res. 2012, 49, 942–953. [Google Scholar] [CrossRef] [Green Version]
  54. Batra, R.; Ahtola, O.T. Measuring the Hedonic and Utilitarian Sources of Consumer Attitudes. Mark. Lett. 1990, 2, 235–241. [Google Scholar] [CrossRef]
  55. Zhao, X.S.; Lynch, J.G.; Chen, Q.M. Reconsidering Baron and Kenny: Myths and Truths about Mediation Analysis. J. Consum. Res. 2010, 37, 197–206. [Google Scholar] [CrossRef]
  56. Preacher, K.J.; Hayes, A.F. SPSS and SAS Procedures for Estimating Indirect Effects in Simple Mediation Models. Behavior Research Methods. Instrum. Comput. 2004, 36, 717–731. [Google Scholar] [CrossRef] [Green Version]
Figure 1. Conceptual Model and Hypotheses.
Jtaer 16 00160 g001
Figure 2. Contrast Analysis between Hedonic Product and Utilitarian Product in High and Low Update Frequency Conditions.
Jtaer 16 00160 g002
Figure 3. The Effect of Product Type and Update Frequency on Update Intention for Radical Update Condition (a) and Incremental Update Condition (b), Respectively.
Jtaer 16 00160 g003
Figure 4. Relevant Product Enhancement Strategies.
Jtaer 16 00160 g004
Table 1. Literature Review.
AuthorsUpdate TypeUpdate Time PatternUpdate Level Underline MechanismMethodology
Update Type Literature
Fleischmann et al. [19]×Laboratory Experiment
Tian et al. [10]×××Empirical analysis
Update Time Pattern Literature
Zhou et al. [11]×××Empirical analysis
Dong et al. [9]×××Empirical analysis
Tiwana [23]×××Empirical analysis
Mcilroy et al. [21]×××Empirical analysis
The current researchEmpirical analysis & Laboratory Experiment
Table 2. Variable Operationalization.
VariableOperationalization
Customer interestDaily app downloads calculated by dividing number of overall downloads by the app life length
product type“1” = utilitarian product, “0” = hedonic product
Update frequencynumber of versions given the size of App
Rating overall rating of consumers towards the product (score)
sizethe size of the newest product (Mb)
life stagecalculated on the downloads of the product: “0–500” = 0, ”500–1000” = 1, ”1000–5000” = 2, ”5000–10,000” = 3, ”10,000–50,000” = 4, ”50,000–” = 5
Age ratingthe maximum age of customers that the app is serviced for (year)
Priceprice of the app (US$)
Number of versionstotal number of the versions
Life lengthtime interval between latest version being released and the initial version being released (days)
one starnumber of consumers rating the product as “one star”
two-starnumber of consumers rating the product as “two star”
three-starnumber of consumers rating the product as “two star”
four-starnumber of consumers rating the product as “two star”
five-starnumber of consumers rating the product as “two star”
Table 3. Descriptive Statistics.
Summary Statistics of the Data
Min.1st Qu.MedianMean3rd Qu.Max.
Price0017.78212328
Age rating4447.4691217
Size0.1620.2355.74175.67167.142048
Rating02.94.33.5234.85
Downloads05499977438,32798,36212,663,392
Number of versions12510.6914113
Update frequency0.000.010.030.070.063
Life Stages0243.0545
Five Star056471129905,194,252
Four Star003409.233237,831
Three Star002192.219115,847
Two Star001105.31168,632
One Star007279.947240,060
Life length3149.2577.511,658.143,19943,203
Table 4. Correlation Analysis of the Main Variables.
PriceAge RatingSizeRatingsVersionsDays Since PublicationUpdate FrequencyDownloadsLife Stage
Price1
Age rating−0.061
Size0.18 0.25 1.00
Ratings−0.03 0.05 0.08 1.00
Versions0.00 0.01 0.02 0.11 1.00
Life Length0.25 0.08 0.31 −0.04 −0.11 1.00
Update Frequency−0.04 0.02 0.01 −0.01 −0.14 −0.01 1.00
Downloads−0.07 0.08 0.12 0.67 0.22 −0.08 −0.02 1.00
Life Stage−0.30 0.20 0.14 0.06 0.13 −0.10 0.03 0.12 1.00
Table 5. Regression Results of Study 1.
Model 1Model 2Model 3Model 4
VariablesCoef.zCoef.zCoef.zCoef.z
Cons0.17 (0.32)0.53−0.09 (0.33) *−0.26−18.41 (1.05) ***−17.55−0.75 (0.26)−2.95
Update frequency0.88 (0.47) *1.872.79 (0.95)2.933.28 (0.54) ***6.04−1.3 (0.62) **−0.74
Product type−1.69 (0.19) *−8.94−1.36 (0.21) ***−6.54
Price0.00 (0.00)−0.560.00 (0.00)−0.61−0.13 (0.01) ***−12.270.04 (0.01) ***3.77
Age Rating −0.02 (0.02)−1.47−0.02 (0.02)−1.460.04 (0.02) **2.21−0.07 (0.02) **−3.81
Size0.00 (0.00) **2.12−0.00 (0.00) **2.330.00 (0.00) **3.33−0.00 (0.00) **−2.04
Rating0.09 (0.04) **2.110.09 (0.04) **2.10.16 (0.10)1.580.06 (0.05)2.35
Five Star−0.01 (0.04) **−2.15−0.08 (0.04) **−2.280.08 (0.03) *−2.740.01 (0.02)1.79
Four Star0.31 (0.20)1.540.29 (0.20)1.440.42 (0.17) **2.44−0.61 (1.36)−1.84
Three Star−0.71 (0.57)−1.25−0.64 (0.56)−1.13−0.56 (0.52)−1.070.99 (3.34)2.23
Two Star0.87 (0.65)1.340.95 (0.66)1.440.72 (0.41) *1.75−0.35 (7.83)−4.49
One Star0.52 (0.12) ***4.40.50 (0.12) ***4.260.03 (0.05)0.045.85 (0.92) *6.34
Life Stage1.52 (0.07) ***23.331.53 (0.07) ***23.436.04 (0.28) ***21.461.2 (0.07) ***16.11
Update frequency*Product type −3.81 (1.07) ***−3.56
Observations2858 2858 1193 1665
Log likelihood−9317.85 −9310.5173 −5538.5564 −3301.4133
Pseudo R2 0.069 0.0697 0.1026 0.0743
* p < 0.1, ** p < 0.05, *** p < 0.01, Notes: Dependent variable is the number of average daily adoptions. Standard errors are included in parenthesis.
Publisher’s Note: MDPI stays neutral with regard to jurisdictional claims in published maps and institutional affiliations.

