Review

Challenges in Toxicological Risk Assessment of Environmental Cadmium Exposure

by
Soisungwan Satarug
Centre for Kidney Disease Research, Translational Research Institute, Woolloongabba, Brisbane, QLD 4102, Australia
Toxics 2025, 13(5), 404; https://doi.org/10.3390/toxics13050404
Submission received: 9 April 2025 / Revised: 6 May 2025 / Accepted: 15 May 2025 / Published: 16 May 2025

Abstract

:
Dietary exposure to a high dose of cadmium (Cd) ≥ 100 µg/day for at least 50 years or a lifetime intake of Cd ≥ 1 g can cause severe damage to the kidneys and bones. Alarmingly, however, exposure to a dose of Cd between 10 and 15 µg/day and excretion of Cd at a rate below 0.5 µg/g creatinine have been associated with an increased risk of diseases with a high prevalence worldwide, such as chronic kidney disease (CKD), fragile bones, diabetes, and cancer. These findings have cast considerable doubt on a “tolerable” Cd exposure level of 58 µg/day for a 70 kg person, while questioning the threshold level for the Cd excretion rate of 5.24 µg/g creatinine. The present review addresses many unmet challenges in a threshold-based risk assessment for Cd. Special emphasis is given to the benchmark dose (BMD) methodology to estimate the Cd exposure limit that aligns with a no-observed-adverse-effect level (NOAEL). Cd exposure limits estimated from conventional dosing experiments and human data are highlighted. The results of the BMDL modeling of the relationship between Cd excretion and various indicators of its effects on kidneys are summarized. It is recommended that exposure guidelines for Cd should employ the most recent scientific research data, dose–response curves constructed from an unbiased exposure indicator, and clinically relevant adverse effects such as proteinuria, albuminuria, and a decrease in the estimated glomerular filtration rate (eGFR). These are signs of developing CKD and its progression to the end stage, when dialysis or a kidney transplant is required for survival.

1. Introduction

The conventional toxicological risk assessment for any health hazardous substance is reliant on dose–response curves constructed from a series of experimentation, which typically involves daily administration of four to five different doses for 90 days or longer [1,2,3,4,5]. The dose–response curves are used to define the lower bound “no-observed-adverse-effect level” (NOAEL) and the upper bound “lowest-observed-adverse-effect level” (LOAEL) from which a point of departure (POD) from normalcy is established. The POD value forms a basis to estimate health guidance values, which are known as the minimal risk level (MRL), the toxicological reference value (TRV), the reference dose (RfD), the tolerable weekly intake (TWI), and the tolerable monthly intake (TMI) [1,2,3,4,5,6]. These different terms create unnecessary confusion and stumbling blocks. They should be standardized so as to translate them to public health protection actions.
The NOAEL value derived from animal dosing experiments is the highest dose tested that produces a statistically insignificant effect compared to controls. The NOAEL value can be translated to the benchmark dose (BMD) with an inclusion of an uncertainty or safety margin to compensate for species differences and human variability [1]. To circumvent the animal-to-human extrapolation, the BMD approach has been applied to human population data [1,2,3,4,5]. In this way, the benchmark dose limit (BMDL) value has replaced the experimental NOAEL.
The POD-based health guidance values MRL, TRV, RfD, TWI, and TMI all rely on the premise that a critical exposure level exists above which an adverse effect cannot be discernable [1]. In effect, an exposure level derived from the most sensitive endpoint would be protective against all other adverse effects [1]. A notable limitation is that threshold-based risk assessment is only applicable to non-cancer endpoints [1,5]. An evaluation of the carcinogenic risk of a suspected entity requires an observation over a lifespan, such as a two-year rodent/murine bioassay [7,8,9].
The present review has its focus on the metal contaminant cadmium (Cd), which is found in most foodstuffs [10,11,12,13], tobacco smoke, and airborne particle pollution [14,15]. Because of the extremely slow excretion rate of Cd, the metal is retained within the cells of nearly all tissues and organs in the body, notably the kidney [16,17]. Concerningly, Cd is a human cancer-causing agent; epidemiological studies have linked an increased risk of tumors in the lungs, kidneys, pancreas, breast, and liver to chronic environmental Cd exposure [7,8,9,18]. These data are in line with a two-year bioassay that indicated Cd as a multi-tissue carcinogen [7]. The ability of Cd to induce non-tumorigenic human cells to undergo malignant transformation strengthens its oncogenic potential [18,19].
The first objective of this review is to discuss current health guidance values for Cd and highlight their inadequacy to provide protection against health risks associated with excessive exposure to Cd. It reiterates the total imprecision in measuring Cd exposure and/or associated adverse outcomes, which biases dose–response relationships toward the null [20]. The second objective is to illustrate non-differential errors imposed on datasets by adjusting Cd excretion (ECd) to creatinine excretion (Ecr) as ECd/Ecr. These errors can be eliminated by normalizing ECd to creatinine clearance (Ccr) as ECd/Ccr. As a third objective, fundamental and practical knowledge on the BMD methodology is provided together with a summary of BMD modeling results to accentuate a continuing effort to identify a toxic endpoint that can form a reliable basis to formulate a meaningful health guideline value for Cd exposure.

2. Existing Dietary Cd Exposure Guidelines

This section provides health guidance values for exposure to Cd in the diet together with exposure threshold levels that have been estimated. Because nearly all food types contain Cd as a contaminant, exposure to Cd occurs through a normal diet [10,11,12,13], and foods which are consumed frequently in a large quantity, like staples, contribute the most to dietary Cd exposure [11].
The consumption of Cd at ≥100 µg/day for 50 years or longer can cause “itai-itai” disease, marked by severe damage to the kidneys and bones, resulting in bone fragility due to osteoporosis and osteomalacia [21,22]. These pathologies have been replicated in ovariectomized cynomolgus monkeys after chronic Cd exposure [23], mimicking the female preponderance of Cd toxicity. Consequently, the kidneys and bones have been employed as the critical targets for Cd toxicity, for which permissible exposure and threshold levels have been determined [24].
As the data in Table 1 indicate, there is no consensus on exposure limits for Cd, even though the same endpoints were used; the dietary Cd exposure limits range between 0.28 and 0.83 μg/kg body weight per day, with Cd exposure threshold levels varying from 1.0 to 5.24 µg/g creatinine for the β2M endpoint. Most likely, these inconsistencies are due to different dose–response models, the cut-off values used to define abnormality, and the application of an uncertainty factor or safety margin. A further discussion of these factors is provided in Section 4.4.
Table 2 provides the Cd exposure limits obtained by experimental dosing via oral and inhalational routes. Wu et al. (2012) used data from pigs fed with various doses of Cd in their feed for 100 days, and they reported that the BMDL value for the β2M was the highest and it was lowest for the RBP [32]. After the uncertainty factor 100 was applied, a human-tolerable intake level of Cd was established to be 0.2 μg/kg body weight/day.
Based on data from Wistar rats, Faroon et al. (2017) reported the MRL for oral Cd exposure for an intermediate duration (15–365 days) to be 0.5 µg/kg body weight per day for the bone endpoint [33,34,35,36]. Based on data from Fisher rats, the MRL for acute inhalational exposure to Cd for a duration between 1 and 14 days was 0.03 μg/m3 for the lung endpoint.

3. Imprecisions in Measuring Internal Doses and Adverse Outcomes

The practice of toxicological risk assessment involves measuring two key parameters: exposure and effect indicators. This section focuses on factors which affect the estimation of the internal dose of Cd, which account for the underestimation of the effect size. The uses of blood Cd concentrations and the urinary excretion rates of Cd are highlighted, along with adjusting urine concentrations of Cd and all other indicators of Cd effects to creatinine excretion (Ecr) and creatinine clearance (Ccr).

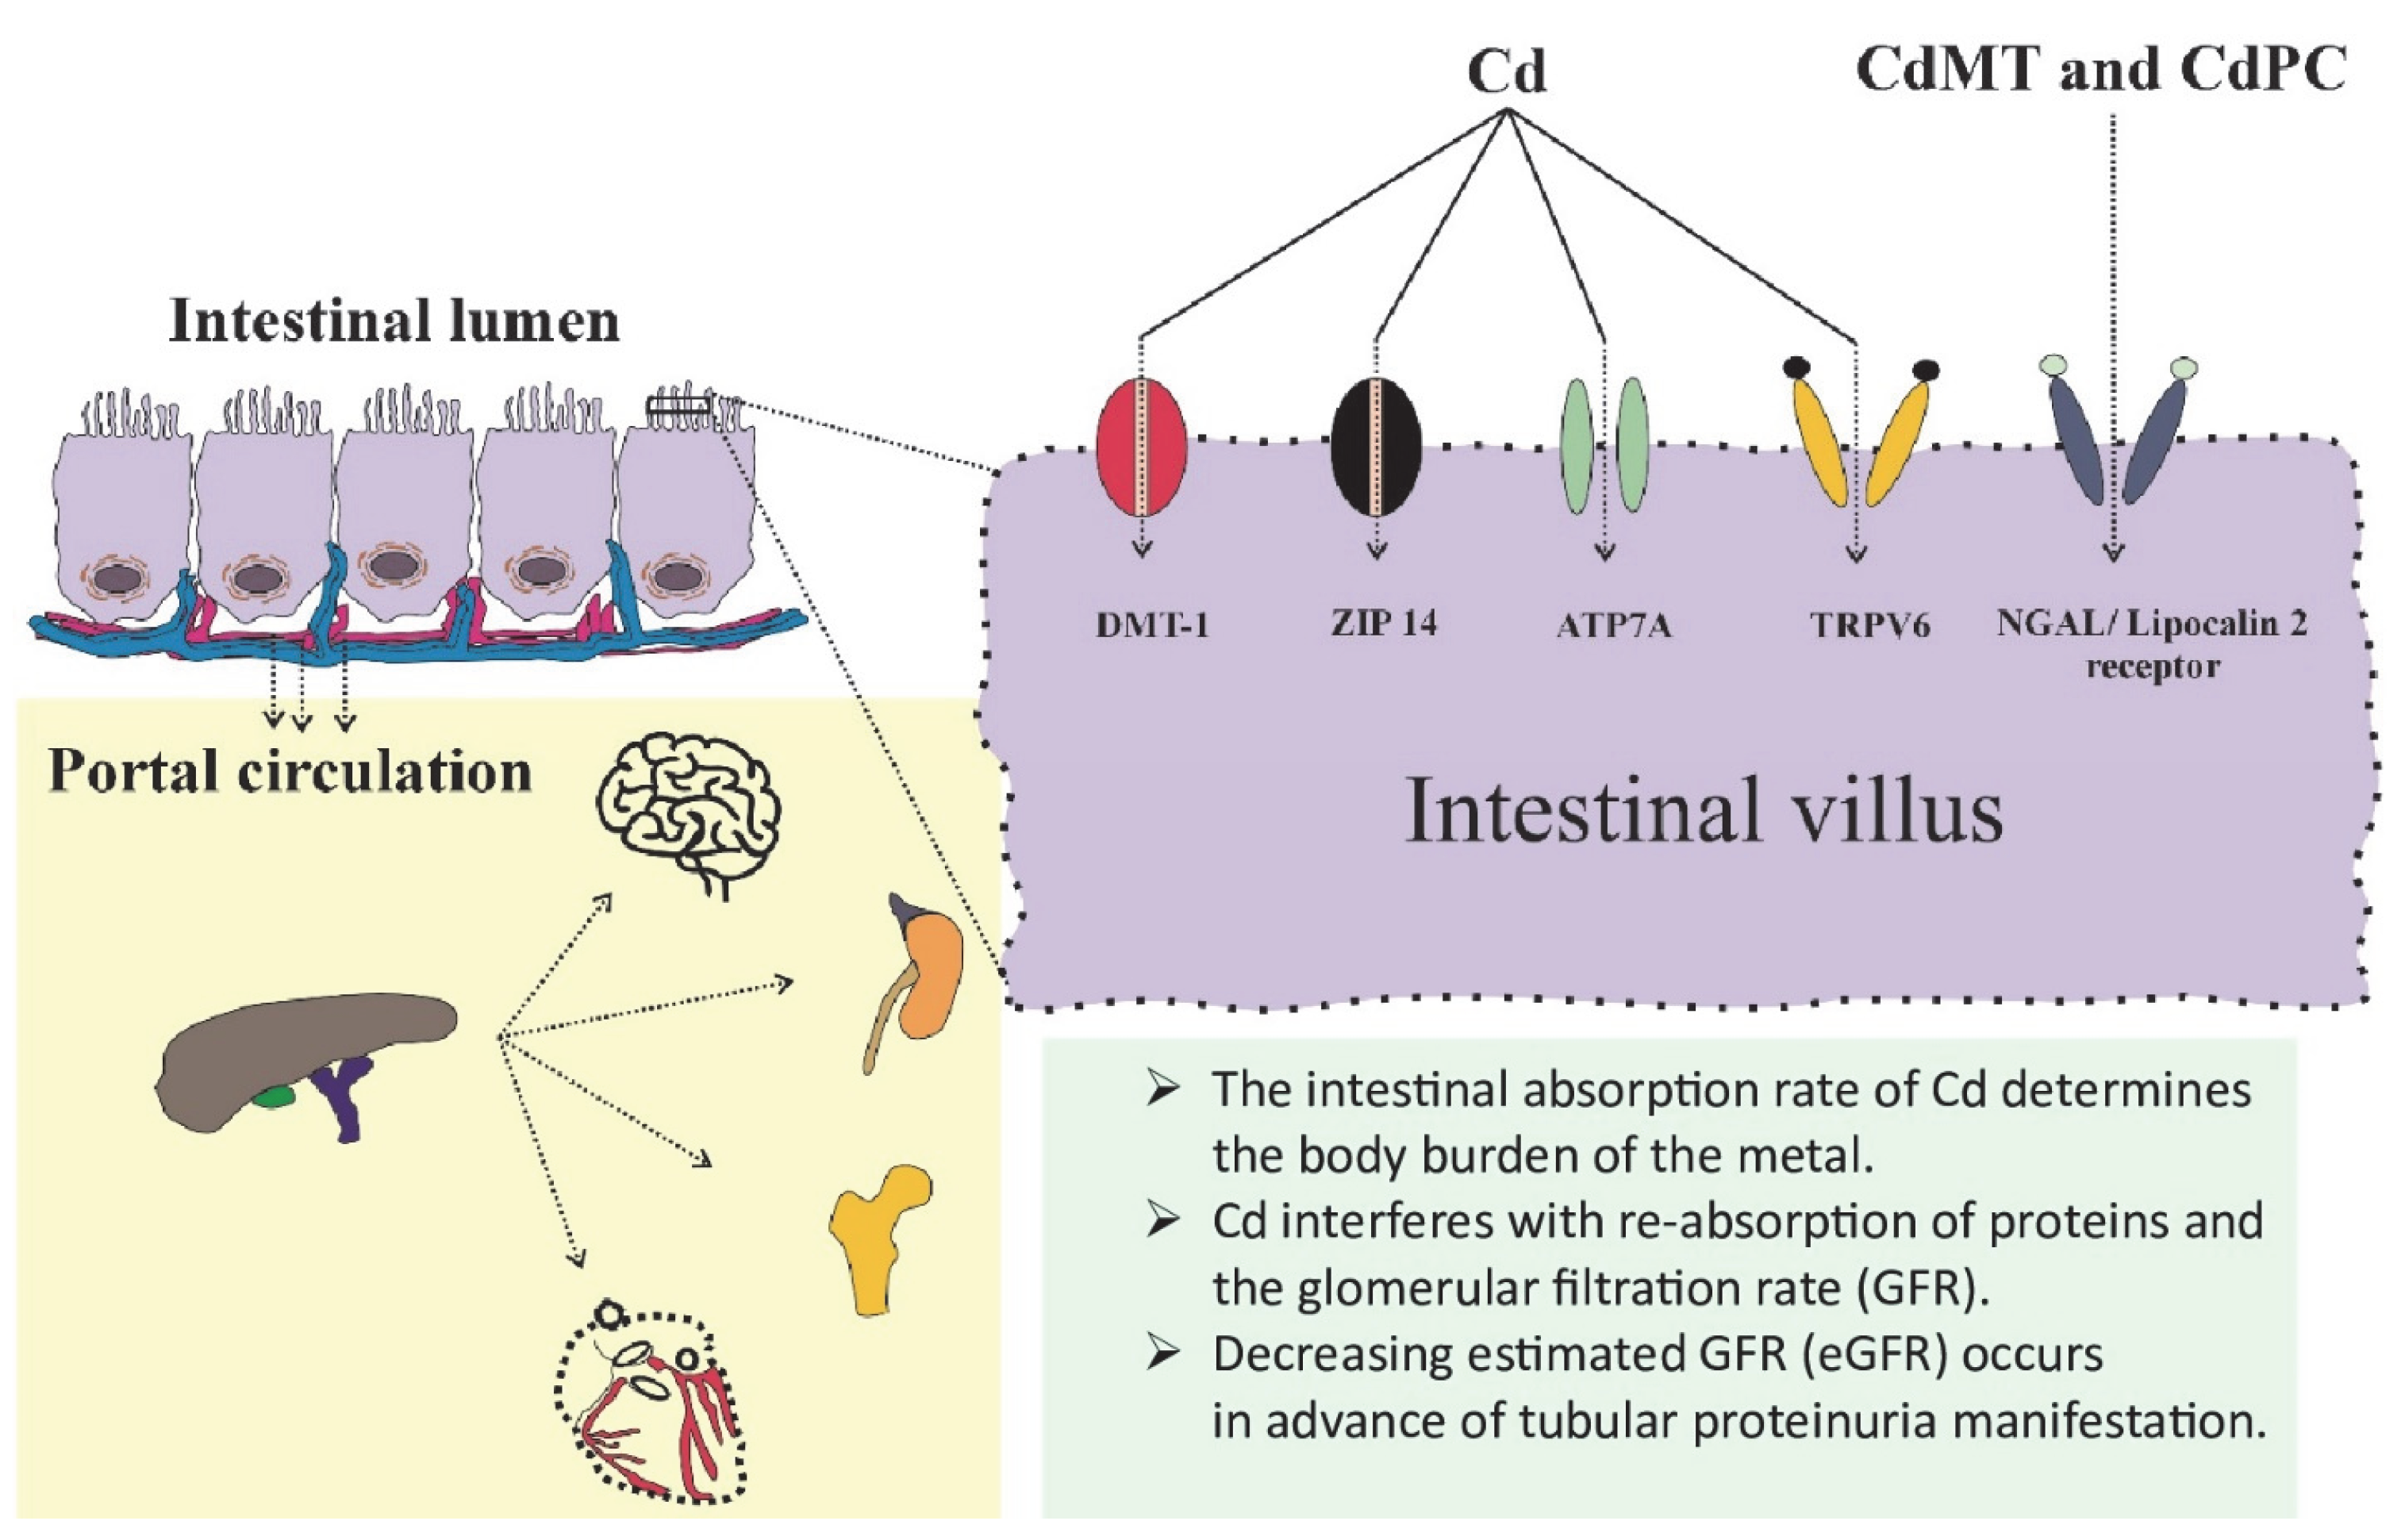
3.1. Assimilation of Cd and Its Determinants

From foods, Cd enters the bloodstream through transcytosis [38], receptor-mediated endocytosis [39,40], and specialized transport proteins for essential metals such as iron (Fe), zinc (Zn), and calcium (Ca) [41,42,43,44]. Cd can be expected to be assimilated at a rate higher than Fe, Zn and Ca, consistent with the absorption rate of Cd reported for young Japanese women with low iron intake and low iron status, which was found to be between 24 and 45% [45,46]. Conceivably, the internal dose of Cd in sensitive groups with a higher Cd absorption rate will be more markedly underestimated than in subjects with a normal iron status, in whom the Cd absorption rate is assumed to be 3 to 7%, as in the JECFA’s model [25]. Figure 1 depicts the involvement of enterocytes and metal transport proteins in the assimilation of Cd.
By means of meta-analysis, Peng et al. (2023) found that higher zinc and body iron stores were associated with lower blood Cd concentrations [48]. Higher blood and urine Cd levels in children and adolescent females [49,50] and women of reproductive age [51,52] have been linked to lower body iron stores, as evident from serum ferritin ≤30 µg/L. Like iron, marginal dietary zinc intake and subclinical zinc deficiency are highly prevalent worldwide [53,54,55], which means a significant proportion of the population is at risk of Cd toxicity at the level found in a normal diet.

3.2. Use of Blood Cd and Urine Cd in Toxicological Risk Assessment

Through the gut and lungs, Cd in foodstuffs and airborne particle pollution can enter the systemic circulation. Hence, the blood concentration of Cd can reflect recent exposure to the metal. Because most of the Cd in the bloodstream is in the cytosol of red blood cells, which have a 3-month lifespan, blood Cd concentration reflects exposure in the past three months.
As noted in Section 3.1 and reviewed by Cirovic and Cirovic (2024) [56], the amount of Cd that reaches target tissues and organs depends on many factors, which include the absorption rate, nutritional zinc status, and body iron store, not just the amount of Cd in the diet. Consequently, neither blood Cd concentration nor the amount of Cd in the diet can be a precise predictor of an internal dose of Cd and its toxic manifestation. For example, Van Maele-Fabry et al. (2016) reported that breast cancer risk among postmenopausal women was not associated with dietary Cd exposure levels [57]. In comparison, Cd exposure was found to be a strong risk factor for breast cancer in studies in which Cd excretion was used as an exposure indicator [58,59]. Larsson et al. (2015) found that the risk of having breast cancer increased 66% for each 0.5 µg/g creatinine increase in Cd excretion [58]. Lin et al. (2016) reported that breast cancer risk was not associated with dietary Cd exposure, but it was elevated 2.24-fold among women who had Cd excretion rates in the top quartile compared to those with Cd excretion in the lowest quartile [59].
A non-association between blood Cd and diabetes was reported in a recent case–control study from Thailand by Adokwe et al. (2025) [60]. However, in three U.S. population studies, risks of having prediabetes and diabetes were both associated with Cd excretion rates [61,62,63]. In a study by Schwartz et al. (2003), the respective risk of having prediabetes and diabetes rose 48% and 24% at Cd excretion rates of 1–2 μg/g creatinine after smoking and other confounding factors were adjusted [61]. In a study by Wallia et al. (2010), a significant increase in the risk of prediabetes was observed at Cd excretion rates ≥0.7 µg/g creatinine after adjustment for covariates [62]. Jiang et al. (2018) observed that the risk of having prediabetes increased 3.4-fold in obese U.S. men who had a Cd excretion rate in the top quartile compared to those with a normal weight and having Cd excretion rate in the bottom quartile [63]. In summary, the risks of having breast cancer, prediabetes, and diabetes all have been found to be associated with Cd excretion rates lower than 5.24 µg/g creatinine, a threshold level identified when the β2M excretion rate ≥300 µg/g creatinine was used as the indicator of an adverse effect of Cd on the kidneys [25].

3.3. Urinary Cd Excretion as an Indicator of Body Burden

It is well established that the excretion of Cd can be used as an indicator of cumulative long-term exposure to this metal [64,65]. Specifically, the urine concentration of Cd reflects kidney burden because most of the acquired Cd can be found in the PTCs of the kidneys. These cells release Cd complexed with metallothionein (MT) into the lumen, which then appears in urine following cell damage and cell death from any cause [47].
In human population studies, urine samples are often collected at a single time point (a voided urine sample), and consequently the adjusting of the urine concentrations of Cd and all other excreted biomarkers to creatinine excretion (Ecr) has been used as a method to correct for differences in urine dilution among people. However, this Ecr normalization introduces additional variance to datasets, resulting in the underestimation of the effect size of Cd—further details on this are provided in Section 4. To circumvent such a problem, the normalization of Cd and excreted substances to creatinine clearance (Ccr) has been used to correct for interindividual differences in urine dilution and the number of functioning nephrons. This Ccr normalization has unveiled an unambiguous effect of Cd on eGFR [66] and the excretion of β2M, NAG, albumin, and total proteins, which is discussed further in Section 4. The normalization of urinary concentrations of Cd and any excreted substance to Ecr and Ccr can be undertaken using the equations below.
Excretion of x (Ex) was normalized to Ecr as [x]u/[cr]u, where x = Cd or any excreted biomarker; [x]u = urine concentration of x (mass/volume); and [cr]u = urine creatinine concentration (mg/dL). Ex/Ecr was expressed as an amount of x excreted per g of creatinine.
Excretion of x (Ex) was normalized to creatinine clearance (Ccr) as Ex/Ccr = [Cd]u[cr]p/[cr]u, where x = Cd or any excreted biomarker; [x]u = urine concentration of x (mass/volume); [cr]p = plasma creatinine concentration (mg/dL); and [cr]u = urine creatinine concentration (mg/dL). Ex/Ccr was expressed as an amount of x excreted per volume of the glomerular filtrate [67].

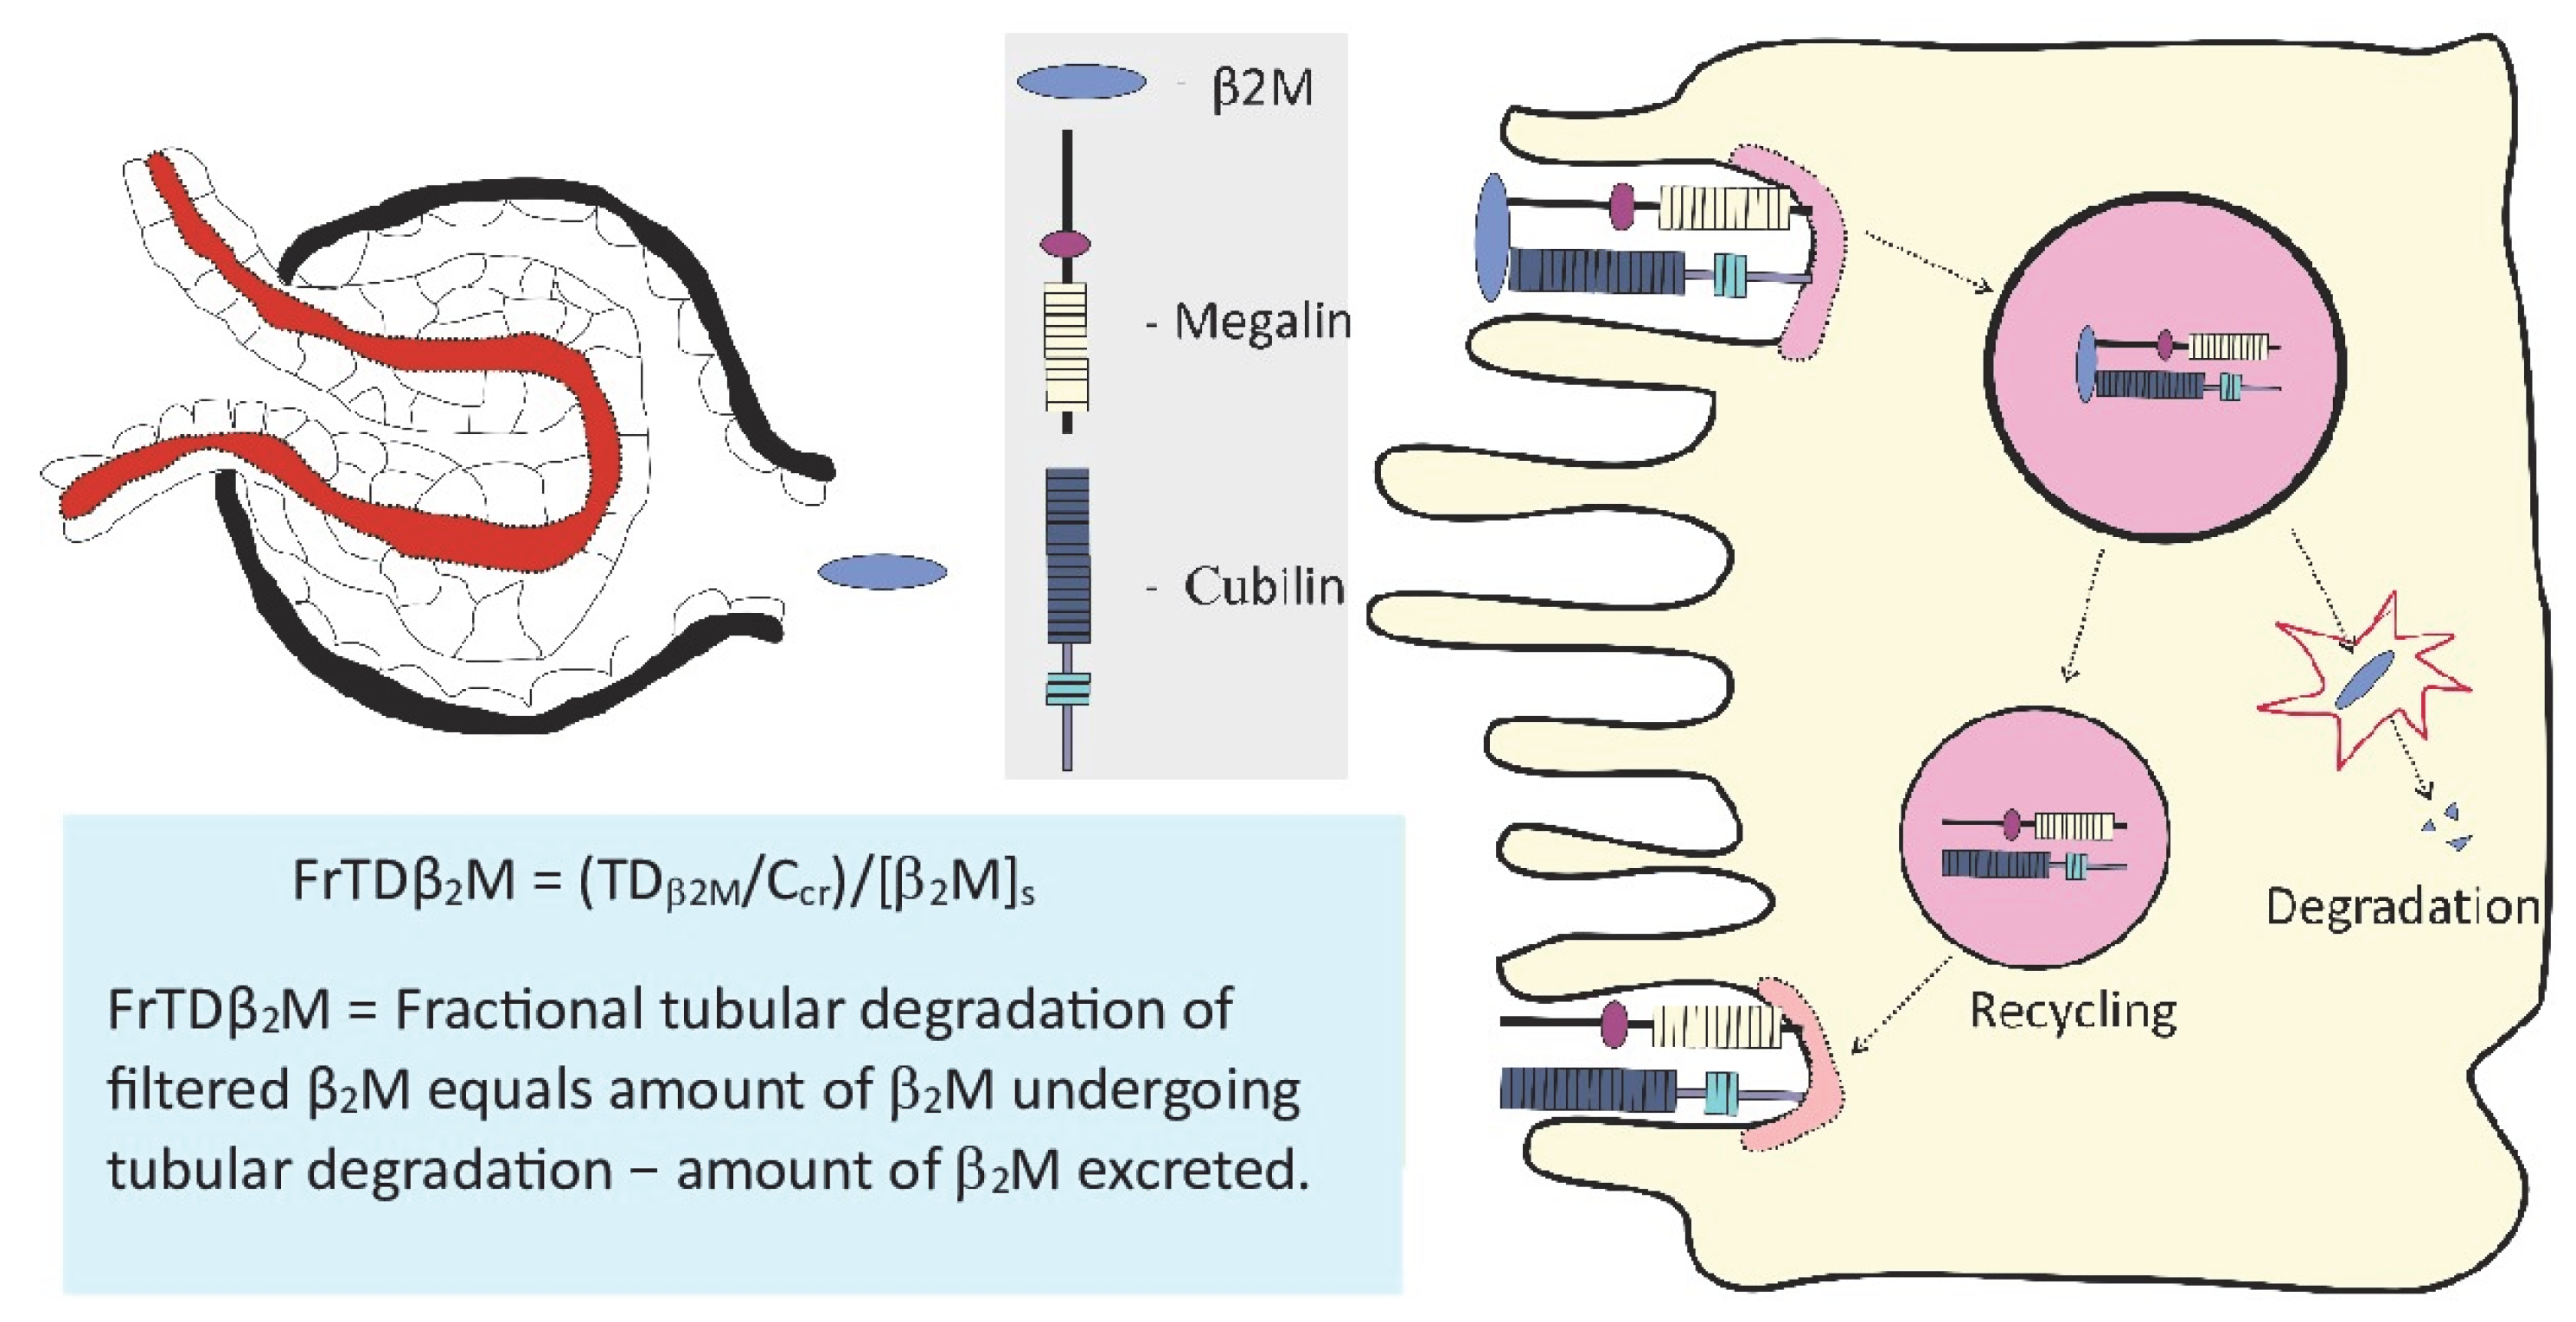
3.4. Measurement of Cadmium Effects on Kidneys

As Figure 2 displays, under normal physiological conditions, blood perfuses the kidneys at the rate of 1 L per minute, and all renal blood flow is directed through afferent arterioles into the glomeruli [68]. The plasma entering the glomerulus is filtered into Bowman’s space and 99.9% of the filtered proteins are reabsorbed by tubules, at approximately 40–50 g each day [68].
The protein β2M, with a molecular weight of 11,800 Daltons, is expressed on the surface of most nucleated cells and is released into the bloodstream [70,71]. As Figure 2 depicts, β2M readily passes through the glomerular membrane to the tubular lumen by virtue of its small mass and is reabsorbed and degraded completely by PTCs [69,70].
As discussed in Section 2, the excretion rate of β2M at 300 µg/g creatinine was used as a critical effect of Cd on kidneys [25]. Based on this β2M endpoint, dietary exposure to Cd of 58 µg/day was derived as a “tolerable” level. However, a recent study on the homeostasis of β2M, as depicted in Figure 2, revealed that the excretion rate of β2M is not a reliable indicator of tubular dysfunction [68]. Hence, a suitable endpoint is needed to establish a new health-protective exposure limit for Cd.
It is noteworthy that the risk of having CKD, signified by a decrease in eGFR to one-third of the normal range or is the presence of albuminuria which persists for 3 months or longer [72,73,74], has been linked to a dietary Cd exposure level of 16.7 µg/day [75] and excretion of Cd between 0.27 and 0.37 µg/g creatinine [76,77,78]. Falling eGFR is a clinically relevant outcome of Cd exposure, and it is suggested that the implications of current dietary Cd exposure can be understood in terms of risk for CKD, since both Cd adverse effects and CKD are defined by the same continuous parameter (eGFR loss) [79]. A further discussion of this is provided in Section 4.2.

4. Benchmark Dose Modeling of Cd Exposure and Its Nephrotoxicity

This section highlights an application of the BMD methodology to define a point of departure (POD) and a threshold level for Cd exposure in the general population. Its primary aim is to identify the nephrotoxicity endpoint suitable for the estimation of a permissible level of dietary Cd exposure. Its secondary aim is to illustrate the total imprecision which is created by the method used to adjust the urine concentration of Cd and indicators of Cd’s effects on kidneys, such as β2M, NAG, albumin, and total protein.

4.1. The BMD Softwares for Modeling of Exposure–Effect Datasets

The modeling of exposure–effect data can be performed manually or using dose–response software programs like the PROAST software (https://proastweb.rivm.nl; accessed on 22 March 2025) and the U.S. EPA’s Benchmark Dose Software (BMDS) (https://www.epa.gov/bmds; accessed on 22 March 2025). The application of the PROAST software for continuous and quantal (prevalence) data is exemplified in Section 4.3. The mathematical dose–response models applicable to continuous variables are the inverse exponential, natural logarithmic, exponential, and Hill models [1,3,4,5]. The dose–response models applicable to quantal datasets are the two-stage, logarithmic logistic, Weibull, logarithmic probability, gamma, exponential, and Hill models [1,2].

4.1.1. The BMD Modeling of Continuous Datasets

The BMD modeling of continuous exposure–effect datasets seeks to define the lower bound (BMDL) and upper bound (BMDU) of the 95% confidence interval (CI) of BMD [1]. The lower bound (BMDL) value derived when the benchmark dose response (BMR) is set at 5% could reflect a point of departure (POD) from normality [1,3,4,5]. It is also referred to as the NOAEL equivalent, meaning the level of exposure below which an adverse effect can be discernable. The upper bound (BMDU) is used for computing the BMDU/BMDL ratio, which reflects the uncertainty in the BMD estimates. The greater the difference between the BMDL and BMDU values, the higher the statistical uncertainty in the dataset [1,3,4,5,6].

4.1.2. The BMD Modeling of Quantal (Prevalence) Datasets

The BMD modeling of exposure–outcome prevalence datasets seeks to define the lower bound (BMDL) and upper bound (BMDU) of the 95% confidence interval (CI) of BMD [1,2,6]. The BMDL/BMDU values computed at 5% and 10% prevalence rates of an adverse effect are designated as BMDL5/BMDU5 and BMDL10/BMDU10, respectively. The BMDL5 can reflect a population threshold level of exposure, defined as an exposure level below which the prevalence of adverse effect can be expected to be ≤5%.

4.2. Dose–Response Relationship

In any toxicological risk evaluation, a significant dose–response relationship should first be established. However, as Grandjean and Budtz-Jørgensen (2007) noted, non-differential errors in the measurement of exposure and outcomes, termed total imprecision, can result in a failure to establish a dose–response relationship [19], which would otherwise be established, when such errors are eliminated [19].
As the data in Table 3 indicate, the effect size of Cd on the eGFR was smaller when ECd was normalized to Ecr; the doubling of ECd/Ecr increased the risk of having low eGFR by 1.47-fold after adjustment for potential confounders [76]. With similar adjustments, the risk of having low eGFR rose 1.96-fold per doubling of ECd/Ccr.
Table 4 provides additional evidence for non-differential errors created by Ecr adjustment [80]. In model A, the risk of having low eGFR was not statistically associated with ECd/Ecr (p = 0.058), while the risk of having proteinuria rose 3.7-fold as ECd/Ecr rose 10-fold (p = 0.045).
In model B, the risks of having low eGFR and proteinuria rose 12-fold (p < 0.001) and 7-fold (p = 0.001), respectively, when there was a 10-fold increase in ECd/Ccr.
In summary, adjusting urine concentrations of Cd and total protein to Ecr generated non-differential errors that could nullify the dose–response relationship. A dose–response relationship could not be established between eGFR and ECd/Ecr, while the strength of the association between EPro/Ecr and ECd/Ecr was weak (Table 4). A lack of Cd effects on eGFR has been reported as detailed below.
In a meta-analysis by Jalili et al. (2021), the association of eGFR and ECd/Ecr was not significant, while the risk of proteinuria rose by only 35%, when the top category of Cd dose metrics was compared with the bottom Cd exposure category [81]. In an earlier meta-analysis by Byber et al. (2016), there was no evidence for an effect of Cd on eGFR nor progressive eGFR reduction among Cd-exposed individuals [82]. In the latest meta-analysis by Doccioli et al. (2024), a dose–response relationship was observed between eGFR and Cd exposure as there were more data that offset the effect of the non-differential errors caused by Ecr normalization [83]. However, there were still insufficient data to connect the risk of albuminuria to Cd exposure [83].

4.3. The BMD Modeling Results Using the PROAST Software

Typically, a single or two dose–response models are used in manual BMD computation, which is cumbersome. BMD software programs like the PROAST are increasingly been used as they are freely accessible and offer several advantages; there are many dose–response models to choose and they employ the Akaike information criterion (AIC), which objectively compares the relative goodness of fit of different models [6].
The dose–response curve in which the data best fit offers an insight into the shape and steepness of the slope describing an effect size of Cd. Outputs from the PROAST software applied to continuous and quantal data from the same 409 individuals [80] shown in Table 4 are shown again in Figure 3 and Figure 4.
For the ECd/Ecra and Epro/Ecr datasets (Figure 3), the mathematical dose–response models used were the exponential, Hill, natural logarithmic, and inverse exponential models. Based on the model weights, the exponential model carried the highest weight (0.6840), followed by the Hill model (0.2794), while the natural logarithmic model (0.0386) and inverse exponential model (0.0017) carried much lower weights. According to model averaging, the BMDL value of ECd/Ecr associated with a 5% increase in excretion rate of total protein was 0.0536 µg/g creatinine. Notably, the BMDL value of ECd/Ecr for an effect on Epro would be unreliable if only Hill model was used in manual BMD modeling.
For the ECd/Ecr and proteinuria prevalence datasets (Figure 4A–C), the mathematical dose–response models applied were the two-stage, logarithmic logistic, Weibull, logarithmic probability, gamma, exponential, and Hill models. According to model averaging, the BMDL5 value of ECd/Ecr for proteinuria was 1.86 µg/g creatinine. The ECd/Ecr–proteinuria prevalence curve fits the moderately logarithmic probability model (0.3501), followed by the Hill (0.1482) and logarithmic logistic models (0.1452).
The same seven dose–response models were applied to the ECd/Ecr–CKD prevalence datasets (Figure 4D–F). The BMDL5 value of ECd/Ecr for CKD was 1.19 µg/g creatinine. The ECd/Ecr–CKD prevalence curve fits the predominantly exponential model (0.8740), meaning that a small change in ECd/Ecr will result in a large increase in CKD prevalence. Thus, the CKD prevalence rate was more sensitive to Cd than proteinuria prevalence.

4.4. Reported BMD Values for Different Nephrotoxic Endpoints

The health-based exposure guidance value for Cd exposure, derived from different “POD” figures like MRL, TRV, TWI, TMI, and RfD, assumes that a threshold level of exposure exists [1]. In theory, an exposure level derived from the most sensitive endpoint or the one with the lowest BMDL value would be protective against all other adverse effects [1]. Thus, the lowest BMDL value of ECd/Ecr should be used to define the Cd exposure limit. To find the nephrotoxicity endpoint most sensitive to Cd, the results of BMD modeling of continuous and quantal data are summarized in Table 5.
Reported BMDL (BMD) values for Cd excretion rates varied among study populations as well as within the same study populations, depending on the mathematical dose–response models, effect indicators (endpoints), and the cut-off values to define abnormality or deviation from normalcy.
Wang et al. (2016) reported BMDL (BMD) values of ECd/Ecr for markers of tubular toxicity, namely RBP, β2M, and NAG [85]. Surprisingly few studies have applied the BMD methodology to the data on eGFR, despite this parameter being a diagnostic criterion for CKD. Proteinuria is a hallmark of CKD and predicts continued progressive functional decline of the kidney [88,89,90], but only one paper has performed the BMD modeling of total protein excretion. Interestingly, Cd exposure has been causally related to a rapid fall in eGFR in a prospective cohort study from Switzerland (n = 4704) [91]. Respective BMDL5 values of ECd/Ecr were 1.86 and 1.19 µg/g creatinine when prevalence rates of proteinuria and low eGFR were used as endpoints [80].
It is notable that the BMD values of ECd/Ecr for effects on eGFR and tubular injury were marginally different, meaning these two effects are intertwined. A study on Swedish women by Suwazono et al. (2006) reported that the BMDL values of ECd/Ecr in Swedish women were 0.5 and 0.7 μg/g creatinine for the tubular injury (ENAG/Ecr) and eGFR endpoints, respectively [84]. Satarug et al. (2022) reported the BMDL values of ECd/Ecr for the effects on eGFR, ENAG/Ecr, and Eβ2M/Ecr using Thai population data [87]. Hayashi et al. (2024) reported that the BMDL values of ECd/Ecr in Japanese women were 3.9 and 3.5 μg/g creatinine for a 10% decrease in the tubular reabsorption of β2M and the Ccr effect, respectively [86].
Another notable result from Thai population data was that the nephrotoxicity of Cd occurred at a very low body burden. Respective BMDL values of ECd/Ecr in men and women were 0.060 and 0.069 µg/g creatinine for the ENAG/Ecr endpoint [87]. The BMDL value of ECd/Ecr was 0.054 µg/g creatinine when a 5% increase in total protein excretion rate was the endpoint [88].
For the quantal (prevalence) data, the prevalence of Cd-related proteinuria increased from 5% to 10% when the population mean value of ECd/ECd rose from 1.86 to 4.47 µg/g creatinine. In comparison, the prevalence of Cd-related low eGFR increased from 5% to 10% when the population mean value of ECd/ECd rose from 1.19 to 1.35 µg/g creatinine. Thus, the effect size of Cd on eGFR decline was larger than proteinuria.

4.5. Impact of Cadmium Exposure on the Prevalence of CKD

To demonstrate that the normalization of ECd and Ealb to Ccr was superior to a conventional adjustment of urine Cd and urine albumin concentration to Ecr, the quantal BMD modeling outputs of the PROAST software are summarized in Table 6.
Due to the great difference between BMDU and BMDL, indicated by the BMDU/BMDL ratios ≥ 200, the BMDL5 and BMDL10 values of ECd/Ecr could not be reliably defined for albuminuria. However, the BMDL5 and BMDL10 values of ECd/Ecr could be identified for 5% and 10% CKD prevalence rates. In women, the BMDL5 and BMDL10 values of ECd/Ecr for CKD were 1.93 and 5.31 µg/g creatinine, respectively. The corresponding BMDL5 and BMDL10 values of ECd/Ecr in men were 1.47 and 3.92 µg/g creatinine, respectively. The lower BMDL5 and BMDL10 values of ECd/Ecr in men compared to women were due to higher creatinine excretion rates in men, attributable to a universally higher muscle mass in men than women of a similar age.
For Ccr-normalized datasets, BMDL5 and BMDL10 values of Cd exposure levels were determined for both albuminuria and CKD prevalence. For the CKD (low eGFR) prevalence, BMDL5 and BMDL10 in men and women were not statistically different. Because the basic mechanism of the cytotoxicity of Cd in the PTCs should be the same, the Cd exposure level producing the same toxic outcome can be expected to be identical in men and women. These data strengthen the advantage of Ccr normalization of the urine concentration of Cd and albumin. By applying Ccr normalization to urine Cd and NAG concentrations, loss of tubular cells per nephron induced by age or Cd was quantified [93].

5. Conclusions

The main route of Cd exposure in non-smokers and non-occupationally exposed people is a normal diet. For the kidney target, dosing experiments in pigs identified the oral Cd exposure limit at 0.2 µg/kg body weight per day, while the exposure limits estimated from human data varied from 0.28 and 0.83 µg/kg body weight per day. For the bone target, estimated Cd exposure limits ranged between 0.21 and 0.64 μg/kg body weight/day. These data indicate that kidney and bone toxicity occur at comparable levels of exposure. Therefore, Cd-induced kidney injury may in turn lead to bone injury. The potential kidney–bone connection, even in low-dose exposure conditions, was observed in a Swedish study [94]. In line with this notion is a systematic review and meta-analysis showing a nearly two-fold increase in the risk of having osteoporosis in both low- and high-Cd-exposure groups [95]. In the low-exposure group, the risk of osteoporosis rose 1.95-fold, comparing Cd excretion ≥0.5 versus <0.5 μg/g creatinine. In the high-exposure group, the risk of osteoporosis rose 1.99-fold, comparing Cd excretion ≥5 versus <5 μg/g creatinine [95].
Existing dietary Cd exposure guidelines that were based on β2M excretion at a rate above 300 µg/g creatinine as a critical kidney effect are not low enough to be protective of population health, especially in those with low body iron stores and marginal intake of zinc. In low-dose exposure situations, an elevation of β2M excretion does not reliably reflect kidney tubular dysfunction. Its use as a basis to estimate an exposure limit for Cd is questionable.
A practice of adjusting the concentration of Cd, β2M, NAG, albumin, and total proteins in urine samples to creatinine excretion (Ecr) creates non-differential errors which bias the dose–response relationship toward the null. It also underestimates or even nullifies the effect size of Cd, especially on eGFR. These impacts of Ecr adjustment have resulted in erroneous conclusions made in two meta-analyses that there was no evidence for an effect of Cd on eGFR nor a progressive eGFR decline among Cd-exposed individuals. To eliminate such errors, the urine concentration of Cd and all other indicators of kidney effects should be normalized to creatinine clearance (Ccr). As another example, the effect of ECd/Ecr on the risk of having low eGFR was insignificant, while the risk of having proteinuria rose 3.7-fold per 10-fold increase in ECd/Ecr. In contrast, the respective risks of having low eGFR and proteinuria rose 12-fold and 7-fold per 10-fold increase in ECd/Ccr. These results were obtained after adjustment of potential confounders.
Using the excretion of NAG and total protein as indicators of kidney effects, the respective BMDL values for Cd excretion rates were 0.060 and 0.054 µg/g creatinine. These figures are 10-fold below the mean value of Cd excretion rates found in the general populations of many countries, being 0.5–0.6 µg/g creatinine. Alarmingly, these findings imply that the nephrotoxicity of Cd may have occurred already in a significant proportion of people. The incidence of CKD and mortality from CKD will continue to rise at the current dietary Cd exposure levels. As suggested by Ginsberg [79], the effects of environmental Cd exposure on the kidney represent a useful case study of toxicological risk assessment. Arguably, because both Cd’s adverse effects and CKD are defined by the same continuous parameter (eGFR), the implications of exposure limits can be understood in terms of risk for CKD.
The Cd exposure level has now reached toxic levels in a significant proportion of people in many populations, and yet there is no consensus on exposure limits for the metal. Based on BMD modeling data and the fact that there is no theoretical reason to believe that a decrease in eGFR due to nephron destruction by Cd is reversible, new dietary Cd exposure guidelines should be established to preserve kidney functional integrity and to minimize disease progression toward kidney failure.
About 15% of the world’s cultivated land is contaminated with toxic metals, especially Cd, which is prevalent in south and east Asia and parts of the Middle East and Africa [96]. Public health measures should be developed to minimize Cd contamination of food chains and maintain the lowest achievable Cd levels in food crops, especially staples. An effective chelation therapy to remove Cd from the kidneys does not exist. The avoidance of foods containing high Cd levels and smoking cessation are essential preventive measures, as is the maintenance of an optimal body weight and body content of essential metals, notably zinc and iron, to reduce Cd assimilation and kidney burdens to the lowest achievable level.

Funding

This research received no external funding.

Institutional Review Board Statement

Not applicable.

Informed Consent Statement

Not applicable.

Data Availability Statement

The original contributions are included in this review. Further inquiries can be directed to the author.

Acknowledgments

The author thanks Aleksandra Buha Đorđević for her professional BMD modeling. The author also thanks Aleksandar Cirovic for his assistance in designing Figure 1 and Figure 2. The work was supported with resources from the Centre for Kidney Disease Research, Translational Research Institute, and the Department of Kidney and Transplant Services, Princess Alexandra Hospital, QLD, Australia.

Conflicts of Interest

The author declares no conflicts of interest.

References

  1. Moffett, D.B.; Mumtaz, M.M.; Sullivan, D.W., Jr.; Whittaker, M.H. Chapter 13, General Considerations of Dose-Effect and Dose-Response Relationships. In Handbook on the Toxicology of Metals, 5th ed.; Volume I: General Considerations; Nordberg, G., Costa, M., Eds.; Academic Press: Cambridge, MA, USA, 2022; pp. 299–317. [Google Scholar]
  2. Sand, S.; Filipsson, A.F.; Victorin, K. Evaluation of the benchmark dose method for dichotomous data: Model dependence and model selection. Regul. Toxicol. Pharmacol. 2002, 36, 184–197. [Google Scholar] [CrossRef] [PubMed]
  3. Slob, W.; Moerbeek, M.; Rauniomaa, E.; Piersma, A.H. A statistical evaluation of toxicity study designs for the estimation of the benchmark dose in continuous endpoints. Toxicol. Sci. 2005, 84, 167–185. [Google Scholar] [CrossRef] [PubMed]
  4. Slob, W.; Setzer, R.W. Shape and steepness of toxicological dose-response relationships of continuous endpoints. Crit. Rev. Toxicol. 2014, 44, 270–297. [Google Scholar] [CrossRef] [PubMed]
  5. Slob, W. A general theory of effect size, and its consequences for defining the benchmark response (BMR) for continuous endpoints. Crit. Rev. Toxicol. 2017, 47, 342–351. [Google Scholar] [CrossRef]
  6. EFSA Scientific Committee. Update: Use of the benchmark dose approach in risk assessment. EFSA J. 2017, 15, 4658. [Google Scholar]
  7. Waalkes, M.P.; Rehm, S. Chronic toxic and carcinogenic effects of cadmium chloride in male DBA/2NCr and NFS/NCr mice: Strain-dependent association with tumors of the hematopoietic system, injection site, liver, and lung. Fundam. Appl. Toxicol. 1994, 23, 21–31. [Google Scholar] [CrossRef]
  8. Huff, J.; Lunn, R.M.; Waalkes, M.P.; Tomatis, L.; Infante, P.F. Cadmium-induced cancers in animals and in humans. Int. J. Occup. Environ. Health 2007, 13, 202–212. [Google Scholar] [CrossRef]
  9. Tokar, E.J.; Benbrahim-Tallaa, L.; Waalkes, M.P. Metal ions in human cancer development. Met. Ions Life Sci. 2011, 8, 375–401. [Google Scholar]
  10. Callan, A.; Hinwood, A.; Devine, A. Metals in commonly eaten groceries in Western Australia: A market basket survey and dietary assessment. Food Addit. Contam. Part. A Chem. Anal. Control Expo. Risk Assess. 2014, 31, 1968–1981. [Google Scholar] [CrossRef]
  11. Watanabe, T.; Kataoka, Y.; Hayashi, K.; Matsuda, R.; Uneyama, C. Dietary Exposure of the Japanese General Population to Elements: Total Diet Study 2013–2018. Food Saf. 2022, 10, 83–101. [Google Scholar] [CrossRef]
  12. Pokharel, A.; Wu, F. Dietary exposure to cadmium from six common foods in the United States. Food Chem. Toxicol. 2023, 178, 113873. [Google Scholar] [CrossRef] [PubMed]
  13. Boon, P.E.; Pustjens, A.M.; Te Biesebeek, J.D.; Brust, G.M.H.; Castenmiller, J.J.M. Dietary intake and risk assessment of elements for 1- and 2-year-old children in the Netherlands. Food Chem. Toxicol. 2022, 161, 112810. [Google Scholar] [CrossRef] [PubMed]
  14. Almerud, P.; Zamaratskaia, G.; Lindroos, A.K.; Bjermo, H.; Andersson, E.M.; Lundh, T.; Ankarberg, E.H.; Lignell, S. Cadmium, total mercury, and lead in blood and associations with diet, sociodemographic factors, and smoking in Swedish adolescents. Environ. Res. 2021, 197, 110991. [Google Scholar] [CrossRef]
  15. Hill, D.T.; Jandev, V.; Petroni, M.; Atallah-Yunes, N.; Bendinskas, K.; Brann, L.S.; Heffernan, K.; Larsen, D.A.; MacKenzie, J.A.; Palmer, C.D.; et al. Airborne levels of cadmium are correlated with urinary cadmium concentrations among young children living in the New York state city of Syracuse, USA. Environ. Res. 2023, 223, 115450. [Google Scholar] [CrossRef]
  16. Satarug, S.; Vesey, D.A.; Gobe, G.C.; Phelps, K.R. Estimation of health risks associated with dietary cadmium exposure. Arch. Toxicol. 2023, 97, 329–358. [Google Scholar] [CrossRef]
  17. Egger, A.E.; Grabmann, G.; Gollmann-Tepeköylü, C.; Pechriggl, E.J.; Artner, C.; Türkcan, A.; Hartinger, C.G.; Fritsch, H.; Keppler, B.K.; Brenner, E.; et al. Chemical imaging and assessment of cadmium distribution in the human body. Metallomics 2019, 11, 2010–2019. [Google Scholar] [CrossRef]
  18. Cirovic, A.; Satarug, S. Toxicity Tolerance in the Carcinogenesis of Environmental Cadmium. Int. J. Mol. Sci. 2024, 25, 1851. [Google Scholar] [CrossRef]
  19. Satarug, S.; Garrett, S.H.; Somji, S.; Sens, M.A.; Sens, D.A. Aberrant Expression of ZIP and ZnT Zinc Transporters in UROtsa Cells Transformed to Malignant Cells by Cadmium. Stresses 2021, 1, 78–89. [Google Scholar] [CrossRef]
  20. Grandjean, P.; Budtz-Jørgensen, E. Total imprecision of exposure biomarkers: Implications for calculating exposure limits. Am. J. Ind. Med. 2007, 50, 712–719. [Google Scholar] [CrossRef]
  21. Aoshima, K. Epidemiology of renal tubular dysfunction in the inhabitants of a cadmium-polluted area in the Jinzu River basin in Toyama Prefecture. Tohoku J. Exp. Med. 1987, 152, 151–172. [Google Scholar] [CrossRef]
  22. Horiguchi, H.; Aoshima, K.; Oguma, E.; Sasaki, S.; Miyamoto, K.; Hosoi, Y.; Katoh, T.; Kayama, F. Latest status of cadmium accumulation and its effects on kidneys, bone, and erythropoiesis in inhabitants of the formerly cadmium-polluted Jinzu River Basin in Toyama, Japan, after restoration of rice paddies. Int. Arch. Occup. Environ. Health 2010, 83, 953–970. [Google Scholar] [CrossRef] [PubMed]
  23. Kurata, Y.; Katsuta, O.; Doi, T.; Kawasuso, T.; Hiratsuka, H.; Tsuchitani, M.; Umemura, T. Chronic cadmium treatment induces tubular nephropathy and osteomalacic osteopenia in ovariectomized cynomolgus monkeys. Vet. Pathol. 2014, 51, 919–931. [Google Scholar] [CrossRef] [PubMed]
  24. Wong, C.; Roberts, S.M.; Saab, I.N. Review of regulatory reference values and background levels for heavy metals in the human diet. Regul. Toxicol. Pharmacol. 2022, 130, 105122. [Google Scholar] [CrossRef] [PubMed]
  25. JECFA. Summary and Conclusions. In Proceedings of the Joint FAO/WHO Expert Committee on Food Additives and Contaminants, Seventy-Third Meeting, Geneva, Switzerland, 8–17 June 2010; Available online: https://apps.who.int/iris/handle/10665/44521 (accessed on 22 March 2025).
  26. European Food Safety Authority (EFSA). Scientific opinion on cadmium in food. EFSA J. 2009, 980, 1–139. [Google Scholar]
  27. European Food Safety Authority (EFSA). Statement on tolerable weekly intake for cadmium. EFSA J. 2011, 9, 1975. [Google Scholar]
  28. Qing, Y.; Yang, J.; Zhu, Y.; Li, Y.; Zheng, W.; Wu, M.; He, G. Dose-response evaluation of urinary cadmium and kidney injury biomarkers in Chinese residents and dietary limit standards. Environ. Health 2021, 20, 75. [Google Scholar] [CrossRef]
  29. Qing, Y.; Yang, J.; Chen, Y.; Shi, C.; Zhang, Q.; Ning, Z.; Yu, Y.; Li, Y. Urinary cadmium in relation to bone damage: Cadmium exposure threshold dose and health-based guidance value estimation. Ecotoxicol. Environ. Saf. 2021, 226, 112824. [Google Scholar] [CrossRef]
  30. Leconte, S.; Rousselle, C.; Bodin, L.; Clinard, F.; Carne, G. Refinement of health-based guidance values for cadmium in the French population based on modelling. Toxicol. Lett. 2021, 340, 43–51. [Google Scholar] [CrossRef]
  31. Schaefer, H.R.; Flannery, B.M.; Crosby, L.M.; Pouillot, R.; Farakos, S.M.S.; Van Doren, J.M.; Dennis, S.; Fitzpatrick, S.; Middleton, K. Reassessment of the cadmium toxicological reference value for use in human health assessments of foods. Regul. Toxicol. Pharmacol. 2023, 144, 105487. [Google Scholar] [CrossRef]
  32. Wu, X.; Wei, S.; Wei, Y.; Guo, B.; Yang, M.; Zhao, D.; Liu, X.; Cai, X. The reference dose for subchronic exposure of pigs to cadmium leading to early renal damage by benchmark dose method. Toxicol. Sci. 2012, 128, 524–531. [Google Scholar] [CrossRef]
  33. Brzóska, M.M.; Moniuszko-Jakoniuk, J. Disorders in bone metabolism of female rats chronically exposed to cadmium. Toxicol. Appl. Pharmacol. 2005, 202, 68–83. [Google Scholar] [CrossRef] [PubMed]
  34. Brzóska, M.M.; Moniuszko-Jakoniuk, J. Bone metabolism of male rats chronically exposed to cadmium. Toxicol. Appl. Pharmacol. 2005, 207, 195–211. [Google Scholar] [CrossRef] [PubMed]
  35. Brzóska, M.M.; Moniuszko-Jakoniuk, J. Effect of low-level lifetime exposure to cadmium on calciotropic hormones in aged female rats. Arch. Toxicol. 2005, 79, 636–646. [Google Scholar] [CrossRef]
  36. Faroon, O.; Keith, S.; Mumtaz, M.; Ruiz, P. Minimal Risk Level Derivation for Cadmium: Acute and Intermediate Duration Exposures. J. Exp. Clin. Toxicol. 2017, 1, 1–12. [Google Scholar] [CrossRef]
  37. U.S. Department of Health and Human Services; National Institutes of Health. NTP, NIH Publication 95–3388: NTP Technical Report on Toxicity Studies of Cadmium Oxide (CAS No. 1306–19-0) Administered by Inhalation to F344/N Rats and B6C3F1 Mice; National Toxicology Program: Research Triangle Park, NC, USA, 1995. [Google Scholar]
  38. Fujita, Y.; el Belbasi, H.I.; Min, K.S.; Onosaka, S.; Okada, Y.; Matsumoto, Y.; Mutoh, N.; Tanaka, K. Fate of cadmium bound to phytochelatin in rats. Res. Commun. Chem. Pathol. Pharmacol. 1993, 82, 357–365. [Google Scholar]
  39. Langelueddecke, C.; Roussa, E.; Fenton, R.A.; Thévenod, F. Expression and function of the lipocalin-2 (24p3/NGAL) receptor in rodent and human intestinal epithelia. PLoS ONE 2013, 8, e71586. [Google Scholar] [CrossRef]
  40. Langelueddecke, C.; Lee, W.K.; Thévenod, F. Differential transcytosis and toxicity of the hNGAL receptor ligands cadmium-metallothionein and cadmium-phytochelatin in colon-like Caco-2 cells: Implications for in vivo cadmium toxicity. Toxicol. Lett. 2014, 226, 228–235. [Google Scholar] [CrossRef]
  41. Schneider, S.N.; Liu, Z.; Wang, B.; Miller, M.L.; Afton, S.E.; Soleimani, M.; Nebert, D.W. Oral cadmium in mice carrying 5 versus 2 copies of the Slc39a8 gene: Comparison of uptake, distribution, metal content, and toxicity. Int. J. Toxicol. 2014, 33, 14–20. [Google Scholar] [CrossRef]
  42. Fujishiro, H.; Himeno, S. New insights into the roles of ZIP8, a cadmium and manganese transporter, and its relation to human diseases. Biol. Pharm. Bull. 2019, 42, 1076–1082. [Google Scholar] [CrossRef]
  43. Thévenod, F.; Fels, J.; Lee, W.K.; Zarbock, R. Channels, transporters and receptors for cadmium and cadmium complexes in eukaryotic cells: Myths and facts. Biometals 2019, 32, 469–489. [Google Scholar] [CrossRef]
  44. Ohta, H.; Ohba, K. Involvement of metal transporters in the intestinal uptake of cadmium. J. Toxicol. Sci. 2020, 45, 539–548. [Google Scholar] [CrossRef] [PubMed]
  45. Kikuchi, Y.; Nomiyama, T.; Kumagai, N.; Dekio, F.; Uemura, T.; Takebayashi, T.; Nishiwaki, Y.; Matsumoto, Y.; Sano, Y.; Hosoda, K.; et al. Uptake of cadmium in meals from the digestive tract of young non-smoking Japanese female volunteers. J. Occup. Health 2003, 45, 43–52. [Google Scholar] [CrossRef] [PubMed]
  46. Horiguchi, H.; Oguma, E.; Sasaki, S.; Miyamoto, K.; Ikeda, Y.; Machida, M.; Kayama, F. Comprehensive study of the effects of age, iron deficiency, diabetes mellitus, and cadmium burden on dietary cadmium absorption in cadmium-exposed female Japanese farmers. Toxicol. Appl. Pharmacol. 2004, 196, 114–123. [Google Scholar] [CrossRef] [PubMed]
  47. Satarug, S.; Vesey, D.A.; Ruangyuttikarn, W.; Nishijo, M.; Gobe, G.C.; Phelps, K.R. The Source and Pathophysiologic Significance of Excreted Cadmium. Toxics 2019, 7, 55. [Google Scholar] [CrossRef]
  48. Peng, X.; Li, C.; Zhao, D.; Huang, L. Associations of micronutrients exposure with cadmium body burden among population: A systematic review. Ecotoxicol. Environ. Saf. 2023, 256, 114878. [Google Scholar] [CrossRef]
  49. Silver, M.K.; Lozoff, B.; Meeker, J.D. Blood cadmium is elevated in iron deficient U.S. children: A cross-sectional study. Environ. Health 2013, 12, 117. [Google Scholar] [CrossRef]
  50. Schildroth, S.; Friedman, A.; Bauer, J.A.; Claus Henn, B. Associations of a metal mixture with iron status in U.S. adolescents: Evidence from the National Health and Nutrition Examination Survey. New Dir. Child. Adolesc. Dev. 2022, 2022, 67–89. [Google Scholar] [CrossRef]
  51. Flanagan, P.R.; McLellan, J.S.; Haist, J.; Cherian, G.; Chamberlain, M.J.; Valberg, L.S. Increased dietary cadmium absorption in mice and human subjects with iron deficiency. Gastroenterology 1978, 74, 841–846. [Google Scholar] [CrossRef]
  52. Meltzer, H.M.; Brantsaeter, A.L.; Borch-Iohnsen, B.; Ellingsen, D.G.; Alexander, J.; Thomassen, Y.; Stigum, H.; Ydersbond, T.A. Low iron stores are related to higher blood concentrations of manganese, cobalt and cadmium in non-smoking, Norwegian women in the HUNT 2 study. Environ. Res. 2010, 110, 497–504. [Google Scholar] [CrossRef]
  53. King, J.C.; Brown, K.H.; Gibson, R.S.; Krebs, N.F.; Lowe, N.M.; Siekmann, J.H.; Raiten, D.J. Biomarkers of nutrition for development (BOND)—Zinc review. J. Nutr. 2015, 146, 858S–885S. [Google Scholar] [CrossRef]
  54. Trame, S.; Wessels, I.; Haase, H.; Rink, L. A short 18 items food frequency questionnaire biochemically validated to estimate zinc status in humans. J. Trace Elem. Med. Biol. 2018, 49, 285–295. [Google Scholar] [CrossRef] [PubMed]
  55. Lowe, N.M.; Hall, A.G.; Broadley, M.R.; Foley, J.; Boy, E.; Bhutta, Z.A. Preventing and controlling zinc deficiency across the life course: A call to action. Adv. Nutr. 2024, 15, 100181. [Google Scholar] [CrossRef]
  56. Cirovic, A.; Cirovic, A. Factors moderating cadmium bioavailability: Key considerations for comparing blood cadmium levels between groups. Food Chem. Toxicol. 2024, 191, 114865. [Google Scholar] [CrossRef] [PubMed]
  57. Van Maele-Fabry, G.; Lombaert, N.; Lison, D. Dietary exposure to cadmium and risk of breast cancer in postmenopausal women: A systematic review and meta-analysis. Environ. Int. 2016, 86, 1–13. [Google Scholar] [CrossRef]
  58. Larsson, S.C.; Orsini, N.; Wolk, A. Urinary cadmium concentration and risk of breast cancer: A systematic review and dose-response meta-analysis. Am. J. Epidemiol. 2015, 182, 375–380. [Google Scholar] [CrossRef]
  59. Lin, J.; Zhang, F.; Lei, Y. Dietary intake and urinary level of cadmium and breast cancer risk: A meta-analysis. Cancer Epidemiol. 2016, 42, 101–107. [Google Scholar] [CrossRef]
  60. Adokwe, J.B.; Pouyfung, P.; Kuraeiad, S.; Wongrith, P.; Inchai, P.; Yimthiang, S.; Satarug, S.; Khamphaya, T. Concurrent Lead and Cadmium Exposure Among Diabetics: A Case-Control Study of Socio-Demographic and Consumption Behaviors. Nutrients 2025, 17, 710. [Google Scholar] [CrossRef]
  61. Schwartz, G.G.; Il’yasova, D.; Ivanova, A. Urinary cadmium, impaired fasting glucose, and diabetes in the NHANES III. Diabetes Care 2003, 26, 468–470. [Google Scholar] [CrossRef]
  62. Wallia, A.; Allen, N.B.; Badon, S.; El Muayed, M. Association between urinary cadmium levels and prediabetes in the NHANES 2005–2010 population. Int. J. Hyg. Environ. Health 2014, 217, 854–860. [Google Scholar] [CrossRef]
  63. Jiang, F.; Zhi, X.; Xu, M.; Li, B.; Zhang, Z. Gender-specific differences of interaction between cadmium exposure and obesity on prediabetes in the NHANES 2007–2012 population. Endocrine 2018, 61, 258–266. [Google Scholar] [CrossRef]
  64. Barregard, L.; Fabricius-Lagging, E.; Lundh, T.; Mölne, J.; Wallin, M.; Olausson, M.; Modigh, C.; Sallstenm, G. Cadmium, mercury, and lead in kidney cortex of living kidney donors: Impact of different exposure sources. Environ. Res. 2010, 110, 47–54. [Google Scholar] [CrossRef] [PubMed]
  65. Akerstrom, M.; Barregard, L.; Lundh, T.; Sallsten, G. The relationship between cadmium in kidney and cadmium in urine and blood in an environmentally exposed population. Toxicol. Appl. Pharmacol. 2013, 268, 286–293. [Google Scholar] [CrossRef] [PubMed]
  66. Satarug, S.; Vesey, D.A.; Nishijo, M.; Ruangyuttikarn, W.; Gobe, G.C.; Phelps, K.R. The Effect of Cadmium on GFR Is Clarified by Normalization of Excretion Rates to Creatinine Clearance. Int. J. Mol. Sci. 2021, 22, 1762. [Google Scholar] [CrossRef] [PubMed]
  67. Phelps, K.R.; Gosmanova, E.O. A generic method for analysis of plasma concentrations. Clin. Nephrol. 2020, 94, 43–49. [Google Scholar] [CrossRef]
  68. Navar, L.G.; Maddox, D.A.; Munger, K.A. Chapter 3: The renal circulations and glomerular filtration. In Brenner and Rector’s the Kidney, 11th ed.; Elsevier: Philadelphia, PA, USA, 2020; pp. 80–114. [Google Scholar]
  69. Phelps, K.R.; Yimthiang, S.; Pouyfung, P.; Khamphaya, T.; Vesey, D.A.; Satarug, S. Homeostasis of β2-Microglobulin in Diabetics and Non-Diabetics with Modest Cadmium Intoxication. Scierxiv 2025, 2025, 60. [Google Scholar] [CrossRef]
  70. Argyropoulos, C.P.; Chen, S.S.; Ng, Y.-H.; Roumelioti, M.-E.; Shaffi, K.; Singh, P.P.; Tzamaloukas, A.H. Rediscovering Beta-2 Microglobulin as a Biomarker across the Spectrum of Kidney Diseases. Front. Med. 2017, 4, 73. [Google Scholar] [CrossRef]
  71. Sivanathan, P.C.; Ooi, K.S.; Mohammad Haniff, M.A.S.; Ahmadipour, M.; Dee, C.F.; Mokhtar, N.M.; Hamzah, A.A.; Chang, E.Y. Lifting the Veil: Characteristics, Clinical Significance, and Application of β-2-Microglobulin as Biomarkers and Its Detection with Biosensors. ACS Biomater. Sci. Eng. 2022, 8, 3142–3161. [Google Scholar] [CrossRef]
  72. Murton, M.; Goff-Leggett, D.; Bobrowska, A.; Garcia Sanchez, J.J.; James, G.; Wittbrodt, E.; Nolan, S.; Sörstadius, E.; Pecoits-Filho, R.; Tuttle, K. Burden of Chronic Kidney Disease by KDIGO Categories of Glomerular Filtration Rate and Albuminuria: A Systematic Review. Adv. Ther. 2021, 38, 180–200. [Google Scholar] [CrossRef]
  73. Kalantar-Zadeh, K.; Jafar, T.H.; Nitsch, D.; Neuen, B.L.; Perkovic, V. Chronic kidney disease. Lancet 2021, 398, 786–802. [Google Scholar] [CrossRef]
  74. Farrell, D.R.; Vassalotti, J.A. Screening, identifying, and treating chronic kidney disease: Why, who, when, how, and what? BMC Nephrol. 2024, 25, 34. [Google Scholar] [CrossRef]
  75. Shi, Z.; Taylor, A.W.; Riley, M.; Byles, J.; Liu, J.; Noakes, M. Association between dietary patterns, cadmium intake and chronic kidney disease among adults. Clin. Nutr. 2018, 37, 276–284. [Google Scholar] [CrossRef] [PubMed]
  76. Satarug, S.; Đorđević, A.B.; Yimthiang, S.; Vesey, D.A.; Gobe, G.C. The NOAEL equivalent of environmental cadmium exposure associated with GFR reduction and chronic kidney disease. Toxics 2022, 10, 614. [Google Scholar] [CrossRef] [PubMed]
  77. Feng, X.; Zhou, R.; Jiang, Q.; Wang, Y.; Chen, C. Analysis of cadmium accumulation in community adults and its correlation with low-grade albuminuria. Sci. Total Environ. 2022, 834, 155210. [Google Scholar] [CrossRef]
  78. Grau-Perez, M.; Pichler, G.; Galan-Chilet, I.; Briongos-Figuero, L.S.; Rentero-Garrido, P.; Lopez-Izquierdo, R.; Navas-Acien, A.; Weaver, V.; García-Barrera, T.; Gomez-Ariza, J.L.; et al. Urine cadmium levels and albuminuria in a general population from Spain: A gene-environment interaction analysis. Environ. Int. 2017, 106, 27–36. [Google Scholar] [CrossRef]
  79. Ginsberg, G.L. Cadmium risk assessment in relation to background risk of chronic kidney disease. J. Toxicol. Environ. Health Part A 2012, 75, 374–390. [Google Scholar] [CrossRef]
  80. Satarug, S.; Vesey, D.A.; Đorđević, A.B. The NOAEL equivalent for the cumulative body burden of cadmium: Focus on proteinuria as an endpoint. J. Environ. Expo. Assess. 2024, 3, 26. [Google Scholar] [CrossRef]
  81. Jalili, C.; Kazemi, M.; Cheng, H.; Mohammadi, H.; Babaei, A.; Taheri, E.; Moradi, S. Associations between exposure to heavy metals and the risk of chronic kidney disease: A systematic review and meta-analysis. Crit. Rev. Toxicol. 2021, 51, 165–182. [Google Scholar] [CrossRef]
  82. Byber, K.; Lison, D.; Verougstraete, V.; Dressel, H.; Hotz, P. Cadmium or cadmium compounds and chronic kidney disease in workers and the general population: A systematic review. Crit. Rev. Toxicol. 2016, 46, 191–240. [Google Scholar] [CrossRef]
  83. Doccioli, C.; Sera, F.; Francavilla, A.; Cupisti, A.; Biggeri, A. Association of cadmium environmental exposure with chronic kidney disease: A systematic review and meta-analysis. Sci. Total Environ. 2024, 906, 167165. [Google Scholar] [CrossRef]
  84. Suwazono, Y.; Sand, S.; Vahter, M.; Filipsson, A.F.; Skerfving, S.; Lidfeldt, J.; Akesson, A. Benchmark dose for cadmium-induced renal effects in humans. Environ. Health Perspect. 2006, 114, 1072–1076. [Google Scholar] [CrossRef]
  85. Wang, X.; Wang, Y.; Feng, L.; Tong, Y.; Chen, Z.; Ying, S.; Chen, T.; Li, T.; Xia, H.; Jiang, Z.; et al. Application of the benchmark dose (BMD) method to identify thresholds of cadmium-induced renal effects in non-polluted areas in China. PLoS ONE 2016, 11, e0161240. [Google Scholar] [CrossRef] [PubMed]
  86. Hayashi, T.; Nogawa, K.; Watanabe, Y.; Kido, T.; Sakurai, M.; Nakagawa, H.; Suwazono, Y. Benchmark Dose of Urinary Cadmium for Assessing Renal Tubular and Glomerular Function in a Cadmium-Polluted Area of Japan. Toxics 2024, 12, 836. [Google Scholar] [CrossRef] [PubMed]
  87. Satarug, S.; Vesey, D.A.; Gobe, G.C.; Đorđević, A.B. The Validity of Benchmark Dose Limit Analysis for Estimating Permissible Accumulation of Cadmium. Int. J. Environ. Res. Public Health 2022, 19, 15697. [Google Scholar] [CrossRef] [PubMed]
  88. Makhammajanov, Z.; Gaipov, A.; Myngbay, A.; Bukasov, R.; Aljofan, M.; Kanbay, M. Tubular toxicity of proteinuria and the progression of chronic kidney disease. Nephrol. Dial. Transplant. 2024, 39, 589–599. [Google Scholar] [CrossRef]
  89. Liu, D.; Lv, L.L. New Understanding on the Role of Proteinuria in Progression of Chronic Kidney Disease. Adv. Exp. Med. Biol. 2019, 1165, 487–500. [Google Scholar]
  90. Sharma, S.; Smyth, B. From Proteinuria to Fibrosis: An Update on Pathophysiology and Treatment Options. Kidney Blood Press. Res. 2021, 46, 411–420. [Google Scholar] [CrossRef]
  91. Xie, S.; Perrais, M.; Golshayan, D.; Wuerzner, G.; Vaucher, J.; Thomas, A.; Marques-Vidal, P. Association between urinary heavy metal/trace element concentrations and kidney function: A prospective study. Clin. Kidney J. 2024, 18, sfae378. [Google Scholar] [CrossRef]
  92. Satarug, S.; Vesey, D.A.; Gobe, G.C.; Yimthiang, S.; Buha Đorđević, A. Health Risk in a Geographic Area of Thailand with Endemic Cadmium Contamination: Focus on Albuminuria. Toxics 2023, 11, 68. [Google Scholar] [CrossRef]
  93. Satarug, S. Urinary N-acetylglucosaminidase in People Environmentally Exposed to Cadmium Is Minimally Related to Cadmium-Induced Nephron Destruction. Toxics 2024, 12, 775. [Google Scholar] [CrossRef]
  94. Wallin, M.; Sallsten, G.; Fabricius-Lagging, E.; Öhrn, C.; Lundh, T.; Barregard, L. Kidney cadmium levels and associations with urinary calcium and bone mineral density: A cross-sectional study in Sweden. Environ. Health 2013, 12, 22. [Google Scholar] [CrossRef]
  95. Kunioka, C.T.; Manso, M.C.; Carvalho, M. Association between Environmental Cadmium Exposure and Osteoporosis Risk in Postmenopausal Women: A Systematic Review and Meta-Analysis. Int. J. Environ. Res. Public Health 2022, 20, 485. [Google Scholar] [CrossRef] [PubMed]
  96. Hou, D.; Jia, X.; Wang, L.; McGrath, S.P.; Zhu, Y.G.; Hu, Q.; Zhao, F.J.; Bank, M.S.; O’Connor, D.; Nriagu, J. Global soil pollution by toxic metals threatens agriculture and human health. Science 2025, 388, 316–321. [Google Scholar] [CrossRef] [PubMed]
Figure 1. The pathway for cadmium in food to its toxic manifestation in the kidneys. From the gut, Cd can enter the blood stream via specialized transport proteins and pathways for iron, zinc, copper, cobalt, and calcium [41,42,43,44]. Also, the specialized transport proteins for essential metals provide Cd with multiple routes to enter most cells of the body, in which the metal is retained due to a lack of excretory mechanisms. Most of the acquired Cd accumulates within the proximal tubular epithelial cells (PTCs) of the kidneys. The manifestation of toxic Cd accumulation in the kidneys, such as tubulointerstitial inflammation, may incapacitate the glomerular filtration rate. Cd appears in urine following the injury to or death of the PTCs. Via the normalization of Cd excretion (ECd) to creatinine clearance (Ccr), the amount of Cd exiting the kidneys per nephron can be precisely quantified [47]. Abbreviations: DMT1, divalent metal transporter1; ZIP14, Zrt- and Irt-related protein 10; ATP7A, ATPases (Cu-ATPases); TRPV6, transient receptor potential vanilloid6; NGAL, neutrophil-gelatinase associated lipocalin.
Toxics 13 00404 g001
Figure 2. Measuring the tubular effects of cadmium. The reabsorption of β2M occurs mostly in the S1 segment of tubules via receptor-mediated endocytosis (RME), involving megalin. Fractional tubular degradation of β2M (blue text box), not the excretion rate of β2M, has been found to be a reliable indicator of tubular dysfunction, especially in low-dose exposure scenarios [69].
Toxics 13 00404 g002
Figure 3. Outputs from the PROAST software applied to ECd/Ecr and protein excretion datasets. The weight ranking of each mathematical dose–response model from the highest to the lowest was as follows: exponential (A), Hill (B), natural logarithmic (C), and inverse exponential (D). Bootstrap model averaging with 200 repeats (E), model weighing (F), and BMDL and BMDU values (G). Data were from Satarug et al. 2024 [80].
Toxics 13 00404 g003
Figure 4. Outputs from the PROAST software applied to ECd/Ecr–proteinuria and ECd/Ecr–low eGFR datasets. Bootstrap model averaging with 200 repeats for ECd/Ecr–-proteinuria (A), ECd/Ecr–-low eGFR (D), model weighing (B,E), and BMDL5 and BMDU5 values (C,F). The mathematical dose–response models applied to prevalence datasets are the two-stage, logarithmic logistic, Weibull, logarithmic probability, gamma, exponential, and Hill models. Data were from Satarug et al. 2024 [80].
Toxics 13 00404 g004
Table 1. Exposure guidelines for Cd in the diet based on kidney and/or bone effects.
Target/EndpointTolerable Intake/Exposure Threshold LevelReference
Kidneys,
β2M excretion rate ≥ 300 µg/g creatinine.
A tolerable intake level of 0.83 μg/kg body weight/day (58 µg per day for a 70 kg person).
A cumulative lifetime intake of 2 g.
Assumed Cd absorption rate of 3–7%.
Threshold level of 5.24 μg/g creatinine.
JECFA [25]
Kidneys,
β2M excretion rate ≥ 300 µg/g creatinine.
A reference dose of 0.36 μg/kg body weight per day (25.2 µg per day for a 70 kg person)
Threshold level of 1 μg/g creatinine
EFSA [26,27]
Kidneys,
β2M and
NAG excretion rates
A tolerable intake level of 0.28 μg/kg body weight per day; 16.8 µg/day for a 60 kg person.
Threshold levels for the β2M and NAG effects were 3.07 and 2.93 μg/g creatinine, respectively.
An average dietary Cd exposure in China was 30.6 μg/day.
Qing et al., 2021 [28]
Bones,
Bone mineral
density
A tolerable Cd intake of 0.64 μg/kg body weight per day.
Threshold level of 1.71 μg/g creatinine.
Qing et al., 2021 [29]
Bones,
Bone mineral
density
A tolerable intake level of 0.35 μg/kg body weight per day.
Assumed threshold level of 0.5 μg/g creatinine.
Leconte et al., 2021 [30]
Kidneys and bones,
Reverse dosimetry PBPK modeling
Toxicological reference values were 0.21 and 0.36 μg/kg body weight per day, assuming a similar threshold level for effects on kidneys and bones of 0.5 μg/g creatinine.Schaefer et al., 2023 [31]
NAG, N-acetyl-β-D-glucosaminidase; PBPK, physiologically based pharmacokinetics.
Table 2. Exposure guidelines for Cd estimated from dosing experiments.
Target/Animal Species/Dosing RegimesExposure Outcome/Exposure LimitsReference
Kidneys, inbred pigs.
Dose: Cd in the feed at 0, 0.5, 2, 8, and 32 mg Cd/kg for 100 days. Cd in tab water was less than 0.001 μg/L.
Tubular dysfunction; urine RBP, NAG, CdMT, and β2M.
Respective BMDL values of Cd were 0.67, 0.88, 1.00, and 3.08 mg/kg feed for RBP, NAG, CdMT and β2M.
A tolerable Cd intake level in human was 0.2 μg/kg body weight/day with uncertainty factor 100.
Wu et al., 2012 [32]
Bones, Wistar rats.
Dose: CdCl2 in drinking water at 0, 1, 5, or 50 mg/L for 6, 9, or 12 months.
Decrease in bone mineral density.
Minimal risk level (MRL) for oral Cd in an intermediate exposure duration (15–365 days): 0.5 µg/kg body weight per day
Faroon et al., 2017 [33,34,35,36]
Lungs, Fisher F344 rats
Dose: CdO at 0, 0.1, 0.3, 1, 3, or 10 mg CdO/m3, for 6.2 h/day, 5 days/week for 2 weeks.
Alveolar histiocytic infiltration and focal inflammation in alveolar septa.
MRL for an acute inhalational exposure to Cd for the duration between 1 and 14 days:
0.03 μg/m3.
Faroon et al., 2017 [36,37]
BMDL, benchmark dose lower limit; RBP, retinol binding protein; NAG, N-acetyl-β-D-glucosaminidase; CdMT, cadmium complexed with metallothionein; β2M, β2-microglobulin.
Table 3. Effects of the normalization of Cd excretion rate on risk of having low eGFR.
a Low eGFR
Model APOR95% CIp
LowerUpper
Log2[(ECd/Ecr) × 103], µg/g creatinine1.4701.2761.692<0.001
Hypertension1.6320.8853.0080.117
Gender1.0290.5282.0020.934
Smoking1.2320.6372.3830.536
BMI, kg/m2
12–18Referent
19–231.0580.4592.4390.894
≥242.8101.1187.0640.028
Age, years
16–45Referent
46–5514.231.867108.40.010
56–6528.213.538224.90.002
66–87141.217.871116<0.001
Model BPORLowerUpperp
Log2[(ECd/Ccr) × 105], µg/L filtrate1.9621.5892.422<0.001
Hypertension1.7350.9163.2870.091
Gender0.8400.4101.7190.633
Smoking0.9440.4741.8790.869
BMI, kg/m2
12–18Referent
19–231.1090.4522.7170.822
≥243.1501.1818.4000.022
Age, years
16–45Referent
46–559.9511.30575.880.027
56–6534.574.312277.20.001
66–87198.624.591605<0.001
a Low eGFR was defined as eGFR ≤ 60 mL/min/1.73 m2. ECd was normalized to Ecr and Ccr in models A and B, respectively. Data were from 917 subjects (562 females, 355 males), 16–87 years of age [76].
Table 4. Effects of normalization of Cd excretion rate on risks of having low eGFR and proteinuria.
Low eGFR aProteinuria b
Model APOR (95% CI)pPOR (95% CI)p
Age, years1.121 (1.080, 1.165)<0.0011.068 (1.028, 1.110)0.001
Log10[(ECd/Ecr) × 103], µg/g creatinine2.638 (0.969, 7.182)0.0583.685 (1.027, 13.22)0.045
Gender1.082 (0.490, 2.390)0.8451.096 (0.475, 2.528)0.829
Smoking1.425 (0.596, 3.406)0.4261.678 (0.627, 4.486)0.303
Hypertension2.211 (1.017, 4.805)0.0451.113 (0.432, 2.867)0.824
Model BPOR (95% CI)pPOR (95% CI)p
Age, years1.118 (1.073, 1.165)<0.0011.061 (1.022, 1.102)0.002
Log10[(ECd/Ccr) × 105], mg/L filtrate12.24 (3.729, 40.20)<0.0017.143 (2.133, 23.92)0.001
Gender0.802 (0.346, 1.861)0.6081.117 (0.482, 2.587)0.796
Smoking1.335 (0.546, 3.262)0.5271.947 (0.725, 5.234)0.186
Hypertension2.734 (1.204, 6.207)0.0161.018 (0.410, 2.530)0.969
a Low eGFR was defined as eGFR ≤ 60 mL/min/1.73 m2. b Proteinuria was defined as Epro/Ecr ≥ 100 mg/g creatinine and (Epro/Ccr) × 100 ≥ 100 mg/L filtrate in models A and B, respectively. Data were from 405 subjects (208 females, 197 males) [80].
Table 5. BMD modeling of Cd exposure with different nephrotoxicity endpoints.
Endpoints/PopulationResultsReference
NAG and eGFR
n = 790 women, 53–64 years,
Sweden
BMDL (BMD) values of ECd/Ecr were 0.5 (0.6) and 0.7 (1.1) μg/g creatinine the NAG and eGFR endpoints,
respectively.
Suwazono et al., 2006 [84]
RBP, β2M and NAG
n = 934 (469 men, 465 women),
10–71 + years,
Jiangshan City, Zhejiang,
China
BMDL values of ECd/Ecr at 5% (10%) BMR in men were 0.89 (1.59), 0.62 (1.30), 0.49 (1.04) μg/g creatinine for the RBP, β2M, and NAG endpoints, respectively.
Corresponding BMDL values of ECd/Ecr in women were 0.76 (1.53), 0.64 (1.34), 0.65 (1.37) μg/g creatinine for the RBP, β2M, and NAG endpoints.
Wang et al., 2016 [85]
β2M, TRβ2M and eGFR (or Ccr)
n = 112 (Cd-polluted area, n = 74, non-polluted area, n = 38)
Japan
BMDL values of ECd/Ecr in men were 1.8, 1.8, and 3.6 μg/g creatinine for the β2M endpoint and decreases in TRβ2M by 5% and 10%, respectively.
Corresponding BMDL values of ECd/Ecr in women were 2.5, 2.6, and 3.9 μg/g creatinine.
BMDL values of ECd/Ecr for the eGFR (Ccr) endpoint in men and women were 2.9 and 3.5 μg/g creatinine, respectively
Hayashi et al., 2024 [86]
NAG, β2M, and eGFR
n = 734 (Bangkok, n = 200,
Mae Sot, n = 534), 16–87 years,
Thailand
BMDL/BMDU values of ECd/Ecr in men were 0.060/0.504 µg/g creatinine for the NAG, while BMDL10/BMDU10 values were 0.469/0.973 and 3.26/7.46 µg/g creatinine for the β2-microglobulinuria and low eGFR a, respectively.
Corresponding BMDL/BMDU values of ECd/Ecr in women were 0.069/0.537 µg/g creatinine for NAG, while BMDL10/BMDU10 were 0.733/1.29 and 4.98/9.68 µg/g creatinine for the β2-microglobulinuria and low eGFR.
Satarug et al., 2022 [87]
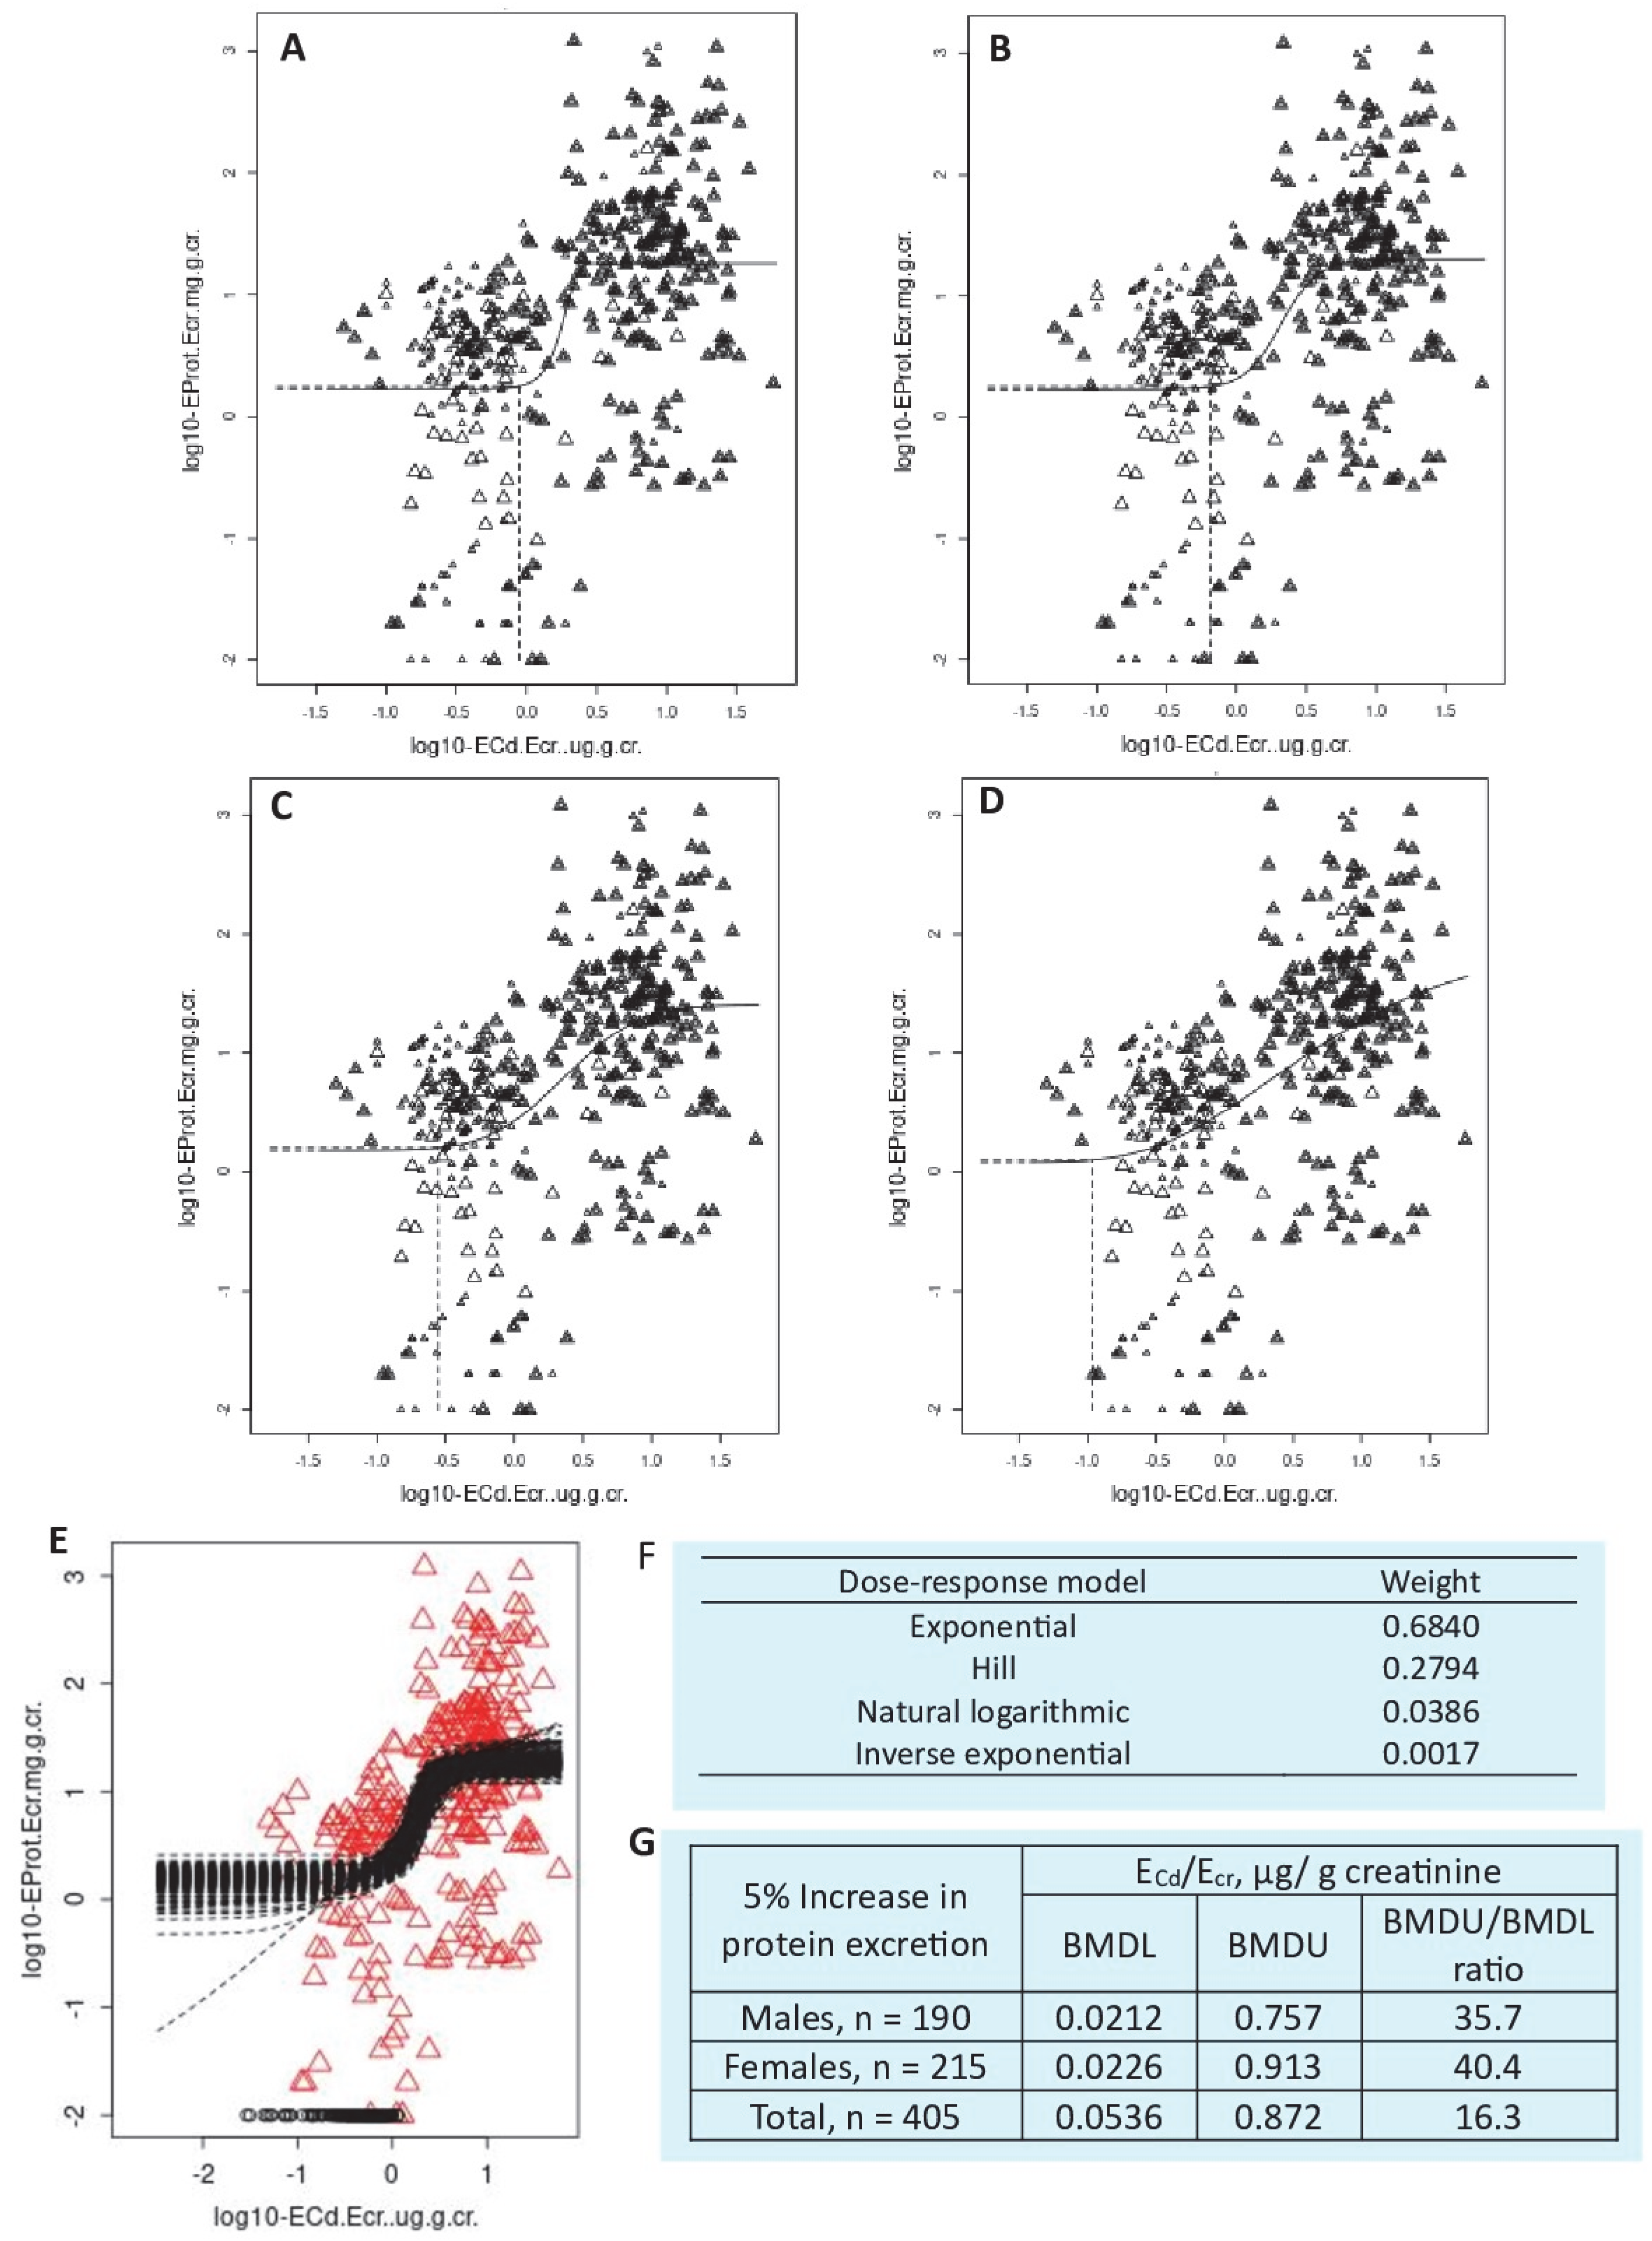
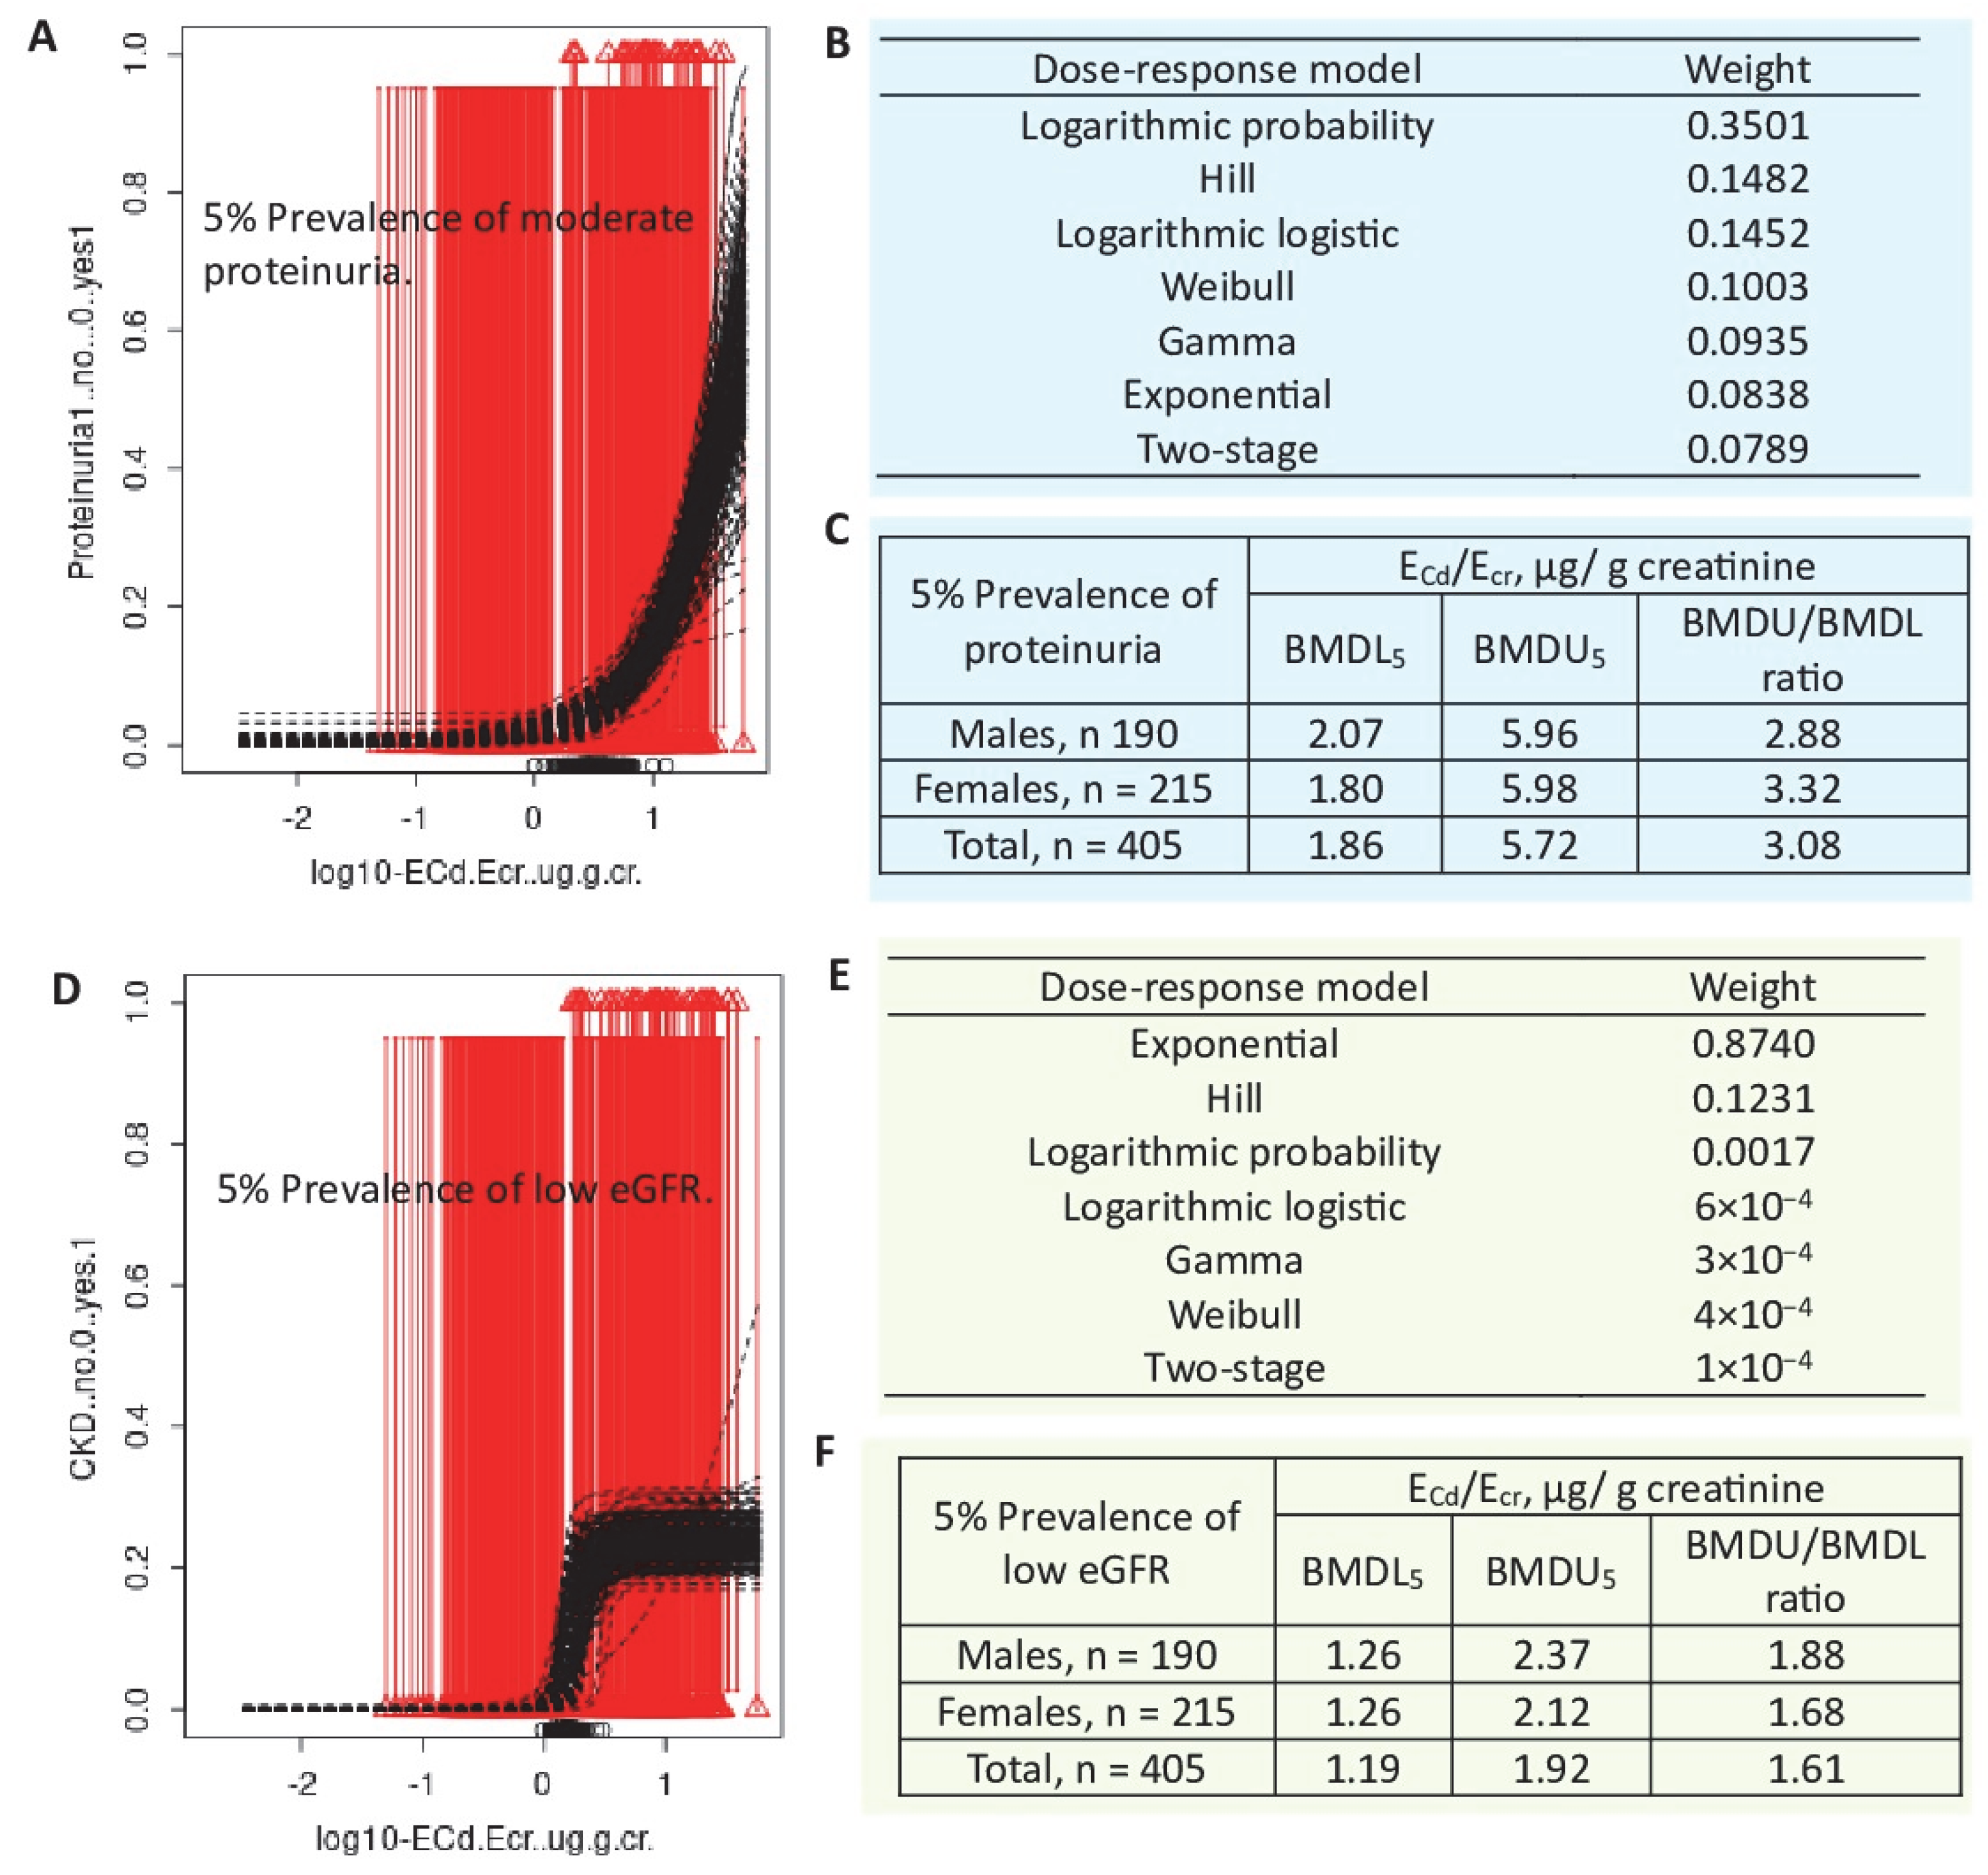
Protein excretion and low eGFR
n = 405 (Bangkok, n = 100,
Mae Sot, n = 215), 19–87 years,
Thailand
BMDL/BMDU values of ECd/Ecr for protein loss in men were 0.021/0.757 µg/g creatinine, while BMDL5/BMDU5 values for proteinuria were 2.07/5.96 µg/g creatinine.
Corresponding BMDL/BMDU values of ECd/Ecr in women were 0.023/0.913 µg/g creatinine, while BMDL5/BMDU5 values for proteinuria were 1.80/5.98 µg/g creatinine.
In a whole group, BMDL/BMDU values of ECd/Ecr for protein loss were 0.054/0.872 µg/g creatinine, while BMDL5/BMDU5 values were 1.86/5.72 and 1.19/1.92 µg/g creatinine for proteinuria and low eGFR, respectively.
Satarug et al., 2024 [80]
NAG, N-acetyl-β-D-glucosaminidase; eGFR, estimated glomerular filtration rate; RBP, retinal binding protein; β2M, β2-microglobulin; TRβ2M, tubular reabsorption of β2M. a Low eGFR was defined as eGFR ≤60 mL/min/1.73 m2, a diagnostic criterion for chronic kidney disease.
Table 6. BMDL5 and BMDL10 of ECd/Ecr versus ECd/Ccr from albuminuria and CKD prevalence.
Prevalence of
Adverse Outcome
ECd/Ecr, µg/g Creatinine(ECd/Ccr) × 100, µg/L Filtrate
5% Albuminuria aBMDL5BMDU5BMDU5/BMDL5BMDL5BMDU5BMDU5/BMDL5
Males3.06 × 10−336.71.2 × 1020.1631380
Females1.22 × 10−23.05 × 1052.5 × 1070.71815460
10% AlbuminuriaBMDL10BMDU10BMDU10/BMDL10BMDL10BMDU10BMDU10/BMDL10
Males0.553376121.652012
Females2.521.74 × 1066.7 × 1053.552.1260
5% CKD bBMDL5BMDU5BMDU5/BMDL5BMDL5BMDU5BMDU5/BMDL5
Males1.4710.67.73.229.642.90
Females1.9315.68.083.339.202.26
10% CKDBMDL10BMDU10BMDU10/BMDL10BMDL10BMDU10BMDU10/BMDL10
Males3.9215.74.005.6113.42.39
Females5.3123.64.445.8812.92.19
a Albuminuria was defined as urinary albumin-to-creatinine ratios ≥20 mg/g in men and ≥30 mg/g in women for Ecr-normalized data, while it was defined as (EAlb/Ccr) × 100 ≥ 20 mg/L filtrate in men and ≥30 mg/L filtrate in women for Ccr-normalized data. b CKD was defined as eGFR ≤ 60 mL/min/1.73 m2. Data were from 603 subjects (203 males, 400 females) [92].
Disclaimer/Publisher’s Note: The statements, opinions and data contained in all publications are solely those of the individual author(s) and contributor(s) and not of MDPI and/or the editor(s). MDPI and/or the editor(s) disclaim responsibility for any injury to people or property resulting from any ideas, methods, instructions or products referred to in the content.

