Wearable Emotion Recognition Using Heart Rate Data from a Smart Bracelet


Abstract
1. Introduction
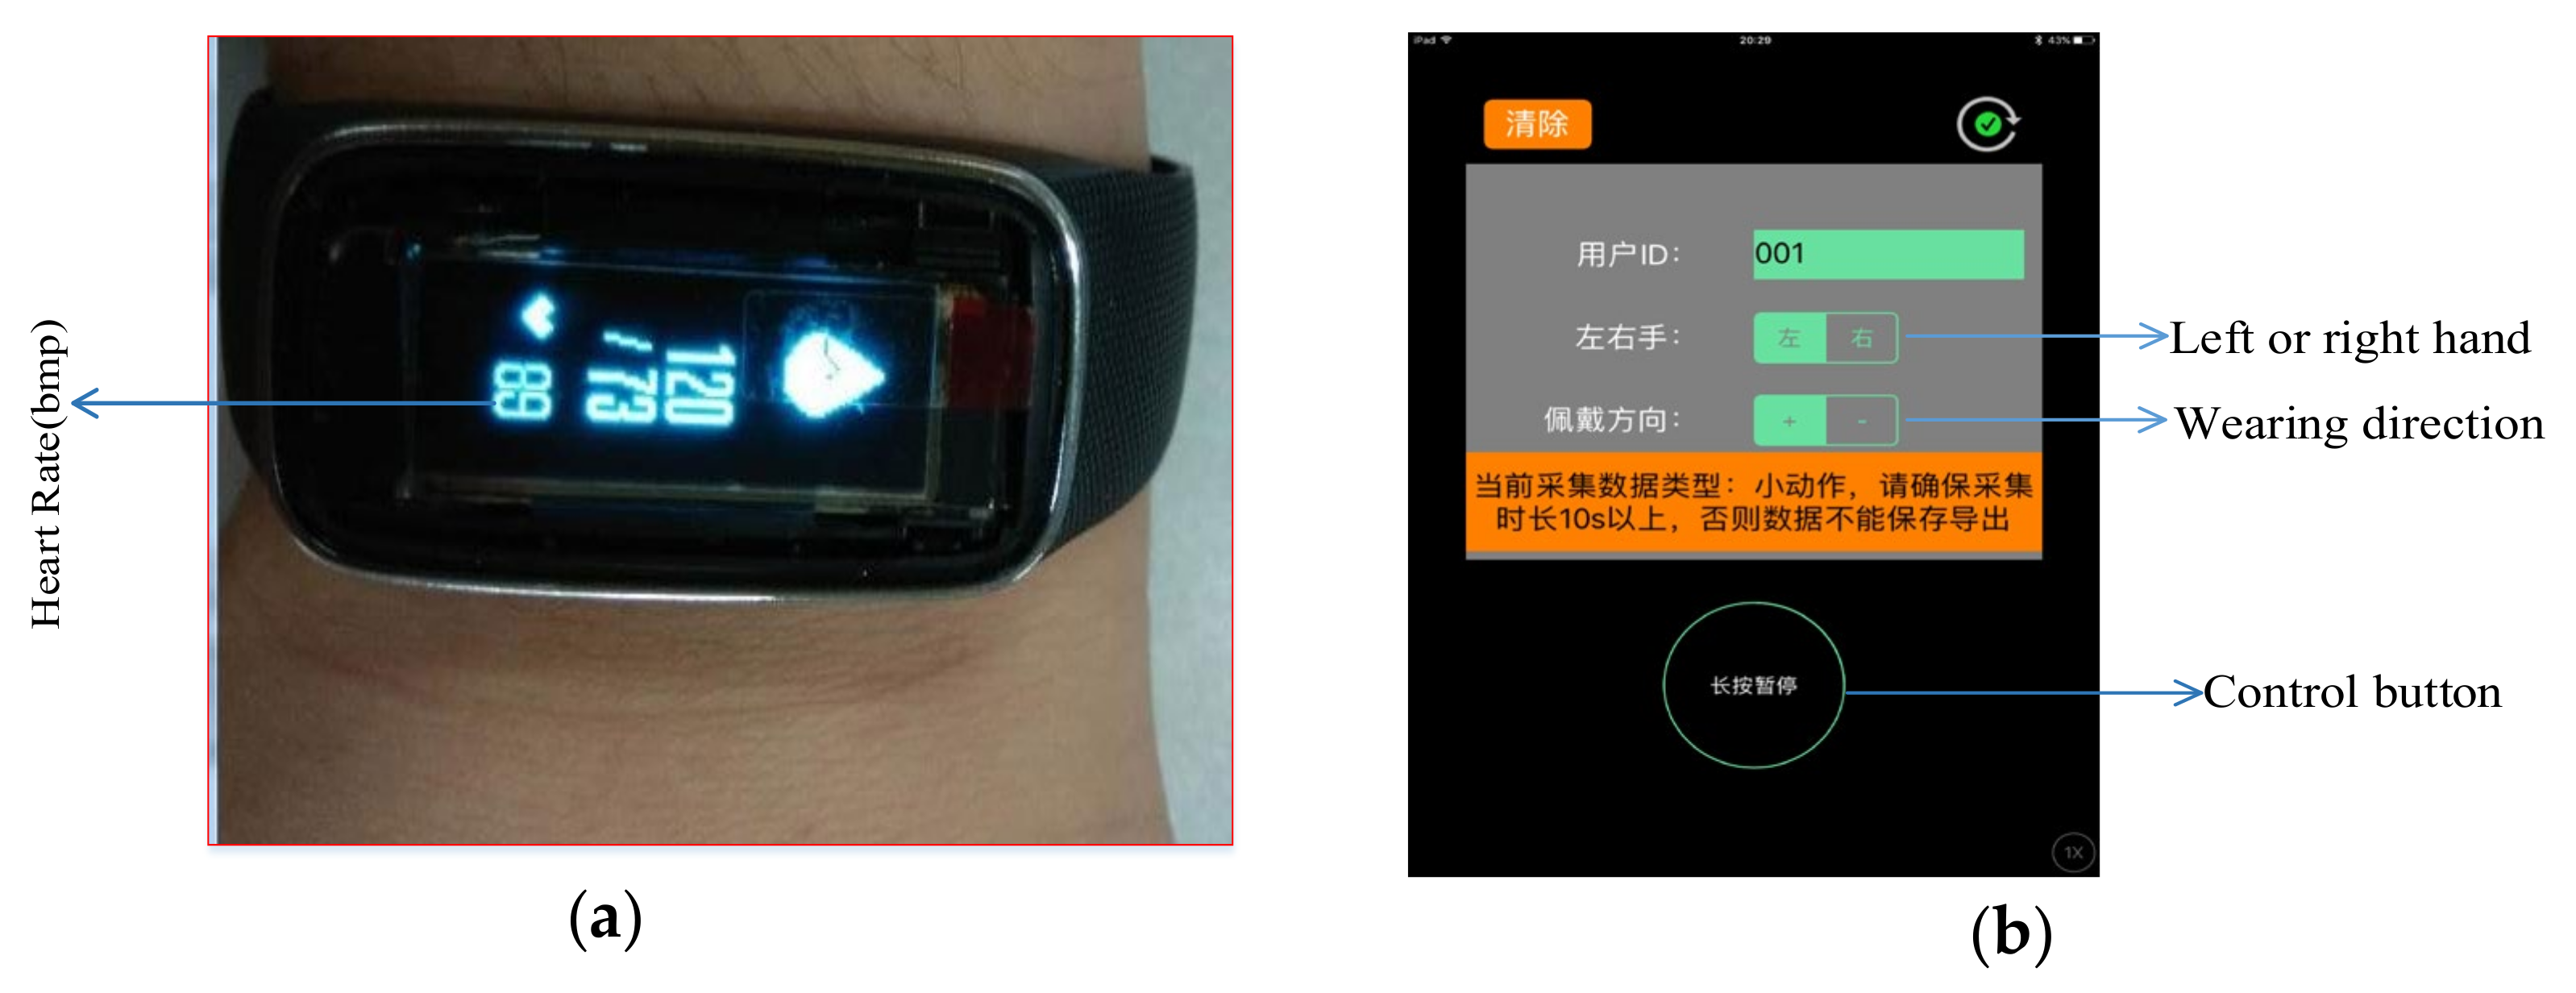
2. Experiment
2.1. Subject Information
2.2. Stimulation Materials
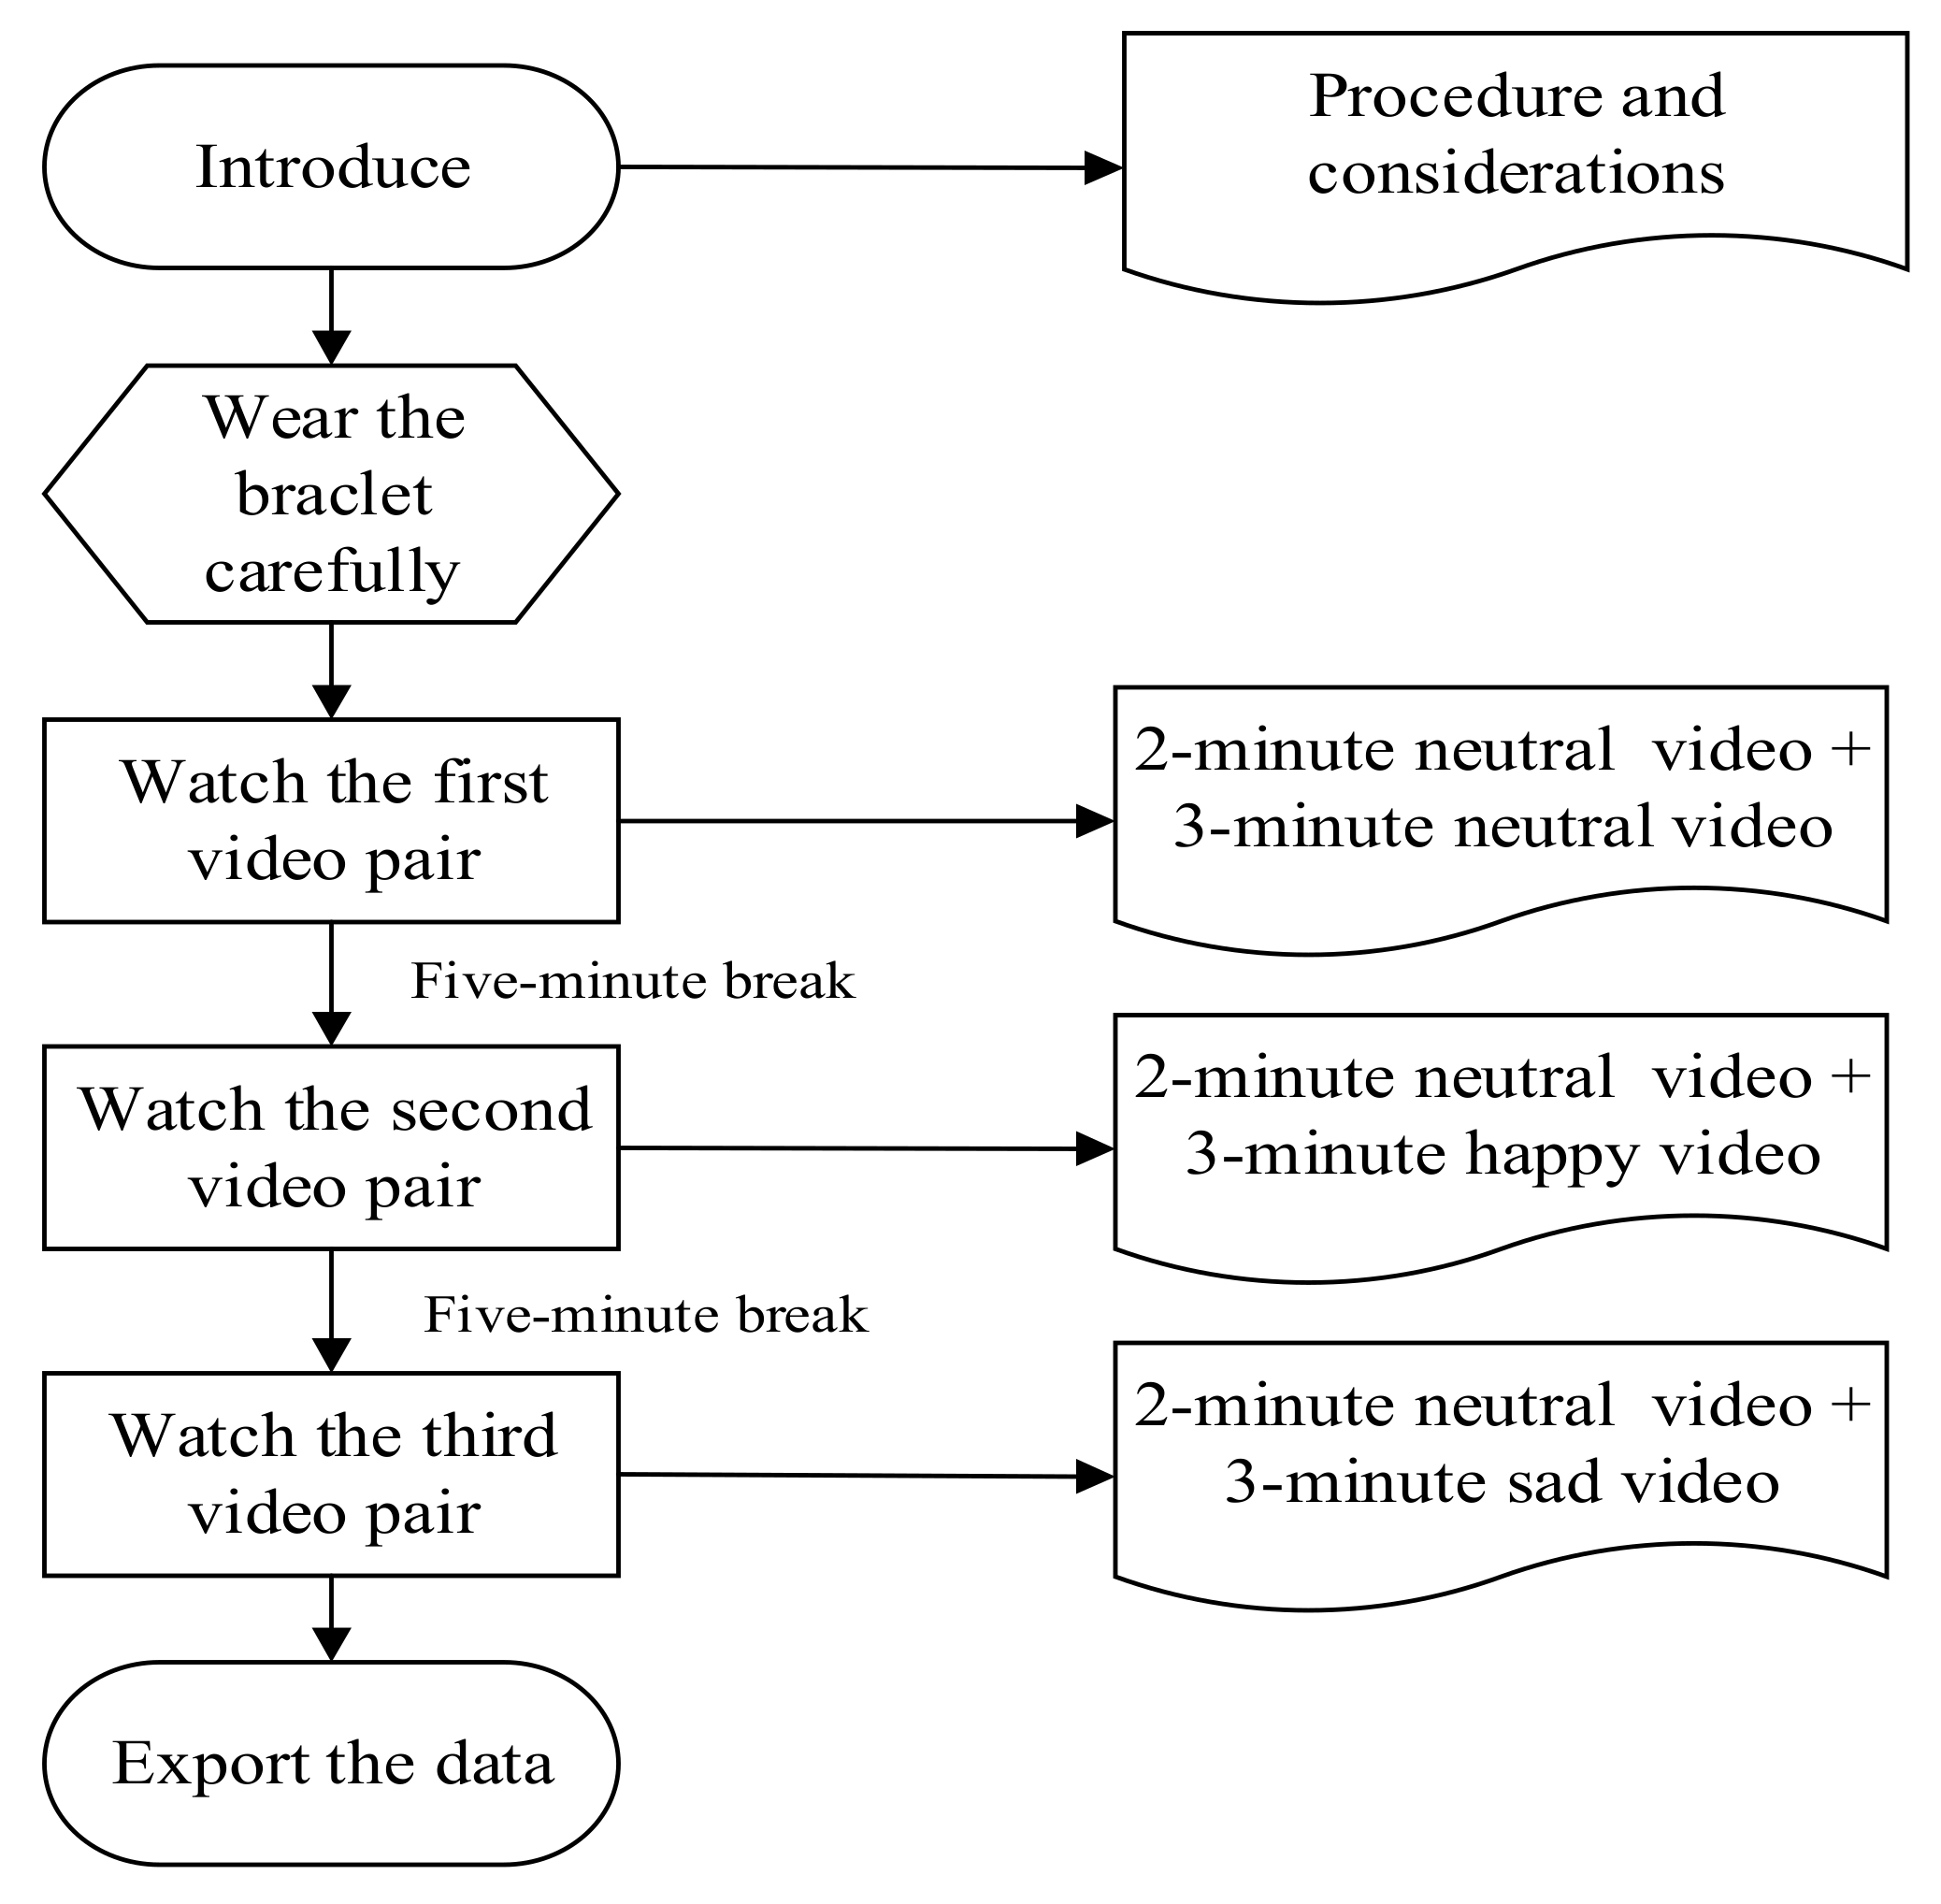
2.3. Experiment Process
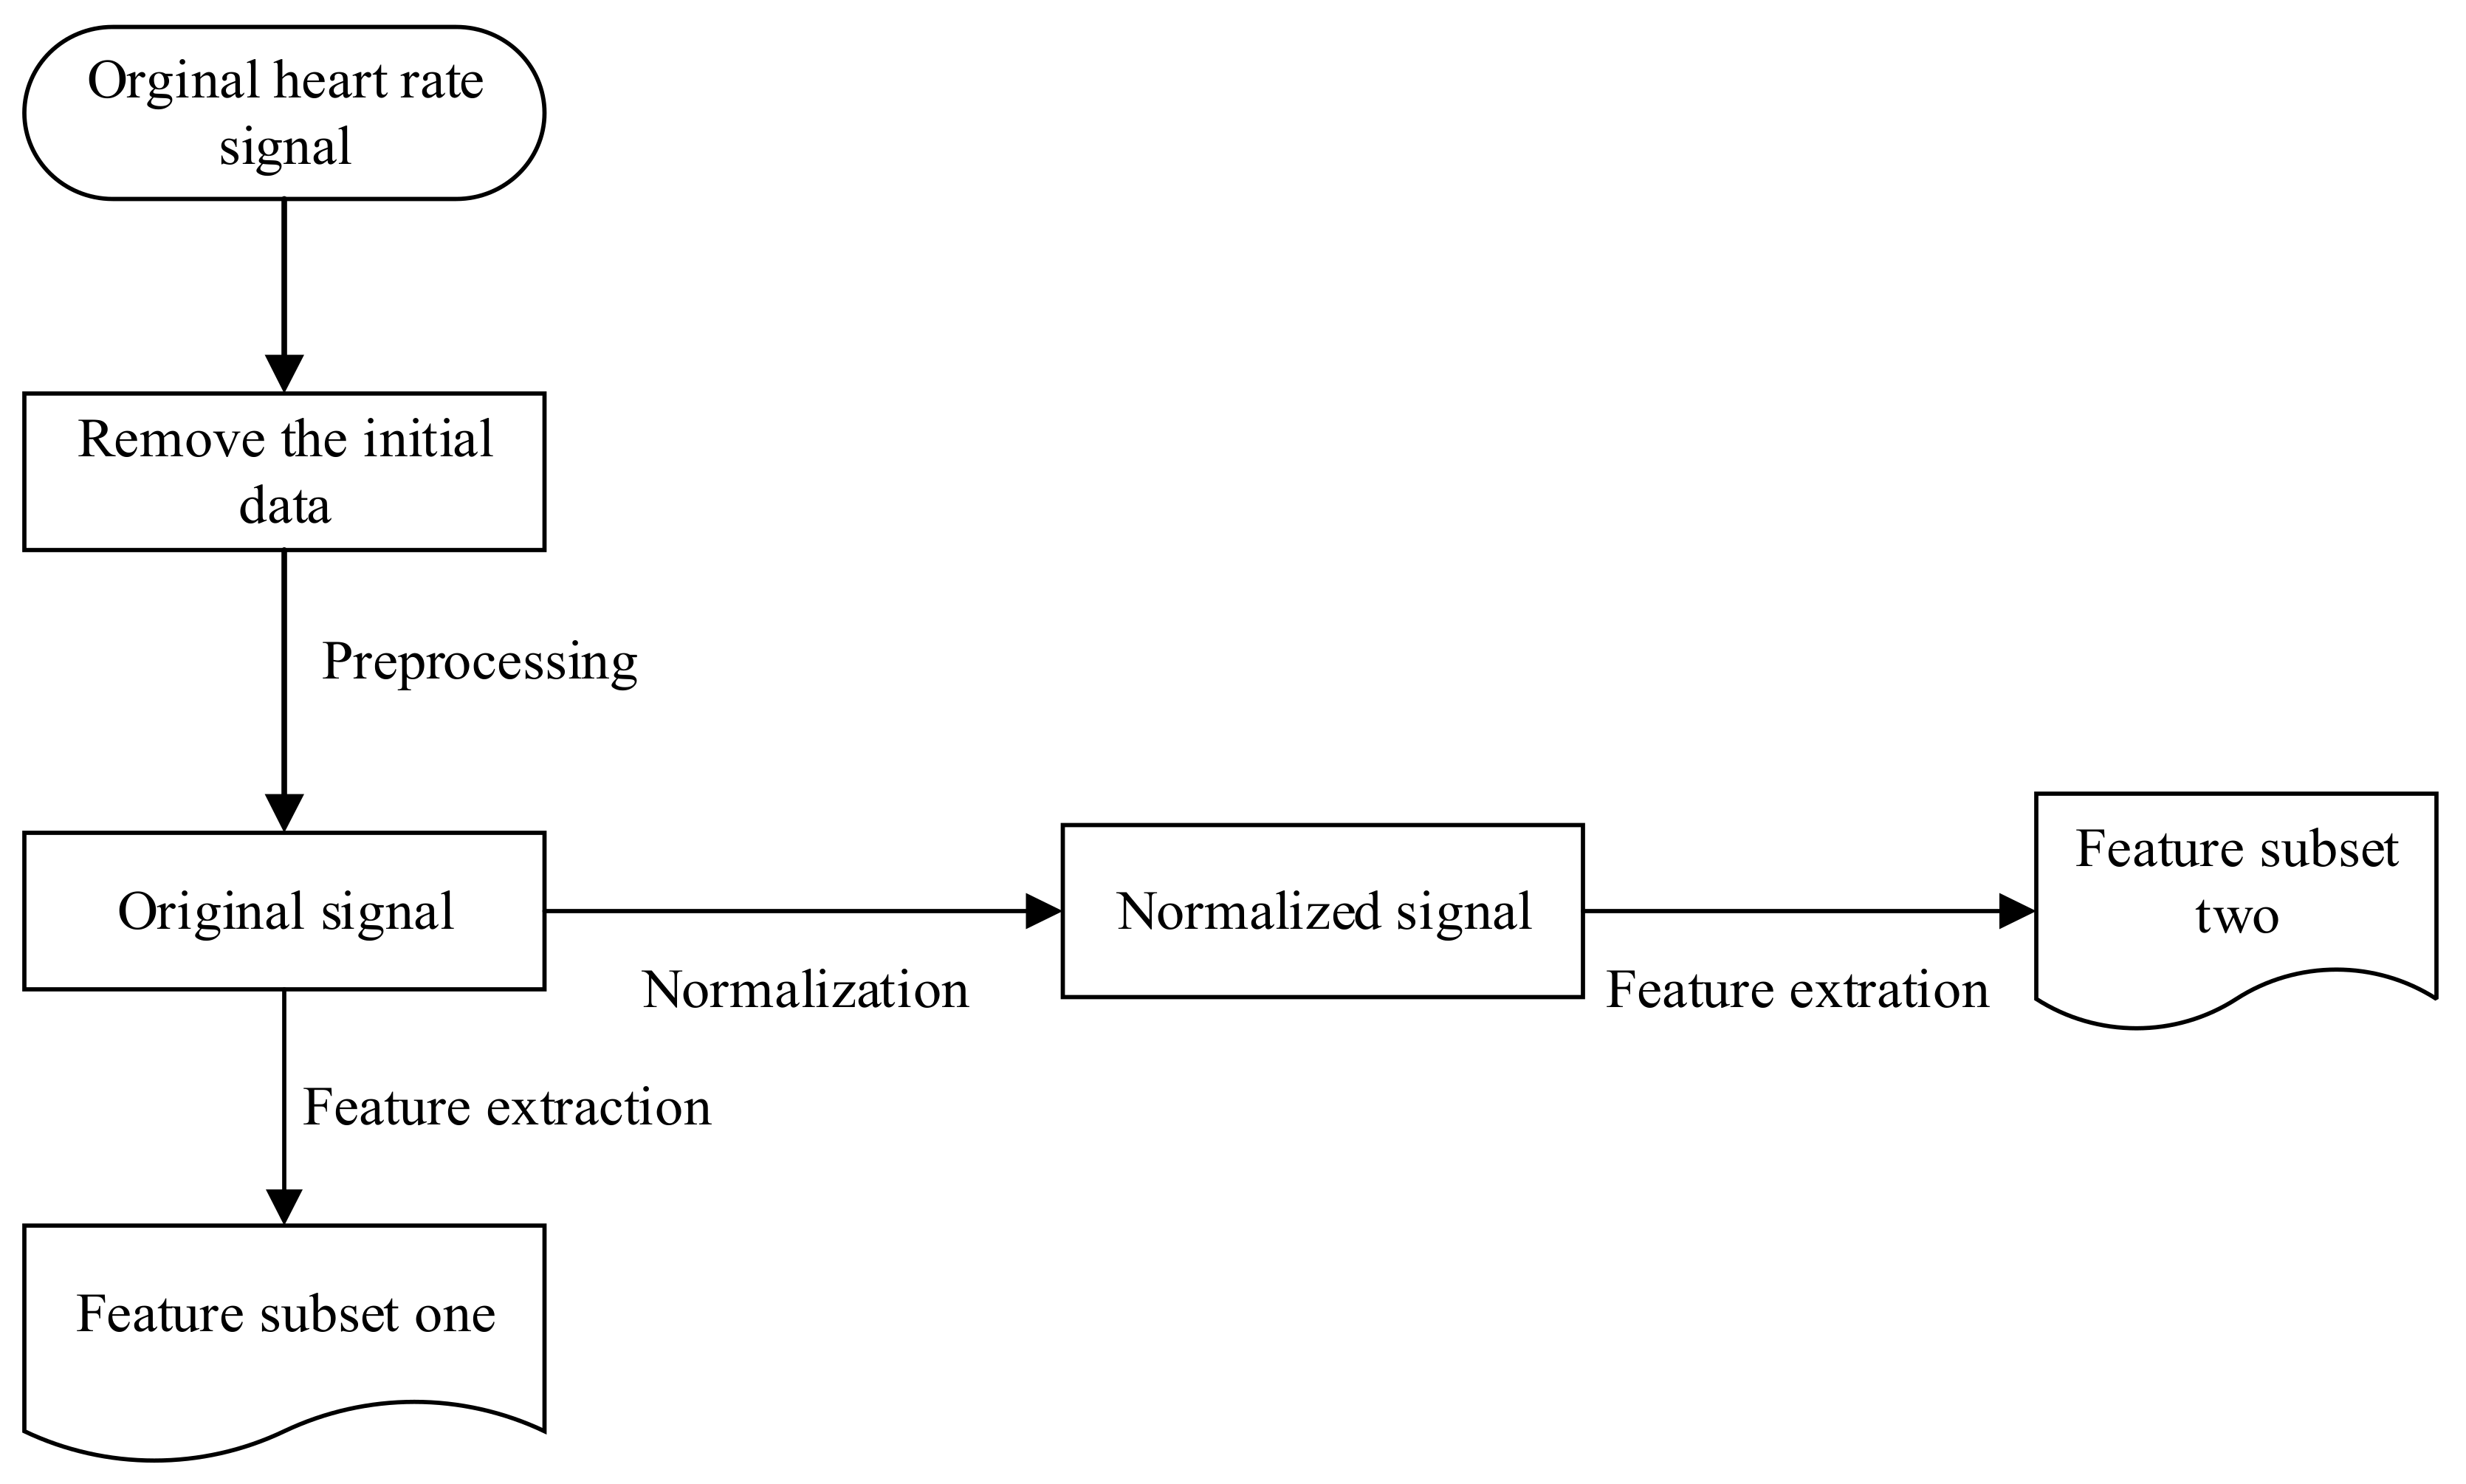
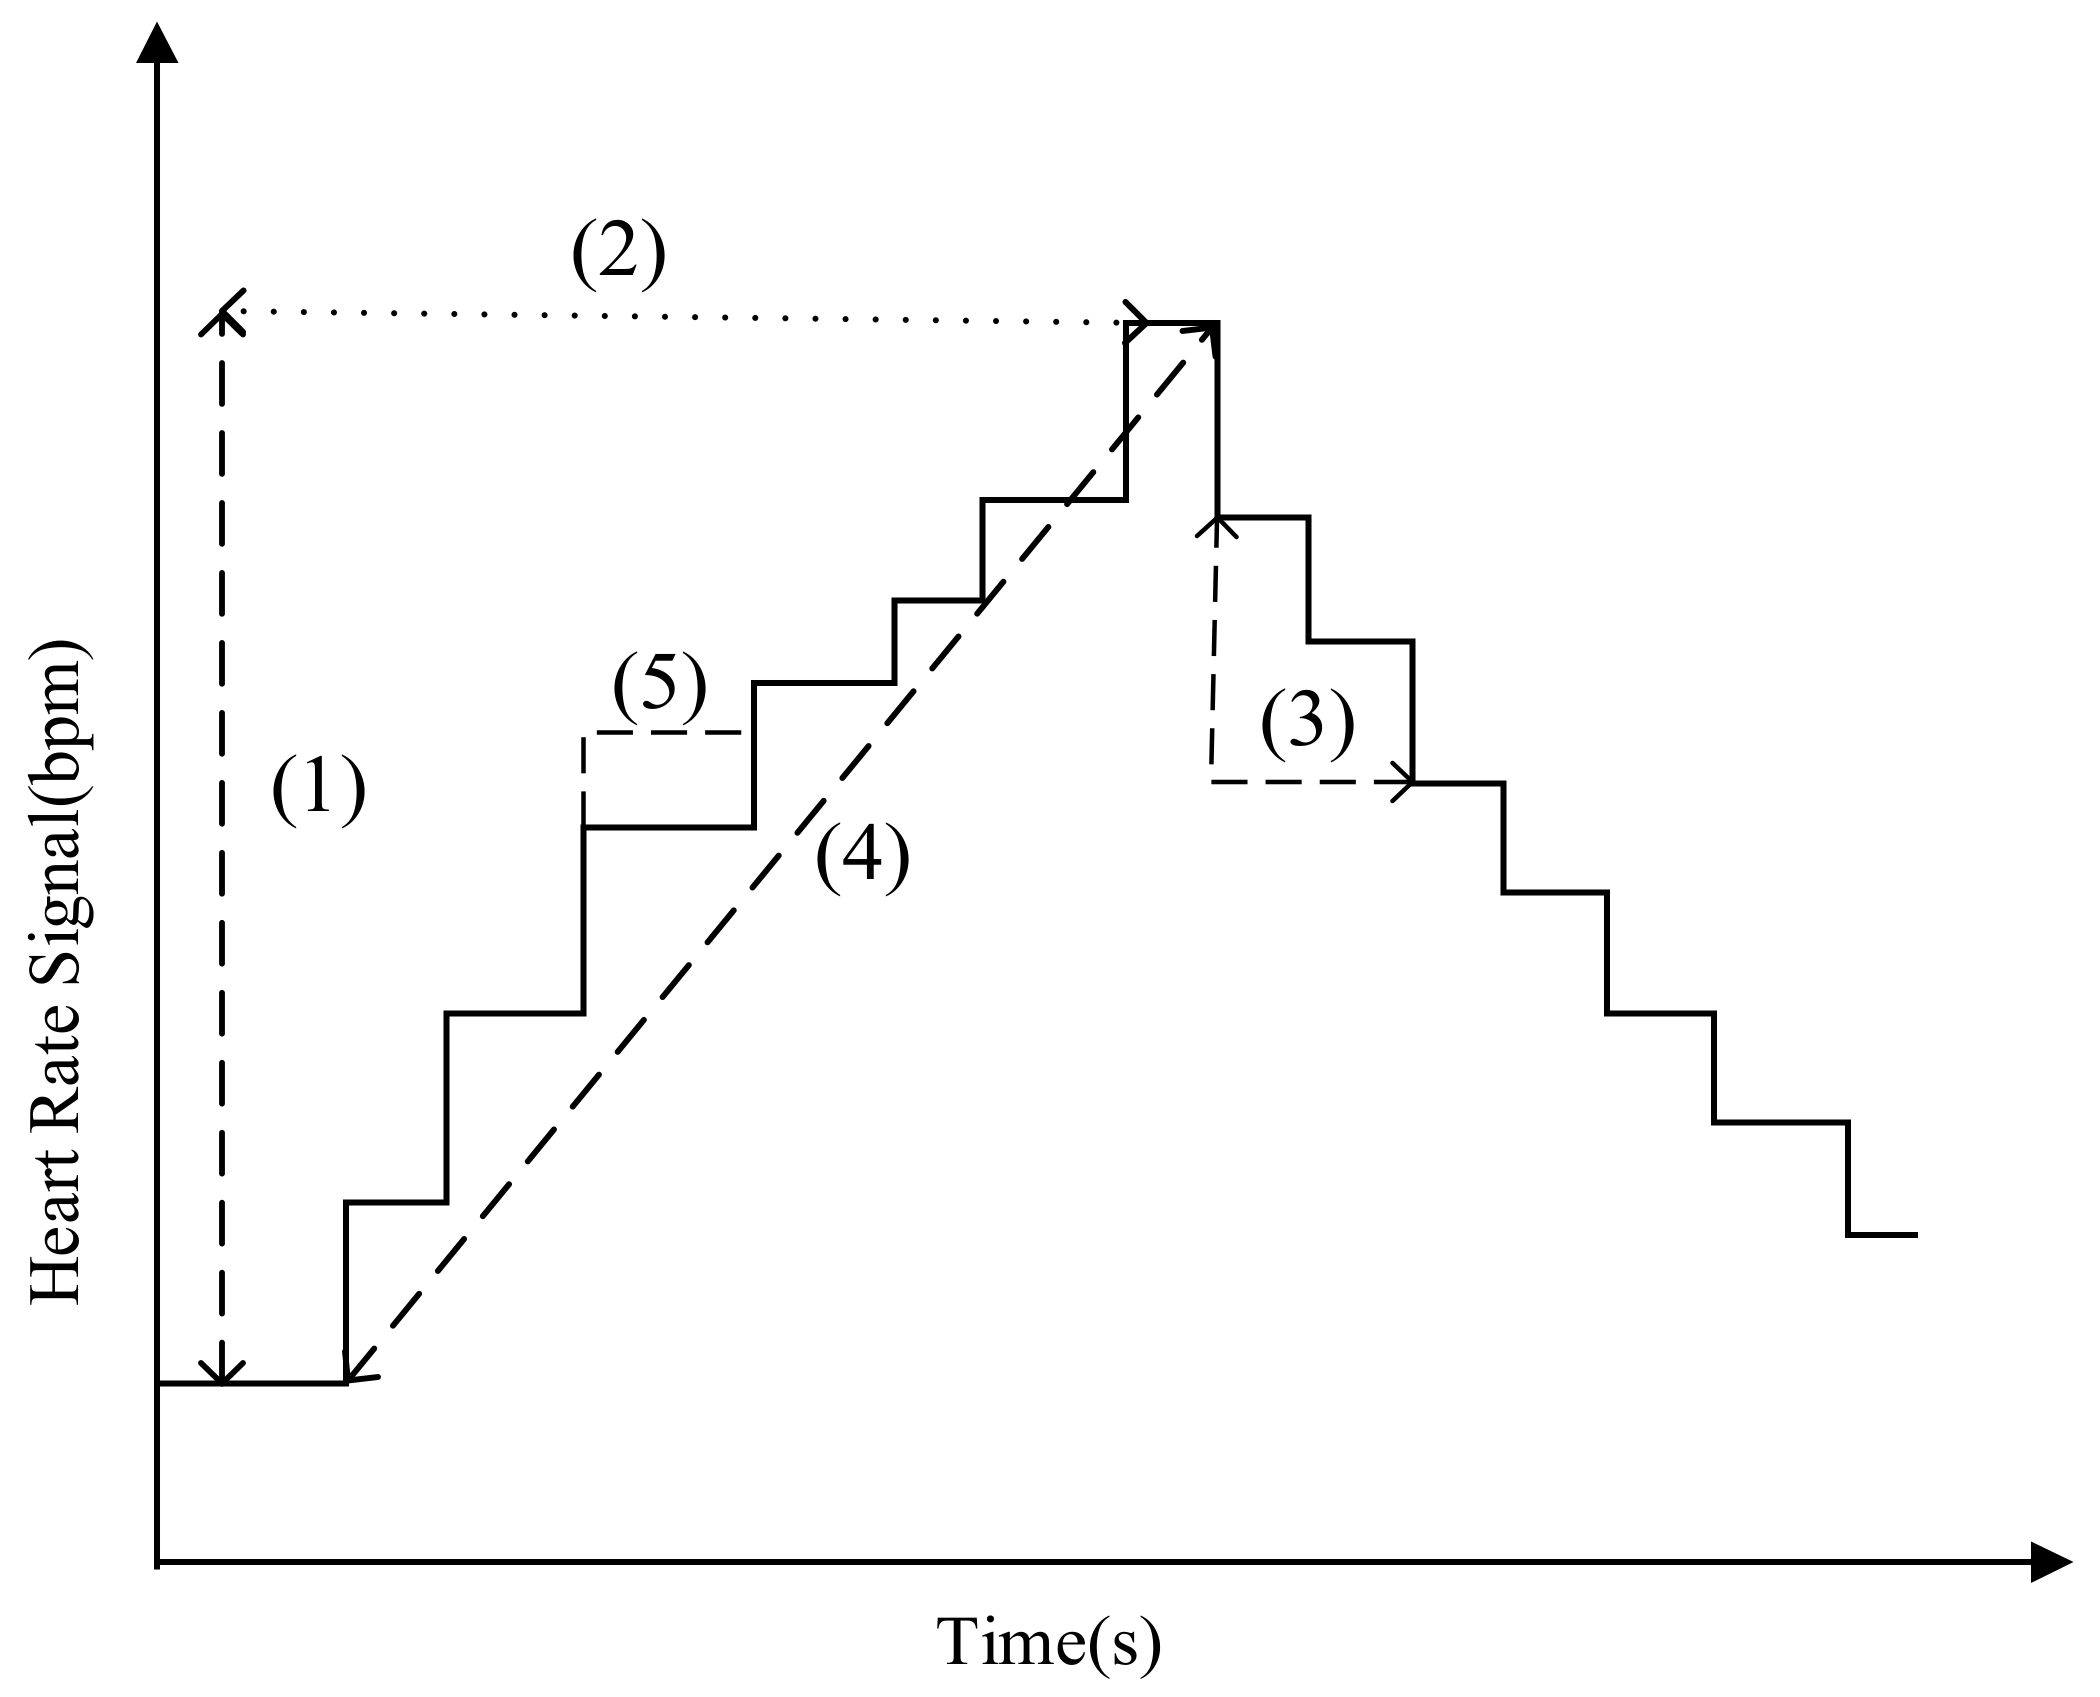
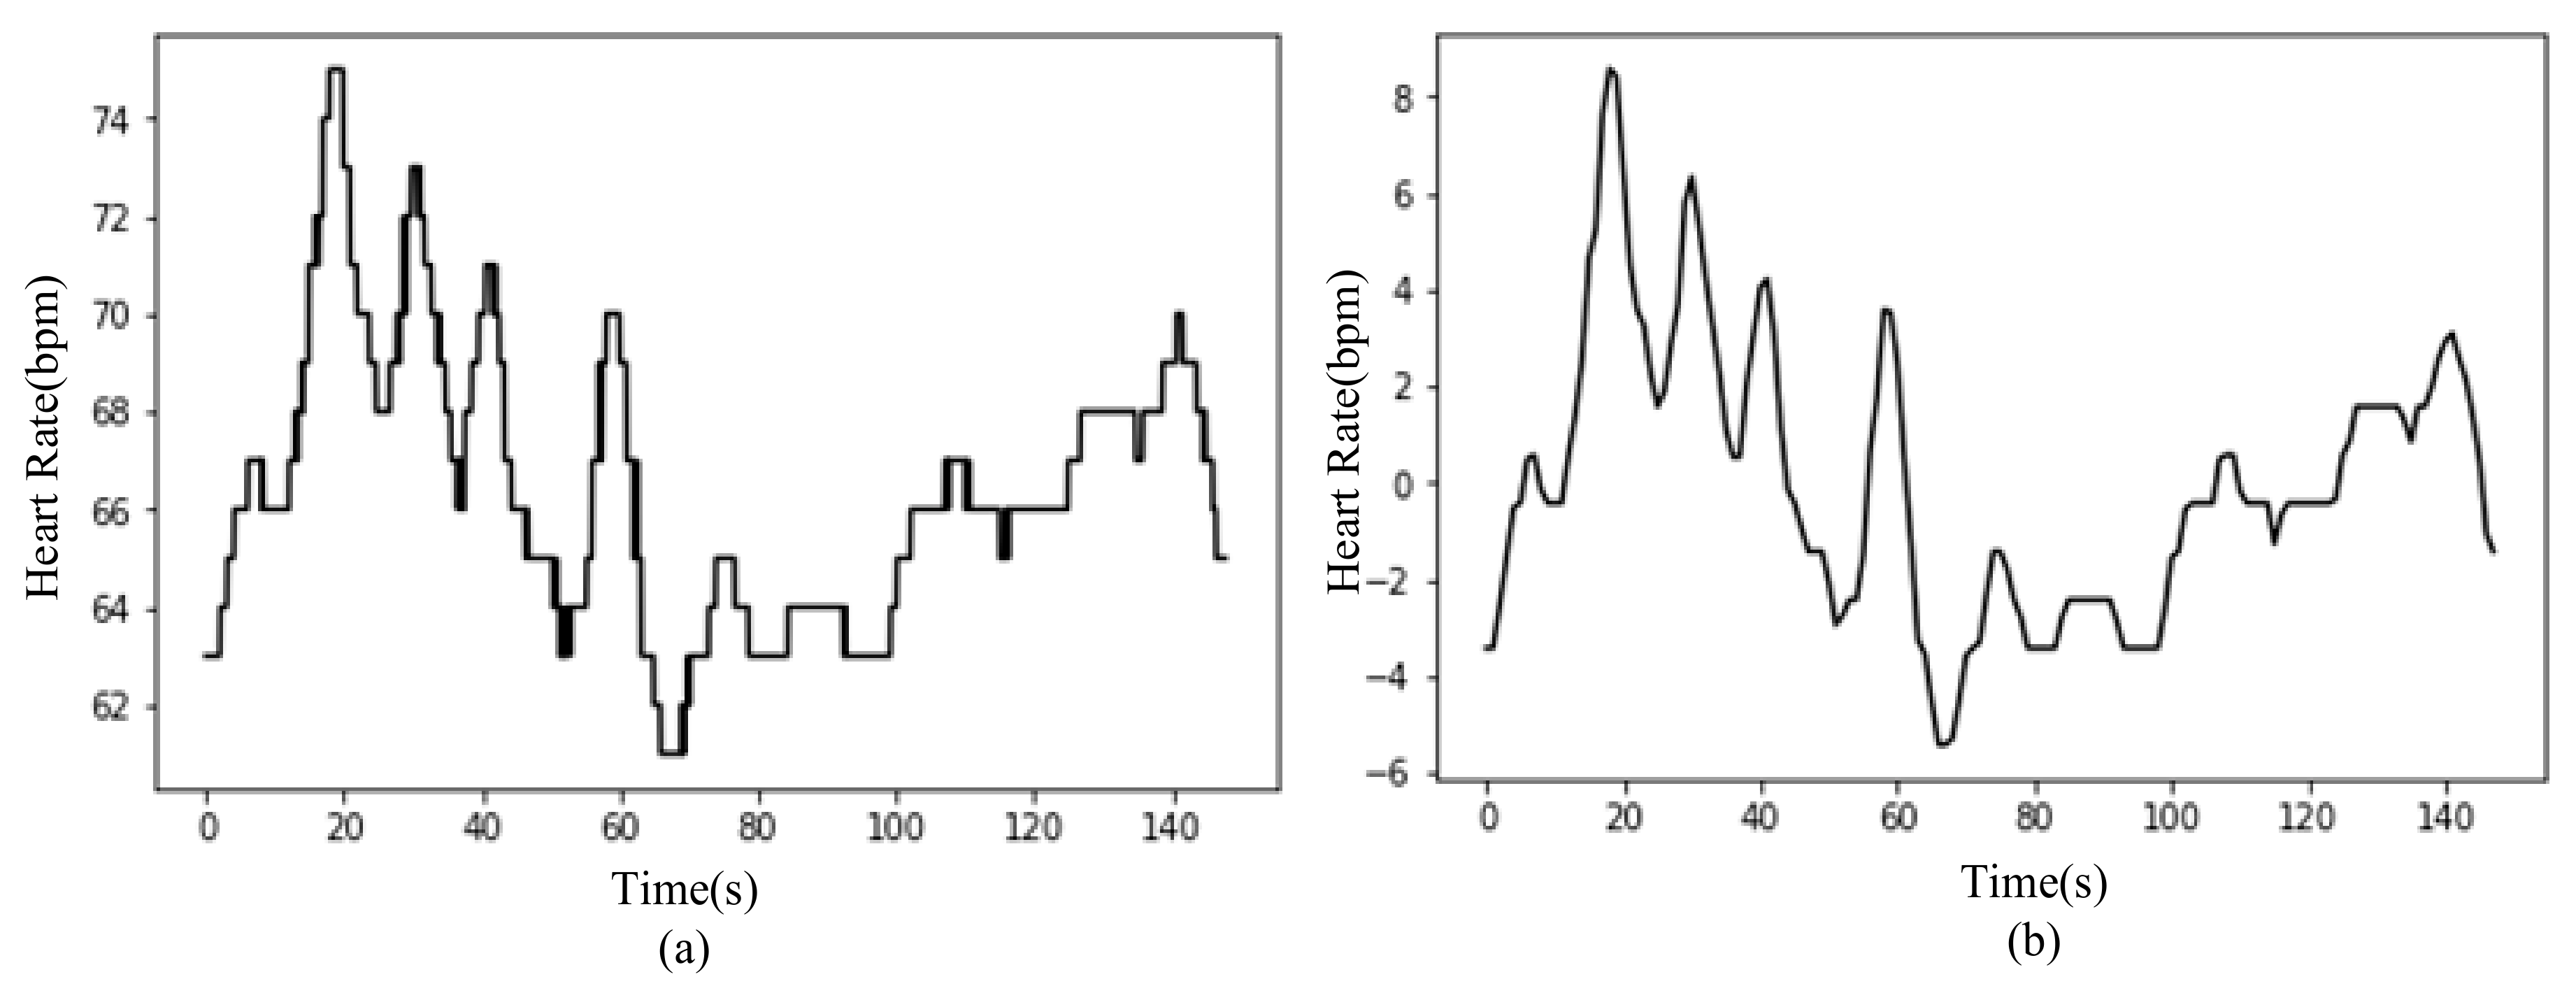
3. Data Processing
Heart Rate Signal Pre-processing
4. Feature Extraction
4.1. Features of the Original Signal
4.2. Features of the Normalized Signal
5. Selection of Features
6. Model Training
7. Results
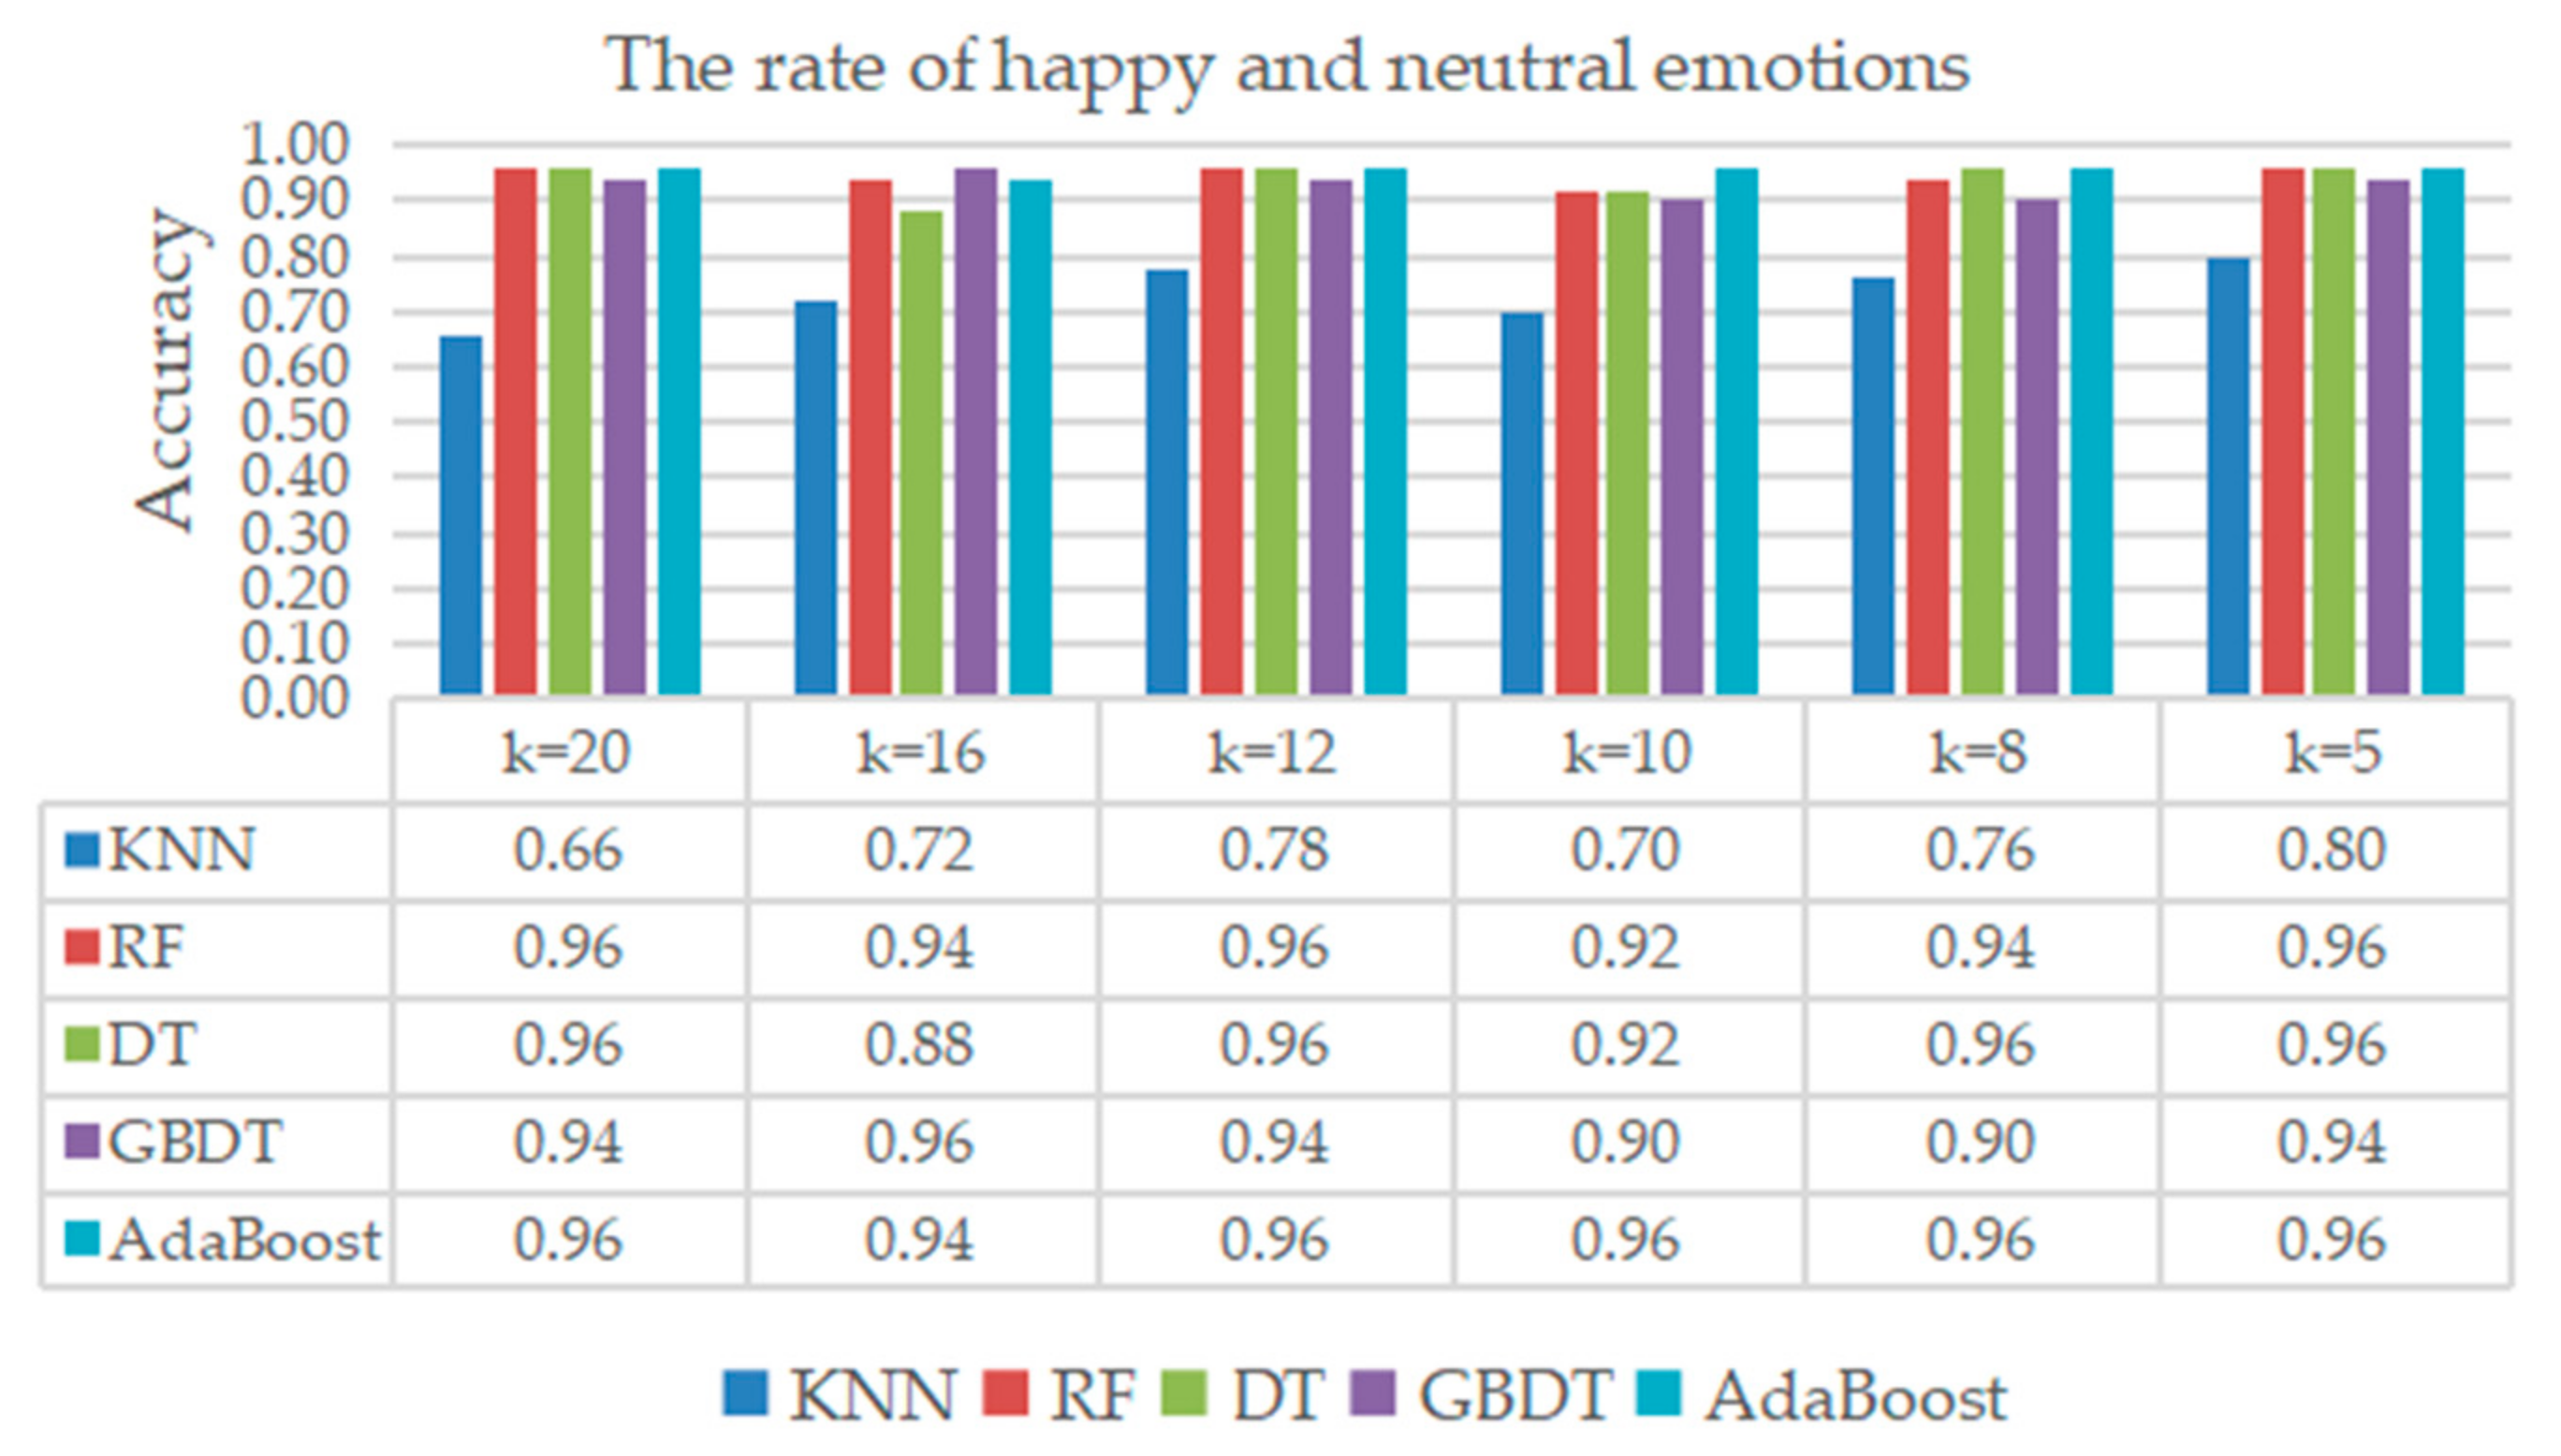
7.1. Categories of Neutral and Happy Emotions
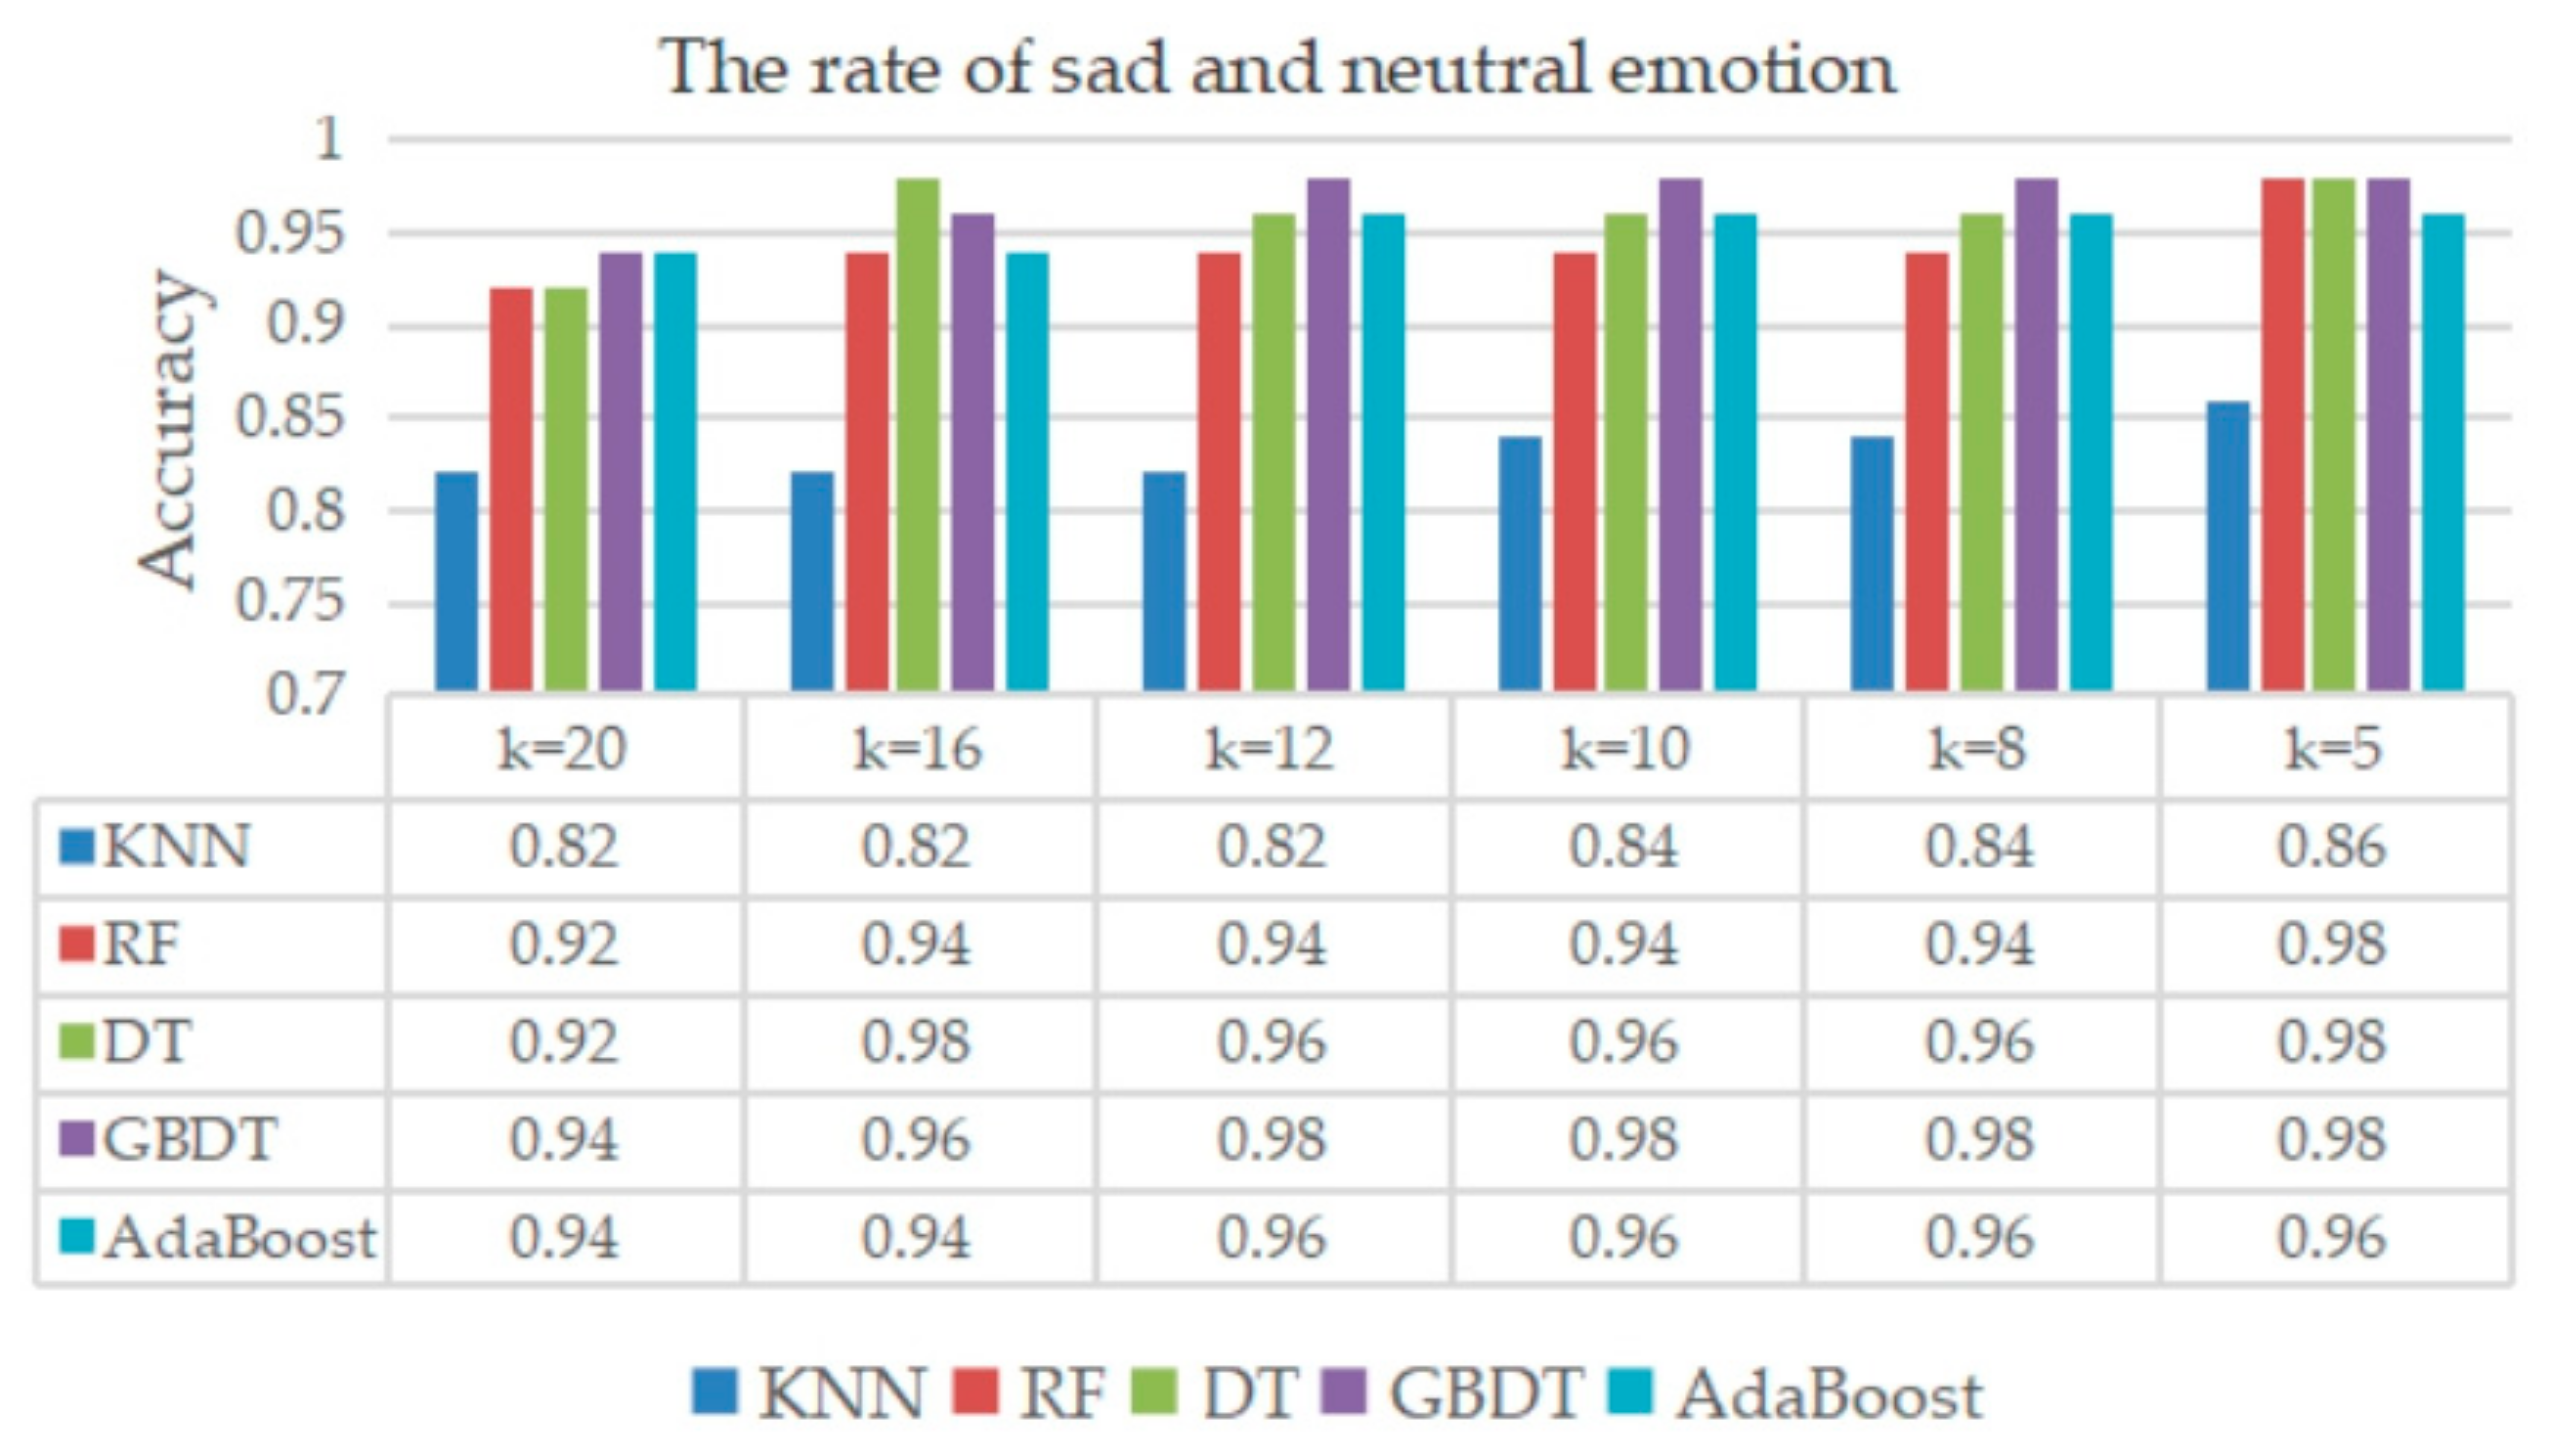
7.2. Categories of Neutral and Sad Emotions
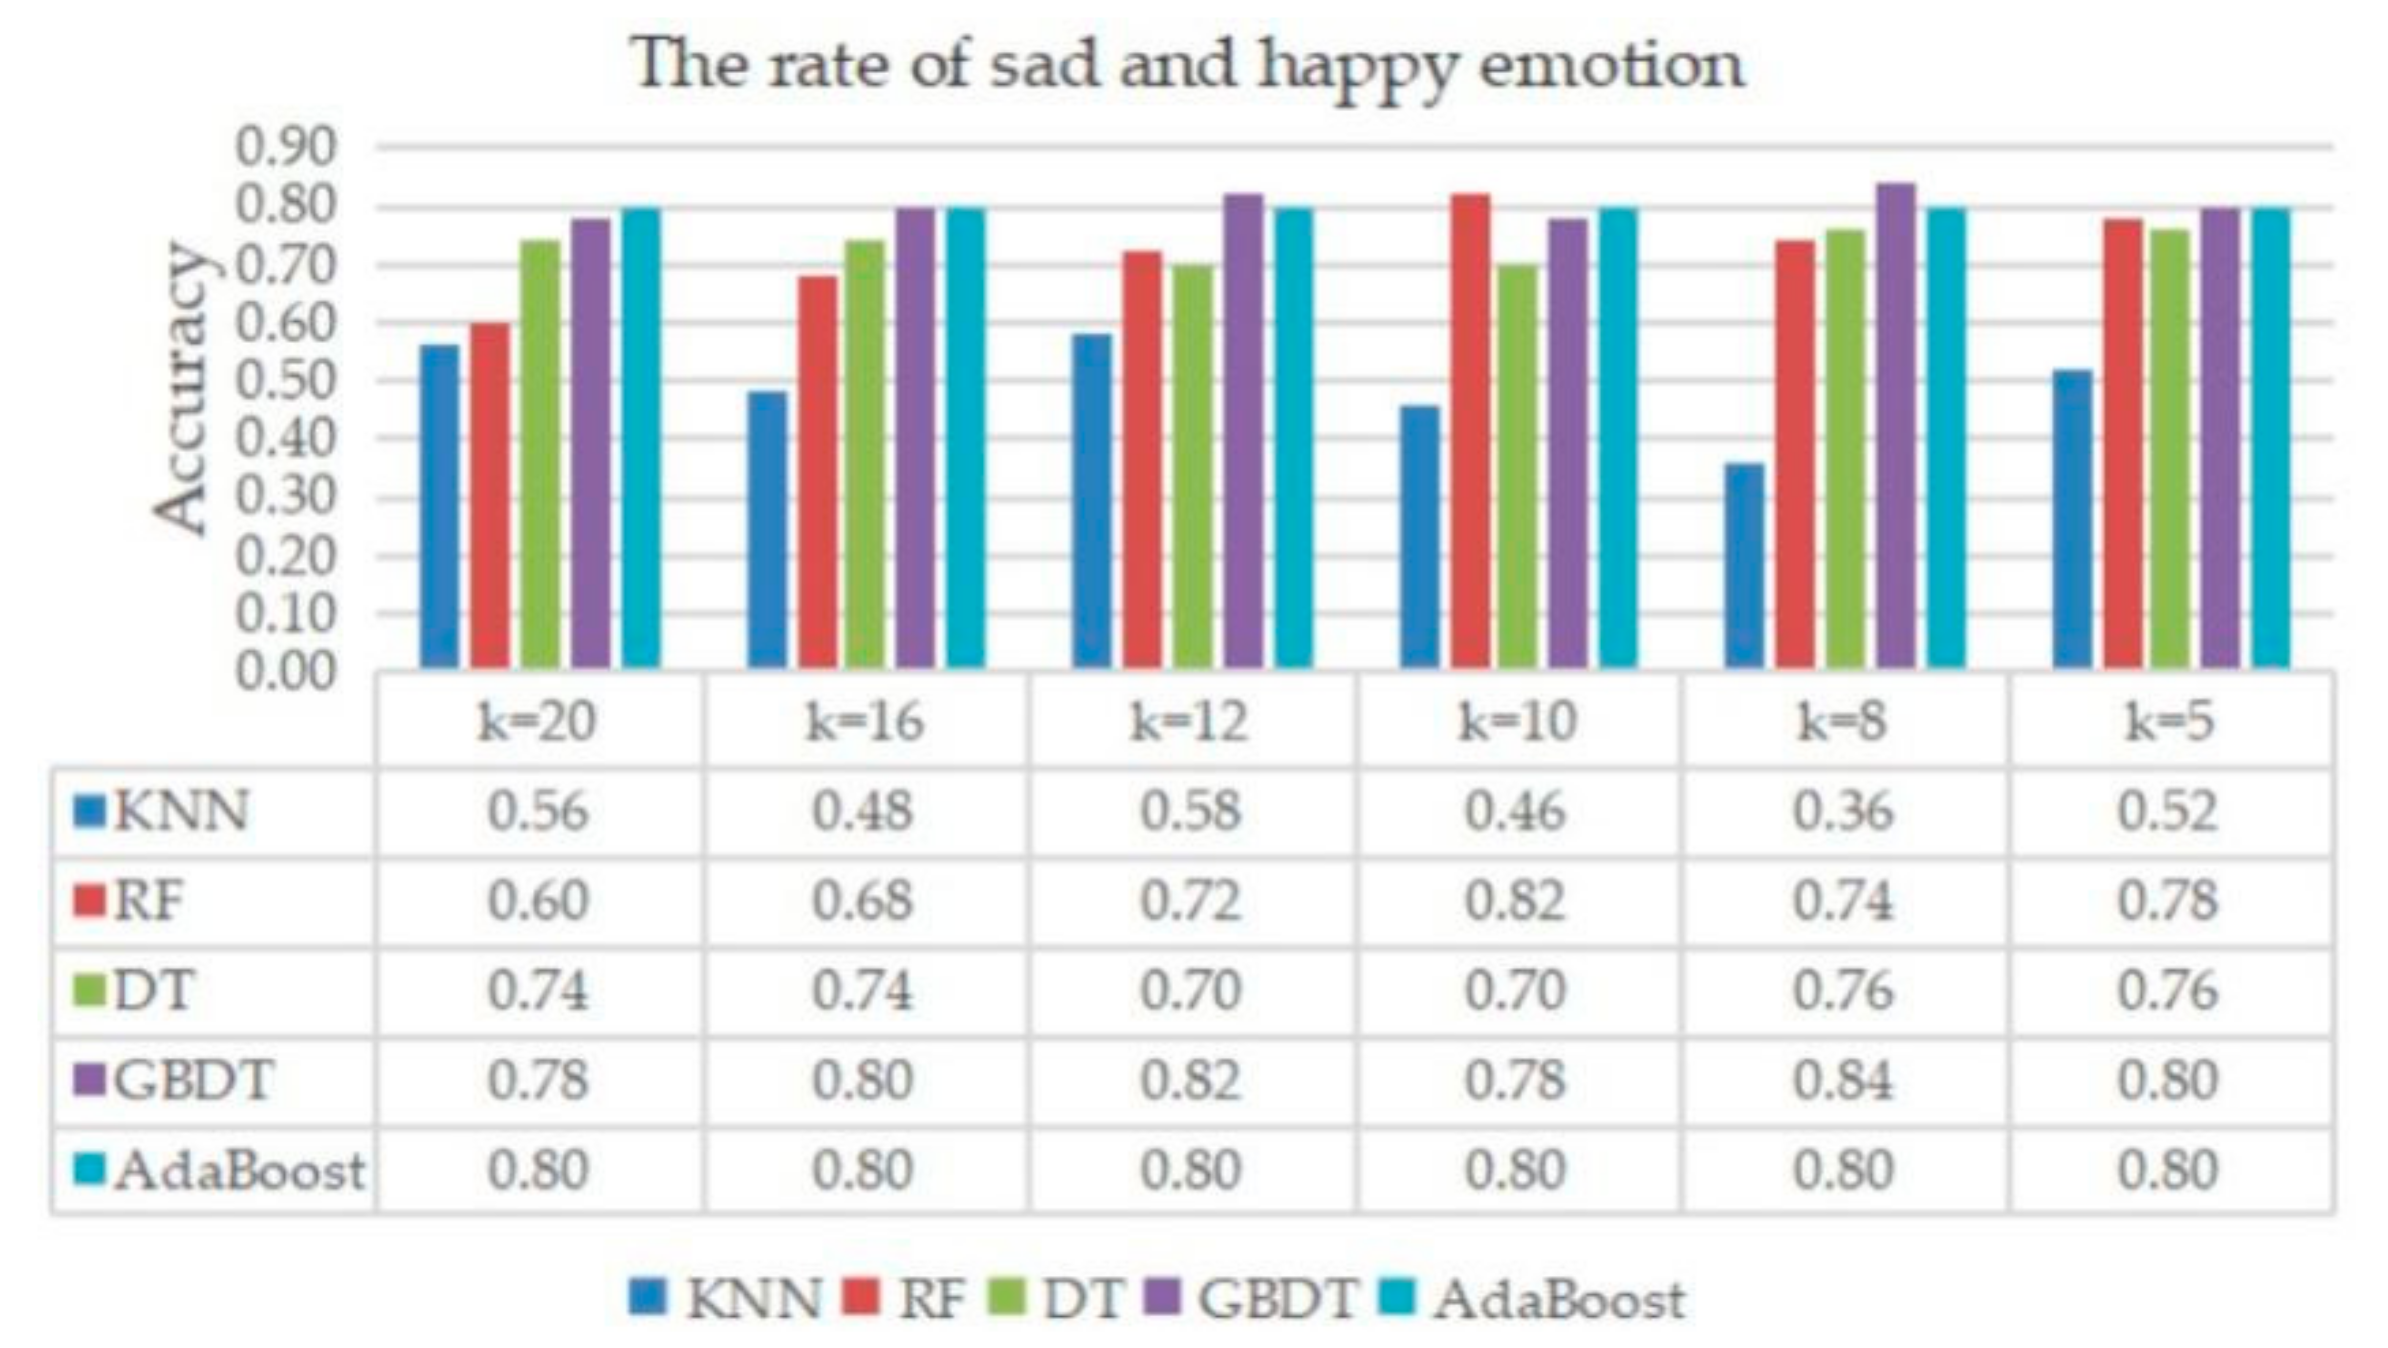
7.3. Categories of Happy and Sad Emotions
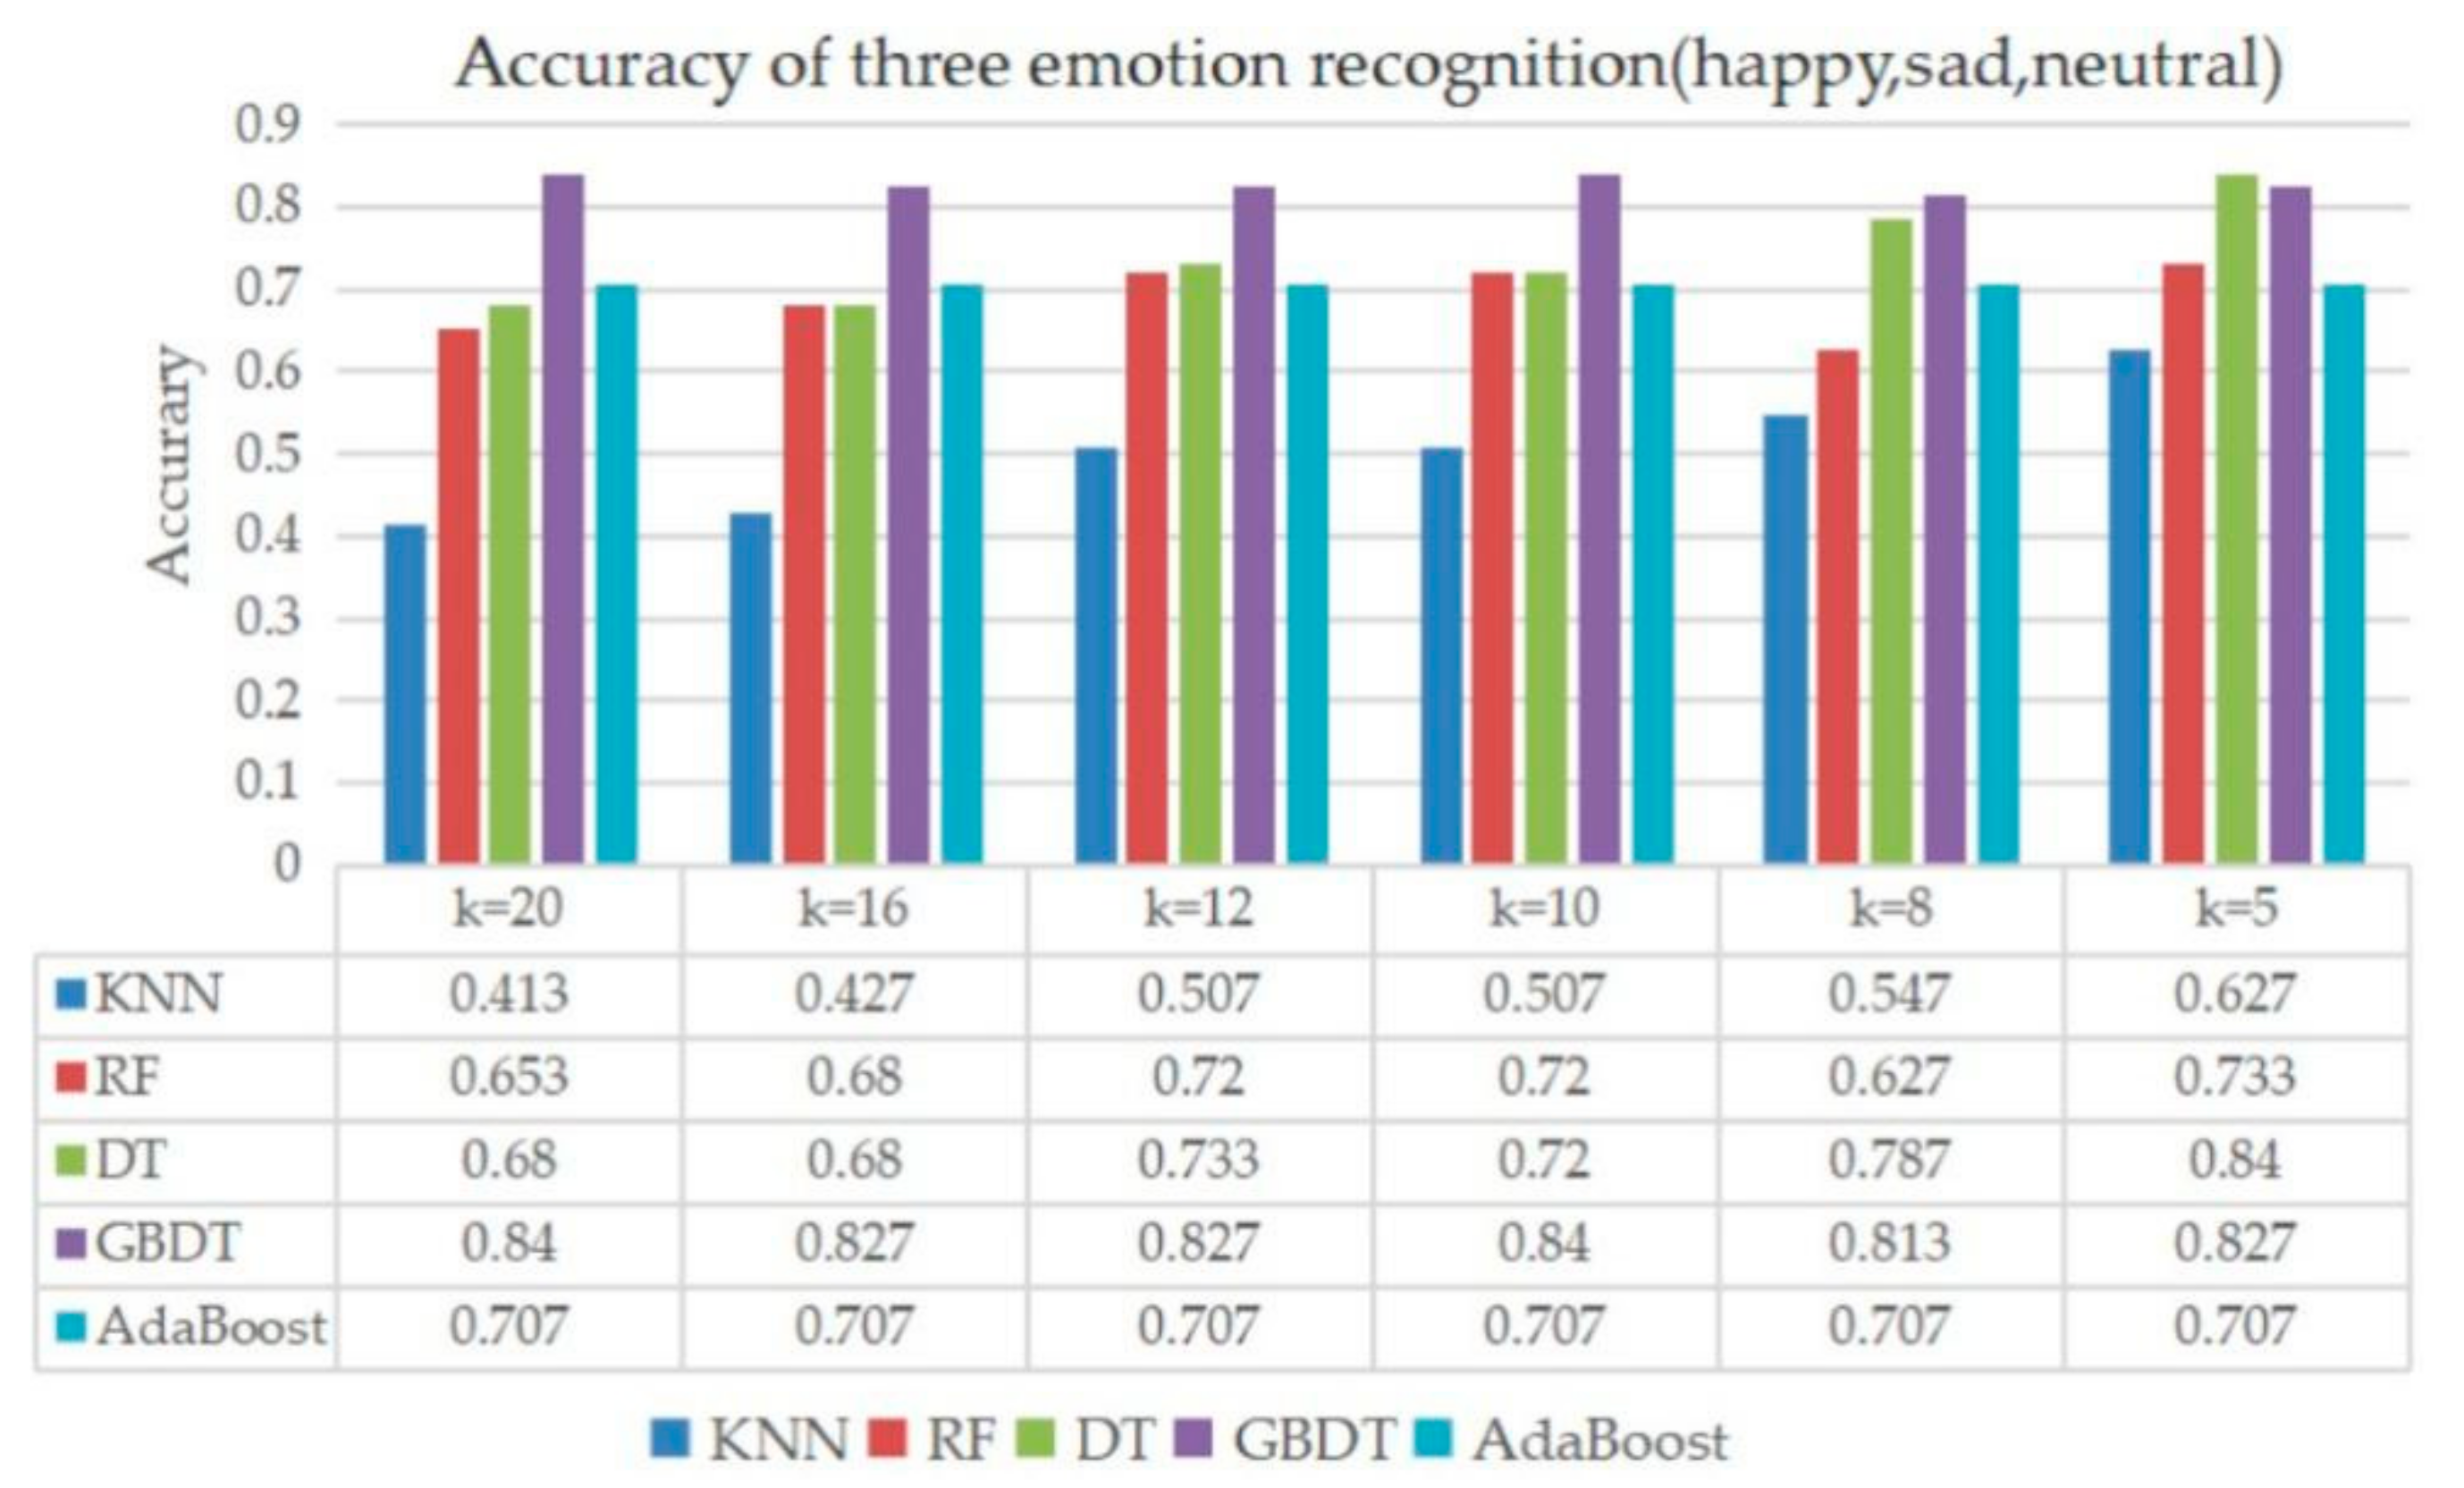
7.4. Classification of Three Emotions
8. Discussion
9. Conclusions
Author Contributions
Funding
Acknowledgment:
Conflicts of Interest
Appendix A

| Categories | Features Explanation |
|---|---|
| Features from original signal | Rate_diff1_mean: the mean value of the first-order difference in heart rates; Rate_diff2_mean: the mean value of the second-order difference in heart rates; Rate_range: the variation range of the heart rate; Rate_data_entropy: the information entropy of the heart rates; Max_ratio: the ratio of the maximum heart rate value and data length; Min_ratio: the ratio of the minimum heart rate value and data length; Rate_Adiacent_data_root_mean: the root means square of the difference between adjacent heart rate data elements in a sequence; Rate_down_time_max: the max value during the time when the heart rate decreases; Rate_down_time_min: the min value during the time when the heart rate decreases; Rate_down_time_median: the median value during the time when the heart rate decreases; Rate_down_time_mean: the mean value during the time when the heart rate decreases; Rate_down_time_std: the standard deviation during the time when the heart rate decreases; Rate_up_time_max: the max value during the time when the heart rate increases; Rate_up_time_min: the min value during the time when the heart rate increases; Rate_up_time_median: the median value during the time when the heart rate increases; Rate_up_time_mean: the mean value during the time when the heart rate increases; Rate_up_time_std: the standard deviation during the time when the heart rate increases; Rate_time_continue_max: the max value during the time when the heart rate remains unchanged; Rate_time_continue_min: the min value during the time when the heart rate remains unchanged; Rate_time_continue_median: the median value during the time when the heart rate remains unchanged; Rate_time_continue_mean: the mean value during the time when the heart rate remains unchanged; Rate_time_continue_std: the standard deviation during the time when the heart rate remains unchanged; |
| Features from normalized signal | Rate_down_slope_max: the max value of the ratio of decreased amplitude and the corresponding decrease time; Rate_down_slope_min: the min value of the ratio of decreased amplitude and the corresponding decrease time; Rate_down_slope_median: the median value of the ratio of decreased amplitude and the corresponding decrease time; Rate_down_slope_mean: the mean value of the ratio of decreased amplitude and the corresponding decrease time; Rate_down_slope_std: the standard deviation of the ratio of decreased amplitude and the corresponding decrease time; Rate_up_amplitude_max: the max value of the amplitude change when the normalized heart rate increases; Rate_up_amplitude_median: the median value of the amplitude change when the normalized heart rate increases;Rate_up_amplitude_mean: the mean value of the amplitude change when the normalized heart rate increases; Rate_up_amplitude_std: the standard deviation of the amplitude change when the normalized heart rate increases; Rate_down_amplitude_max: the max value of the amplitude change when the normalized heart rate declines; Rate_down_amplitude_min: the min value of the amplitude change when the normalized heart rate declines; Rate_down_amplitude_median: the median value of the amplitude change when the normalized heart rate declines; Rate_down_amplitude_mean: the mean value of the amplitude change when the normalized heart rate declines; Rate_down_amplitude_std: the standard deviation of the amplitude change when the normalized heart rate declines; 25_mean_max, min, median, mean, std: the normalized signal is processed by moving average with a window length of 25, then the 25_mean data is obtained. Then features (includes max, min, median, mean, std) are extracted from the 25_mean data;Rate_data_mean,Rate_data_var: the mean and variance of the normalized heart rate signal; Rate_data_normalized_diff1_max\min\std\median\mean: Rate_data_normalized_diff1 is the average of the first-order difference of the normalized original signals. Then features (includes max, min, std, median, mean) are extracted from Rate_data_normalized_diff1 data; Rate_data_normalized_diff2_max\min\std\median\mean: Rate_data_normalized_diff2 is the average absolute value of the second-order differences of the normalized heart rate signals. Then features (includes max, min, std, median, mean) are extracted from Rate_data_normalized_diff2 data; |
| Classifier | Parameter | Parameter Explanation |
|---|---|---|
| KNN | weights = ‘distance’, p = 1, n_neighbors = 6, leaf_size = 2, algorithm = ‘ball_tree’ | Weights: weight function used in prediction; p: power parameter for the Minkowski metric; n_neighbors: number of neighbors to use; leaf_size: leaf size passed to BallTree; algorithm: used to compute the nearest neighbors |
| RF | n_estimators = 90, oob_score = True, random_state = 10 | n_estimators: the number of trees in the forest; oob_score: whether to use out-of-bag samples; random_state: controls both the randomness of the bootstrapping of the samples used when building trees and the sampling of the features to consider when looking for the best split at each node |
| DT | criterion = ‘gini’, max_depth = 6, splitter = ‘best’ | criterion: the function to measure the quality of a split; max_depth: the maximum depth of the tree; splitter: the strategy used to choose the split at each node |
| GBDT | n_estimators = 120, max_depth = 10, learning_rate = 0.01, min_samples_split = 4, subsample = 0.5 | n_estimators: the number of boosting stages to perform; max_depth: maximum depth of the regression estimators; learning_rate:learning rate shrinks the contribution of each tree by learning_rate; min_samples_split: the minimum number of samples required to split an internal node; subsample: the fraction of samples to be used for fitting the individual base learners |
| AdaBoost | n_estimators = 6, learning_rate = 0.1 | n_estimators: the maximum number of estimators at which boosting is terminated; learning_rate: learning rate shrinks the contribution of each classifier |
References
- Gouizi, K.; Maaoui, C.; Reguig, F.B. Negative emotion detection using EMG signal. In Proceedings of the 2014 International Conference on Control, Decision and Information Technologies (CoDIT), Metz, France, 3–5 November 2014; pp. 690–695. [Google Scholar]
- Khetrapal, N. Detection of Negative Emotions in Autistics: Questioning the ‘Amygdala Hypothesis’. New Sch. Psychol. Bull. 2007, 5, 968–977. [Google Scholar]
- Akar, S.A.; Kara, S.; Agambayev, S.; Bilgiç, V. Nonlinear analysis of EEGs of patients with major depression during different emotional states. Comput. Biol. Med. 2015, 67, 49–60. [Google Scholar] [CrossRef]
- Bailenson, J.N.; Pontikakis, E.D.; Mauss, I.B.; Gross, J.J.; Jabon, M.E.; Hutcherson, C.A.; Nass, C.; John, O. Real-time classification of evoked emotions using facial feature tracking and physiological responses. Int. J. Hum. Comput. Stud. 2008, 66, 303–317. [Google Scholar] [CrossRef]
- Li, S.; Cui, L.; Zhu, C.; Li, B.; Zhu, T. Emotion recognition using kinect motion capture data of human gaits. PeerJ 2016, 4, e2364. [Google Scholar] [CrossRef]
- Ekman, P. An argument for basic emotions. Cognit. Emotion 1992, 6, 169–200. [Google Scholar] [CrossRef]
- Britton, A.; Shipley, M.; Malik, M.; Hnatkova, K.; Hemingway, H.; Marmot, M. Changes in Heart Rate and Heart Rate Variability Over Time in Middle-Aged Men and Women in the General Population (from the Whitehall II Cohort Study). Am. J. Cardiol. 2007, 100, 524–527. [Google Scholar] [CrossRef]
- Valderas, M.T.; Bolea, J.; Laguna, P.; Vallverdú, M.; Bailón, R. Human emotion recognition using heart rate variability analysis with spectral bands based on respiration. In Proceedings of the 2015 37th Annual International Conference of the IEEE Engineering in Medicine and Biology Society (EMBC), Milan, Italy, 25–29 August 2015; pp. 6134–6137. [Google Scholar]
- Xu, Y.; Liu, G.Y. A Method of Emotion Recognition Based on ECG Signal. In Proceedings of the 2009 International Conference on Computational Intelligence and Natural Computing, Wuhan, China, 6–7 June 2009. [Google Scholar]
- Quiroz, J.C.; Yong, M.H.; Geangu, E. Emotion-Recognition Using Smart Watch Accelerometer Data: Preliminary Findings. In Proceedings of the 2017 ACM International Joint Conference on Pervasive and Ubiquitous Computing and Proceedings of the 2017 ACM International Symposium on Wearable Computers, Maui island, HI, USA, 11–15 September 2017; pp. 805–812. [Google Scholar]
- Pollreisz, D.; TaheriNejad, N. A simple algorithm for emotion recognition, using physiological signals of a smart watch. In Proceedings of the 2017 39th Annual International Conference of the IEEE Engineering in Medicine and Biology Society (EMBC), Seogwipo, Korea, 11–15 July 2017; pp. 2353–2356. [Google Scholar]
- Zhang, Z.; Song, Y.; Cui, L.; Liu, X.; Zhu, T. Emotion recognition based on customized smart bracelet with built-in accelerometer. PeerJ 2016, 4, e2258. [Google Scholar] [CrossRef]
- Covello, R.; Fortino, G.; Gravina, R.; Aguilar, A.; Breslin, J.G. Novel method and real-time system for detecting the Cardiac Defense Response based on the ECG. In Proceedings of the 2013 IEEE International Symposium on Medical Measurements and Applications (MeMeA), Gatineau, QC, Canada, 4–5 May 2013; pp. 53–57. [Google Scholar]
- Xu, Y. Emotion Recognition Based on ECG Signals. Master’s Thesis, Southwest University, Chongqing, China, 2010. [Google Scholar]
- Song, T.; Zheng, W.; Lu, C.; Zong, Y.; Zhang, X.; Cui, Z. MPED: A Multi-Modal Physiological Emotion Database for Discrete Emotion Recognition. IEEE Access 2019, 7, 12177–12191. [Google Scholar] [CrossRef]
- Ma, C.; Liu, G. Feature Extraction, Feature Selection and Classification from Electrocardiography to Emotions. In Proceedings of the 2009 International Conference on Computational Intelligence and Natural Computing, Wuhan, China, 6–7 June 2009. [Google Scholar]
- Koelstra, S.; Muhl, C.; Soleymani, M.; Lee, J.S.; Yazdani, A.; Ebrahimi, T.; Pun, T.; Nijholt, A.; Patras, I. DEAP: A Database for Emotion Analysis; using Physiological Signals. IEEE Trans. Affect. Comput. 2012, 3, 18–31. [Google Scholar] [CrossRef]
- Zheng, W.; Liu, W.; Lu, Y.; Lu, B.; Cichocki, A. EmotionMeter: A Multimodal Framework for Recognizing Human Emotions. IEEE Trans. Cybern. 2019, 49, 1110–1122. [Google Scholar] [CrossRef] [PubMed]
- Guo, H.; Huang, Y.; Lin, C.; Chien, J.; Haraikawa, K.; Shieh, J. Heart Rate Variability Signal Features for Emotion Recognition by Using Principal Component Analysis and Support Vectors Machine. In Proceedings of the 2016 IEEE 16th International Conference on Bioinformatics and Bioengineering (BIBE), Taichung, Taiwan, 31 October–2 November 2016; pp. 274–277. [Google Scholar]
- Xu, P.; Huang, Y.; Luo, Y. Preliminary Compilation and Evaluation of Chinese Emotional Image Library. Chin. J. Mental Health 2010, 24, 551–554. [Google Scholar]
- Swangnetr, M.; Kaber, D.B. Emotional State Classification in Patient–Robot Interaction Using Wavelet Analysis and Statistics-Based Feature Selection. IEEE Trans. Hum. Mach. Syst. 2013, 43, 63–75. [Google Scholar] [CrossRef]
- Guo, H.W.; Huang, Y.S.; Chien, J.C.; Shieh, J.S. Short-term analysis of heart rate variability for emotion recognition via a wearable ECG device. In Proceedings of the 2015 International Conference on Intelligent Informatics and Biomedical Sciences (ICIIBMS), Okinawa, Japan, 28–30 November 2015; pp. 262–265. [Google Scholar]
- Xia, Y.; Yang, L.; Shi, H.; Zhuang, Y.; Liu, C. Changes of permutation pattern entropy and ordinal pattern entropy during three emotion states: Natural, happiness and sadness. In Proceedings of the 2017 Computing in Cardiology (CinC), Rennes, France, 24–27 September 2017; pp. 1–4. [Google Scholar]
- Wang, Y.; Mo, J. Emotion feature selection from physiological signals using tabu search. In Proceedings of the 2013 25th Chinese Control and Decision Conference, Guiyang, China, 25–27 May 2013; pp. 3148–3150. [Google Scholar]
- Wen, W.; Liu, G.; Cheng, N.; Wei, J.; Shangguan, P.; Huang, W. Emotion Recognition Based on Multi-Variant Correlation of Physiological Signals. IEEE Trans. Affect. Comput. 2014, 5, 126–140. [Google Scholar] [CrossRef]
- Noroozi, F.; Sapiński, T.; Kamińska, D.; Anbarjafari, G. Vocal-based emotion recognition using random forests and decision tree. Int. J. Speech Technol. 2017, 20, 239–246. [Google Scholar] [CrossRef]
- Wu, S.; Xu, X.; Shu, L.; Hu, B. Estimation of valence of emotion using two frontal EEG channels. In Proceedings of the 2017 IEEE International Conference on Bioinformatics and Biomedicine (BIBM), Kansas City, MO, USA, 13–16 November 2017; pp. 1127–1130. [Google Scholar]
- Bhalla, J.S.; Aggarwal, A. Using Adaboost Algorithm along with Artificial neural networks for efficient human emotion recognition from speech. In Proceedings of the 2013 International Conference on Control, Automation, Robotics and Embedded Systems (CARE), Jabalpur, India, 16–18 December 2013. [Google Scholar]
- Nardelli, M.; Valenza, G.; Greco, A.; Lanata, A.; Scilingo, E.P. Recognizing Emotions Induced by Affective Sounds through Heart Rate Variability. IEEE Trans. Affect. Comput. 2015, 6, 385–394. [Google Scholar] [CrossRef]
- Yu, S.-N.; Chen, S.-F. Emotion state identification based on heart rate variability and genetic algorithm. In Proceedings of the 2015 37th Annual International Conference of the IEEE Engineering in Medicine and Biology Society (EMBC), Milan, Italy, 25–29 August 2015. [Google Scholar]
- Ali, M.; Al Machot, F.; Haj Mosa, A.; Jdeed, M.; Al Machot, E.; Kyamakya, K. A Globally Generalized Emotion Recognition System Involving Different Physiological Signals. Sensors 2018, 18, 1905. [Google Scholar] [CrossRef] [PubMed]
- Shu, L.; Xie, J.; Yang, M.; Li, Z.; Liao, D.; Xu, X.; Yang, X. A Review of Emotion Recognition Using Physiological Signals. Sensors 2018, 18, 2074. [Google Scholar] [CrossRef] [PubMed]
- Carels, A.R.; Blumenthal, J.A.; Sherwood, A. Emotional responsivity during daily life: Relationship to psychosocial functioning and ambulatory blood pressure. Int. J. Psychophysiol. 2000, 36, 25–33. [Google Scholar] [CrossRef]


| Ref. | Related Work | Signal Type | Subject Number | Stimulation Materials | Accuracy |
|---|---|---|---|---|---|
| [10] | Quiroz, J.C., Geangu, E., & Yong, M.H. (2018) | Walking sensor data and heart rate data | 50 | Audio-visual and audio | Higher than 78% (happiness vs. sadness) |
| [11] | David Pollreisz and Nima Taheri Nejad (2008) | EDA, SKT, HR | 10 | Emotion video | 64.66% (simpler) |
| [12] | Zhan Zhang et al. (2016) | Walking data | 123 | Film chip | 91.3% (neutral vs. angry), 88.5% (neutral vs. happy), 88.5% (happy vs. angry) |
| [14] | Xu Ya (2010) | ECG, HR | 300 | Video | Happy (80.38%) |
| [15] | Tengfei Song et al. (2019) | ECG | 23 | Video | Joy, sad, neutral (50.66%) |
| Emotion | Video 1 | Video 2 | Video 3 | Video 4 | Video 5 |
|---|---|---|---|---|---|
| Neutral | 74 | 70 | 68 | 122 | 71 |
| Happy | 53 | 109 | 142 | 83 | 112 |
| Sad | 233 | 146 | 88 | 136 | 101 |
| Categories | Features |
|---|---|
| Features from original signal | 1. Rate_diff1_mean, Rate_diff2_mean, Rate_range, Rate_data_entropy, Max_ratio, Min_ratio, Rate_Adjacent_data_root_mean. 2. Rate_down_time_max, Rate_down_time_min, Rate_down_time_median, Rate_down_time_mean, Rate_down_time_std. 3. Rate_up_time_max, Rate_up_time_min, Rate_up_time_median, Rate_up_time_mean, Rate_up_time_std. 4. Rate_time_continue_max, Rate_time_continue_min, Rate_time_continue_median, Rate_time_continue_mean, Rate_time_continue_std. |
| Features from normalized signal | 1. Rate_down_slope_max, Rate_down_slope_min, Rate_down_slope_median, Rate_down_slope_mean, Rate_down_slope_std. 2. Rate_up_amplitude_max, Rate_up_amplitude_median, Rate_up_amplitude_mean, Rate_up_amplitude_std. 3. Rate_down_amplitude_max, Rate_down_amplitude_min, Rate_down_amplitude_median, Rate_down_amplitude_mean, Rate_down_amplitude_std. 4. 25_mean_max, min, median, mean, std. 5. Rate_data_mean, Rate_data_var. 6. Rate_data_normalized_diff1_max\min\std\median\mean. 7. Rate_data_normalized_diff2_max\min\std\median\mean. |
| Emotional Categories | Feature Name | Feature Score |
|---|---|---|
| Neutral vs. happy | data_mean | 0.5598 |
| 25_mean_median | 0.5063 | |
| 25_mean_mean | 0.3002 | |
| data_entropy | 0.2655 | |
| data_normalized_diff1_median | 0.1376 | |
| Neutral vs. sad | 25_mean_median | 0.5119 |
| data_mean | 0.5119 | |
| 25_mean_mean | 0.3368 | |
| 25_mean_max | 0.1392 | |
| slope_max | 0.1158 | |
| Happy vs. sad | data_entropy | 0.3941 |
| down_amplitude_max | 0.1345 | |
| down_time_mean | 0.1149 | |
| data_normalized_diff1_max | 0.0896 | |
| down_amplitude_min | 0.0879 | |
| Sad, Happy, Neutral | data_mean | 0.4912 |
| 25_mean_median | 0.4612 | |
| data_entropy | 0.3206 | |
| 25_mean_mean | 0.2967 | |
| slope_max | 0.1106 |
| Classifier | Parameter |
|---|---|
| KNN | weights = ‘distance’, p = 1, n_neighbors = 6, leaf_size = 2, algorithm = ‘ball_tree’ |
| RF | n_estimators = 90, oob_score = True, random_state = 10 |
| DT | criterion = ‘gini’, max_depth = 6, splitter = ‘best’ |
| GBDT | n_estimators = 120, max_depth = 10, learning_rate = 0.01,min_samples_split = 4, subsample = 0.5 |
| AdaBoost | n_estimators = 6, learning_rate = 0.1 |
© 2020 by the authors. Licensee MDPI, Basel, Switzerland. This article is an open access article distributed under the terms and conditions of the Creative Commons Attribution (CC BY) license (http://creativecommons.org/licenses/by/4.0/).
Share and Cite
Shu, L.; Yu, Y.; Chen, W.; Hua, H.; Li, Q.; Jin, J.; Xu, X. Wearable Emotion Recognition Using Heart Rate Data from a Smart Bracelet. Sensors 2020, 20, 718. https://doi.org/10.3390/s20030718
Shu L, Yu Y, Chen W, Hua H, Li Q, Jin J, Xu X. Wearable Emotion Recognition Using Heart Rate Data from a Smart Bracelet. Sensors. 2020; 20(3):718. https://doi.org/10.3390/s20030718
Chicago/Turabian StyleShu, Lin, Yang Yu, Wenzhuo Chen, Haoqiang Hua, Qin Li, Jianxiu Jin, and Xiangmin Xu. 2020. "Wearable Emotion Recognition Using Heart Rate Data from a Smart Bracelet" Sensors 20, no. 3: 718. https://doi.org/10.3390/s20030718
APA StyleShu, L., Yu, Y., Chen, W., Hua, H., Li, Q., Jin, J., & Xu, X. (2020). Wearable Emotion Recognition Using Heart Rate Data from a Smart Bracelet. Sensors, 20(3), 718. https://doi.org/10.3390/s20030718