Abstract
Overweight/obesity is a physical condition that affects daily activities, including walking. The main purpose of this study was to identify if there is a relationship between body mass index (BMI) and gait characteristics in young adults. 12 normal weight (NW) and 10 overweight/obese (OW) individuals walked at a self-selected speed along a 14 m indoor path. H-Gait system, combining seven inertial sensors (fixed on pelvis and lower limbs), was used to record gait data. Walking speed, spatio-temporal parameters and joint kinematics in 3D were analyzed. Differences between NW and OW and correlations between BMI and gait parameters were evaluated. Conventional spatio-temporal parameters did not show statistical differences between the two groups or correlations with the BMI. However, significant results were pointed out for the joint kinematics. OW showed greater hip joint angles in frontal and transverse planes, with respect to NW. In the transverse plane, OW showed a greater knee opening angle and a shorter length of knee and ankle trajectories. Correlations were found between BMI and kinematic parameters in the frontal and transverse planes. Despite some phenomena such as soft tissue artifact and kinematics cross-talk, which have to be more deeply assessed, current results show a relationship between BMI and gait characteristics in young adults that should be looked at in osteoarthritis prevention.
1. Introduction
The World Health Organization defined the grade of overweight and obesity in adults using the Body Mass Index (BMI) as follows: normal weight (18.5 < BMI < 24.5), overweight (25.0 < BMI < 29.9), and obese (BMI > 30.0) [1]. It is well known that the overweight and/or obesity condition has functional implication on everyday life. In particular, it has been demonstrated that extra weight alters the normal mechanism of gait, reducing the hip and knee flexion in stance phase [2,3], increasing the ankle plantarflexion in stance, and the ankle dorsiflexion in swing [2]. In obese adults, walking speed is reduced and gait is characterized by shorter step length, lower step frequency, and longer stance phase [4]. In addition, obesity is generally correlated with knee and hip osteoarthritis [5] due to the different joint load distribution. The effects of overweight and obesity on gait kinematics in adults are well known. However, there is a lack of knowledge on gait data from young overweight/obese adults. Nevertheless, the early detection of gait deviations from normality in a population of overweight/obese young adults might be very important in osteoarthritis prevention [6]. For example, it could suggest preventive therapies to this population.
Gait analysis is extensively adopted to evaluate human locomotion [7,8,9] and to monitor its changes due to ageing [10], disease [11,12,13], or rehabilitation [14,15]. Optoelectronic systems are a gold standard in biomechanical assessment of human gait [16]. However, these systems have few drawbacks. Optoelectronic systems are expensive, data collection is usually limited to a small volume, and data analysis requires a long amount of time. For these reasons, wearable sensors composed of accelerometers and gyroscopes are increasingly adopted to evaluate human motion in everyday life, sport, and clinical purposes when the use of stereophotogrammetric systems is challenging [17]. Wearable sensors can be placed in different anatomical segments and arranged in different configurations [18,19,20].
Wearable inertial sensors have already been used in human gait analysis, showing good results in application on both healthy adults [19] and healthy elderly [21], but also on pathological population such as Parkinson’s disease [22] and cerebral palsy [18]. The majority of the studies focused on the evaluation of human gait in terms of walking speed and spatio-temporal parameters [19,23,24]. Besides spatio-temporal parameters, lower limb joint kinematics also provides crucial information about human gait characteristics. Pelvis movements and hip, knee, and ankle joint kinematics are largely evaluated using inertial sensors [25]. The majority of the work in this field focused on flexion-extension movements in the sagittal plane. However, the analysis in the frontal plane (abduction/adduction) and in the transverse plane (internal/external rotation) can also provide relevant information. Tadano et al. [6] showed that the knee and ankle kinematics of osteoarthritic patients is different in the transverse plane compared to control group of healthy subjects. Despite this evidence, a limited number of studies assessed 3D kinematics of lower limbs using wearable inertial sensors.
Therefore, the purpose of the current work was to compare gait characteristics of overweight/obese (OW) and normal weight (NW) subjects. In particular, the current study aims to answer the question of if there a relationship between BMI and gait biomechanics in young adults. This study was conducted analyzing spatio-temporal parameters and joint kinematics in the three planes. In addition, other kinematic parameters of knee and ankle joints were proposed and evaluated. We hypothesize that NW and OW young subjects show different values for spatio-temporal and kinematic data.
2. Materials and Methods
2.1. Subjects
A total of 22 healthy young males (age: 26 ± 1.8 years, height: 178 ± 8.5 cm) were recruited for the current study. Subjects were divided into two groups according to their BMI [1]. 12 subjects were included in the NW group (18.5 < BMI < 24.9 kg/m2) and 10 were included in the OW group (BMI > 25.0 kg/m2). Gait data were taken from retrospective studies performed at Politecnico di Torino, Italy. After being informed about the test procedures and aims, all the subjects signed a consent form. The procedures were performed in accordance with the Declaration of Helsinki.
2.2. Acquisition System
The H-Gait system was used to collect gait data [26]. The H-Gait system includes seven inertial sensors (TSDN121, ATR Promotions). Each sensor is composed of a tri-axial accelerometer (full scale 16 g), a tri-axial gyroscope (full scale 2000 dps), and a tri-axial magnetometer (full scale 1200 μT) [27]. For the current test, accelerometers and gyroscope ranges were set to ±4 g (accuracy: 0.12 mg) and ±500 dps (accuracy: 0.015 dps), respectively. The sampling frequency was set equal to 100 Hz. Acceleration, angular velocity, and magnetic data were collected simultaneously during gait trials and saved locally. Then, they were transferred to a laptop. Magnetometer data were not used for the analysis.
2.3. Test Protocol and System Calibration
Before starting the gait test, the inertial sensors were positioned on the subject and a calibration procedure was performed to convert data from the sensors coordinate system to the anatomical coordinate systems. The subject preparation and calibration procedure were explained in detail in [26,28]. Briefly, the following steps were carried out in a laboratory:
- (1).
- Anatomical measurements of pelvis breadth, thigh height, shank height, and sphyrion height.
- (2).
- Placement of reflective markers, bilaterally, on the anatomical representative points: greater trochanter, lateral epicondyle of the femur, medial epicondyle of the femur, lateral malleolus and medial malleolus. Three photos were shot from the front, left, and right sides of the subject (Figure 1a). The markers were removed.
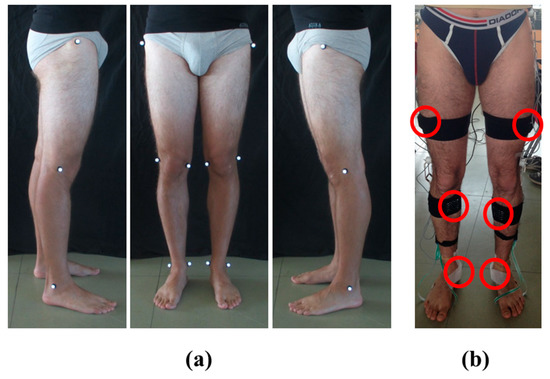 Figure 1. Subject preparation for the protocol: (a) Photos from the left, front, and right side of the subject with the reflective markers placed on both lower limbs; (b) Placement and fixing of the six sensors on the subject’s lower limbs.
 - (3).
- Fixing of inertial sensors on subject’s pelvis and both lower limbs using elastic Velcro® bands and medical tape. The sensor on the pelvis was located posteriorly in the middle point between iliac crests. The six sensors on the lower limbs were positioned on the lateral side of the thighs, on the anterior side of the tibia, and below the medial malleolus, bilaterally [6,28,29] (Figure 1b).
- (4).
- Acquisition of H-Gait signals for three seconds, with the subject in sitting posture, and for another three seconds in upright standing posture.
After the calibration procedure the test started in the same laboratory. The test was performed barefoot walking at a self-selected speed on a straight path of 14 m. To become confident with the equipment worn, subjects walked on the straight path forward and backward once. Then, the subjects performed six walking trials (three forward and three backward), but for the current analysis, only the first walked in the forward direction was considered.
2.4. Data Analysis
Walking speed and the following spatio-temporal parameters were calculated: step length (cm), step width (cm), stride length (cm), cycle time (s), stance time (% gait cycle), and cadence (stride/min).
Then, the hip, knee, ankle joint kinematics in the sagittal (flexion/extension), frontal (abduction/adduction), and transverse (internal/external rotation) planes were calculated [26,30]. Heel contacts (HC) were calculated by identifying the peaks of the shank angular velocity. Toe off (TO) events were identified considering toe trajectories [28]. Using HC and TO, joint kinematic signals were normalized with respect to the gait cycle. The joint range of motion (ROM) was calculated as the difference between the maximum and minimum angles during each gait cycle.
In addition to the joint ROMs in the three planes, the trajectories of the center of the knee and ankle joints in the transverse plane were also evaluated, for each cycle and both the left and right lower limbs [6,31]. Trajectories are expressed with respect to a reference frame fixed on the pelvis, with the X axis directed as the walking direction, the Y axis in the medio-lateral direction and the origin (X = 0; Y = 0) in the middle point between the iliac crests. A representative example of trajectories for an OW subject is reported in Figure 2 for the knee, and for the ankle in Figure 3. For each lower limb and each gait cycle, the area of knee trajectory (Ak) was calculated (Figure 2a) and averaged across cycles. Then, the area values were averaged between the left and right lower limbs. Furthermore, the average knee trajectories in transverse plane were calculated for each lower limb. The major (λk) and minor (νk) diameters of the average knee trajectories were obtained as shown in Figure 2b. Finally, the knee opening angle (θk) between the left and right major axes were assessed [6,31] (Figure 2c). The same data were calculated for the ankle joint trajectories (Figure 3), being in this case: Aa the ankle area, λa the ankle major diameter, νa the ankle minor diameter, and θa the ankle opening angle between the left and right major axes. The trajectory for the hip joint in the transversal plane was also calculated, but it was not represented due to its negligible path in this plane.
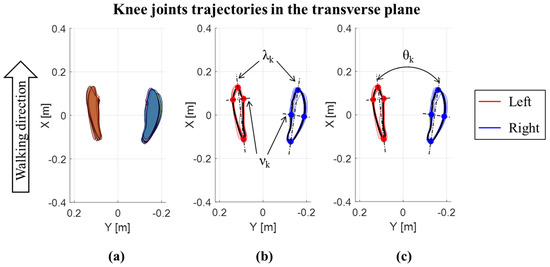
Figure 2.
Knee joints trajectories in the transverse plane for an OW subject: (a) Area of each left and right step; (b) major (λk) and minor (νk) diameters of the average knee trajectories; (c) knee opening angle (θk) between the left and right major axes of average knee joint trajectories.
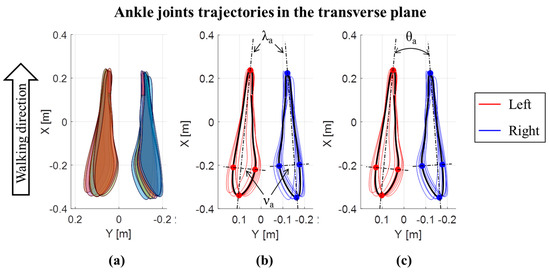
Figure 3.
Ankle joints trajectories in the transverse plane for an OW subject: (a) Area of each left and right step; (b) major (λk) and minor (νk) diameters of the average ankle joints trajectories; (c) ankle opening angle (θa) between the left and right major axes of average ankle joint trajectories.
The analysis to calculate walking speed, spatio-temporal parameters, and the joint kinematics was performed using a custom made Matlab® script (MatLab® and Release 2018, The MathWorks, Inc., Natick, Massachusetts, United States) For both the spatio-temporal and kinematic analysis, parameters from right and left side were averaged for the statistical analysis.
2.5. Statistical Analysis
Non-parametric statistics were used. Statistical differences between NW and OW of anthropometric data (age, height, weight, and BMI) were evaluated using the Mann Whitney test. Statistical differences in joint kinematics, spatio-temporal parameters, and walking speed between NW and OW subjects were also assessed using the Mann Whitney test. Correlations of joint kinematics, spatio-temporal parameters, and walking speed with BMI were evaluated using Spearman correlation. Significance level was set at α = 0.05. Statistical analyses were performed with Matlab® Software.
3. Results
Comparing age and height between NW and OW, no statistical differences were found, whereas weight and BMI were higher for OW subjects compared to NW (Table 1).

Table 1.
Anthropometric data (mean ± standard deviation).
3.1. Spatio-Temporal Parameters
Walking speed and spatio-temporal parameters did not show statistical differences between NW and OW subjects (Table 2). In addition, no significant correlations of the walking speed and spatio-temporal parameters with BMI were found.
Table 2.
Spatio-temporal parameters (mean ± standard deviation).
3.2. Joint Kinematics
Table 3 reports kinematic results and statistical differences when present. Hip abduction/adduction ROM and hip internal/external rotation ROM were significantly greater for OW compared to NW (p < 0.05). Concerning knee joint, θk was significantly greater for OW compared to NW (p < 0.05). Finally, λk and λa were statistically shorter for OW than for NW (p < 0.01).
Table 3.
Joint kinematics parameters (mean ± standard deviation).
Concerning the correlations (Figure 4), BMI was positively correlated both with hip abduction/adduction ROM (ρ = 0.56, p < 0.01) and hip internal/external rotation ROM (ρ = 0.71, p < 0.01). For knee joint, BMI was positively correlated with knee internal/external rotation ROM (ρ = 0.51, p < 0.05) and negatively correlated with λk (ρ = −0.58, p < 0.01). Ankle joint kinematics did not show correlations with BMI in any of the three planes. A negative correlation was found between BMI and λa (ρ = −0.53, p < 0.05).
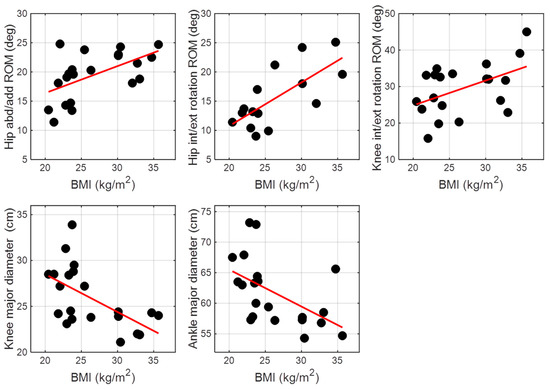
Figure 4.
Significant correlations between BMI and joint kinematics parameters.
4. Discussion
Comparing gait characteristics of OW and NW young subjects collected by wearable inertial sensors, this work aimed to assess if there is a correlation between BMI and gait characteristics in young adults, a relationship that can be useful in osteoarthritis prevention. Despite no differences were found in conventional spatio-temporal parameters between OW and NW groups, significant results were pointed out analyzing the joint kinematics. Indeed, OW group showed greater hip abduction/adduction ROM, greater hip internal/external rotation ROM, greater knee opening angle, and shorter major diameters with respect to NW. In addition, correlations were found between the joint kinematics and the BMI. Positive correlations were found between BMI and abduction/adduction ROM of the hip and between BMI and internal/external rotation ROM of the hip and the knee joints. A negative correlation was found between the BMI and the ankle major diameter.
4.1. Spatio-Temporal Parameters
Although in the literature there is large consensus about the slower preferred walking speed of obese adults compared to lean adults [32,33,34,35], this is not always the case [36]. Indeed, besides the knee joint load, the energy cost per distance is also an aspect that should be considered when the preferred walking speed is evaluated [36,37]. The energy cost per distance vs. walking speed is a U-shaped curve, with a relatively flat part around 1.2−1.4 m/s [36]. In our study, the self-selected walking speed for both OW and NW subjects is slightly lower compared to the literature results [35], but still close to the range of values with the lowest energy cost per distance expenditure [36,37]. The fact that the walking speed was slightly lower than what it is reported in the literature could be due to the fact that the current data were taken from a retrospective study [28] in which subjects were wearing also a set of electrogoniometers, and this may affect the natural walking speed. Nevertheless, having similar walking speeds between the two groups assured that the changes existing between OW and NW were directly related to the BMI and are not influenced by the walking speed [38].
Concerning the spatial parameters, the literature suggests that OW adults walk with shorter stride length, shorter step length, and larger step width compared to NW adults when walking at a self-selected speed [4]. However, this finding may be directly due to the effect of speed [4]. On the other hand, when OW and NW adults are forced to use the same pre-defined walking speed, no differences were found in stride length [2] and step length [33]. However, it is suggested that OW individuals may alter their gait characteristics when forced to a walking speed that is different from the preferred one [33]. In our study, we found no differences between spatial parameters of OW and NW, although subjects were walking at their self-selected speed. Hence, no gait alterations are expected due to effect of an imposed speed. In this perspective, our tests were conducted in a more ecological condition.
Temporal parameters did not show differences in cycle time, stance time, and cadence. Our results on cadence were in agreement with the literature that reports no differences between OW and NW adults when walking at their preferred speed [35]. The literature showed longer stance time for OW compared to NW adults when walking both at the preferred walking speed [35] and nearly identical speed [2,33]. We found no differences for the stance time. This is consistent with our results of an equal walking speed and step length between groups.
In literature, it was previously suggested that in order to increase their dynamic balance, obese adults tend to reduce walking speed, step length, cadence, and swing phase duration, and to increase step width, stance phase, and double support [32,34]. Considering altogether the results on spatio-temporal parameters (step length and width, cycle and stance time) and walking speed, this suggests that young OW subjects in our study do not show a modified dynamic balance. The subjects enrolled in our study were, on the average, younger and showed a lower BMI with respect to obese adults considered in the other studies [32,34]. Therefore, a combination of young age (which entails gait patterns not affected by degenerative changes) [39] and a relatively lower BMI can explain our spatio-temporal findings in comparison with the existing literature and suggests that conventional spatio-temporal parameters might not reflect potential critical situation that could lead to the development of osteoarthritis.
4.2. Joint Kinematics
In the existing literature about lower limb kinematics of overweight/obese adults, most of the studies focused on the sagittal plane. In particular, it was demonstrated that overweight/obese adults have a more erect posture during the stance phase (greater hip extension and ankle plantarflexion, and smaller knee flexion) in order to decrease the knee joint load [33]. We found no difference in joint flexion/extension ROMs between OW and NW subjects. This finding is in accordance with previous studies [2,25,35,40] in which OW and NW subjects did not show any difference in flexion/extension ROM when walking at a velocity close to the self-selected speed obtained in our study. In our previous study [28], a difference between OW and NW was found in hip flexion/extension ROM when the joint kinematics was evaluated using electrogoniometers. This discrepancy was hypothesized to be due to kinematic crosstalk induced by the inertial sensors attached to the pelvis, which was not quantified. The lack of differences in joint flexion/extension ROMs between OW and NW may be related to the BMI of the tested subjects. Indeed, it was previously suggested that it may exists a threshold value of BMI (40 kg/m2) above which individuals change their gait to reduce the knee joint load [2,38].
The most important contribution of this study was the assessment of overweight/obese joint kinematics in the frontal and transverse planes, which are usually less considered in gait analysis performed with inertial sensors. Especially in the frontal plane, alterations of the joint kinematics may be one of the causes of lower limb joint injury [41] and osteoarthritis [42]. We found a higher hip abduction/adduction ROM for OW subjects compared to NW, which is in agreement with the existing literature [4,34,35]. We also found a positive correlation between BMI and hip abduction/adduction ROM. These differences between OW and NW subjects could be explained by a higher hip load, a larger thigh girth [34], and a different adductor muscle force during the latter part of the stance phase to better control body sway and upright stability [35,43].
Considering the transverse plane, results showed a positive correlation between BMI and both hip and knee internal/external rotation ROM as well as a larger hip internal/external rotation ROM of OW subjects. We also found a greater knee opening angle for OW compared to NW subjects. Hence, OW subjects tend to widen their knees while advancing. Overall, these findings may be explained not only by a higher hip load and a larger thigh girth of OW subjects [34], but also by a hampered thigh movement in the sagittal plane that has to be compensated in transverse plane [44]. In a previous study, normal weight individuals, both with and without osteoarthritis, were analyzed [6]. For what concerns the knee opening angle, our results are consistent with those of Tadano et al. [6] when considering healthy NW individuals. Despite the close relationship between obesity and osteoarthritis [5], the present work showed a positive knee opening angle in OW subjects, whereas osteoarthritic patients showed a negative opening angle (closing their knee trajectories along the walking direction) [6]. This difference may be explained by the fact that OW subjects from our study did not report any knee pain, thus allowing us to exclude knee osteoarthritis. The OW subjects were also younger compared to the osteoarthritic patients of that study [6]. In addition, differently from our OW population, the osteoarthritic patients of Tadano et al. [6] had a normal BMI. Hence, the populations analyzed in these two studies cannot be directly compared.
We found that both knee and ankle major diameters were shorter in OW compared to NW subjects. This is consistent with slightly shorter step length for OW with respect to NW subjects, even though this difference is not statistically significant. Accordingly, we also found a negative correlation between BMI and both knee and ankle major diameters. The differences between OW and NW pointed out by the 3D joint kinematics suggest that the proposed parameters might sufficiently highlight potential critical situation.
4.3. Limitation
Among the recruited individuals, the highest BMI was 34.7 kg/m2, which belonged to the obesity class I (as defined by the World Health Organization) [1], but no individuals representative of the obesity class II and class III were included. Although significant differences already emerged from our study, the inclusion of other obesity classes would probably complement current findings on the correlation between BMI and gait biomechanics in young adults. In addition, in order to generalize current results, additional analysis including both genders should be conducted.
Data were from a retrospective study in which subjects were wearing inertial sensors and electrogoniometers as well. Wearing both collecting systems may influence the subjects’ walking speed, slightly reducing it as results showed. This can be identified as a second limitation for this study.
Soft tissue artifact and kinematic cross-talk are still debating topics in the gait analysis literature, especially for obese subjects. In order to reduce the soft tissue artifacts, the sensors were fixed over the bones instead of the muscles [16,45] when possible in this study. However, not investigating soft tissue artifact and kinematic cross-talk could identify a third limitation of this study. In addition, data collection in transverse plane has been validated for normal weight subjects [26], but not for overweight/obese subjects. Therefore, further analysis should be conducted in that sense.
5. Conclusions
In order to answer the question of if there is a relationship between BMI and gait biomechanics in young adults, wearable inertial sensors were used to collect gait of overweight/obese and normal weight individuals in this study. Similar walking speeds and spatio-temporal results were found between the two groups. In contrast, joint kinematic parameters allowed identifying a relationship between BMI and gait characteristics in young adults. Moreover, inertial sensors proved useful in assessing subtle differences in all the trajectory planes. This study highlights the importance of also assessing the frontal and transverse planes to fully evaluate the human gait, especially in the early stages of potential critical situations such as overweight or obesity that may lead to the later development of osteoarthritis.
Author Contributions
Conceptualization and methodology, V.A., L.G. and S.T.; data acquisition, V.A., V.R. and L.G.; software and formal analysis, R.T. and V.R.; resources, S.T. and L.G.; writing and reviewing the manuscript V.R., L.G., V.A., R.T. and S.T.; all authors approved the final manuscript.
Funding
The research received no external funding.
Acknowledgments
The authors would thank Maria Macarena Lovagnini Frutos, Valentina Gabola, and Daniele Rimini for their help in recruiting participants and collecting data. The present research has been partially supported by MIUR grant Dipartimenti di Eccellenza 2018–2022 (E11G18000350001).
Conflicts of Interest
The authors declare that they have no competing interests. Gait data were taken from retrospective studies performed at Politecnico di Torino, Italy. Written informed consent was obtained from all participants, before they participated in the study. The study was conducted in accordance with the Declaration of Helsinki. Availability of data and material: The datasets analyzed during the current study are available from the corresponding author on reasonable request.
Abbreviations
The following abbreviations are used in the manuscript:
| Aa | Area of ankle trajectory |
| Ak | Area of knee trajectory |
| BMI | Body Mass Index |
| HC | Heel contact |
| NW | Normal weight |
| OW | Overweight/obese |
| ROM | Range of motion |
| TO | Toe off |
| θa | Ankle opening angle between the left and right major axes |
| θk | Knee opening angle between the left and right major axes |
| λa | Major diameters of the average ankle trajectories |
| λk | Major diameters of the average knee trajectories |
| νa | Minor diameters of the average ankle trajectories |
| νk | Minor diameters of the average knee trajectories |
References
- World Health Organization (WHO). Global Strategy on Diet, Physical Activity and Health. Available online: https://www.who.int/dietphysicalactivity/childhood_what/en/ (accessed on 3 June 2019).
- Browning, R.C.; Kram, R. Effects of obesity on the biomechanics of walking at different speeds. Med. Sci. Sports Exerc. 2007, 39, 1632–1641. [Google Scholar] [CrossRef] [PubMed]
- Lerner, Z.F.; Board, W.J.; Browning, R.C. Effects of obesity on lower extremity muscle function during walking at two speeds. Gait Posture 2014, 39, 978–984. [Google Scholar] [CrossRef] [PubMed]
- Runhaar, J.; Koes, B.W.; Clockaerts, S.; Bierma-Zeinstra, S.M.A. A systematic review on changed biomechanics of lower extremities in obese individuals: A possible role in development of osteoarthritis. Obes. Rev. 2011, 12, 1071–1082. [Google Scholar] [CrossRef] [PubMed]
- Aspden, R.M. Obesity punches above its weight in osteoarthritis. Nat. Rev. Rheumatol. 2011, 7, 65–68. [Google Scholar] [CrossRef] [PubMed]
- Tadano, S.; Takeda, R.; Sasaki, K.; Fujisawa, T.; Tohyama, H. Gait characterization for osteoarthritis patients using wearable gait sensors (H-Gait systems). J. Biomech. 2016, 49, 684–690. [Google Scholar] [CrossRef] [PubMed]
- Winter, D.A. Biomechanics and Motor Control. of Human Gait: Normal, Elderly, and Pathological, 4th ed.; John Wiley & Sons, Inc.: Hoboken, NJ, USA, 2009; ISBN 9780470549148. [Google Scholar]
- Agostini, V.; Lo Fermo, F.; Massazza, G.; Knaflitz, M. Does texting while walking really affect gait in young adults? J. Neuroeng. Rehabil. 2015, 12, 86. [Google Scholar] [CrossRef]
- Strazza, A.; Mengarelli, A.; Fioretti, S.; Burattini, L.; Agostini, V.; Knaflitz, M.; Di Nardo, F. Surface-EMG analysis for the quantification of thigh muscle dynamic co-contractions during normal gait. Gait Posture 2017, 51, 228–233. [Google Scholar] [CrossRef]
- Winter, D.A.; Patla, A.E.; Frank, J.S.; Walt, S.E. Biomechanical walking pattern changes in the fit and healthy elderly. Phys. Ther. 1990, 70, 340–347. [Google Scholar] [CrossRef]
- Gastaldi, L.; Lisco, G.; Pastorelli, S.; Dimanico, U. Effects of botulinum neurotoxin on spatio-temporal gait parameters of patients with chronic stroke: A prospective open-label study. Eur. J. Phys. Rehabil. Med. 2015, 51, 609–618. [Google Scholar]
- Agostini, V.; Knaflitz, M.; Nascimberi, A.; Gaffuri, A. Gait measurements in hemiplegic children: An automatic analysis of foot-floor contact sequences and electromyographic patterns. In Proceedings of the IEEE MeMeA 2014-IEEE International Symposium on Medical Measurements and Applications, Lisboa, Portugal, 11–12 June 2014. [Google Scholar]
- Agostini, V.; Lanotte, M.; Carlone, M.; Campagnoli, M.; Azzolin, I.; Scarafia, R.; Massazza, G.; Knaflitz, M. Instrumented gait analysis for an objective pre-/postassessment of tap test in normal pressure hydrocephalus. Arch. Phys. Med. Rehabil. 2015, 96, 1235–1241. [Google Scholar] [CrossRef]
- Agostini, V.; Ganio, D.; Facchin, K.; Cane, L.; Moreira Carneiro, S.; Knaflitz, M. Gait parameters and muscle activation patterns at 3, 6 and 12 months after total hip arthroplasty. J. Arthroplast. 2014, 29, 1265–1272. [Google Scholar] [CrossRef] [PubMed]
- Agostini, V.; De Luca, R.; Mansin, L.C.; Knaflitz, M. Reduction of gait abnormalities in type 2 diabetic patients due to physical activity: A quantitative evaluation based on statistical gait analysis. J. Mech. Med. Biol. 2012, 12, 1240025. [Google Scholar] [CrossRef]
- Leardini, A.; Chiari, A.; Della Croce, U.; Cappozzo, A. Human movement analysis using stereophotogrammetry Part 3. Soft tissue artifact assessment and compensation. Gait Posture 2005, 21, 212–225. [Google Scholar] [CrossRef] [PubMed]
- Aminian, K.; Najafi, B. Capturing human motion using body-fixed sensors: Outdoor measurement and clinical applications. Comput. Animat. Virtual Worlds 2004, 15, 79–94. [Google Scholar] [CrossRef]
- Carcreff, L.; Gerber, C.N.; Paraschiv-Ionescu, A.; De Coulon, G.; Newman, C.J.; Armand, S.; Aminian, K. What is the best configuration of wearable sensors to measure spatiotemporal gait parameters in children with cerebral palsy? Sensors 2018, 18, 394. [Google Scholar] [CrossRef] [PubMed]
- Sabatini, A.M.; Martelloni, C.; Scapellato, S.; Cavallo, F. Assessment of walking features from foot inertial sensing. IEEE Trans. Biomed. Eng. 2005, 52, 486–494. [Google Scholar] [CrossRef] [PubMed]
- Seel, T.; Raisch, J.; Schauer, T. IMU-based joint angle measurement for gait analysis. Sensors 2014, 14, 6891–6909. [Google Scholar] [CrossRef] [PubMed]
- Moufawad El Achkar, C.; Lenoble-Hoskovec, C.; Paraschiv-Ionescu, A.; Major, K.; Büla, C.; Aminian, K. Physical behavior in older persons during daily life: Insights from instrumented shoes. Sensors 2016, 16, 1225. [Google Scholar] [CrossRef]
- Schlachetzki, J.C.M.; Barth, J.; Marxreiter, F.; Gossler, J.; Kohl, Z.; Reinfelder, S.; Gassner, H.; Aminian, K.; Eskofier, B.M.; Winkler, J.; et al. Wearable sensors objectively measure gait parameters in Parkinson’s disease. PLoS ONE 2017, 12, e0183989. [Google Scholar] [CrossRef]
- Zijlstra, W.; Hof, A.L. Assessment of spatio-temporal gait parameters from trunk accelerations during human walking. Gait Posture 2003, 18, 1–10. [Google Scholar] [CrossRef]
- Trojaniello, D.; Cereatti, A.; Pelosin, E.; Avanzino, L.; Mirelman, A.; Hausdorff, J.M.; Della Croce, U. Estimation of step-by-step spatio-temporal parameters of normal and impaired gait using shank-mounted magneto-inertial sensors: Application to elderly, hemiparetic, parkinsonian and choreic gait. J. Neuroeng. Rehabil. 2014, 11, 152. [Google Scholar] [CrossRef] [PubMed]
- Meng, H.; O’Connor, D.P.; Lee, B.C.; Layne, C.S.; Gorniak, S.L. Alterations in over-ground walking patterns in obese and overweight adults. Gait Posture 2017, 53, 65–68. [Google Scholar] [CrossRef] [PubMed]
- Tadano, S.; Takeda, R.; Miyagawa, H. Three dimensional gait analysis using wearable acceleration and gyro sensors based on quaternion calculations. Sensors 2013, 13, 9321–9343. [Google Scholar] [CrossRef] [PubMed]
- Takeda, R.; Lisco, G.; Fujisawa, T.; Gastaldi, L.; Tohyama, H.; Tadano, S. Drift Removal for Improving the Accuracy of Gait Parameters Using Wearable Sensor Systems. Sensors 2014, 14, 23230–23247. [Google Scholar] [CrossRef] [PubMed]
- Agostini, V.; Gastaldi, L.; Rosso, V.; Knaflitz, M.; Tadano, S. A wearable magneto-inertial system for gait analysis (H-gait): Validation on normalweight and overweight/obese young healthy adults. Sensors 2017, 17, 2406. [Google Scholar] [CrossRef] [PubMed]
- Gastaldi, L.; Rosso, V.; Gabola, V.; Agostini, V.; Frutos, M.M.L.; Knaflitz, M.; Takeda, R.; Tadano, S. Technical challenges using magneto-inertial sensors for gait analysis. In Proceedings of the 2016 IEEE International Symposium on Medical Measurements and Applications (MeMeA), Benevento, Italy, 15–18 May 2016; pp. 274–279. [Google Scholar]
- Takeda, R.; Tadano, S.; Natorigawa, A.; Todoh, M.; Yoshinari, S. Gait posture estimation using wearable acceleration and gyro sensors. J. Biomech. 2009, 42, 2486–2494. [Google Scholar] [CrossRef] [PubMed]
- Rosso, V.; Gastaldi, L.; Agostini, V.; Takeda, R.; Tadano, S. Gait measurements in the transverse plane using a wearable system: An experimental study of test-retest reliability. In Proceedings of the I2MTC 2017 IEEE International Instrumentation and Measurement Technology Conference, Turin, Italy, 22–25 May 2017. [Google Scholar]
- Spyropoulos, P.; Pisciotta, J.C.; Pavlou, K.N.; Cairns, M.A.; Simon, S.R. Biomechanical gait analysis in obese men. Arch. Phys. Med. Rehabil. 1991, 72, 1065–1070. [Google Scholar]
- DeVita, P.; Hortobágyi, T. Obesity is not associated with increased knee joint torque and power during level walking. J. Biomech. 2003, 36, 1355–1362. [Google Scholar] [CrossRef]
- Wearing, S.C.; Hennig, E.M.; Byrne, N.M.; Steele, J.R.; Hills, A.P. The biomechanics of restricted movement in adult obesity. Obes. Rev. 2006, 7, 13–24. [Google Scholar] [CrossRef]
- Lai, P.P.K.; Leung, A.K.L.; Li, A.N.M.; Zhang, M. Three-dimensional gait analysis of obese adults. Clin. Biomech. 2008, 23, S2–S6. [Google Scholar] [CrossRef]
- Browning, R.C.; Baker, E.A.; Herron, J.A.; Kram, R. Effects of obesity and sex on the energetic cost and preferred speed of walking. J. Appl. Physiol. 2006, 100, 390–398. [Google Scholar] [CrossRef] [PubMed]
- Browning, R.C.; Kram, R. Energetic cost and preferred speed of walking in obese vs. normal weight women. Obes. Res. 2005, 13, 891–899. [Google Scholar] [CrossRef] [PubMed]
- Westlake, C.G.; Milner, C.E.; Zhang, S.; Fitzhugh, E.C. Do thigh circumference and mass changes alter knee biomechanics during walking? Gait Posture 2013, 37, 359–362. [Google Scholar] [CrossRef] [PubMed]
- Cho, S.H.; Park, J.M.; Kwon, O.Y. Gender differences in three dimensional gait analysis data from 98 healthy Korean adults. Clin. Biomech. 2004, 191, 145–152. [Google Scholar] [CrossRef] [PubMed]
- Freedman Silvernail, J.; Milner, C.E.; Thompson, D.; Zhang, S.; Zhao, X. The influence of body mass index and velocity on knee biomechanics during walking. Gait Posture 2013, 37, 575–579. [Google Scholar] [CrossRef] [PubMed]
- Messier, S.P.; Davies, A.B.; Moore, D.T.; Davis, S.E.; Pack, R.J.; Kazmar, S.C. Severe obesity: Effects on foot mechanics during walking. Foot Ankle Int. 1994, 15, 29–34. [Google Scholar] [CrossRef] [PubMed]
- Sharma, L.; Lou, C.; Cahue, S.; Dunlop, D.D. The mechanism of the effect of obesity in knee osteoarthritis: The mediating role of malalignment. Arthritis Rheum. 2000, 43, 568–575. [Google Scholar] [CrossRef]
- Laughton, C.A.; Slavin, M.; Katdare, K.; Nolan, L.; Bean, J.F.; Kerrigan, D.C.; Phillips, E.; Lipsitz, L.A.; Collins, J.J. Aging, muscle activity, and balance control: Physiologic changes associated with balance impairment. Gait Posture 2003, 18, 101–108. [Google Scholar] [CrossRef]
- Molina-Garcia, P.; Migueles, J.H.; Cadenas-Sanchez, C.; Esteban-Cornejo, I.; Mora-Gonzalez, J.; Rodriguez-Ayllon, M.; Plaza-Florido, A.; Vanrenterghem, J.; Ortega, F.B. A systematic review on biomechanical characteristics of walking in children and adolescents with overweight/obesity: Possible implications for the development of musculoskeletal disorders. Obes. Rev. 2019, 20, 1033–1044. [Google Scholar] [CrossRef]
- Robert-Lachaine, X.; Mecheri, H.; Larue, C.; Plamondon, A. Validation of inertial measurement units with an optoelectronic system for whole-body motion analysis. Med. Biol. Eng. Comput. 2017, 55, 609–619. [Google Scholar] [CrossRef]
© 2019 by the authors. Licensee MDPI, Basel, Switzerland. This article is an open access article distributed under the terms and conditions of the Creative Commons Attribution (CC BY) license (http://creativecommons.org/licenses/by/4.0/).