“What Is a Step?” Differences in How a Step Is Detected among Three Popular Activity Monitors That Have Impacted Physical Activity Research


Abstract
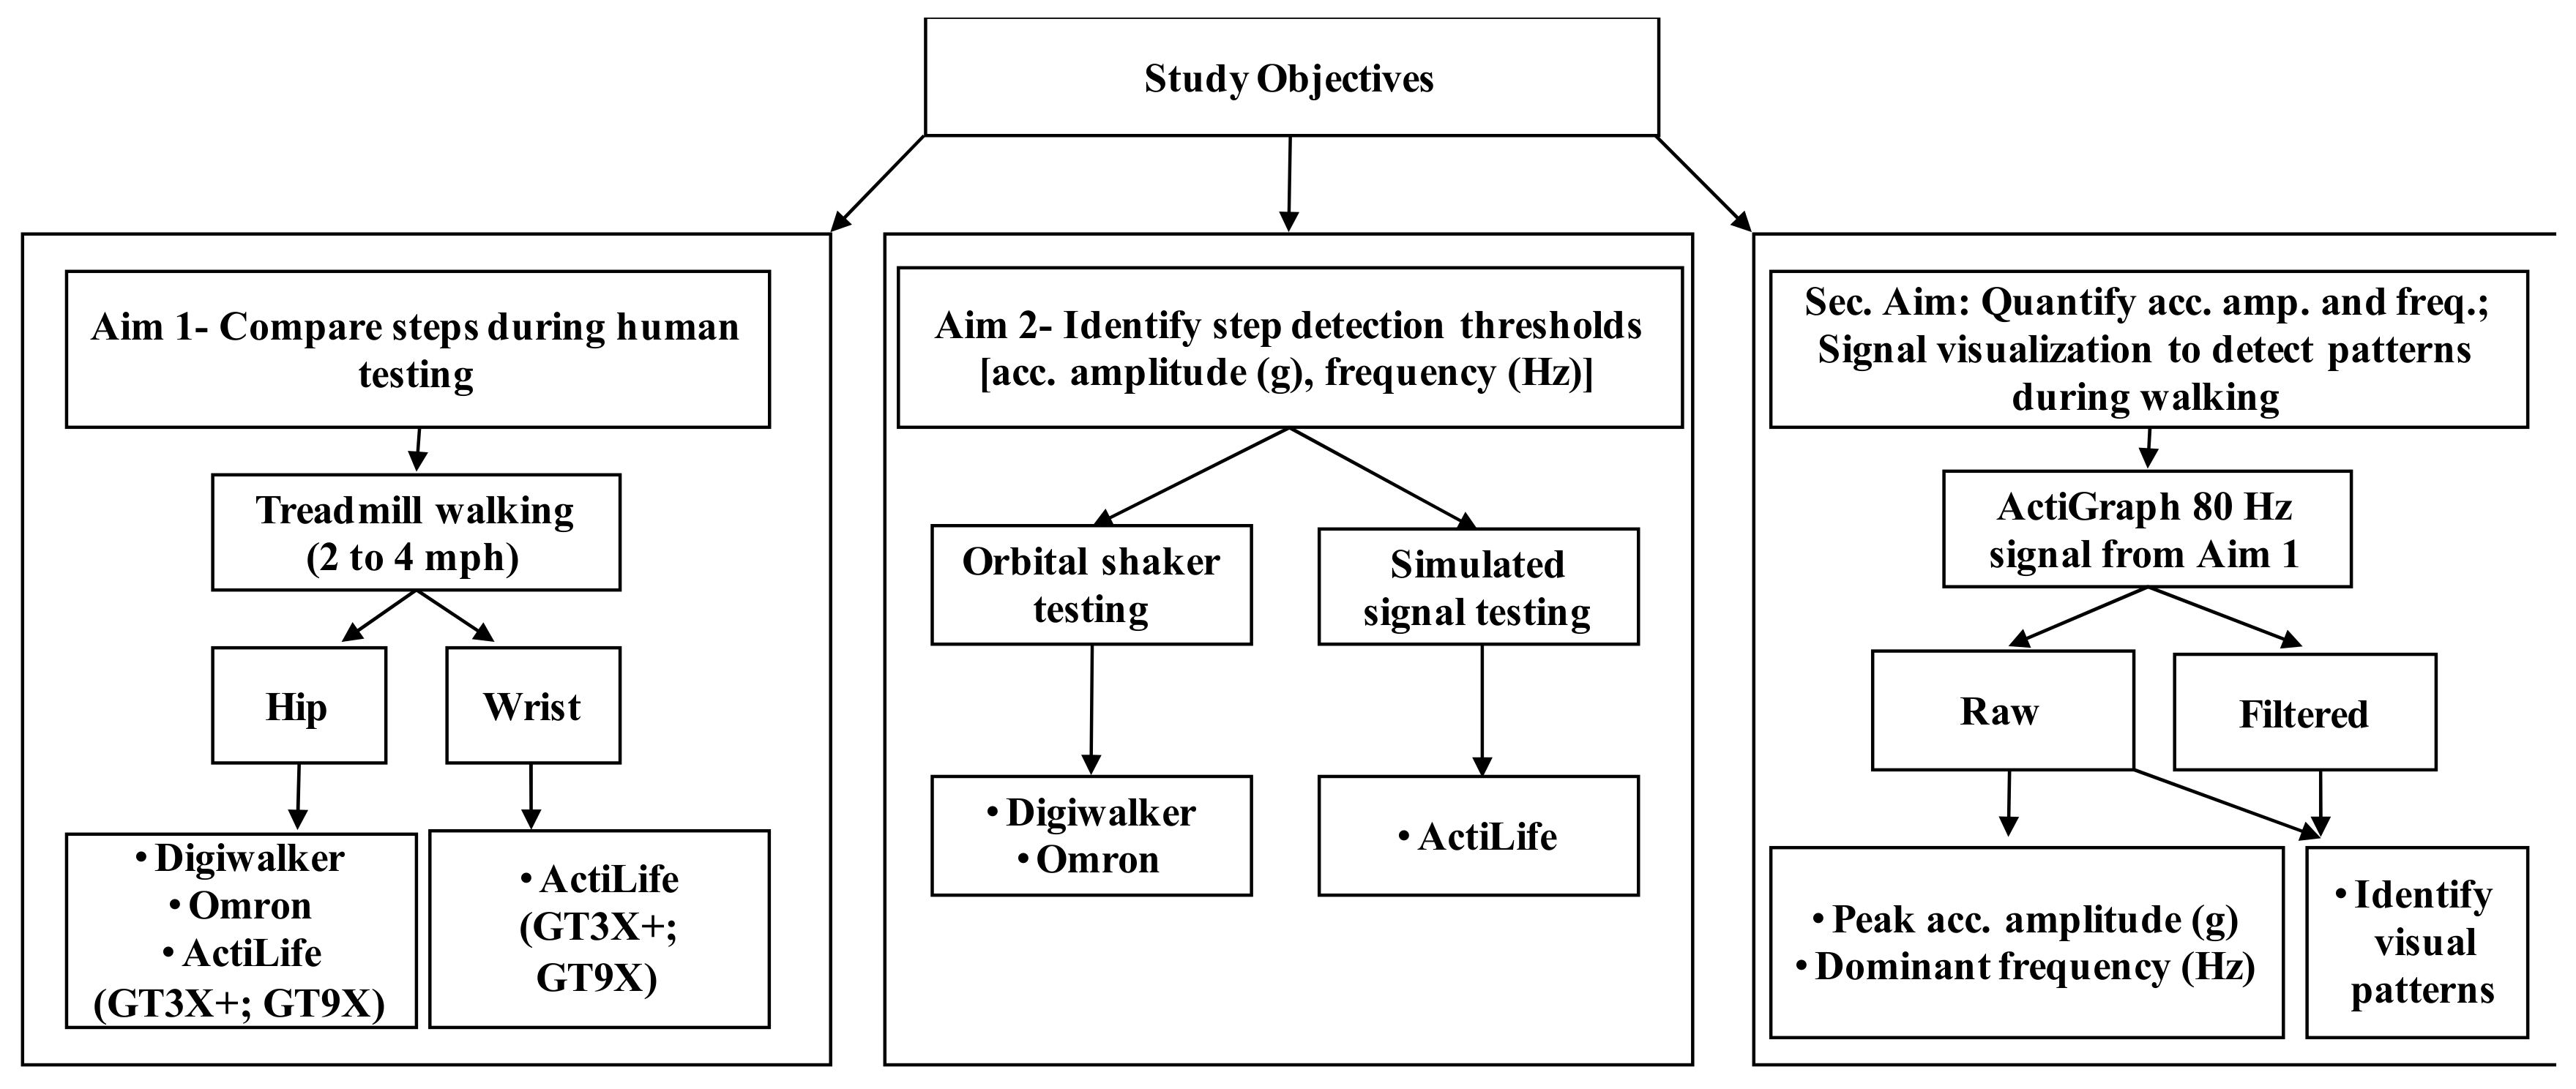
1. Introduction
2. Materials and Methods
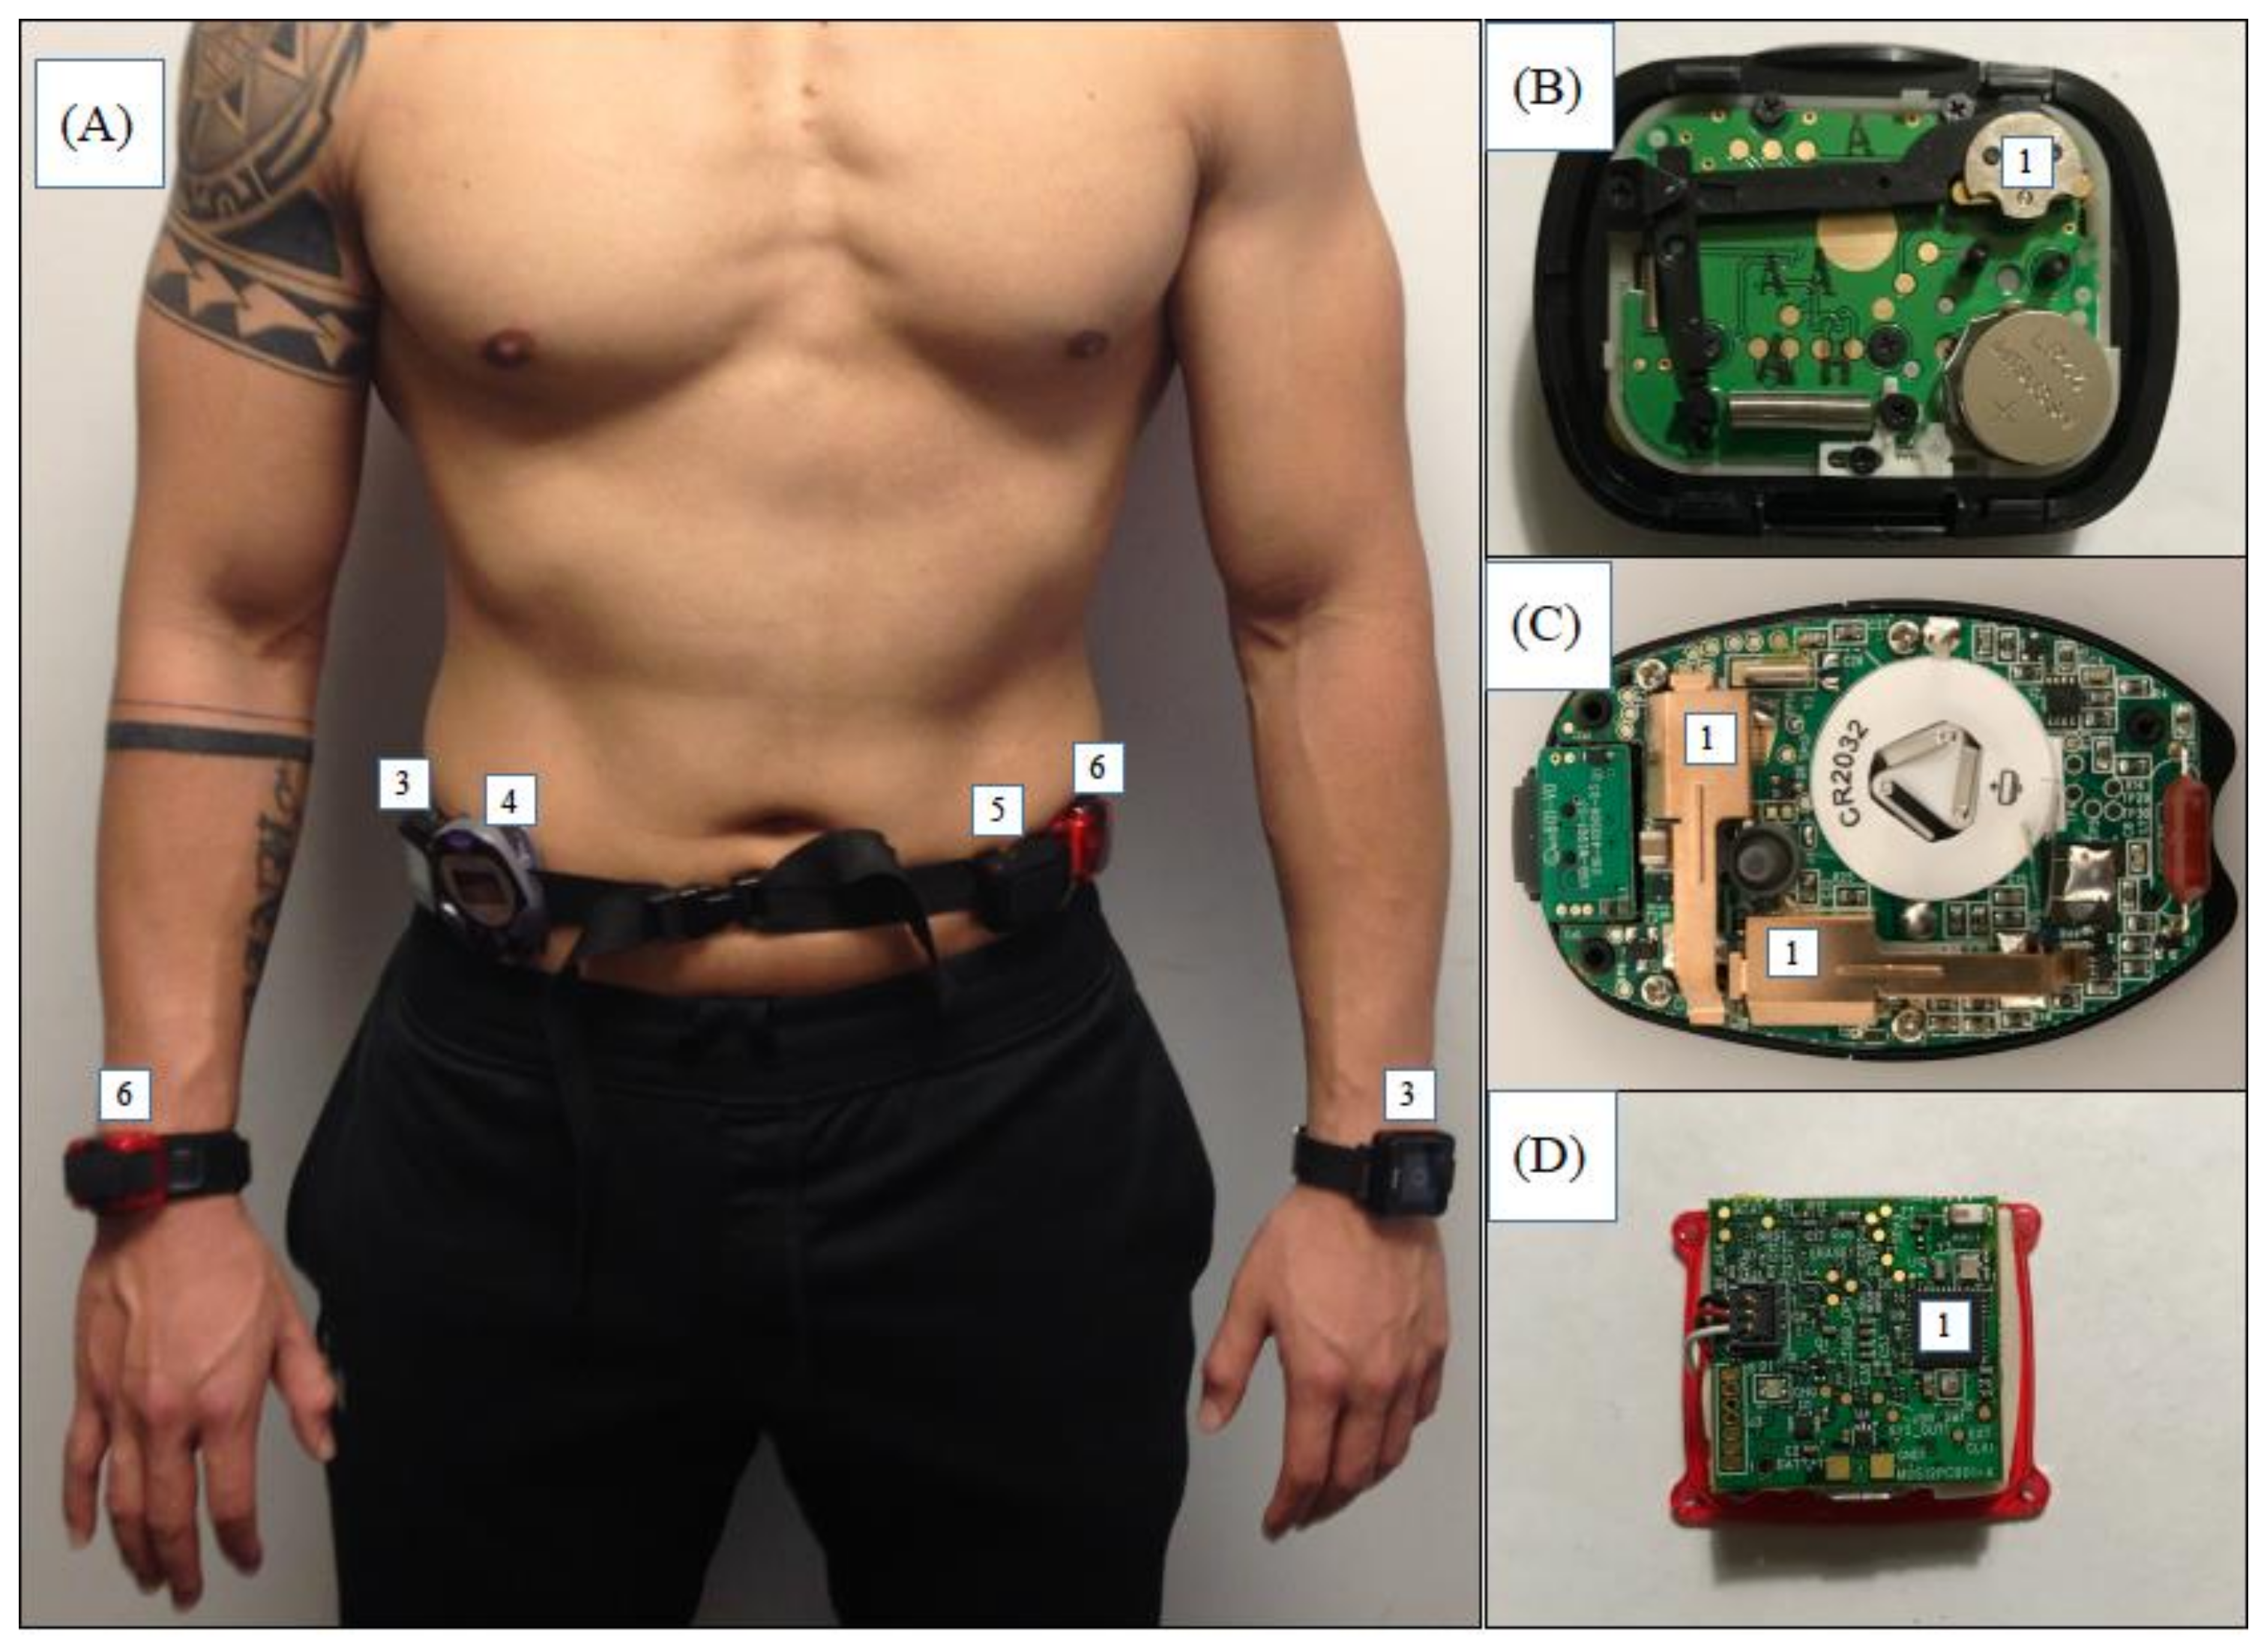
2.1. Devices
2.2. Aim 1—Human Treadmill Testing
2.3. Aim 2—Testing to Examine Step-Detection Thresholds for Acceleration Amplitude (g) and Frequency (Hz)
2.3.1. Shaker Testing (Omron HJ720ITC and Digiwalker SW200)
2.3.2. Simulated Sinusoidal Signal Testing for ActiGraph
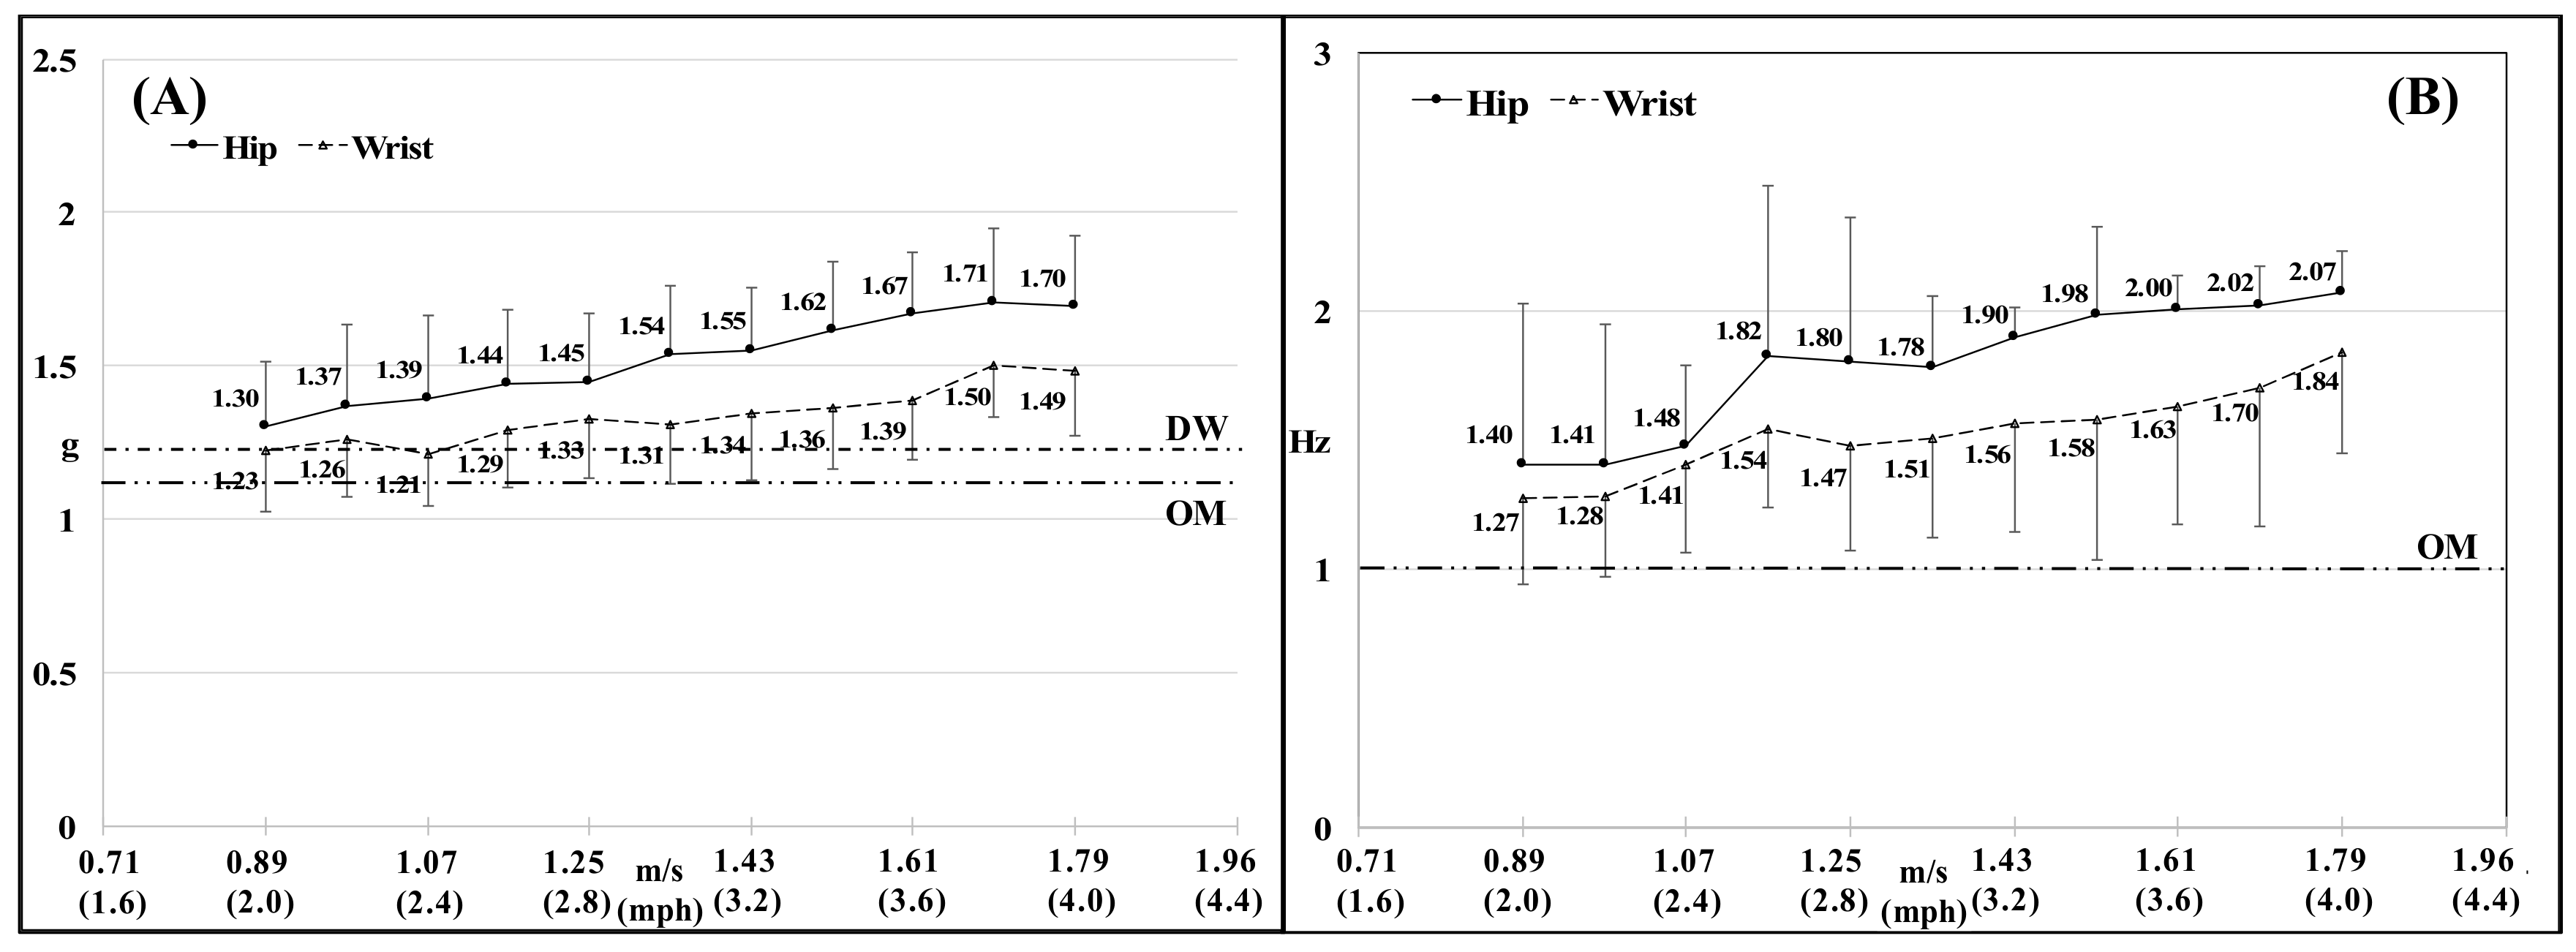
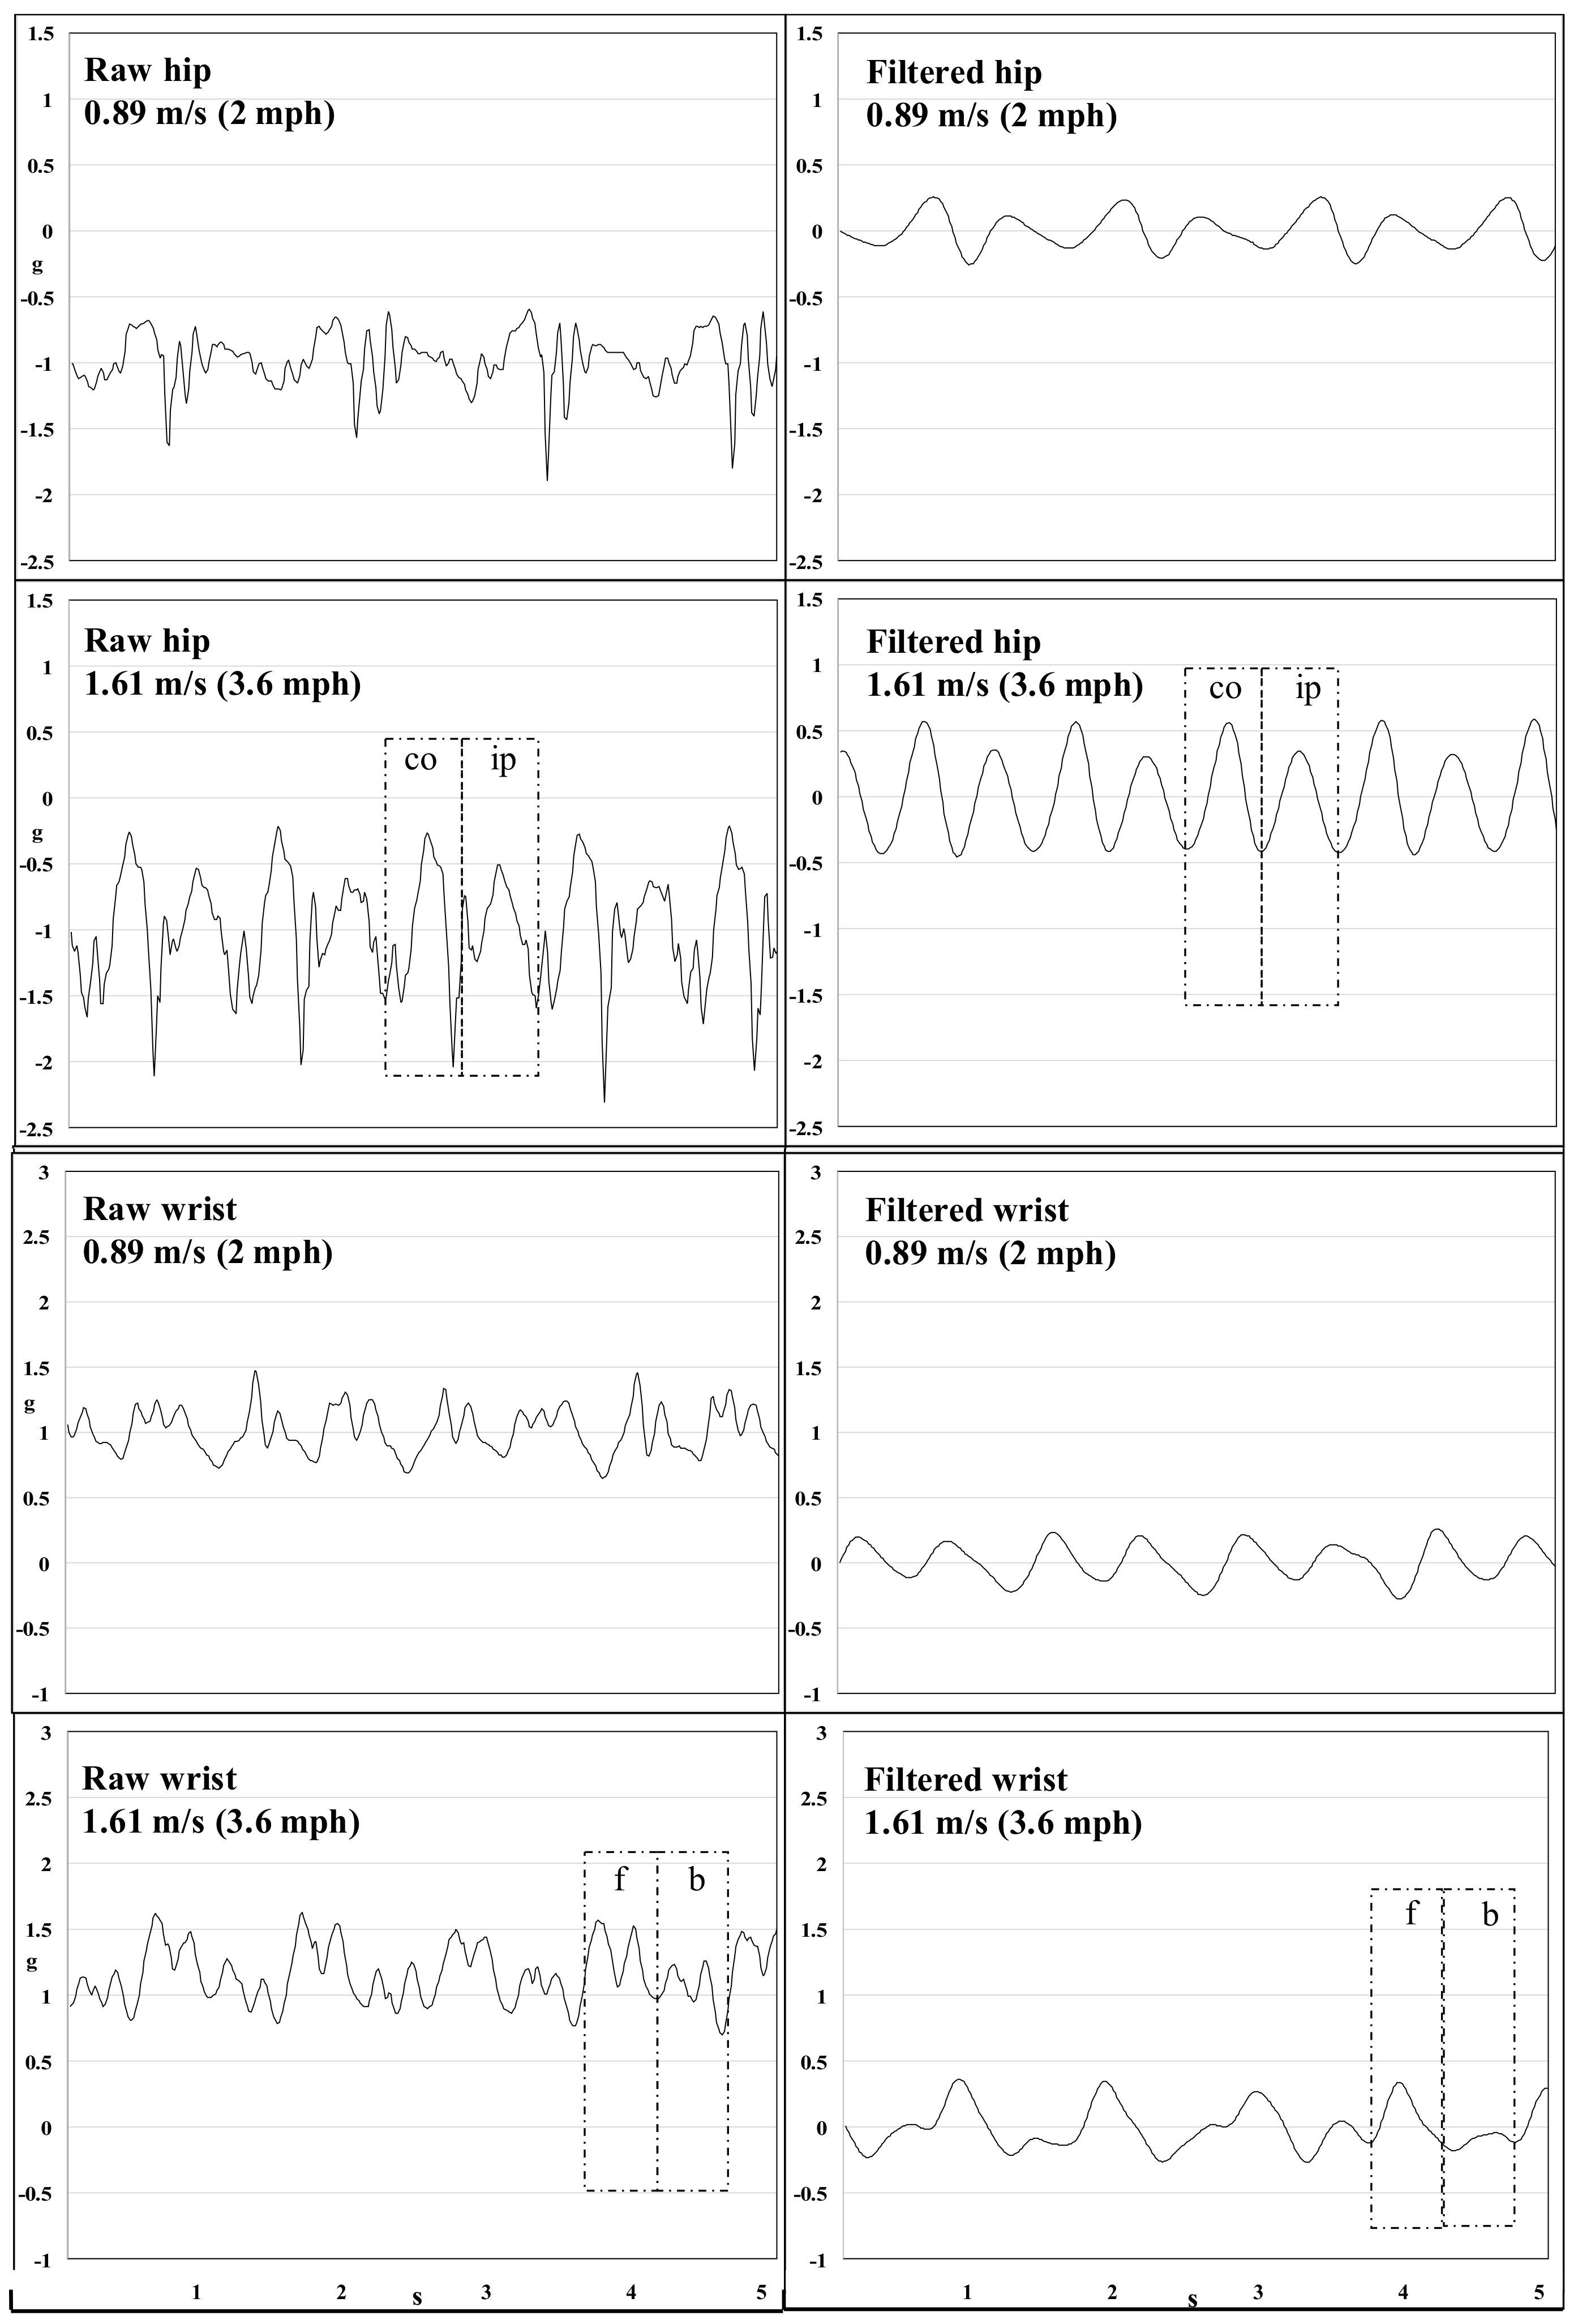
2.4. Secondary Aim—Quantifying Selected Signal Features and Analysis of Acceleration Waveforms (Raw/Filtered) during Treadmill Walking
2.5. Data Analyses
3. Results
3.1. Aim 1–Human Treadmill Testing
3.2. Aim 2–Testing to Examine Step-Count Thresholds for Acceleration Amplitude (g) and Frequency (Hz)
3.2.1. Digiwalker SW200
3.2.2. Omron HJ720ITC
3.2.3. ActiGraph’s ActiLife Algorithm
3.3. Secondary Aim-Quantifying Selected Signal Features and Visual Analysis of Acceleration Waveforms (Raw/Filtered) during Treadmill Walking
4. Discussion
4.1. Aims 1 and 2—Human Treadmill Testing and Examining Step-Count Thresholds for Acceleration Amplitude (g) and Frequency (Hz)
4.1.1. Digiwalker SW200
4.1.2. Omron HJ720ITC
4.1.3. ActiLife
4.2. Secondary Aim—Quantifying Selected Signal Features and Visual Analysis of Acceleration Waveforms (Raw/Filtered) during Treadmill Walking
4.3. Strengths and Limitations
5. Conclusions
- The Digiwalker SW200 has a movement acceleration step-detection threshold of 0.21 g.
- The Omron HJ720ITC detects a step when movement acceleration peak is ≥ 0.10 g, but only when the dominant frequency of the signal is ≥ 1 Hz. The ActiLife algorithm primarily relies on thresholding of the band-pass filtered acceleration signal from a single axis. A step is detected only when the signal has a zero-crossing and crosses both a positive and negative threshold on either side of the zero-crossing.
- ○
- Step-detection threshold for the ActiGraph’s ActiLife algorithm is variable based on signal frequency due to signal filtering.
- ○
- Our findings suggest that current step-detection strategies in ActiLife may be invalid for step detection using devices worn at both the hip and the wrist.
5.1. Implications of Variability in Proprietary Step-Detection Parameters
5.2. Outlook for the Future
Supplementary Materials
Author Contributions
Conflicts of Interest
References
- Bravata, D.M.; Smith-Spangler, C.; Sundaram, V.; Gienger, A.L.; Lin, N.; Lewis, R.; Stave, C.D.; Olkin, I.; Sirard, J.R. Using pedometers to increase physical activity and improve health: A systematic review. JAMA 2007, 298, 2296–2304. [Google Scholar] [CrossRef] [PubMed]
- Crouter, S.E.; Schneider, P.L.; Karabulut, M.; Bassett, D.R., Jr. Validity of 10 electronic pedometers for measuring steps, distance, and energy cost. Med. Sci. Sports Exerc. 2003, 35, 1455–1460. [Google Scholar] [CrossRef] [PubMed]
- Hickey, A.; John, D.; Sasaki, J.E.; Mavilia, M.; Freedson, P. Validity of Activity Monitor Step Detection Is Related to Movement Patterns. J. Phys. Act. Health 2016, 13, 145–153. [Google Scholar] [CrossRef] [PubMed]
- Schneider, P.L.; Crouter, S.; Bassett, D.R. Pedometer measures of free-living physical activity: Comparison of 13 models. Med. Sci. Sports Exerc. 2004, 36, 331–335. [Google Scholar] [CrossRef] [PubMed]
- Tyo, B.M.; Fitzhugh, E.C.; Bassett, D.R., Jr.; John, D.; Feito, Y.; Thompson, D.L. Effects of body mass index and step rate on pedometer error in a free-living environment. Med. Sci. Sports Exerc. 2011, 43, 350–356. [Google Scholar] [CrossRef] [PubMed]
- Lee, K.Y.; Macfarlane, D.; Cerin, E. Do three different generations of the Actigraph accelerometer provide the same output? Med. Sci. Sports Exerc. 2010, 42, 476. [Google Scholar] [CrossRef]
- Lohne-Seiler, H.; Hansen, B.H.; Kolle, E.; Anderssen, S.A. Accelerometer-determined physical activity and self-reported health in a population of older adults (65–85 years): A cross-sectional study. BMC Public Health 2014, 14, 284. [Google Scholar] [CrossRef] [PubMed]
- Tudor-Locke, C.; Barreira, T.V.; Schuna, J.M., Jr. Comparison of step outputs for waist and wrist accelerometer attachment sites. Med. Sci. Sports Exerc. 2015, 47, 839–842. [Google Scholar] [CrossRef] [PubMed]
- Clark, B.K.; Healy, G.N.; Winkler, E.A.; Gardiner, P.A.; Sugiyama, T.; Dunstan, D.W.; Matthews, C.E.; Owen, N. Relationship of television time with accelerometer-derived sedentary time: NHANES. Med. Sci. Sports Exerc. 2011, 43, 822–828. [Google Scholar] [CrossRef] [PubMed]
- Healy, G.N.; Matthews, C.E.; Dunstan, D.W.; Winkler, E.A.; Owen, N. Sedentary time and cardio-metabolic biomarkers in US adults: NHANES 2003-06. Eur. Heart J. 2011, 32, 590–597. [Google Scholar] [CrossRef] [PubMed]
- Wolff-Hughes, D.L.; Fitzhugh, E.C.; Bassett, D.R.; Churilla, J.R. Total Activity Counts and Bouted Minutes of Moderate-to-Vigorous Physical Activity: Relationships with Cardiometabolic Biomarkers Using 2003–2006 NHANES. J. Phys. Act. Health 2015, 12, 694–700. [Google Scholar] [CrossRef] [PubMed]
- Troiano, R.P.; McClain, J.J.; Brychta, R.J.; Chen, K.Y. Evolution of accelerometer methods for physical activity research. Br. J. Sports Med. 2014, 48, 1019–1023. [Google Scholar] [CrossRef] [PubMed]
- Hatano, Y. Prevalence and use of pedometer. Res. J. Walk. 1997, 1, 45–54. [Google Scholar]
- Hatano, Y. Use of the pedometer for promoting daily walking exercise. Int. Counc. Health Phys. Educ. Recreat. 1997, 29, 4–8. [Google Scholar]
- Yamanouchi, K.; Shinozaki, T.; Chikada, K.; Nishikawa, T.; Ito, K.; Shimizu, S.; Ozawa, N.; Suzuki, Y.; Maeno, H.; Kato, K. Daily walking combined with diet therapy is a useful means for obese NIDDM patients not only to reduce body weight but also to improve insulin sensitivity. Diabetes Care 1995, 18, 775–778. [Google Scholar] [CrossRef] [PubMed]
- De Craemer, M.; Lateva, M.; Iotova, V.; De Decker, E.; Verloigne, M.; De Bourdeaudhuij, I.; Androutsos, O.; Socha, P.; Kulaga, Z.; Moreno, L.; et al. Differences in energy balance-related behaviours in European preschool children: The ToyBox-study. PLoS ONE 2015, 10, e0118303. [Google Scholar] [CrossRef] [PubMed]
- Duncan, M.J.; Birch, S.L.; Eyre, E.; Bryant, E.; Rutten, C.; Boen, F.; Seghers, J. Comparisons in ambulatory physical activity in children from the United Kingdom and Belgium. Ann. Hum. Biol. 2015, 42, 290–292. [Google Scholar] [CrossRef] [PubMed]
- Matthiessen, J.; Andersen, E.W.; Raustorp, A.; Knudsen, V.K.; Sorensen, M.R. Reduction in pedometer-determined physical activity in the adult Danish population from 2007 to 2012. Scand. J. Public Health 2015, 43, 525–533. [Google Scholar] [CrossRef] [PubMed]
- Pelclova, J.; Fromel, K.; Repka, E.; Blaha, L.; Suchomel, A.; Fojtik, I.; Feltlova, D.; Valach, P.; Horak, S.; Nykodym, J.; et al. Is Pedometer-Determined Physical Activity Decreasing in Czech Adults? Findings from 2008 to 2013. Int. J. Environ. Res. Public Health 2016, 13, 1040. [Google Scholar] [CrossRef] [PubMed]
- Tudor-Locke, C.; Johnson, W.D.; Katzmarzyk, P.T. Accelerometer-determined steps per day in US adults. Med. Sci. Sports Exerc. 2009, 41, 1384–1391. [Google Scholar] [CrossRef] [PubMed]
- Pahor, M.; Guralnik, J.M.; Ambrosius, W.T.; Blair, S.; Bonds, D.E.; Church, T.S.; Espeland, M.A.; Fielding, R.A.; Gill, T.M.; Groessl, E.J.; et al. Effect of structured physical activity on prevention of major mobility disability in older adults: The LIFE study randomized clinical trial. JAMA 2014, 311, 2387–2396. [Google Scholar] [CrossRef] [PubMed]
- Piette, J.D.; Richardson, C.; Himle, J.; Duffy, S.; Torres, T.; Vogel, M.; Barber, K.; Valenstein, M. A randomized trial of telephonic counseling plus walking for depressed diabetes patients. Med. Care 2011, 49, 641–648. [Google Scholar] [CrossRef] [PubMed]
- Sigal, R.J.; Kenny, G.P.; Boule, N.G.; Wells, G.A.; Prud’homme, D.; Fortier, M.; Reid, R.D.; Tulloch, H.; Coyle, D.; Phillips, P.; et al. Effects of aerobic training, resistance training, or both on glycemic control in type 2 diabetes: A randomized trial. Ann. Intern. Med. 2007, 147, 357–369. [Google Scholar] [CrossRef] [PubMed]
- John, D.; Freedson, P. ActiGraph and Actical physical activity monitors: A peek under the hood. Med. Sci. Sports Exerc. 2012, 44 (Suppl. S1), S86–S89. [Google Scholar] [CrossRef] [PubMed]
- Brond, J.C.; Andersen, L.B.; Arvidsson, D. Generating ActiGraph Counts from Raw Acceleration Recorded by an Alternative Monitor. Med. Sci. Sports Exerc. 2017, 49, 2351–2360. [Google Scholar] [CrossRef] [PubMed]
- Brond, J.C.; Arvidsson, D. Sampling frequency affects the processing of Actigraph raw acceleration data to activity counts. J. Appl. Physiol. 2016, 120, 362–369. [Google Scholar] [CrossRef] [PubMed]
- Tryon, W.W.; Williams, R. Fully proportional actigraphy: A new instrument. Behav. Res. Methods 1996, 28, 392–403. [Google Scholar] [CrossRef]
- John, D.; Miller, R.; Kozey-Keadle, S.; Caldwell, G.; Freedson, P. Biomechanical examination of the ‘plateau phenomenon’ in ActiGraph vertical activity counts. Physiol. Meas. 2012, 33, 219–230. [Google Scholar] [CrossRef] [PubMed]
- John, D.; Sasaki, J.; Staudenmayer, J.; Mavilia, M.; Freedson, P.S. Comparison of raw acceleration from the GENEA and ActiGraph GT3X+ activity monitors. Sensors 2013, 13, 14754–14763. [Google Scholar] [CrossRef] [PubMed]
- Tudor-Locke, C.; Ainsworth, B.E.; Thompson, R.W.; Matthews, C.E. Comparison of pedometer and accelerometer measures of free-living physical activity. Med. Sci. Sports Exerc. 2002, 34, 2045–2051. [Google Scholar] [CrossRef] [PubMed]
- Jehn, M.; Schmidt-Trucksaess, A.; Schuster, T.; Hanssen, H.; Weis, M.; Halle, M.; Koehler, F. Accelerometer-based quantification of 6-minute walk test performance in patients with chronic heart failure: Applicability in telemedicine. J. Card. Fail. 2009, 15, 334–340. [Google Scholar] [CrossRef] [PubMed]
- Nguyen, J. (ActiGraph LLC., Pensacola FL. USA). Personal communication, 2017.
- Browning, R.C.; Baker, E.A.; Herron, J.A.; Kram, R. Effects of obesity and sex on the energetic cost and preferred speed of walking. J. Appl. Physiol. 2006, 100, 390–398. [Google Scholar] [CrossRef] [PubMed]
- Rose, J.; Ralston, J.; Gamble, G. Energetics of walking. In Human Walking; Rose, J., Gamble, J.G., Eds.; Williams & Wilkins: Baltimore, MD, USA, 1994; pp. 45–72. [Google Scholar]
- Hasson, R.E.; Haller, J.; Pober, D.M.; Staudenmayer, J.; Freedson, P.S. Validity of the Omron HJ-112 pedometer during treadmill walking. Med. Sci. Sports Exerc. 2009, 41, 805–809. [Google Scholar] [CrossRef] [PubMed]
- Lee, J.A.; Williams, S.M.; Brown, D.D.; Laurson, K.R. Concurrent validation of the Actigraph gt3x+, Polar Active accelerometer, Omron HJ-720 and Yamax Digiwalker SW-701 pedometer step counts in lab-based and free-living settings. J. Sports Sci. 2015, 33, 991–1000. [Google Scholar] [CrossRef] [PubMed]
- Feito, Y.; Bassett, D.R.; Thompson, D.L. Evaluation of activity monitors in controlled and free-living environments. Med. Sci. Sports Exerc. 2012, 44, 733–741. [Google Scholar] [CrossRef] [PubMed]
- Silcott, N.A.; Bassett, D.R., Jr.; Thompson, D.L.; Fitzhugh, E.C.; Steeves, J.A. Evaluation of the Omron HJ-720ITC pedometer under free-living conditions. Med. Sci. Sports Exerc. 2011, 43, 1791–1797. [Google Scholar] [CrossRef] [PubMed]
- Dall, P.M.; McCrorie, P.R.; Granat, M.H.; Stansfield, B.W. Step accumulation per minute epoch is not the same as cadence for free-living adults. Med. Sci. Sports Exerc. 2013, 45, 1995–2001. [Google Scholar] [CrossRef] [PubMed]
- Orendurff, M.S.; Schoen, J.A.; Bernatz, G.C.; Segal, A.D.; Klute, G.K. How humans walk: Bout duration, steps per bout, and rest duration. J. Rehabil. Res. Dev. 2008, 45, 1077–1089. [Google Scholar] [CrossRef] [PubMed]
- Bassett, D.R., Jr.; Wyatt, H.R.; Thompson, H.; Peters, J.C.; Hill, J.O. Pedometer-measured physical activity and health behaviors in U.S. adults. Med. Sci. Sports Exerc. 2010, 42, 1819–1825. [Google Scholar] [CrossRef] [PubMed]
- Althoff, T.; Sosic, R.; Hicks, J.L.; King, A.C.; Delp, S.L.; Leskovec, J. Large-scale physical activity data reveal worldwide activity inequality. Nature 2017, 547, 336–339. [Google Scholar] [CrossRef] [PubMed]
- Fitbit Selected for National Institutes of Health (NIH) Precision Medicine Research Program with the Scripps Research Institute (TSRI). Available online: https://investor.fitbit.com/press/press-releases/press-release-details/2017/Fitbit-Selected-for-National-Institutes-of-Health-NIH-Precision-Medicine-Research-Program-with-The-Scripps-Research-Institute-TSRI/default.aspx (accessed on 24th March 2018).
- Lee, B.; John, D. “How ‘bout Them Apples?” Validating Step Counts From The Apple Watch: 1350 Board# 25 June 1 9. Med. Sci. Sports Exerc. 2017, 49, 365. [Google Scholar]
- Toth, L.P.; Park, S.; Springer, C.M.; Feyerabend, M.; Steeves, J.A.; Bassett, D.R. Video-Recorded Validation of Wearable Step Counters under Free-living Conditions. Med. Sci. Sports Exerc. 2018. [Google Scholar] [CrossRef] [PubMed]
- Lee, B.; Arguello, D.; John, D. Validity of the Fitbit Blaze and the Apple watch during 19 different activities and in the free-living environment. J. Meas. Phys. Behav. 2018, unpublished work. [Google Scholar]


| Speed [m/s (mph)] | Criterion | Omron | Digiwalker | GT3X+ Hip | GT9X Hip | GT3X+ Wrist | GT9X Wrist | ||||||
|---|---|---|---|---|---|---|---|---|---|---|---|---|---|
| Mean (SD) | Mean (SD) | Bias (95% CI) | Mean (SD) | Bias (95% CI) | Mean (SD) | Bias (95% CI) | Mean (SD) | Bias (95% CI) | Mean (SD) | Bias (95% CI) | Mean (SD) | Bias (95% CI) | |
| 0.89 (2.0) | 98 (13) | 93 (31) | 5 (−8, 17) | 77 (34) | 21 (7, 34) | 58 (19) | 39 (29, 49) | 43 (19) | 58 (50, 67) | 53 (17) | 46 (38, 54) | 31 (14) | 68 (60, 77) |
| 0.98 (2.2) | 101 (10) | 95 (22) | 6 (−5, 17) | 85 (29) | 15 (4, 27) | 72 (19) | 28 (17, 38) | 42 (22) | 63 (52, 74) | 68 (15) | 38 (29, 47) | 37 (18) | 66 (57, 74) |
| 1.07 (2.4) | 104 (10) | 102 (13) | 1 (−2, 5) | 96 (22) | 8 (−1, 16) | 85 (18) | 18 (9, 27) | 45 (21) | 62 (53, 72) | 74 (17) | 38 (27, 48) | 40 (15) | 66 (58, 73) |
| 1.16 (2.6) | 108 (9) | 106 (14) | 2 (−1, 5) | 100 (22) | 8 (1, 15) | 90 (20) | 18 (8, 28) | 46 (21) | 64 (55, 73) | 77 (20) | 32 (21, 43) | 41 (15) | 68 (61, 74) |
| 1.25 (2.8) | 112 (9) | 112 (11) | 1 (−2, 3) | 103 (28) | 9 (−2, 21) | 97 (15) | 15 (7, 22) | 48 (23) | 66 (55, 76) | 79 (19) | 35 (24, 46) | 46 (13) | 68 (60, 76) |
| 1.34 (3.0) | 115(10) | 117 (14) | −3 (−7, 2) | 112 (11) | 2.4 (1, 5) | 104 (10) | 11 (6, 15) | 53 (25) | 64 (53, 75) | 82 (24) | 39 (26, 53) | 50 (12) | 67 (61, 74) |
| 1.43 (3.2) | 117 (8) | 117 (10) | 0 (−3, 3) | 116 (10) | 2 (−1, 3) | 109 (8) | 8 (5, 11) | 56 (27) | 63 (51, 75) | 85 (23) | 38 (25, 51) | 52 (13) | 68 (62, 74) |
| 1.52 (3.4) | 122 (10) | 126 (20) | −5 (−11, 2) | 119 (12) | 2 (−1, 5) | 112 (8) | 9 (5, 13) | 64 (28) | 60 (48, 73) | 88 (26) | 41 (27, 55) | 55 (12) | 69 (61, 76) |
| 1.61 (3.6) | 124 (9) | 121 (9) | 3 (1, 5) | 122 (10) | 2 (−1, 4) | 115 (8) | 10 (7, 12) | 69 (27) | 58 (45, 70) | 89 (24) | 43 (31, 56) | 59 (11) | 68 (62, 74) |
| 1.70 (3.8) | 128 (9) | 126 (9) | 2 (−1, 5) | 127 (10) | 1 (−1, 4) | 118 (7) | 10 (6, 15) | 75 (28) | 56 (41, 70) | 97 (26) | 41 (25, 56) | 59 (12) | 71 (65, 77) |
| 1.79 (4.0) | 130 (9) | 127 (10) | 3 (1, 5) | 128 (11) | 2 (−1, 3) | 119 (9) | 11 (7, 15) | 78 (27) | 55 (42, 68) | 99 (24) | 42 (28, 56) | 61 (12) | 72 (65, 78) |
| Device | Radius= 2.1 cm | Radius= 2.6 cm | Radius= 4.5 cm | Radius= 12 cm | ||||||||
|---|---|---|---|---|---|---|---|---|---|---|---|---|
| Freq. [rpm (Hz)] | Steps | Acc. (g) | Freq. [rpm (Hz)] | Steps | Acc. (g) | Freq. [rpm (Hz)] | Steps | Acc. (g) | Freq. [rpm (Hz)] | Steps | Acc. (g) | |
| Omron | 58 (0.97) | 0 | 0.08 | 58 (0.97) | 0 | 0.10 | 58 (0.97) | 0 | 0.17 | 27 (0.45) | 0 | 0.09 |
| 60 (1.00) | 0 | 0.09 | 59 (0.98) | 0 | 0.10 | 59 (0.98) | 0 | 0.18 | 28 (0.47) | 0 | 0.11 | |
| 66 (1.10) | 19 ± 3 | 0.10 | 60 (1.00) | 10 ± 5 | 0.10 | 60 (1.00) | 31 ± 4 | 0.18 | 59 (0.98) | 0 | 0.46 | |
| 67 (1.11) | 36 ± 6 | 0.11 | 61 (1.01) | 53 ± 8 | 0.11 | 61 (1.01) | 61 ± 1 | 0.19 | 60 (1.00) | 34 ± 4 | 0.48 | |
| 68 (1.13) | 67 ± 1 | 0.11 | 62 (1.03) | 63 ± 1 | 0.11 | 62 (1.03) | 63 ± 1 | 0.19 | 61 (1.01) | 61 ± 1 | 0.50 | |
| 70 (1.17) | 71 ± 2 | 0.12 | 70 (1.17) | 70 ± 1 | 0.14 | 70 (1.17) | 70 ± 1 | 0.25 | 70 (1.17) | 71 ± 1 | 0.65 | |
| Digiwalker | 224 (3.73) | 0 | 1.17 | 201 (3.35) | 0 | 1.17 | 152 (2.53) | 0 | 1.16 | 90 (1.50) | 0 | 1.08 |
| 225 (3.75) | 0 | 1.18 | 202 (3.37) | 0 | 1.18 | 153 (2.55) | 0 | 1.17 | 92 (1.53) | 0 | 1.14 | |
| 226 (3.77) | 0 | 1.19 | 203 (3.38) | 0 | 1.19 | 154 (2.57) | 0 | 1.19 | 94 (1.57) | 0 | 1.18 | |
| 227 (3.78) | 23 ± 6 | 1.21 | 204 (3.40) | 23 ± 5 | 1.21 | 155 (2.58) | 14 ± 2 | 1.21 | 95 (1.58) | 20 ± 7 | 1.21 | |
| 228 (3.80) | 228 ± 2 | 1.22 | 205 (3.42) | 204 ± 2 | 1.22 | 156 (2.60) | 155 ± 4 | 1.22 | 96 (1.60) | 96 ± 1 | 1.23 | |
| 230 (3.83) | 231 ± 4 | 1.24 | 207 (3.45) | 207 ± 2 | 1.24 | 158 (2.63) | 157 ± 2 | 1.25 | 98 (1.63) | 98 ± 1 | 1.29 | |
| Freq. (Hz.) | 0.06 g | 0.07 g | 0.08 g | 0.09 g | 0.1 g | 0.11 g | 0.12 g | 0.13 g | 0.14 g | 0.15 g | 0.16 g | 0.17 g | 0.18 g |
|---|---|---|---|---|---|---|---|---|---|---|---|---|---|
| 0.2 | 0 | 0 | 0 | 0 | 0 | 0 | 0 | 0 | 0 | x | x | x | x |
| 0.4 | 0 | 0 | 0 | x | x | x | x | x | x | x | x | x | x |
| 0.6 | 0 | x | x | x | x | x | x | x | x | x | x | x | x |
| 0.8 | 0 | x | x | x | x | x | x | x | x | x | x | x | x |
| 1.0 | 0 | 0 | x | x | x | x | x | x | x | x | x | x | x |
| 1.2 | 0 | 0 | x | x | x | x | x | x | x | x | x | x | x |
| 1.4 | 0 | 0 | 0 | x | x | x | x | x | x | x | x | x | x |
| 1.6 | 0 | 0 | 0 | 0 | x | x | x | x | x | x | x | x | x |
| 1.8 | 0 | 0 | 0 | 0 | 0 | x | x | x | x | x | x | x | x |
| 2.0 | 0 | 0 | 0 | 0 | 0 | 0 | 0 | x | x | x | x | x | x |
| 2.2 | 0 | 0 | 0 | 0 | 0 | 0 | 0 | 0 | 0 | x | x | x | x |
| 2.4 | 0 | 0 | 0 | 0 | 0 | 0 | 0 | 0 | 0 | 0 | 0 | x | x |
© 2018 by the authors. Licensee MDPI, Basel, Switzerland. This article is an open access article distributed under the terms and conditions of the Creative Commons Attribution (CC BY) license (http://creativecommons.org/licenses/by/4.0/).
Share and Cite
John, D.; Morton, A.; Arguello, D.; Lyden, K.; Bassett, D. “What Is a Step?” Differences in How a Step Is Detected among Three Popular Activity Monitors That Have Impacted Physical Activity Research. Sensors 2018, 18, 1206. https://doi.org/10.3390/s18041206
John D, Morton A, Arguello D, Lyden K, Bassett D. “What Is a Step?” Differences in How a Step Is Detected among Three Popular Activity Monitors That Have Impacted Physical Activity Research. Sensors. 2018; 18(4):1206. https://doi.org/10.3390/s18041206
Chicago/Turabian StyleJohn, Dinesh, Alvin Morton, Diego Arguello, Kate Lyden, and David Bassett. 2018. "“What Is a Step?” Differences in How a Step Is Detected among Three Popular Activity Monitors That Have Impacted Physical Activity Research" Sensors 18, no. 4: 1206. https://doi.org/10.3390/s18041206
APA StyleJohn, D., Morton, A., Arguello, D., Lyden, K., & Bassett, D. (2018). “What Is a Step?” Differences in How a Step Is Detected among Three Popular Activity Monitors That Have Impacted Physical Activity Research. Sensors, 18(4), 1206. https://doi.org/10.3390/s18041206