
Constructing an Intelligent Model Based on Support Vector Regression to Simulate the Solubility of Drugs in Polymeric Media

 ,
,  , ,
, ,  and
and
Abstract
:1. Introduction
- (a)
- Introduces the most general model to estimate the solubility of drugs in polymers.
- (b)
- Saves time and money by replacing experimental analysis with a straightforward model.
- (c)
- Offers a route for choosing the most suitable polymer for the ASD scenario.
- (d)
- Provides the polymer–drug solubility data for monitoring the solution stability.
2. Data Collection
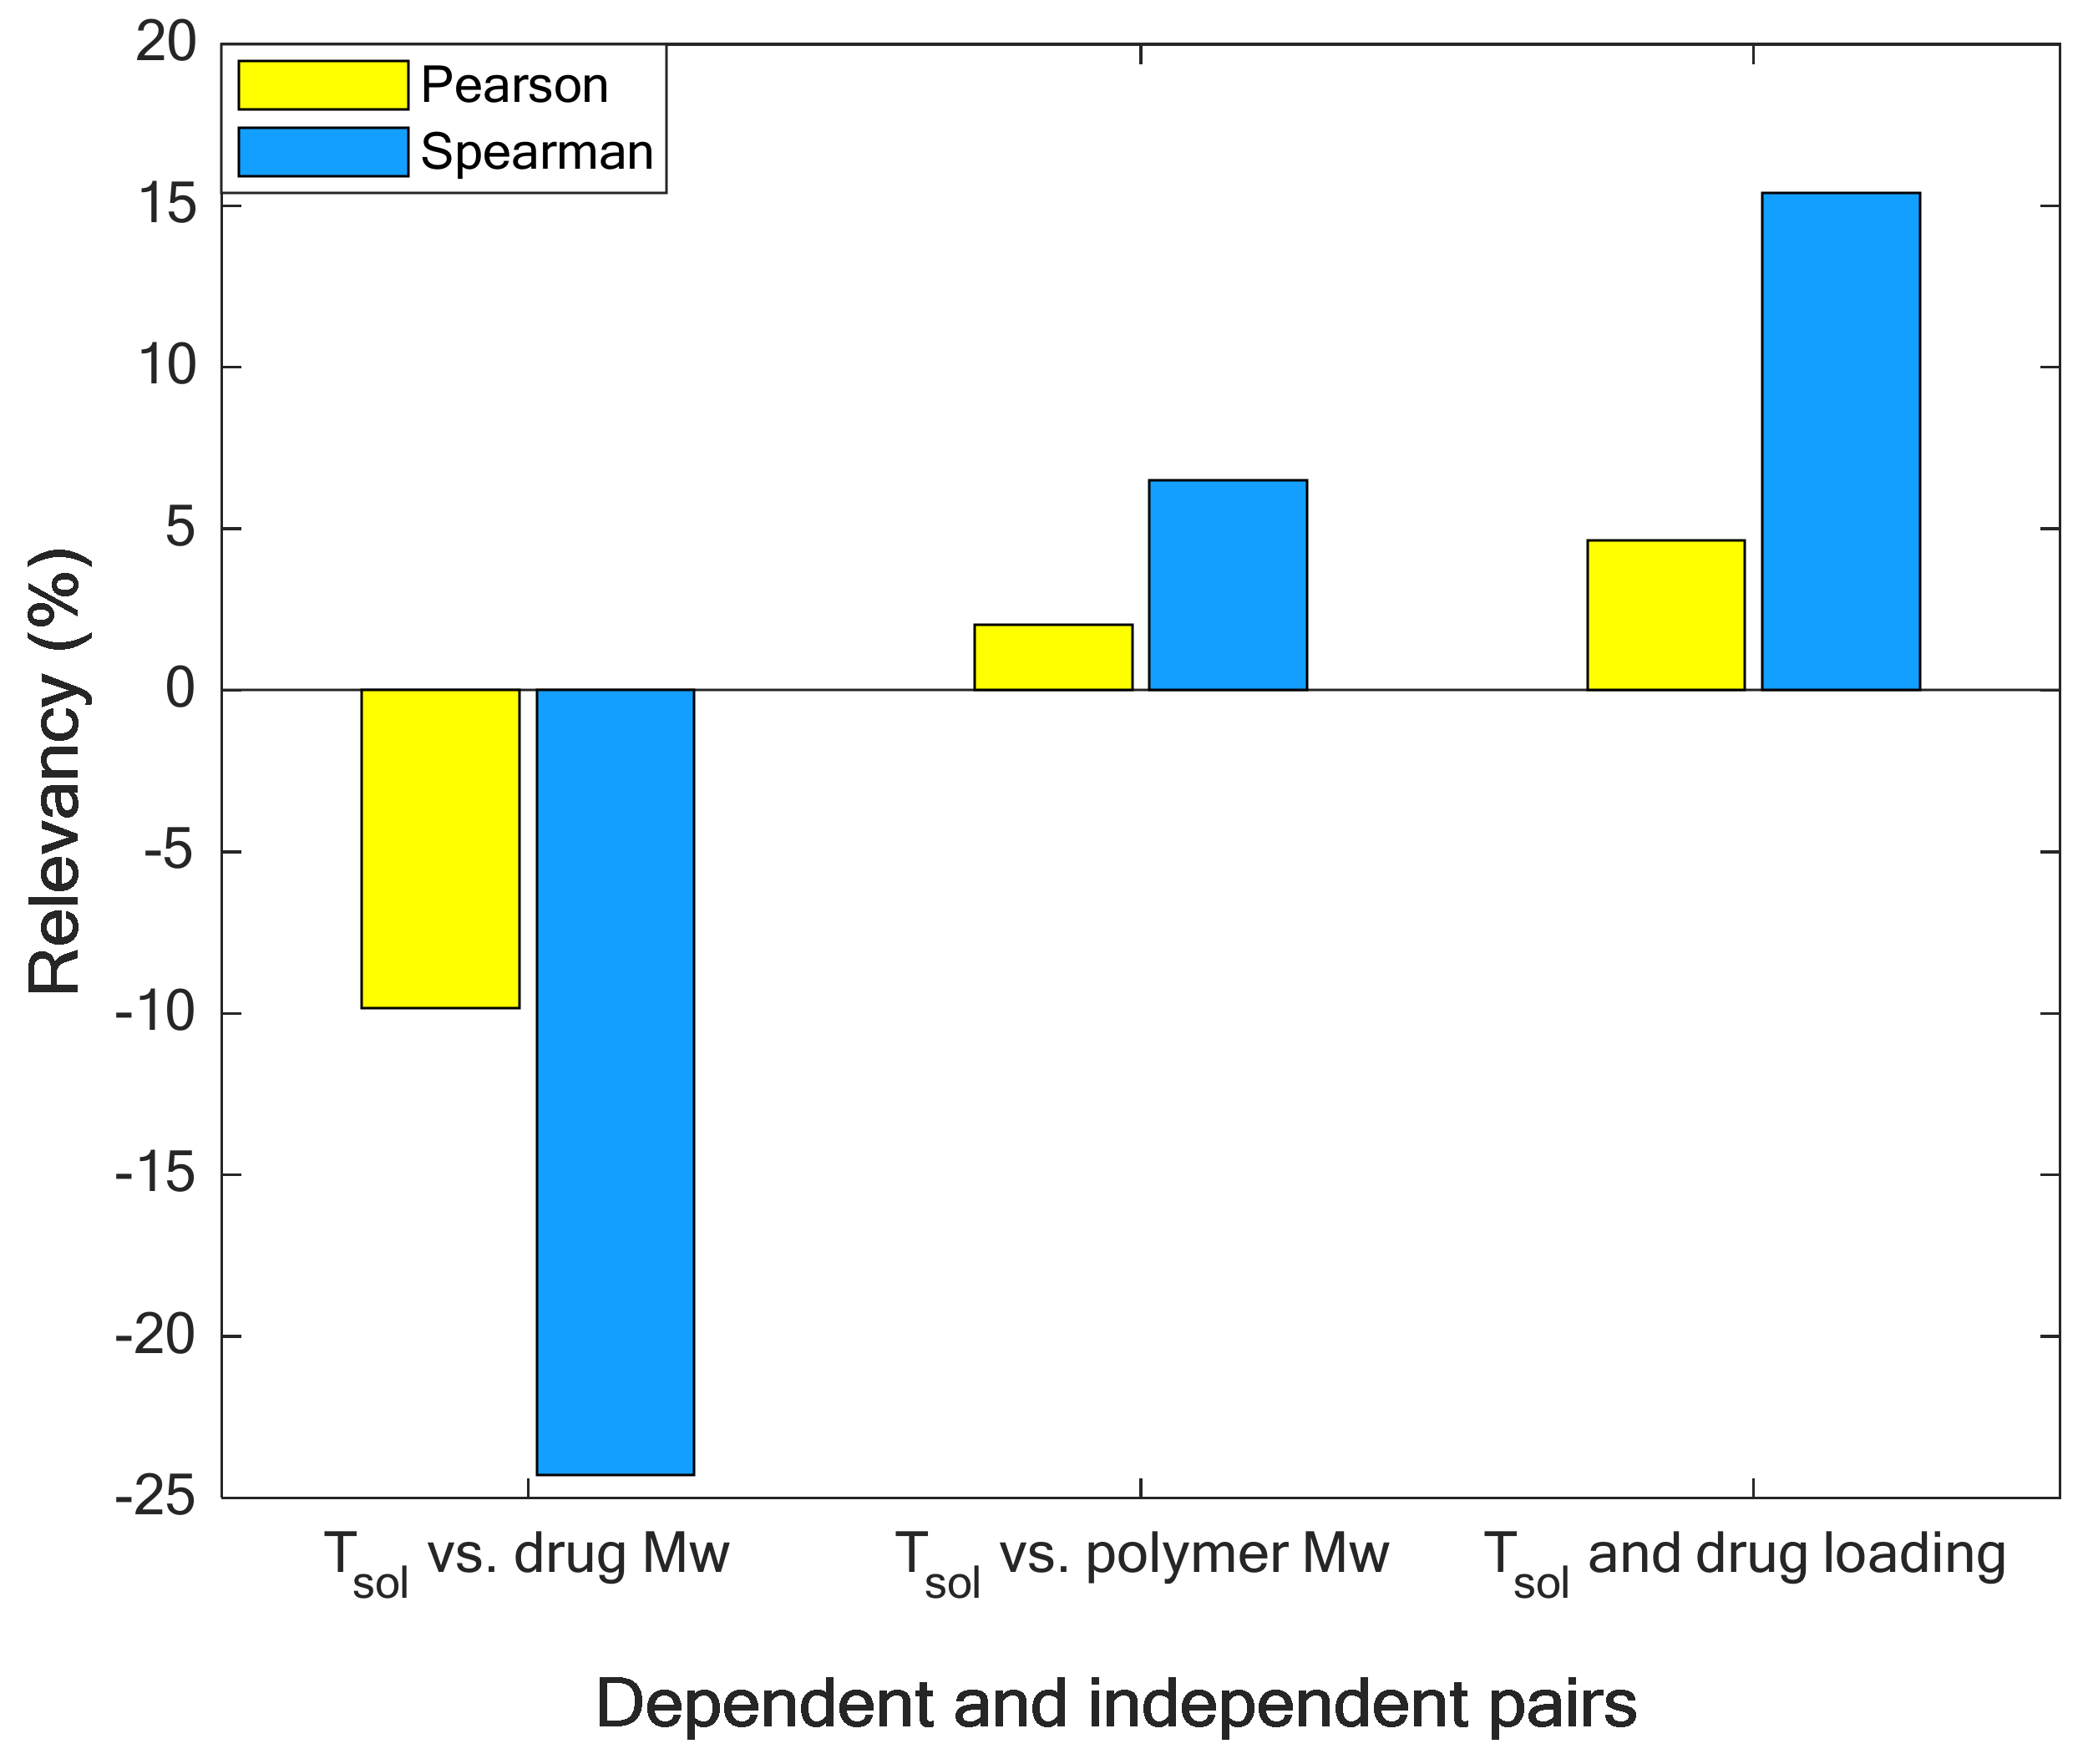
Relevancy Analysis
3. LS-SVR Description
4. Results and Discussions
4.1. Constructing the LS-SVR Model
4.2. Selecting the Best LS-SVR
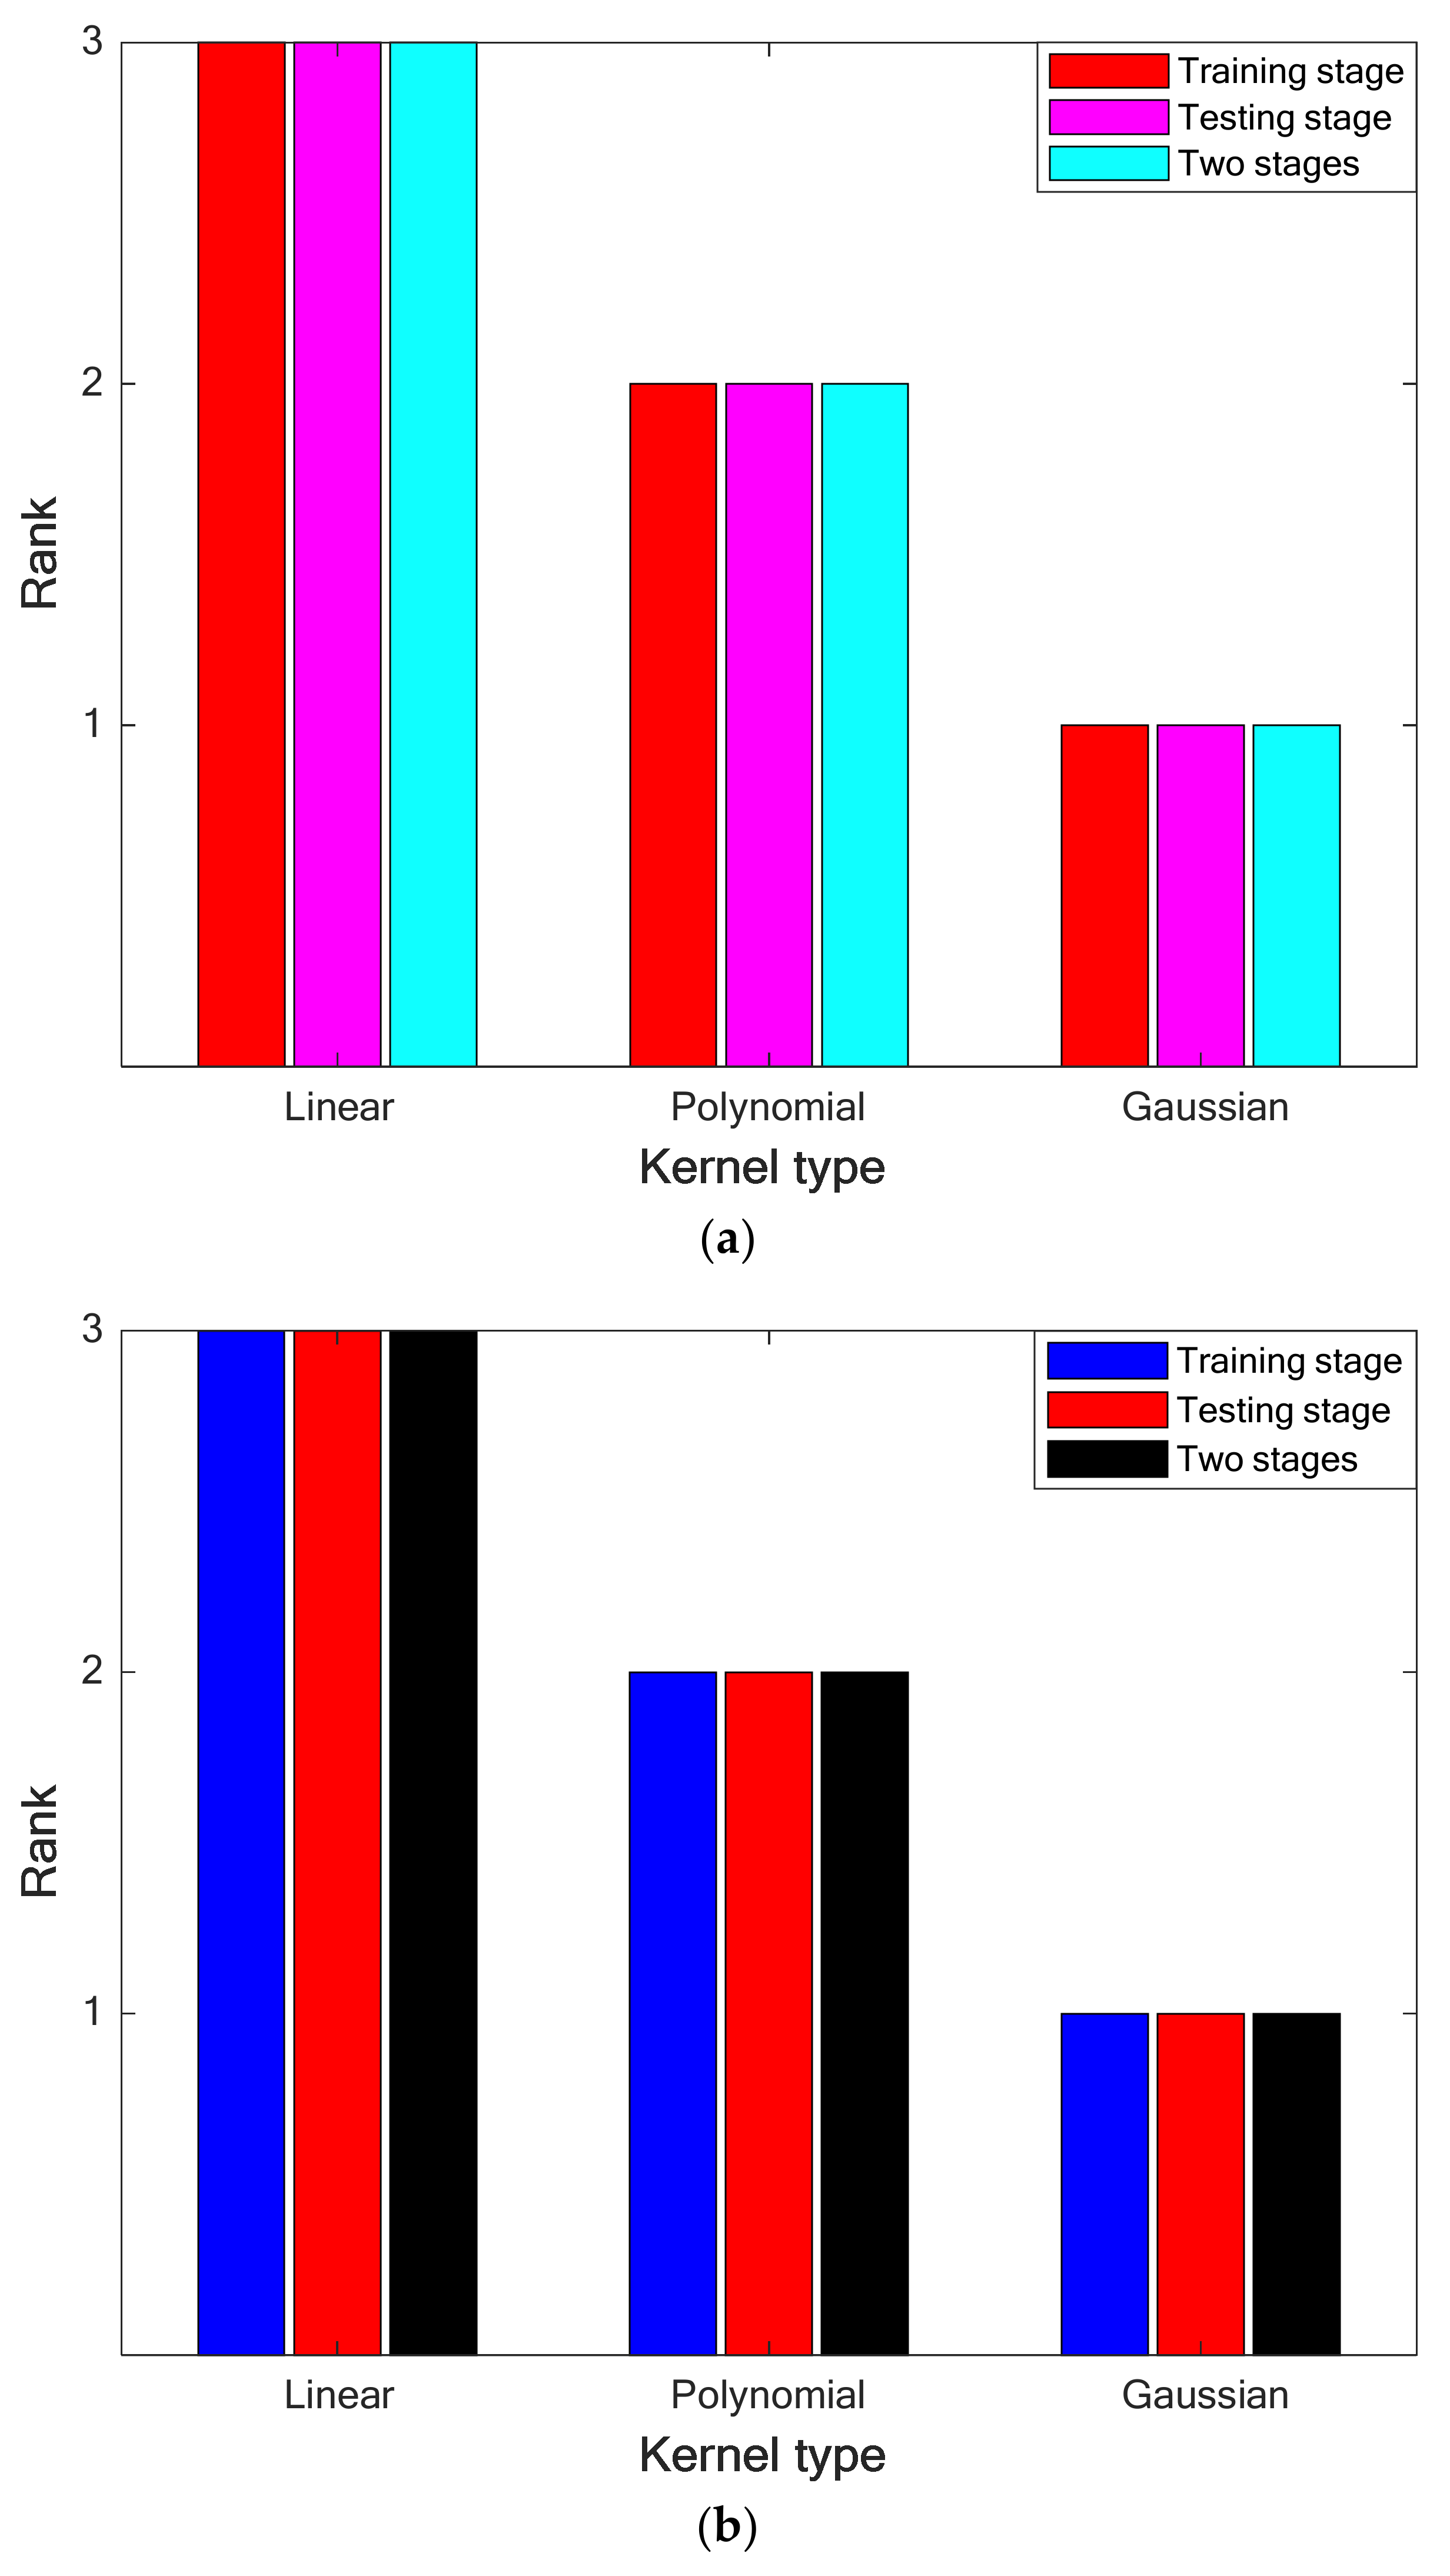
4.2.1. Selecting the Best Kernel Function
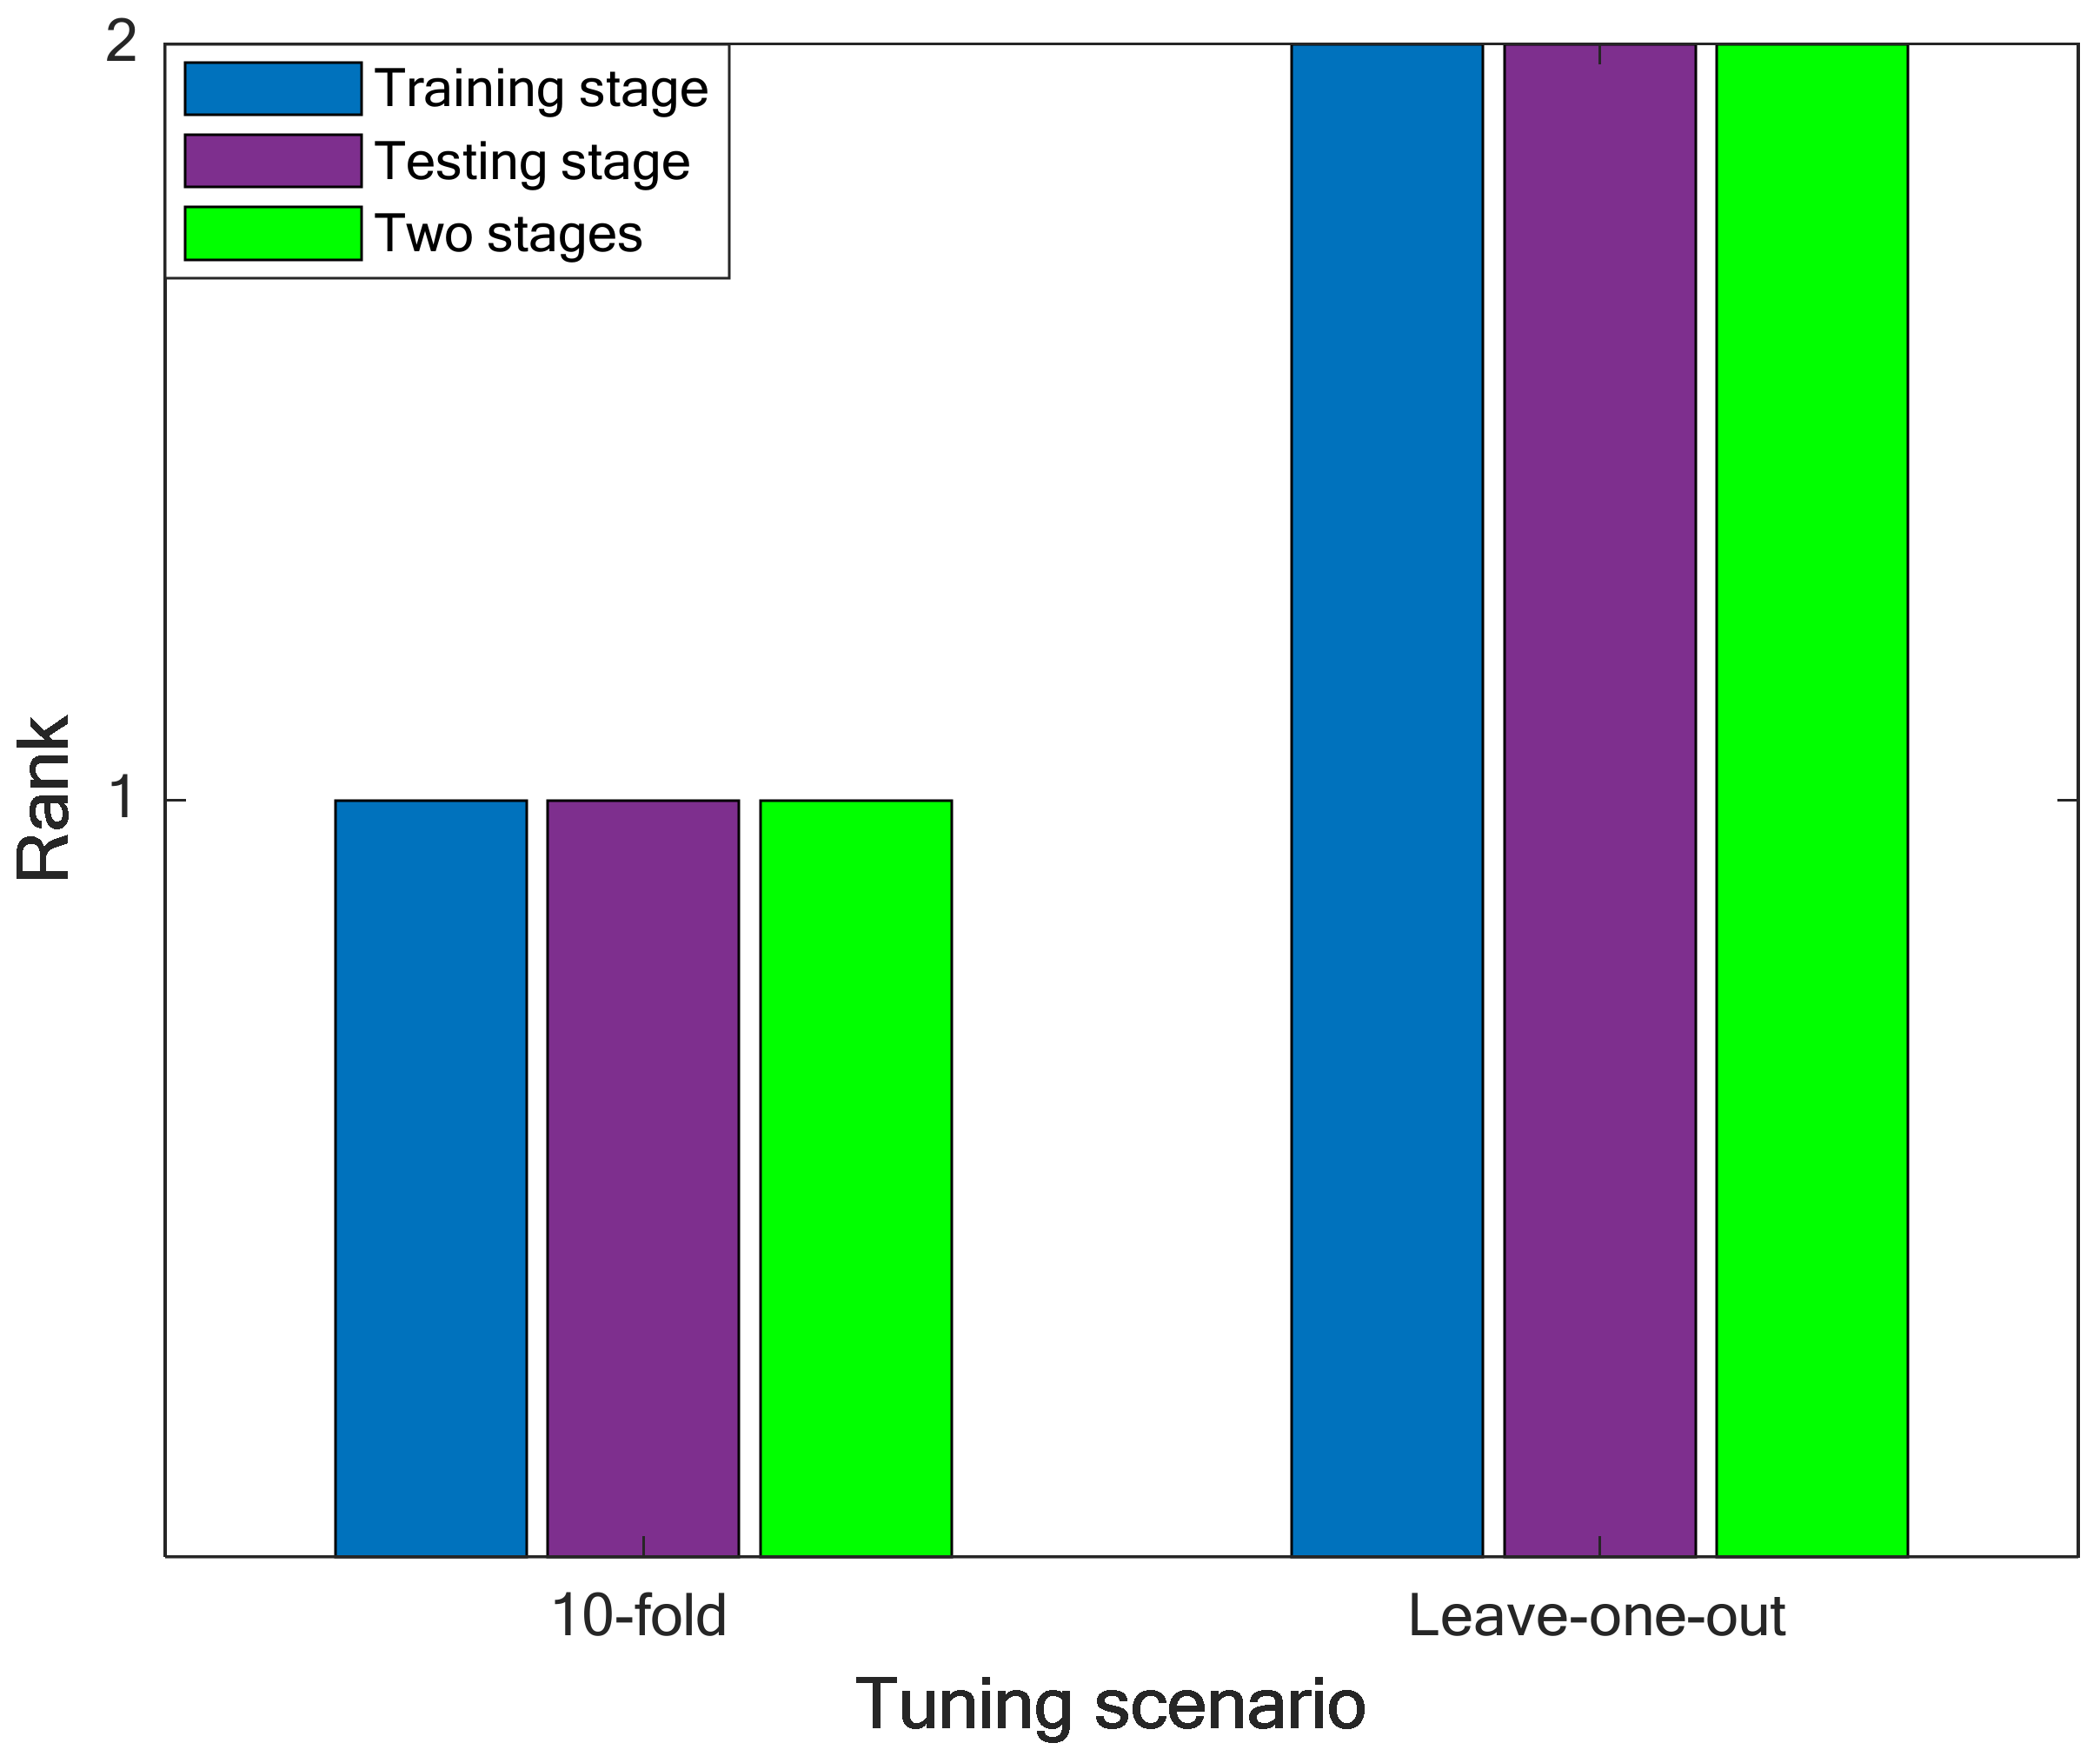
4.2.2. Selecting the Best Tuning Technique
4.3. Monitoring the LS-SVR Performance Using Graphical Analyses
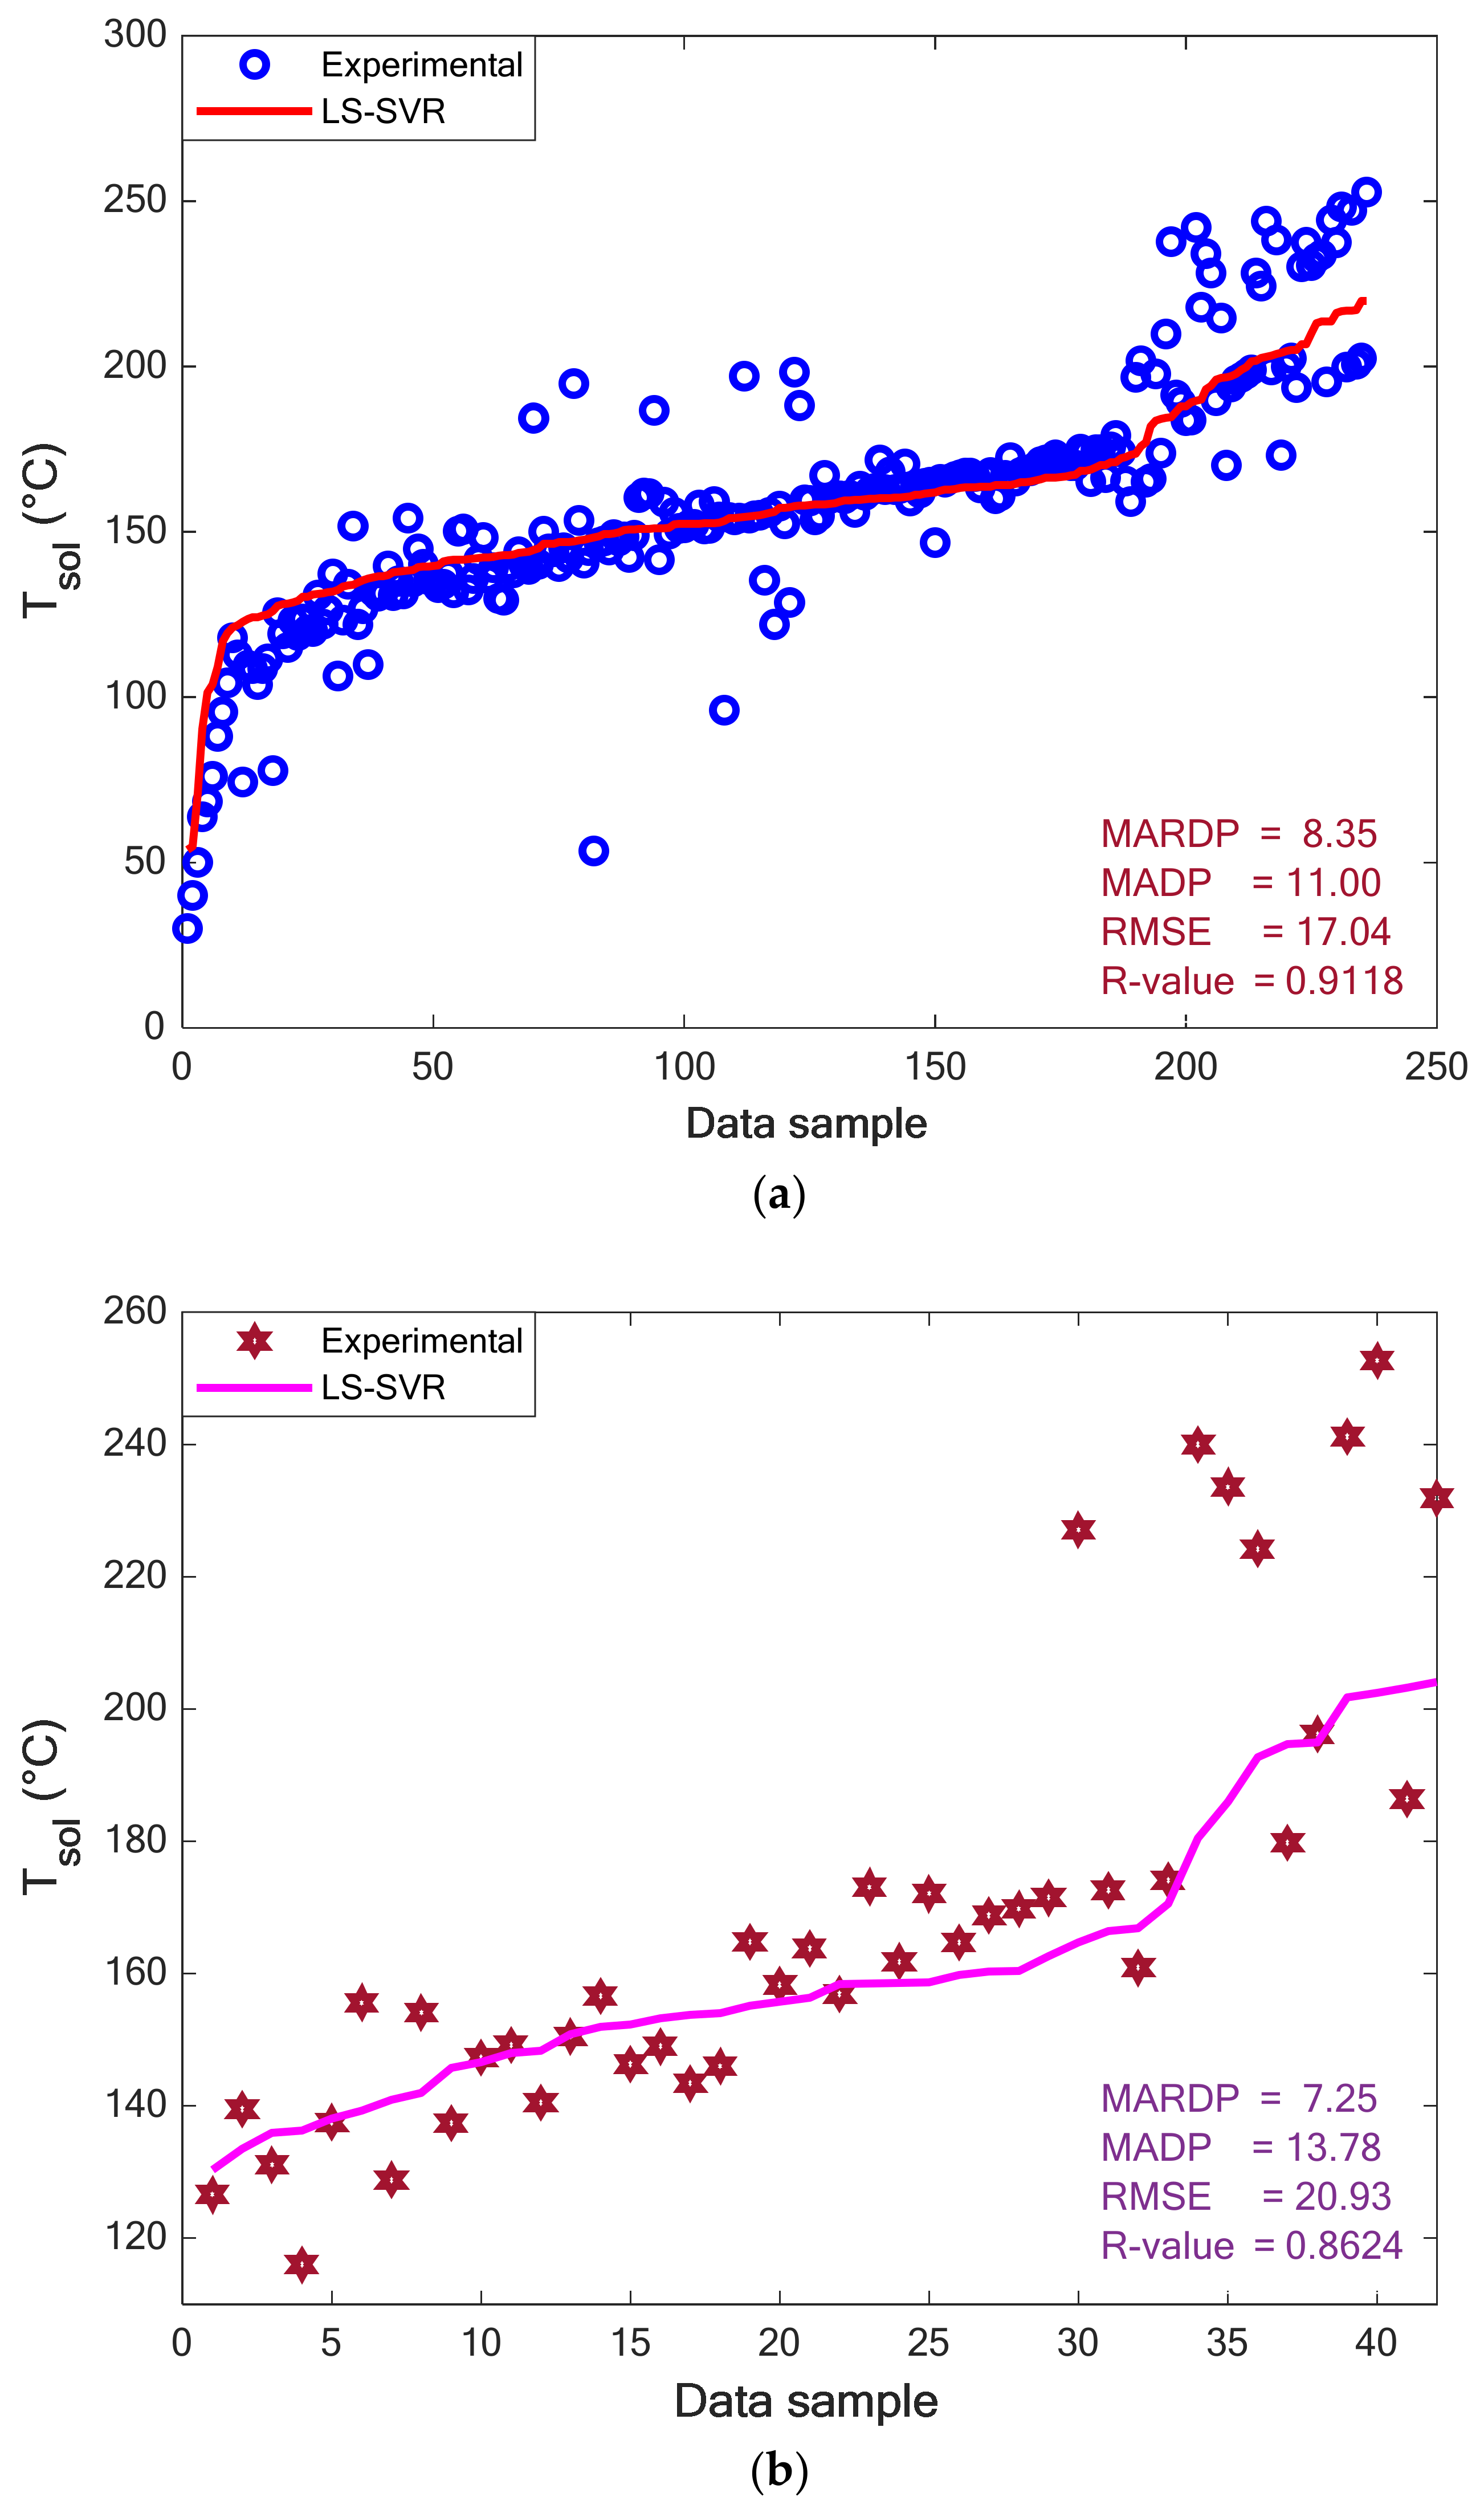
4.3.1. Compatibility between Experimental and Calculated Tsol
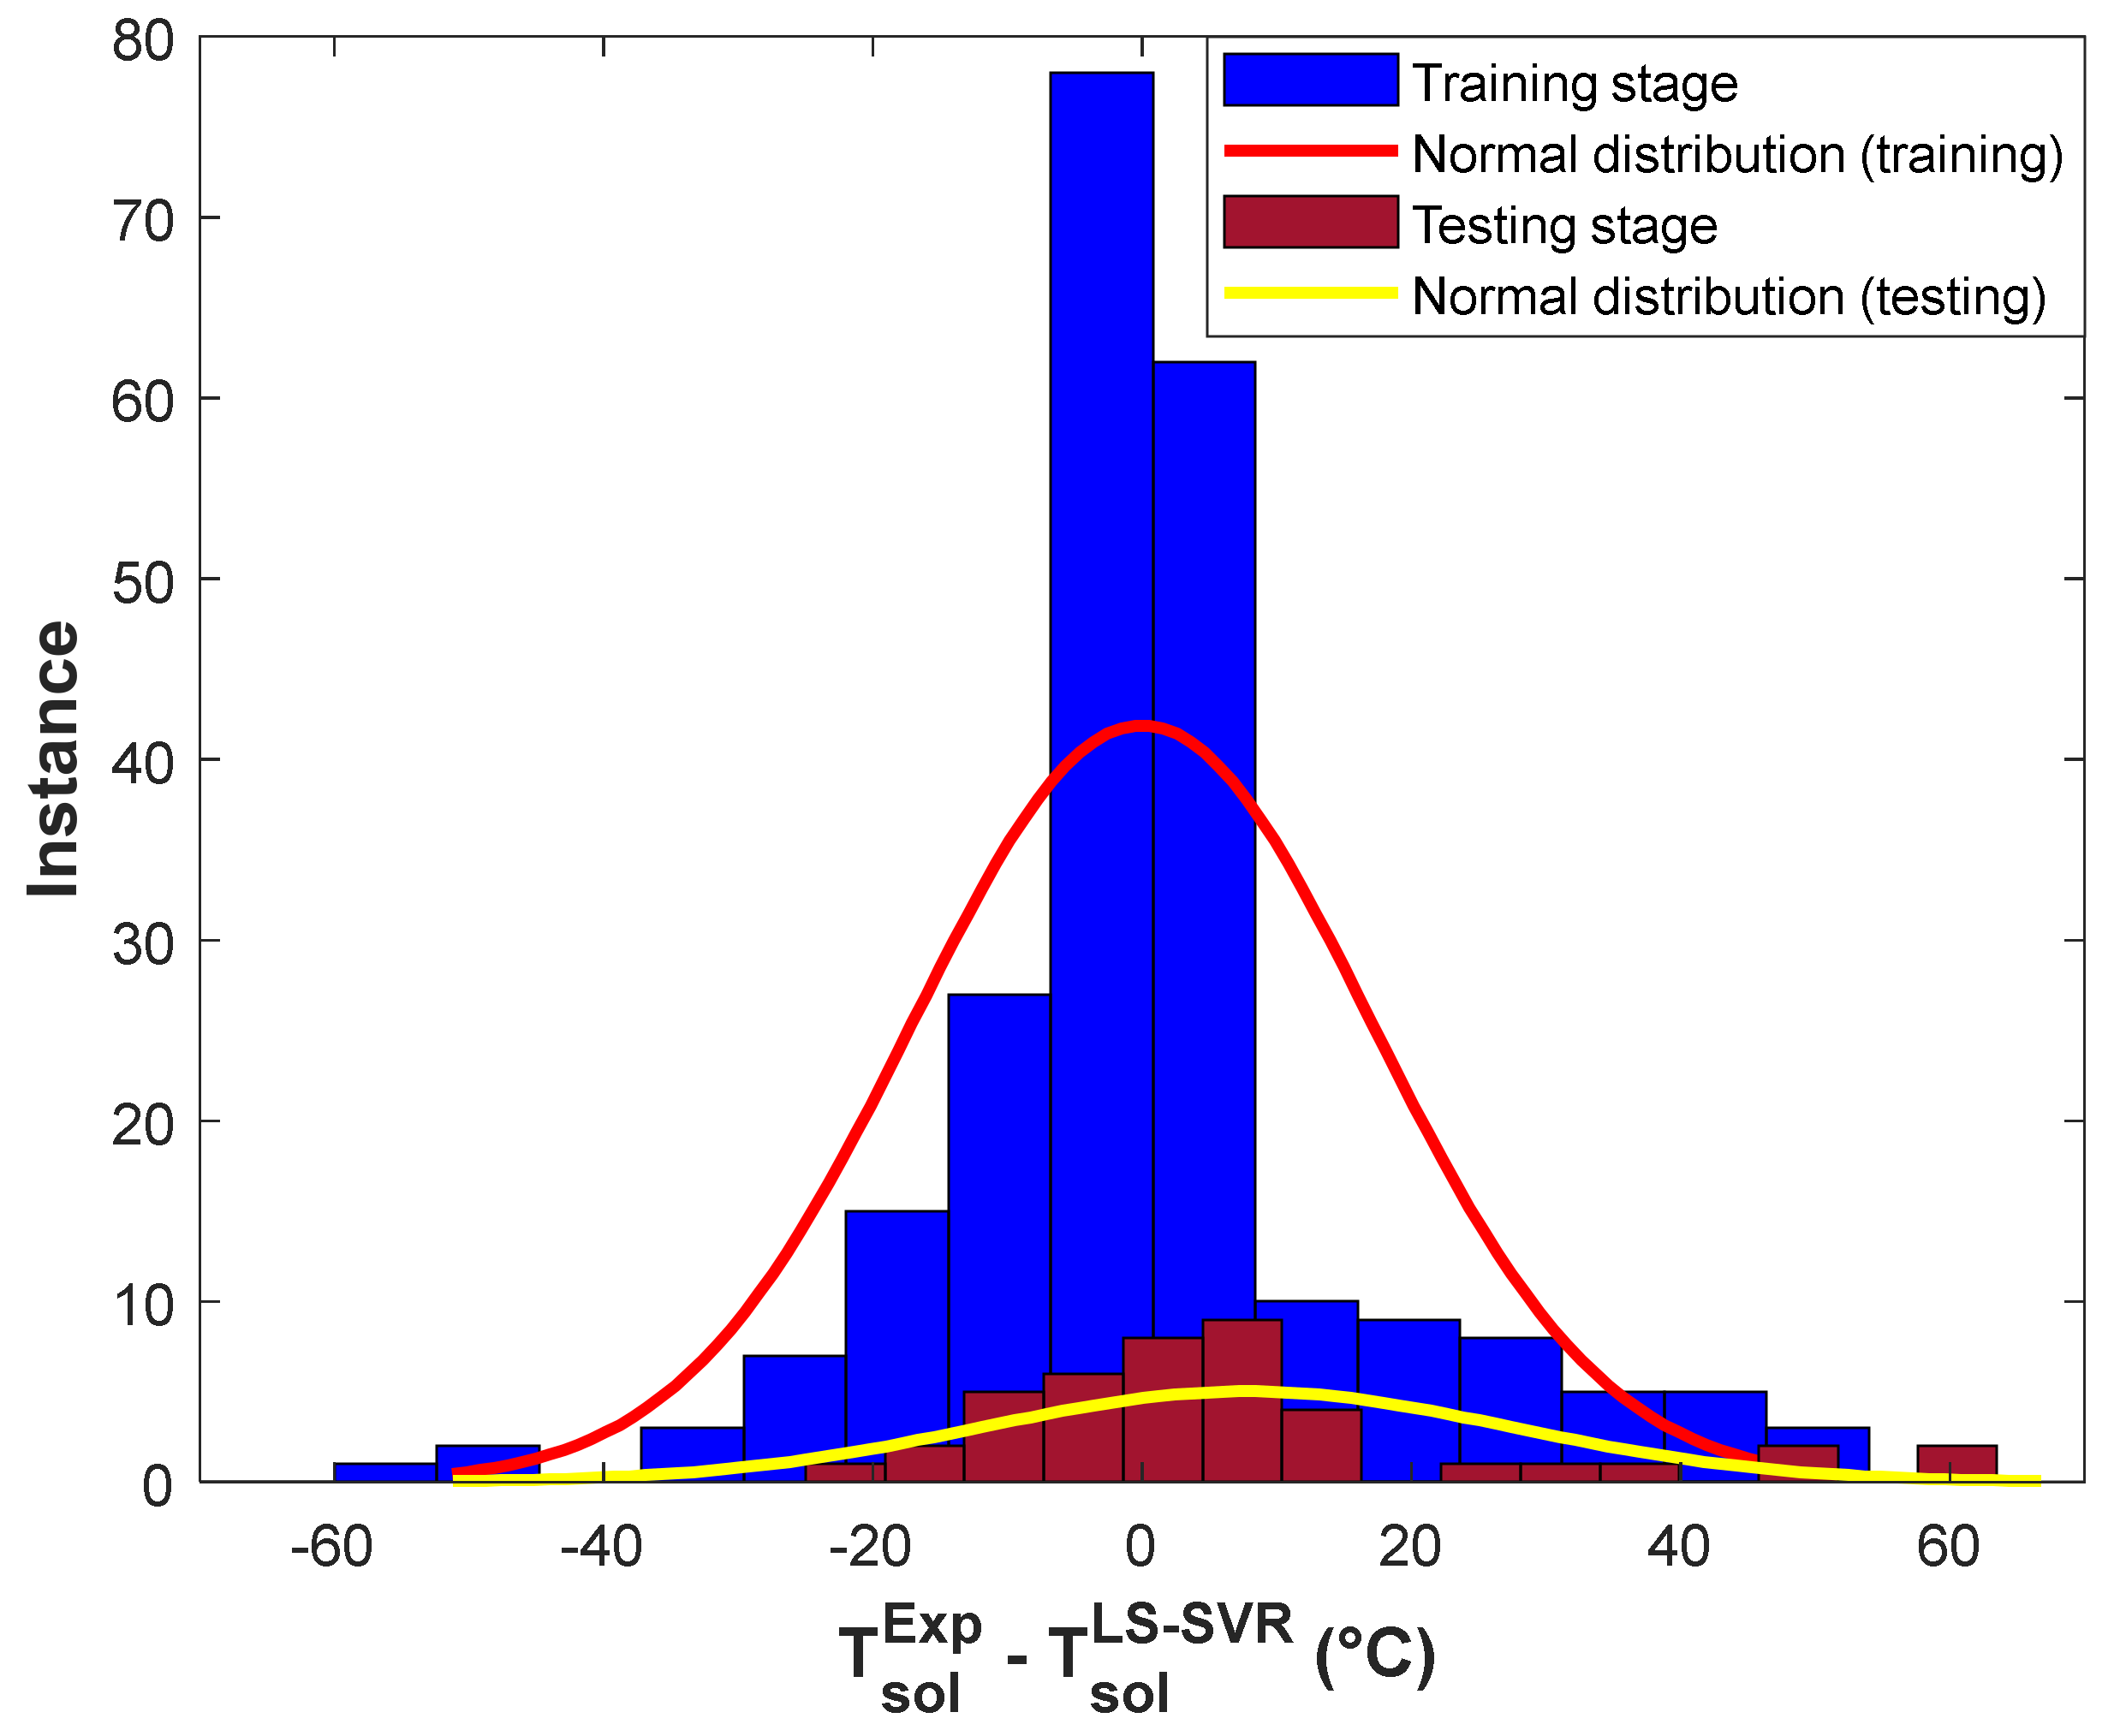
4.3.2. Experimental versus Predicted Tsol in the Training and Testing Stages
4.4. Monitoring the LS-SVR Performance Using Trend Analyses
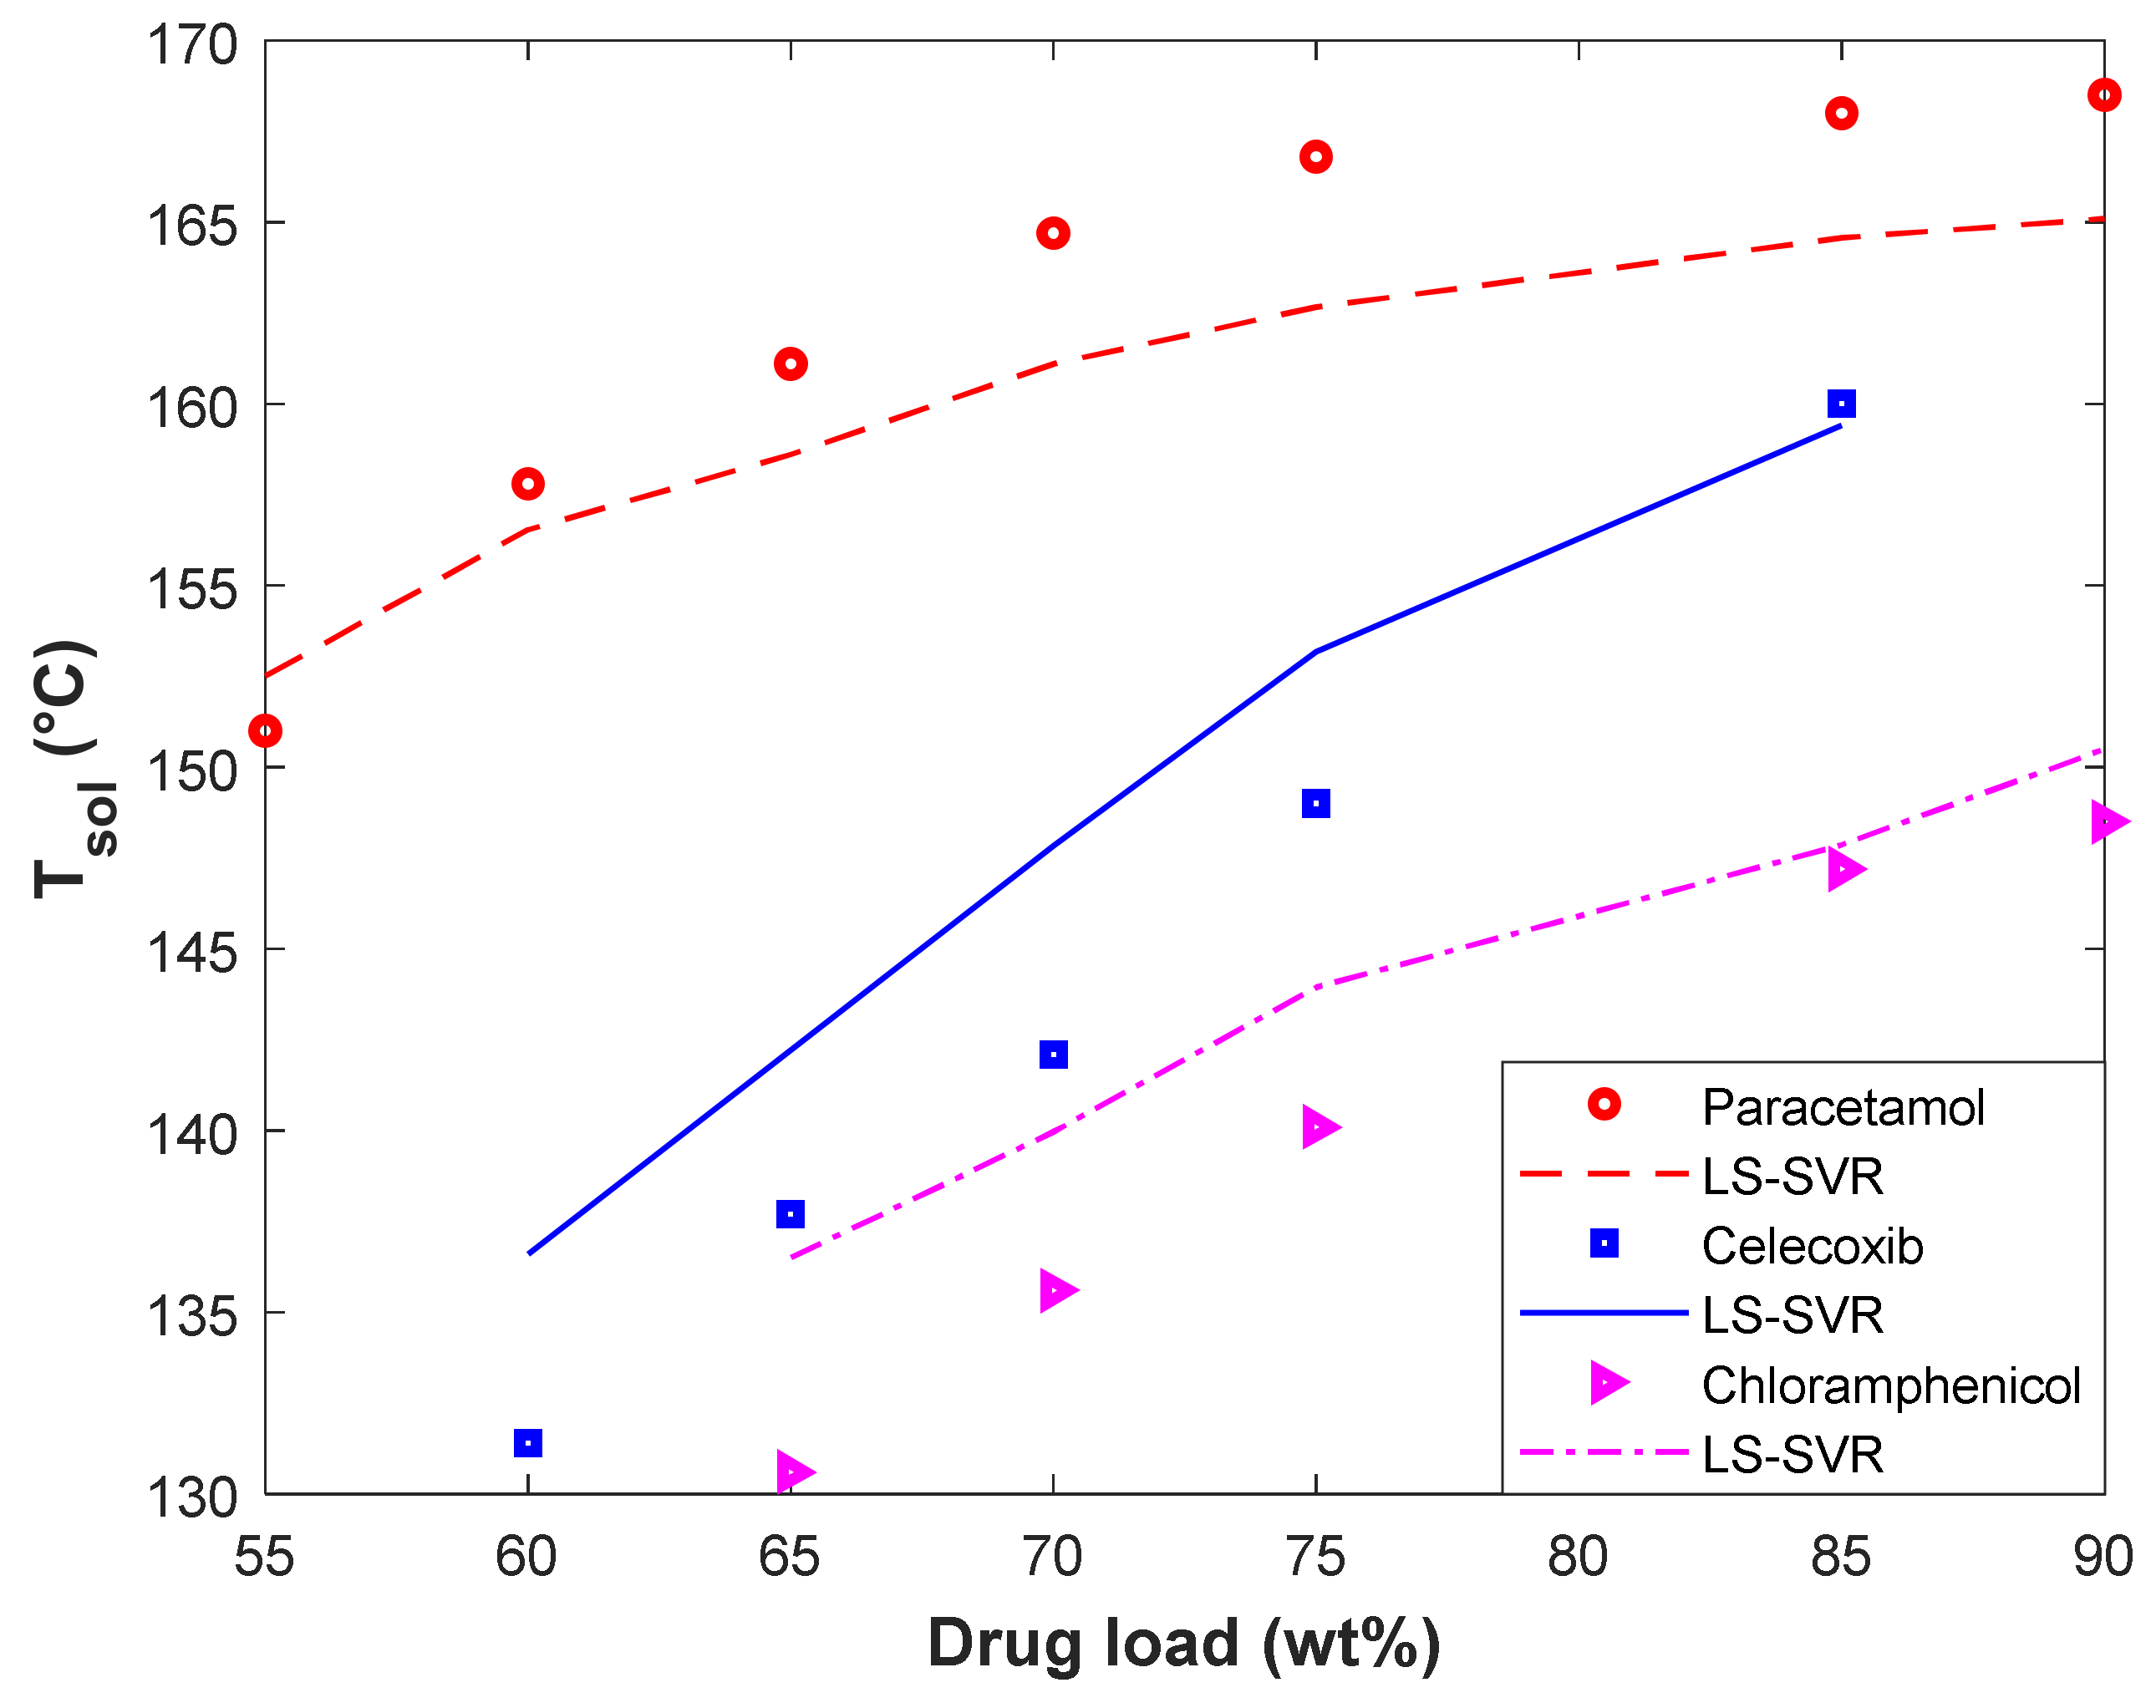
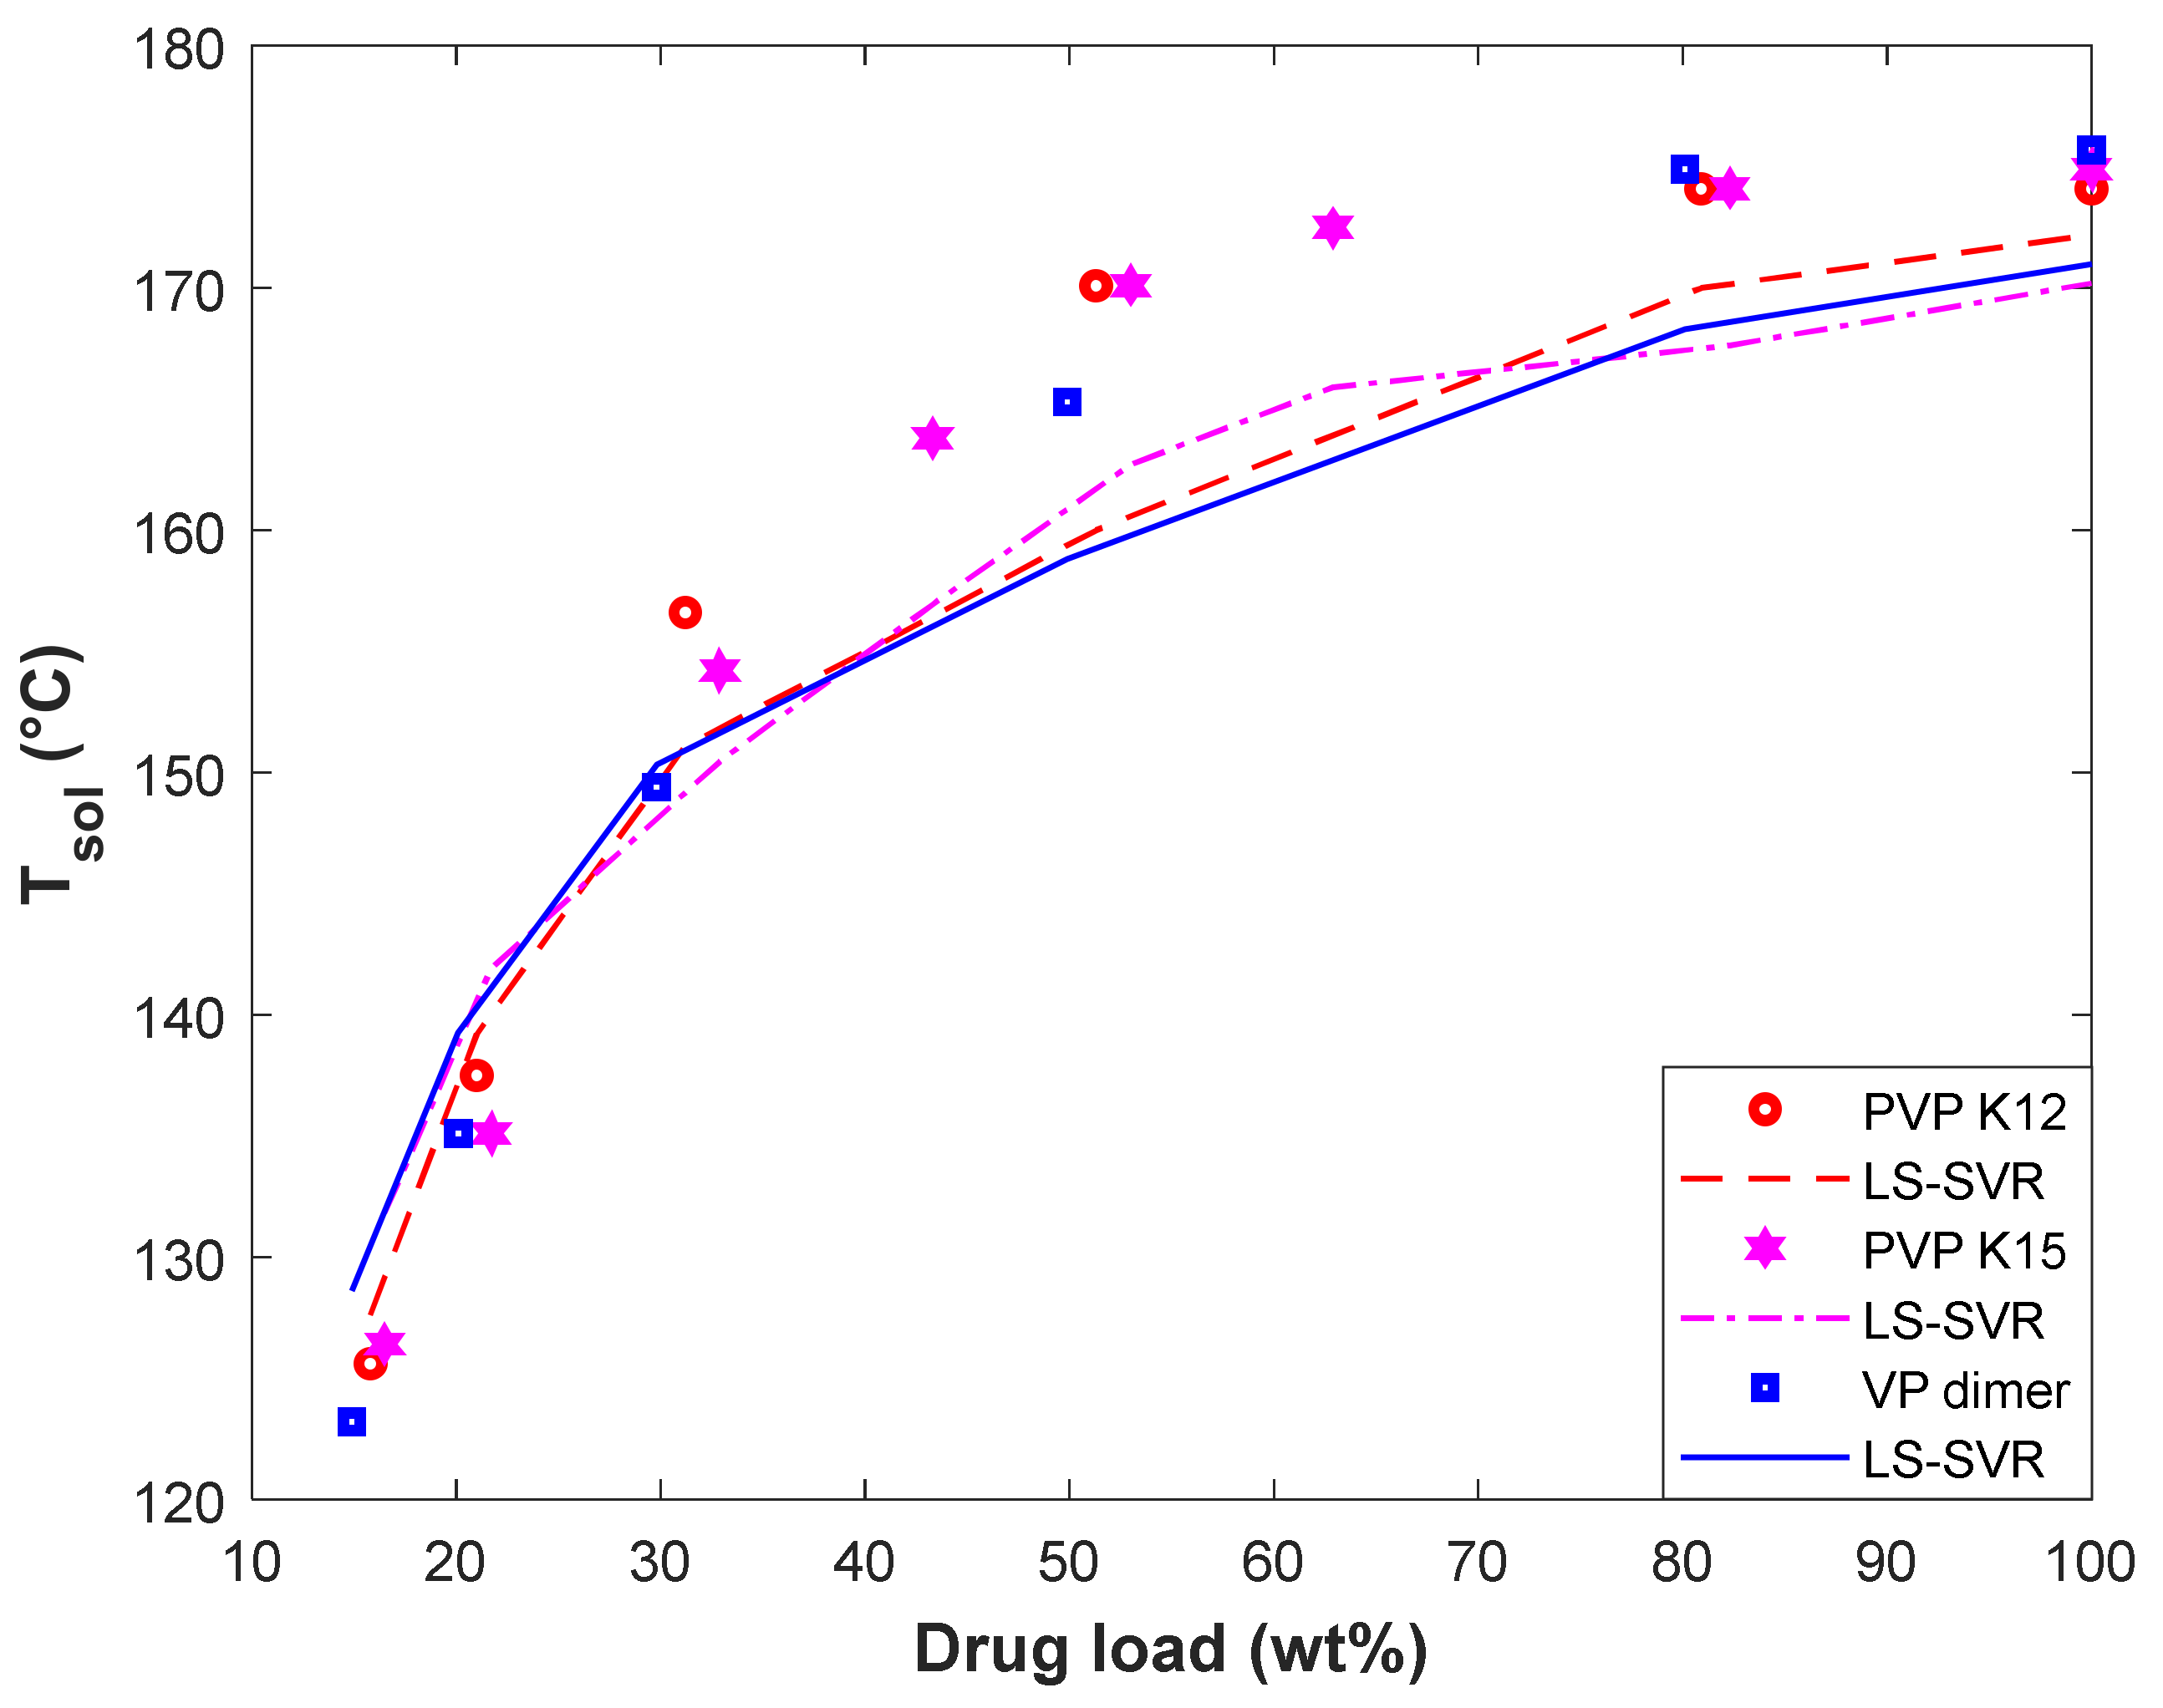
4.4.1. Evaluating the Impact of Drug Type and Its Load in Polymer on the Tsol
4.4.2. Evaluating the Impact of Polymer Type on the Tsol
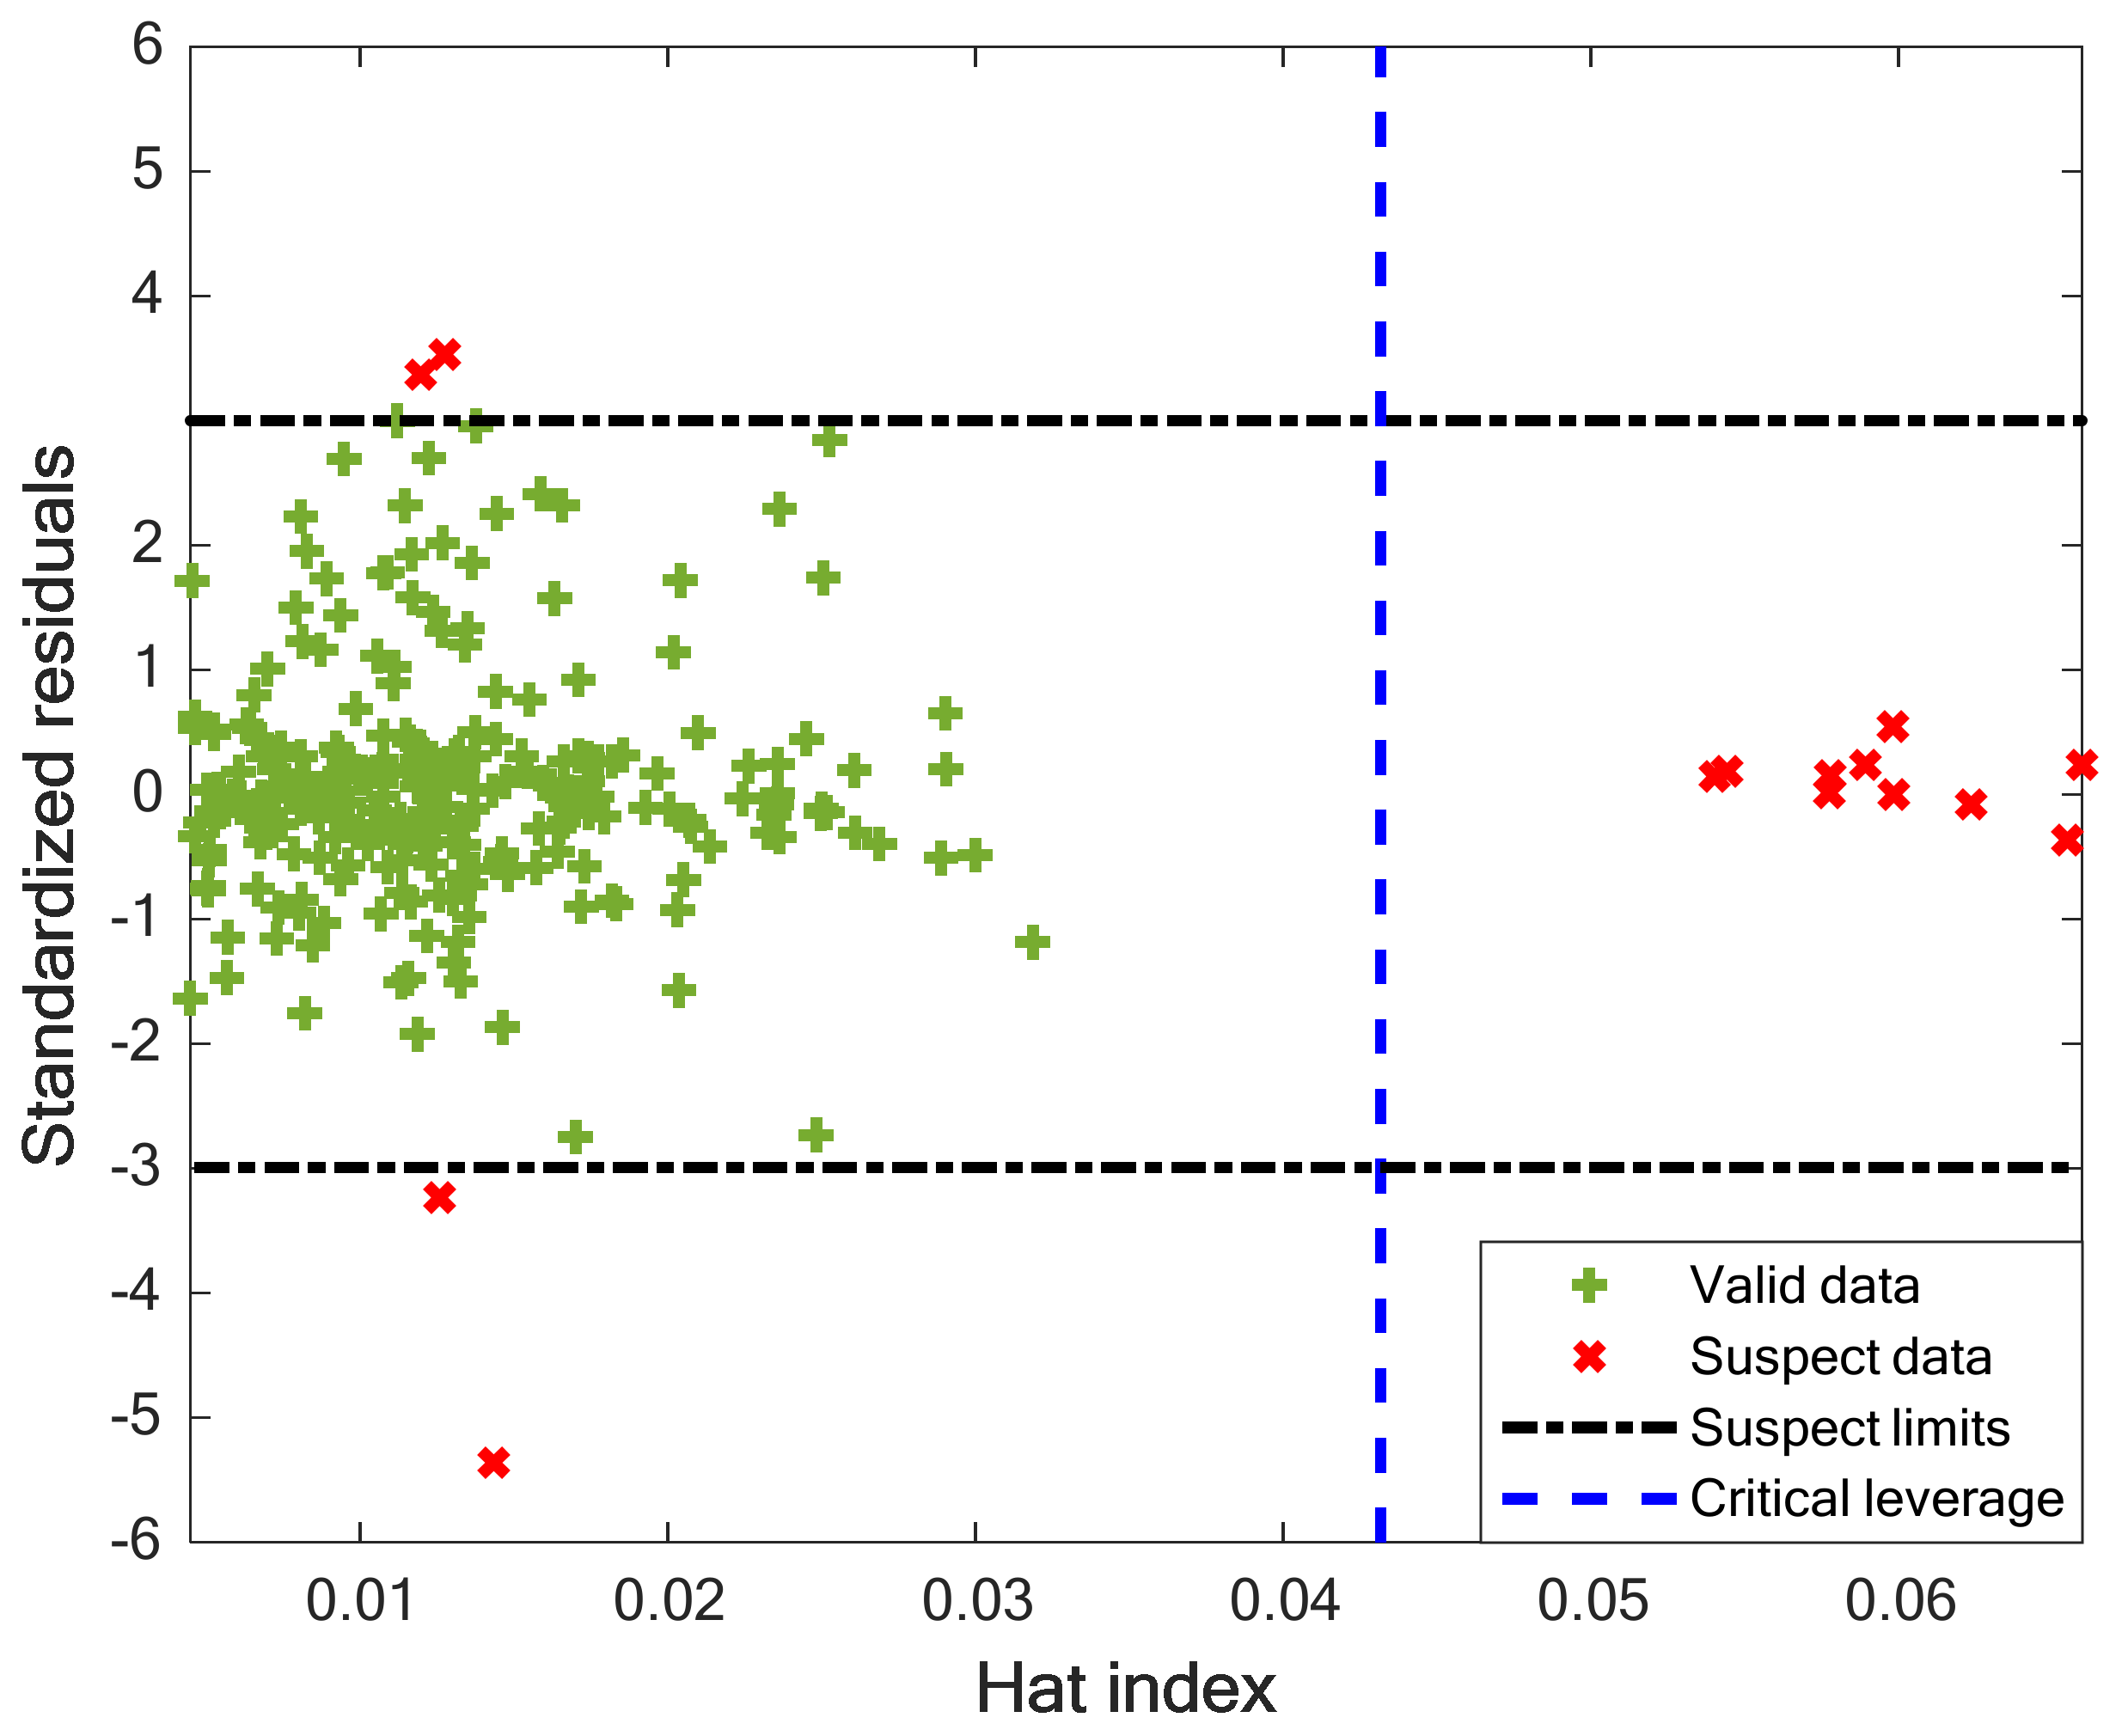
4.5. Checking the Data Validity
5. Conclusions
Supplementary Materials
Author Contributions
Funding
Institutional Review Board Statement
Informed Consent Statement
Data Availability Statement
Conflicts of Interest
References
- Kumar, S.; Dilbaghi, N.; Saharan, R.; Bhanjana, G. Nanotechnology as Emerging Tool for Enhancing Solubility of Poorly Water-Soluble Drugs. Bionanoscience 2012, 2, 227–250. [Google Scholar] [CrossRef]
- Abuzar, S.M.; Hyun, S.M.; Kim, J.H.; Park, H.J.; Kim, M.S.; Park, J.S.; Hwang, S.J. Enhancing the solubility and bioavailability of poorly water-soluble drugs using supercritical antisolvent (SAS) process. Int. J. Pharm. 2018, 538, 1–13. [Google Scholar] [CrossRef] [PubMed]
- Zheng, J.; Long, X.; Chen, H.; Ji, Z.; Shu, B.; Yue, R.; Liao, Y.; Ma, S.; Qiao, K.; Liu, Y.; et al. Photoclick Reaction Constructs Glutathione-Responsive Theranostic System for Anti-Tuberculosis. Front. Mol. Biosci. 2022, 9, 845179. [Google Scholar] [CrossRef] [PubMed]
- Vedaga, S.B.; Gondkar, S.B.; Saudagar, R.B. Nanosuspension: An Emerging Trend to Improve Solubility of Poorly Water Soluble Drugs. J. Adv. Pharm. Thechnology Res. 2019, 2, 81–87. [Google Scholar] [CrossRef]
- Yang, W.; Liu, W.; Li, X.; Yan, J.; He, W. Turning chiral peptides into a racemic supraparticle to induce the self-degradation of MDM2. J. Adv. Res. 2022; in press. [Google Scholar] [CrossRef] [PubMed]
- Sareen, S.; Joseph, L.; Mathew, G. Improvement in solubility of poor water-soluble drugs by solid dispersion. Int. J. Pharm. Investig. 2012, 2, 12. [Google Scholar] [CrossRef] [Green Version]
- Chaudhari, S.P.; Dugar, R.P. Application of surfactants in solid dispersion technology for improving solubility of poorly water soluble drugs. J. Drug Deliv. Sci. Technol. 2017, 41, 68–77. [Google Scholar] [CrossRef]
- Maleki, A.; Kettiger, H.; Schoubben, A.; Rosenholm, J.M.; Ambrogi, V.; Hamidi, M. Mesoporous silica materials: From physico-chemical properties to enhanced dissolution of poorly water-soluble drugs. J. Control. Release 2017, 262, 329–347. [Google Scholar] [CrossRef]
- Faress, F.; Yari, A.; Kouchi, F.R.; Nezhad, A.S.; Hadizadeh, A.; Bakhtiar, L.S.; Naserzadeh, Y.; Mahmoudi, N. Developing an accurate empirical correlation for predicting anti-cancer drugs’ dissolution in supercritical carbon dioxide. Sci. Rep. 2022, 12, 9380. [Google Scholar] [CrossRef]
- Faraz, O.; Poustchi, M.; Denyani, E.N.; Movahedi, P.; Kouchi, F.R.; Shahriari, R. Thermodynamic modeling of pharmaceuticals solubility in pure, mixed and supercritical solvents. J. Mol. Liq. 2022, 353, 118809. [Google Scholar] [CrossRef]
- Jesus, A.R.; Soromenho, M.R.C.; Raposo, L.R.; Esperança, J.M.S.S.; Baptista, P.V.; Fernandes, A.R.; Reis, P.M. Enhancement of water solubility of poorly water-soluble drugs by new biocompatible N-acetyl amino acid N-alkyl cholinium-based ionic liquids. Eur. J. Pharm. Biopharm. 2019, 137, 227–232. [Google Scholar] [CrossRef]
- Bazzo, G.C.; Pezzini, B.R.; Stulzer, H.K. Eutectic mixtures as an approach to enhance solubility, dissolution rate and oral bioavailability of poorly water-soluble drugs. Int. J. Pharm. 2020, 588, 119741. [Google Scholar] [CrossRef]
- Kazemi, M.; Emami, J.; Hasanzadeh, F.; Minaiyan, M.; Mirian, M.; Lavasanifar, A. Pegylated multifunctional pH-responsive targeted polymeric micelles for ovarian cancer therapy: Synthesis, characterization and pharmacokinetic study. Int. J. Polym. Mater. Polym. Biomater. 2021, 70, 1012–1026. [Google Scholar] [CrossRef]
- Van den Mooter, G. The use of amorphous solid dispersions: A formulation strategy to overcome poor solubility and dissolution rate. Drug Discov. Today Technol. 2012, 9, e79–e85. [Google Scholar] [CrossRef]
- Schittny, A.; Huwyler, J.; Puchkov, M. Mechanisms of increased bioavailability through amorphous solid dispersions: A review. Drug Deliv. 2020, 27, 110–127. [Google Scholar] [CrossRef] [Green Version]
- Meng, F.; Dave, V.; Chauhan, H. Qualitative and quantitative methods to determine miscibility in amorphous drug-polymer systems. Eur. J. Pharm. Sci. 2015, 77, 106–111. [Google Scholar] [CrossRef]
- Rumondor, A.C.F.; Ivanisevic, I.; Bates, S.; Alonzo, D.E.; Taylor, L.S. Evaluation of drug-polymer miscibility in amorphous solid dispersion systems. Pharm. Res. 2009, 26, 2523–2534. [Google Scholar] [CrossRef]
- Chen, Y.; Wang, S.; Wang, S.; Liu, C.; Su, C.; Hageman, M.; Hussain, M.; Haskell, R.; Stefanski, K.; Qian, F. Initial Drug Dissolution from Amorphous Solid Dispersions Controlled by Polymer Dissolution and Drug-Polymer Interaction. Pharm. Res. 2016, 33, 2445–2458. [Google Scholar] [CrossRef]
- Zhang, X.; Qu, Y.Y.; Liu, L.; Qiao, Y.N.; Geng, H.R.; Lin, Y.; Xu, W.; Cao, J.; Zhao, J.Y. Homocysteine inhibits pro-insulin receptor cleavage and causes insulin resistance via protein cysteine-homocysteinylation. Cell Rep. 2021, 37, 109821. [Google Scholar] [CrossRef]
- Asgreen, C.; Knopp, M.M.; Skytte, J.; Löbmann, K. Influence of the polymer glass transition temperature and molecular weight on drug amorphization kinetics using ball milling. Pharmaceutics 2020, 12, 483. [Google Scholar] [CrossRef]
- Mamidi, H.K.; Rohera, B.D. Application of Thermodynamic Phase Diagrams and Gibbs Free Energy of Mixing for Screening of Polymers for Their Use in Amorphous Solid Dispersion Formulation of a Non-Glass-Forming Drug. J. Pharm. Sci. 2021, 110, 2703–2717. [Google Scholar] [CrossRef] [PubMed]
- Caron, V.; Hu, Y.; Tajber, L.; Erxleben, A.; Corrigan, O.I.; McArdle, P.; Healy, A.M. Amorphous solid dispersions of sulfonamide/soluplus® and sulfonamide/PVP prepared by ball milling. AAPS PharmSciTech 2013, 14, 464–474. [Google Scholar] [CrossRef] [PubMed] [Green Version]
- Newman, A.; Nagapudi, K.; Wenslow, R. Amorphous solid dispersions: A robust platform to address bioavailability challenges. Ther. Deliv. 2015, 6, 247–261. [Google Scholar] [CrossRef] [PubMed]
- Kyeremateng, S.O.; Pudlas, M.; Woehrle, G.H. A fast and reliable empirical approach for estimating solubility of crystalline drugs in polymers for hot melt extrusion formulations. J. Pharm. Sci. 2014, 103, 2847–2858. [Google Scholar] [CrossRef] [PubMed]
- Sun, Y.E.; Tao, J.; Zhang, G.G.Z.; Yu, L. Solubilities of crystalline drugs in polymers: An improved analytical method and comparison of solubilities of indomethacin and nifedipine in PVP, PVP/VA, and PVAc. J. Pharm. Sci. 2010, 99, 4023–4031. [Google Scholar] [CrossRef]
- Knopp, M.M.; Gannon, N.; Porsch, I.; Rask, M.B.; Olesen, N.E.; Langguth, P.; Holm, R.; Rades, T. A Promising New Method to Estimate Drug-Polymer Solubility at Room Temperature. J. Pharm. Sci. 2016, 105, 2621–2624. [Google Scholar] [CrossRef] [Green Version]
- Knopp, M.M.; Tajber, L.; Tian, Y.; Olesen, N.E.; Jones, D.S.; Kozyra, A.; Löbmann, K.; Paluch, K.; Brennan, C.M.; Holm, R.; et al. Comparative Study of Different Methods for the Prediction of Drug-Polymer Solubility. Mol. Pharm. 2015, 12, 3408–3419. [Google Scholar] [CrossRef] [Green Version]
- Tao, J.; Sun, Y.; Zhang, G.G.Z.; Yu, L. Solubility of small-molecule crystals in polymers: D-Mannitol in PVP, indomethacin in PVP/VA, and nifedipine in PVP/VA. Pharm. Res. 2009, 26, 855–864. [Google Scholar] [CrossRef]
- Wang, X.H.; Xu, S.; Zhou, X.Y.; Zhao, R.; Lin, Y.; Cao, J.; Zang, W.D.; Tao, H.; Xu, W.; Li, M.Q.; et al. Low chorionic villous succinate accumulation associates with recurrent spontaneous abortion risk. Nat. Commun. 2021, 12, 3428. [Google Scholar] [CrossRef]
- Ting, J.M.; Porter, W.W.; Mecca, J.M.; Bates, F.S.; Reineke, T.M. Advances in Polymer Design for Enhancing Oral Drug Solubility and Delivery. Bioconjug. Chem. 2018, 29, 939–952. [Google Scholar] [CrossRef]
- Qu, Y.; Zhao, R.; Zhang, H.; Zhou, Q.; Xu, F.; Zhang, X.; Xu, W.H.; Shao, N.; Zhou, S.X.; Dai, B.; et al. Inactivation of the AMPK–GATA3–ECHS1 Pathway Induces Fatty Acid Synthesis That Promotes Clear Cell Renal Cell Carcinoma Growth. Cancer Res. 2020, 80, 319–333. [Google Scholar] [CrossRef] [Green Version]
- Wang, D.; Wang, F.; Shi, K.H.; Tao, H.; Li, Y.; Zhao, R.; Lu, H.; Duan, W.; Qiao, B.; Zhao, S.M.; et al. Lower Circulating Folate Induced by a Fidgetin Intronic Variant Is Associated with Reduced Congenital Heart Disease Susceptibility. Circulation 2017, 135, 1733–1748. [Google Scholar] [CrossRef]
- Lai, W.F.; Tang, R.; Wong, W.T. Ionically crosslinked complex gels loaded with oleic acid-containing vesicles for transdermal drug delivery. Pharmaceutics 2020, 12, 725. [Google Scholar] [CrossRef]
- Meng, F.; Trivino, A.; Prasad, D.; Chauhan, H. Investigation and correlation of drug polymer miscibility and molecular interactions by various approaches for the preparation of amorphous solid dispersions. Eur. J. Pharm. Sci. 2015, 71, 12–24. [Google Scholar] [CrossRef]
- Knopp, M.M.; Olesen, N.E.; Holm, P.; Löbmann, K.; Holm, R.; Langguth, P.; Rades, T. Evaluation of drug-polymer solubility curves through formal statistical analysis: Comparison of preparation techniques. J. Pharm. Sci. 2015, 104, 44–51. [Google Scholar] [CrossRef]
- Hildebrand, J.H. Solubility of Non-electrolytes. In American Chemical Society Monograph Series, 2nd ed.; Reinhold Pub.: New York, NY, USA, 1936. [Google Scholar]
- Hansen, C.M. The universality of the solubility parameter. Ind. Eng. Chem. Prod. Res. Dev. 1969, 8, 2–11. [Google Scholar] [CrossRef]
- Zhu, X.; Khosravi, M.; Vaferi, B.; Amar, M.N.; Ghriga, M.A.; Mohammed, A.H. Application of machine learning methods for estimating and comparing the sulfur dioxide absorption capacity of a variety of deep eutectic solvents. J. Clean. Prod. 2022, 363, 132465. [Google Scholar] [CrossRef]
- Wang, J.; Ayari, M.A.; Khandakar, A.; Chowdhury, M.E.H.; Zaman, S.M.A.U.; Rahman, T.; Vaferi, B. Estimating the Relative Crystallinity of Biodegradable Polylactic Acid and Polyglycolide Polymer Composites by Machine Learning Methodologies. Polymers 2022, 14, 527. [Google Scholar] [CrossRef]
- Lai, W.F.; Gui, D.; Wong, M.; Döring, A.; Rogach, A.L.; He, T.; Wong, W.T. A self-indicating cellulose-based gel with tunable performance for bioactive agent delivery. J. Drug Deliv. Sci. Technol. 2021, 63, 102428. [Google Scholar] [CrossRef]
- Alibak, A.H.; Khodarahmi, M.; Fayyazsanavi, P.; Alizadeh, S.M.; Hadi, A.J.; Aminzadehsarikhanbeglou, E. Simulation the adsorption capacity of polyvinyl alcohol/carboxymethyl cellulose based hydrogels towards methylene blue in aqueous solutions using cascade correlation neural network (CCNN) technique. J. Clean. Prod. 2022, 337, 130509. [Google Scholar] [CrossRef]
- Song, K.; Wu, D. Shared decision-making in the management of patients with inflammatory bowel disease. World J. Gastroenterol. 2022, 28, 3092–3100. [Google Scholar] [CrossRef] [PubMed]
- Duan, C.; Deng, H.; Xiao, S.; Xie, J.; Li, H.; Zhao, X.; Han, D.; Sun, X.; Lou, X.; Ye, C.; et al. Accelerate gas diffusion-weighted MRI for lung morphometry with deep learning. Eur. Radiol. 2022, 32, 702–713. [Google Scholar] [CrossRef] [PubMed]
- Zou, M.; Yang, Z.; Fan, Y.; Gong, L.; Han, Z.; Ji, L.; Hu, X.; Wu, D. Gut microbiota on admission as predictive biomarker for acute necrotizing pancreatitis. Front. Immunol. 2022, 13, 988326. [Google Scholar] [CrossRef] [PubMed]
- Rafieipour, H.; Zadeh, A.A.; Moradan, A.; Salekshahrezaee, Z. Study of genes associated with Parkinson disease using feature selection. J. Bioeng. Res. 2020, 2, 1–11. [Google Scholar] [CrossRef]
- Suykens, J.A.K.; van Gestel, T.; de Brabanter, J.; de Moor, B.; Vandewalle, J. Least Squares Support Vector Machines; World Scientific Publishing: Singapore, 2002. [Google Scholar]
- Cao, Y.; Kamrani, E.; Mirzaei, S.; Khandakar, A.; Vaferi, B. Electrical efficiency of the photovoltaic/thermal collectors cooled by nanofluids: Machine learning simulation and optimization by evolutionary algorithm. Energy Rep. 2022, 8, 24–36. [Google Scholar] [CrossRef]
- Karimi, M.; Aminzadehsarikhanbeglou, E.; Vaferi, B. Robust intelligent topology for estimation of heat capacity of biochar pyrolysis residues. Meas. J. Int. Meas. Confed. 2021, 183, 109857. [Google Scholar] [CrossRef]
- Hosseini, S.; Vaferi, B. Determination of methanol loss due to vaporization in gas hydrate inhibition process using intelligent connectionist paradigms. Arab. J. Sci. Eng. 2022, 47, 5811–5819. [Google Scholar] [CrossRef]
- Xie, B.; Li, S.; Lv, F.; Liu, C.H.; Wang, G.; Wu, D. A Collaborative Alignment Framework of Transferable Knowledge Extraction for Unsupervised Domain Adaptation. IEEE Trans. Knowl. Data Eng. 2022. [Google Scholar] [CrossRef]
- Moosavi, S.R.; Vaferi, B.; Wood, D.A. Auto-characterization of naturally fractured reservoirs drilled by horizontal well using multi-output least squares support vector regression. Arab. J. Geosci. 2021, 14, 545. [Google Scholar] [CrossRef]


| Drug Name | Polymer Name | Drug Load (wt%) | Tsol (°C) | N | Ref. |
|---|---|---|---|---|---|
| Sulfadiazine, Sulfadimidine, Sulfamerazine, Sulfathiazole | PVP, Soluplus | 1–100 | 146.7–252.7 | 56 | [22] |
| Acetaminophen, Ibuprofen, Ibuprofen Sodium, Itraconazole, Naproxen, Nifedipine | PVP/VA, Soluplus | 20–100 | 30.0–198.3 | 56 | [24] |
| D-Mannitol, Indomethacin, Nifedipine | PVAc, PVP K12, PVP K15, PVP K25, PVP/VA, VP dimer | 5–100 | 88.2–175.7 | 59 | [25] |
| Celecoxib, Chloramphenicol, Paracetamol | PVAc, PVP, Soluplus | 8–95 | 95.5–168.5 | 53 | [26] |
| Celecoxib, Chloramphenicol, Felodipine, Indomethacin, Paracetamol | PVP K17, PVP/VA 335, PVP/VA 535, PVP/VA 635, PVP/VA 735 | 60–95 | 132–172 | 35 | [27] |
| D-Mannitol, Indomethacin, Nifedipine | PVP K15, PVP/VA | 22.2–100 | 108.7–172.1 | 19 | [28] |
| The Best Results Obtained by LS-SVRs with Different Kernel Types (Leave-One-Out CV) | ||||||
|---|---|---|---|---|---|---|
| Kernel Type | Tuned Parameters | Group | MARDP | MADP | RMSE | R-Value |
| Linear | γ = 0.07673 | Training | 19.15 | 25.15 | 35.81 | 0.1726 |
| Testing | 27.73 | 29.74 | 43.63 | −0.1032 | ||
| Overall | 20.44 | 25.84 | 37.10 | 0.1161 | ||
| Polynomial | γ = 1.83 × 10⁷ t = 2.19796 d = 5 | Training | 10.50 | 13.73 | 20.02 | 0.8538 |
| Testing | 11.20 | 15.79 | 22.68 | 0.7738 | ||
| Overall | 10.61 | 14.04 | 20.44 | 0.8386 | ||
| Gaussian | γ = 1.66181 σ2 = 0.00765 | Training | 8.44 | 11.14 | 16.99 | 0.9234 |
| Testing | 9.70 | 15.35 | 18.92 | 0.8455 | ||
| Overall | 8.63 | 11.78 | 17.30 | 0.9148 | ||
| The Best Results Obtained by LS-SVRs with Different Kernel Types (10-Fold CV) | ||||||
| Kernel Type | Tuned Parameters | Group | MARDP | MADP | RMSE | R-Value |
| Linear | γ = 0.06677 | Training | 20.52 | 26.82 | 37.62 | 0.1506 |
| Testing | 20.68 | 20.85 | 34.09 | −0.0893 | ||
| Overall | 20.54 | 25.92 | 37.10 | 0.1133 | ||
| Polynomial | γ = 0.01154 t = 7.10159 d = 5 | Training | 15.68 | 18.34 | 28.11 | 0.6236 |
| Testing | 14.37 | 19.93 | 28.19 | 0.8333 | ||
| Overall | 15.48 | 18.58 | 28.13 | 0.6661 | ||
| Gaussian | γ = 1.98636 σ2 = 0.01335 | Training | 8.35 | 11.00 | 17.04 | 0.9118 |
| Testing | 7.25 | 13.78 | 20.93 | 0.8624 | ||
| Overall | 8.18 | 11.42 | 17.69 | 0.9037 | ||
Publisher’s Note: MDPI stays neutral with regard to jurisdictional claims in published maps and institutional affiliations. |
© 2022 by the authors. Licensee MDPI, Basel, Switzerland. This article is an open access article distributed under the terms and conditions of the Creative Commons Attribution (CC BY) license (https://creativecommons.org/licenses/by/4.0/).
Share and Cite
Senceroglu, S.; Ayari, M.A.; Rezaei, T.; Faress, F.; Khandakar, A.; Chowdhury, M.E.H.; Jawhar, Z.H. Constructing an Intelligent Model Based on Support Vector Regression to Simulate the Solubility of Drugs in Polymeric Media. Pharmaceuticals 2022, 15, 1405. https://doi.org/10.3390/ph15111405
Senceroglu S, Ayari MA, Rezaei T, Faress F, Khandakar A, Chowdhury MEH, Jawhar ZH. Constructing an Intelligent Model Based on Support Vector Regression to Simulate the Solubility of Drugs in Polymeric Media. Pharmaceuticals. 2022; 15(11):1405. https://doi.org/10.3390/ph15111405
Chicago/Turabian StyleSenceroglu, Sait, Mohamed Arselene Ayari, Tahereh Rezaei, Fardad Faress, Amith Khandakar, Muhammad E. H. Chowdhury, and Zanko Hassan Jawhar. 2022. "Constructing an Intelligent Model Based on Support Vector Regression to Simulate the Solubility of Drugs in Polymeric Media" Pharmaceuticals 15, no. 11: 1405. https://doi.org/10.3390/ph15111405
APA StyleSenceroglu, S., Ayari, M. A., Rezaei, T., Faress, F., Khandakar, A., Chowdhury, M. E. H., & Jawhar, Z. H. (2022). Constructing an Intelligent Model Based on Support Vector Regression to Simulate the Solubility of Drugs in Polymeric Media. Pharmaceuticals, 15(11), 1405. https://doi.org/10.3390/ph15111405