Article

The Effect of a Dairy-Based Recovery Beverage on Post-Exercise Appetite and Energy Intake in Active Females

by
Meghan A. Brown
1,†,
Benjamin P. Green
1,*,†,
Lewis J. James
2,
Emma J. Stevenson
3 and
Penny L. S. Rumbold
1
1
Department of Sport, Exercise and Rehabilitation, Faculty of Health and Life Sciences, Northumbria University, Northumberland Building, Newcastle upon Tyne NE1 8ST, UK
2
School of Sport, Exercise and Health Sciences, Loughborough University, Loughbororugh LE11 3TU, UK
3
Institute of Cellular Medicine, Human Nutrition Research Centre, William Leech Building, Medical School, Newcastle University, Newcastle upon Tyne NE2 4HH, UK
*
Author to whom correspondence should be addressed.
These authors contributed equally to this work.
Nutrients 2016, 8(6), 355; https://doi.org/10.3390/nu8060355
Submission received: 11 March 2016 / Revised: 25 May 2016 / Accepted: 31 May 2016 / Published: 8 June 2016
(This article belongs to the Special Issue Dairy Products and Human Health)

Abstract

:
This study was designed to assess the effect of a dairy-based recovery beverage on post-exercise appetite and energy intake in active females. Thirteen active females completed three trials in a crossover design. Participants completed 60 min of cycling at 65% O2peak, before a 120 min recovery period. On completion of cycling, participants consumed a commercially available dairy-based beverage (DBB), a commercially available carbohydrate beverage (CHO), or a water control (H2O). Non-esterified fatty acids, glucose, and appetite-related peptides alongside measures of subjective appetite were sampled at baseline and at 30 min intervals during recovery. At 120 min, energy intake was assessed in the laboratory by ad libitum assessment, and in the free-living environment by weighed food record for the remainder of the study day. Energy intake at the ad libitum lunch was lower after DBB compared to H2O (4.43 ± 0.20, 5.58 ± 0.41 MJ, respectively; p = 0.046; (95% CI: −2.28, −0.20 MJ)), but was not different to CHO (5.21 ± 0.46 MJ), with no difference between trials thereafter. Insulin and GLP-17-36 were higher following DBB compared to H2O (p = 0.015 and p = 0.001, respectively) but not to CHO (p = 1.00 and p = 0.146, respectively). In addition, glucagon was higher following DBB compared to CHO (p = 0.008) but not to H2O (p = 0.074). The results demonstrate that where DBB consumption may manifest in accelerated recovery, this may be possible without significantly affecting total energy intake and subsequent appetite-related responses relative to a CHO beverage.

Graphical Abstract

1. Introduction

In recent years, interest surrounding the role of dairy-based beverages (DBB) as post-exercise recovery aids has increased [1]. Research observing the effects of post-exercise DBB consumption have identified enhanced muscle protein synthesis [2], reduced exercise-induced muscle damage [3,4,5,6,7], and increased rehydration [8], thus accelerating recovery and subsequent performance [9]. Based on the available literature, it appears that many of these effects are a product of the nutritional composition of DBB which comprises high-quality proteins, low glycemic carbohydrates, in addition to electrolytes, vitamins, and minerals [10]. Dairy proteins, specifically casein and whey, constitute approximately 80% and 20%, respectively, of the total protein in milk, and provide an abundance of essential amino acids [11,12]. These amino acids are necessary to increase protein turnover and may subsequently act to repair and remodel damaged tissues following exercise. In addition to muscle tissue repair, the carbohydrate present in DBB (combined with dairy proteins) act to replace depleted glycogen stores [13], and the mixture of nutrients (again combined with dairy proteins) may enhance post-exercise rehydration compared to the ingestion of a carbohydrate-electrolyte beverage or water [8,14].
Outside of the recovery-related benefits, an emergent body of evidence supports the hypothesis that dairy-based foods elicit anti-obesity properties, providing a modest protective effect against adiposity [15,16]. To date, efforts to establish the underlying relationship between dairy consumption and adiposity have identified several putative mechanisms. Evidence from adult studies indicates that the consumption of dairy may inhibit lipid accretion and influence adipocyte lipid metabolism [17]. Furthermore, dairy consumption may act to potentiate several anorexigenic hormonal peptides of gastrointestinal, pancreatic, and adipose tissue origin that might influence appetite regulation compared to energy-equivalent products [18,19,20,21], improving subjective satiety and reducing energy intake [22,23]. Consequently, it has been suggested that dairy-based foods contribute to body mass regulation and, thus, energy balance, through actions on appetite and eating behaviour [24]. Interestingly, the same may stand true for exercise [25,26]. Certainly, regular exercise is often cited as a method for body mass maintenance and weight loss purposes. Taken together, it could be argued that dairy-based foods/beverages may enhance post-exercise recovery, whilst also beneficially modulating energy balance to facilitate body mass maintenance and/or weight loss. Many individuals, particularly women, exercise on a regular basis for weight loss or weight maintenance purposes [27] and, therefore, a DBB post-exercise may be an ideal drink to consume.
Presently, little information exists on the effects of post-exercise DBB consumption on subsequent appetite-related responses, especially in females. This is surprising given that both exercise and dairy-based foods/beverages may exert influence on appetite and eating behavior. The authors have previously demonstrated that post-exercise skimmed milk consumption reduces energy intake in recreationally-active females relative to an energy and volume matched serving of fruit-juice [28]. While our preliminary findings provide promise, in this study we observed no effect on measures of subjective appetite. Furthermore, the authors failed to quantify appetite-related peptides which may have provided valuable insights concerning the mechanisms impacting on appetite and energy intake. Consequently, there is a need to better understand the behavioral and physiological effects of exercise and post-exercise DBB consumption. Therefore, the aim of this study was to investigate the effect of a DBB following moderate intensity exercise on subsequent appetite and energy intake in recreationally active females.

2. Materials and Methods

2.1. Experimental Design

This study was a repeated measures, within-subject crossover study. The counterbalance randomization process was performed by one member of the research team and completed with the use of a web-based randomization tool [29]. Participants attended the nutrition and metabolism laboratories at the University of Northumbria on four occasions. The first visit served as a familiarization session and preliminary testing also took place. During the next three visits participants performed 60 min of cycling, before a 120 min recovery period, with all exercise carried out using a cycle ergometer (Monarch Weight Ergometer 839 E, Varberg, Sweden), followed by one of three randomly assigned recovery beverages. Samples of antecubital-venous blood and subjective measures of appetite were collected at baseline and at 30 min intervals for 120 min during recovery.

2.2. Participants

Thirteen recreationally-active females (mean ± SD, age 23 ± 4 years, body mass 63.5 ± 9.0 kg, stature 165.7 ± 6.3 cm, BMI 23.1 ± 2.9 kg·m2, O2peak 43.5 ± 11.6 mL·kg·min1) agreed to participate in this study. The study was conducted according to the guidelines laid down in the 2013 Declaration of Helsinki, and all experimental procedures involving human participants were approved by the Faculty of Health and Life Sciences Ethical Committee of the University of Northumbria. Written informed consent was obtained from all participants prior to data collection. Participants completed a self-report menstrual cycle questionnaire to determine menstrual cycle phase and contraceptive use (all participants were using oral contraceptives). Subsequently, all testing took place during the follicular phase of menstruation (days 1–14) to remove the impact of hormone interaction on substrate utilization [30].

2.3. Visit 1

Seven days preceding data collection, all participants underwent a familiarization session. Participants were familiarized with the equipment and methodological procedures that were to be employed in the study. This included the subjective appetite visual analogue scales (VAS), blood sampling, gas collection equipment, and all test foods. Secondly, as recommended by Livingstone et al. [31] participants were trained and educated on the processes required to appropriately document free-living energy intake. In addition, anthropometric measures of stature (stretch stature technique; Seca, Birmingham, UK) and body mass (Seca, Birmingham, UK) were collected to the nearest 0.1 cm and 0.1 kg, respectively. Finally, participants completed a discontinuous exercise test using a cycle ergometer to determine peak oxygen consumption (O2peak). The test comprised of 4 min increments separated with 2 min rest, during which workload increased until volitional exhaustion. From this, a work rate equivalent to participants’ 65% O2peak was established and used for subsequent visits. The O2peak protocol was completed at 70RPM. The first stage of the discontinuous test commenced at 70 watts (W), and the workload was subsequently increased by 35 W per stage until the participant reached volitional exhaustion.

2.4. Pre-Trial Standardization

For the 24 h preceding the first experimental trial participants recorded all food and fluid consumption using a self-reported, weighed food diary. Participants were also instructed to refrain from caffeine and alcohol consumption (≥12-h) and strenuous physical activity (≥24-h) preceding data collection periods. These dietary and exercise habits were replicated preceding subsequent trials.
On the morning of each experimental trial, participants consumed a pre-prepared standardized breakfast meal. This was consumed in the participants’ home at 0700 h, following at least a 10 h overnight fast. Breakfast consisted of semi-skimmed milk (Tesco, London, UK) and cereal (Kellogg’s Rice Krispies, Manchester, UK), provided to participants in a cereal to milk ratio of 30 g:125 mL. The quantity issued provided 10% of the participants estimated daily energy requirement (with 14%, 14%, and 72% of the energy in the breakfast derived from protein, fat and carbohydrate, respectively) as previously used and drawn from recommendations from the National Diet and Nutrition Survey [32]. Individual daily energy requirements were computed according to age- and sex-specific calculations [33], providing an estimate of basal metabolic rate. Estimated values of basal metabolic rate were further multiplied against a physical activity factor of 1.7. To ensure and monitor compliance, participants were requested to return empty breakfast containers.

2.5. Visit 2, 3, and 4

For other trials, participants arrived at the nutrition and metabolism laboratory at 0900 h. Upon waking and until arrival at the clinical testing laboratory the consumption of water only was permitted. Participants were requested to record, document, and replicate morning water consumption (if any) for subsequent trials. On arrival, participants were rested and an indwelling cannula was inserted into an antecubital vein for blood sampling. A pre-exercise (−60 min) blood sample was drawn and participants completed a series of pre-exercise subjective appetite VAS. Following pre-exercise measurements, participants completed 60 min continuous cycling exercise at a work rate that elicited 65% of each participants O2peak. During exercise, samples of expired air, heart rate, and ratings of perceived exertion (RPE) were obtained at regular intervals. On immediate termination of exercise, a recovery beverage was consumed (Table 1). Following consumption, participants remained at rest and completed a 120 min recovery period in an environment free from food cues, where further blood samples and VAS were collected every 30 min. At 120 min, a homogenous ad libitum pasta meal was provided. Participants were instructed to eat until comfortably full and satisfied, and were given 30 min to consume the meal. On completion of the ad libitum pasta meal participants were free to leave the laboratory. For the remainder of the study day, participants were requested to not engage in any type of activity and were asked to record any further food and drink intake using a weighed food diary.

2.6. Recovery Beverages

Participants were given 15 min to consume the entire contents of the beverage which included (1) a commercially available DBB (nouriSH me now™, Sheffield, UK); (2) a 15% commercially available carbohydrate beverage ((CHO) Lucozade Energy Orange™, GlaxoSmithKline, London, UK); or (3) an energy-free water control (H2O). All beverages were matched for volume, and DBB and CHO matched for energy content. Post-exercise recovery beverages were distributed in a counterbalanced manner. Beverages were served chilled at 4 °C and in opaque water bottles.

2.7. Gas Analysis

To collect gas samples, a mouthpiece attached to a two-way, non-rebreathing valve (model 2730, Hans Rudolph, Kansas City, MO, USA) was used. Gas samples, collected in Douglas Bags, were analysed for concentrations of oxygen and carbon dioxide using paramagnetic and infrared transducers, respectively (Service 5200S, Crowborough, Sussex, UK). In addition, bag volume and temperature of expired gas samples were determined using a dry gas meter (Harvard Apparatus, Edenbridge, Kent, UK) and thermistor (model 810-080, ETI, Worthing, UK), respectively. Expired gas samples (60 s) were collected at the end of every 10 min period (6 samples). From this the energy cost of exercise was estimated.

2.8. Subjective Appetite

Subjective measures of appetite were assessed using validated 100 mm, paper based VAS [34]. Scales were anchored with diametrically opposed feelings of extremity, and addressed hunger (“how hungry do you feel?”), gut fullness (“how full do you feel?”), prospective food consumption (“how much do you think you can eat?”), satisfaction (“how satisfied do you feel?”), and nausea (“how nauseous do you feel now?”). Participants were required to report their self-perceived appetite immediately prior to each blood sample (pre-exercise (−60), 30, 60, 90, and 120 min). Scales were issued in the same order at each sample point, and ratings measured by the same researcher to minimize discrepancies.

2.9. Blood Sampling and Analysis

At five separate intervals, antecubital-venous (4.0 mL) blood samples were drawn into pre-cooled EDTA-treated monovettes. Samples were collected at pre-exercise (−60) and at 30, 60, 90, and 120 min following recovery beverage consumption. Participants lay supine for approximately 5 min prior to each blood sample. Patency of the cannula was preserved by flushing a small volume of non-heparinized saline (0.9% NaCl; Becton, Dickinson and Company, Franklin Lakes, NJ, USA) through the connector tube on completion of each sample. Residual saline waste was discarded immediately before succeeding sample points, avoiding contamination and dilution of antecubital-venous blood.
Pre-analytical (e.g., sample treatment) and analytical (e.g., sample handling) procedures were followed in an identical manner to our previous studies [35,36]. Consequently, monovettes contained aprotinin (25 µL/mL whole blood) for the preservation of glucagon-like peptide 17-36 (GLP-17-36) and glucagon. On collection, samples were placed on ice and centrifuged at 1509× g (3000 rpm) for 10 min at 4 °C within 5 min of collection. Aliquots of plasma supernatant were stored immediately at −80 °C for later determination of glucose, non-esterified fatty acids (NEFA), GLP-17-36, glucagon, insulin, and leptin. From the aliquots, a 20 µL capillary tube was filled with plasma to determine glucose using an automated glucose analyser by the glucose oxidase method (Biosen C_Line, EKF Diagnostics, Cardiff, UK). Concentrations of NEFA (mmol/L) were determined using enzymatic colorimetric assays (Randox Laboratories, County Antrim, UK). Quantitative assessments of GLP-17-36 (pmol/L), glucagon (pg/mL), insulin (pmol/L), and plasma leptin (ng/mL) were simultaneously determined in 40 µL of plasma by electrochemiluminescence using a human hormone multiplex assay kit (Sector Imager 2400, MesoScale Discovery, Rockville, MD, USA). Of note, the addition of protease inhibitors to samples for the preservation of GLP-17-36 and glucagon does not influence measured concentrations of plasma leptin and insulin [37]. Each participant’s samples were analyzed on the same plate to minimize variation. Intra-assay CVs were <7% for all biochemical analysis except for GLP-17-36, which was 12%.

2.10. Energy Intake Assessment

Energy intake was assessed at two occasions. Firstly, lunchtime food intake (120 min) was assessed through ad libitum intake of a homogenous pasta meal. The meal comprised of pasta (Tesco, London, UK), tomato sauce (Tesco, London, UK), cheddar cheese (Tesco, London, UK), and olive oil (Tesco, London, UK). Detailed information concerning the nutrient composition of the pasta meal and the method of cooking has been reported previously [35]. The ad libitum test meal was consumed in isolation in a room free from social influences. Participants were initially provided with a sub-serving of the whole portion, which was continuously replenished by the research team at regular intervals throughout consumption. Continuously replenishing the pasta meal ensures participants terminate eating when comfortably full, and not due to the cue of an empty bowl. Energy intake from the pasta meal was calculated based on the amount consumed and nutritional composition as indicated by the manufacturer. To facilitate this, research staff covertly weighed the meal prior to serving, and immediately following meal termination. Secondly, participants recorded all food and drink items consumed for the remainder of each trial day, utilizing self-reported weighed records to document food intake. One member of the research team examined all food records utilizing the nutritional software package Nutritics (Nutritics Professional v3.09, Nutritics, Dublin, Ireland).

2.11. Statistical Analysis

All data are presented as mean ± standard error of the mean (SEM). Statistical software package (IBM SPSS v22, Armonk, NY, USA) was used for inferential analysis and significance was accepted at the p < 0.05 a priori. For data with multiple time-points (blood analyte concentrations and subjective appetite sensations), two-way (trial, 3 × time, 5) repeated measures analysis of variance (ANOVA) was performed to assess for differences in trial and time. Blood analyte concentrations and subjective appetite sensations during the 120 min recovery period (time points: 30, 60, 90, and 120 min) were also computed as time-averaged (90 min) concentrations using the trapezoidal rule [38]. Time-averaged concentrations for these variables during each trial were analyzed using one-way repeated measures ANOVA. Due to difficulties associated with blood sampling, where data for a single time point was missing (14 time points were missing out of a total 190 (<8%)) for each blood-based variable, linear interpolation was used to complete the data set. In addition, due to difficulties in data collection, subjective appetite data is presented for 10 participants.
One-way repeated measures ANOVAs were also used to detect differences between trials in exercise energy expenditure (MJ), absolute and relative energy intake at the test meal (MJ), and total energy intake (MJ). Absolute energy intake (MJ) was considered as the absolute amount of pasta consumed at the ad libitum test meal. Relative energy intake (MJ) (accounting for the energy content of the recovery beverages and energy cost during the cycling exercise) was determined by totalling absolute energy intake at the pasta meal with the energy content of the beverages and subtracting the energy cost of exercise (MJ). Total energy intake was determined as the sum of breakfast, recovery beverage, ad libitum test meal and free-living energy intake. Data were checked for normal distribution with the use of the Kolmogorov-Smirnov normality test and were log-transformed if appropriate before statistical analysis. Mauchley’s test assessed the sphericity of the data and where appropriate, violations were corrected using the Greenhouse-Geisser estimate. Where significant effects occurred, post-hoc analyses were Bonferroni-adjusted paired t-tests. Unless otherwise stated, 95% confidence intervals (95% CI) are presented for mean differences between trials.

3. Results

3.1. Exercise Measurements
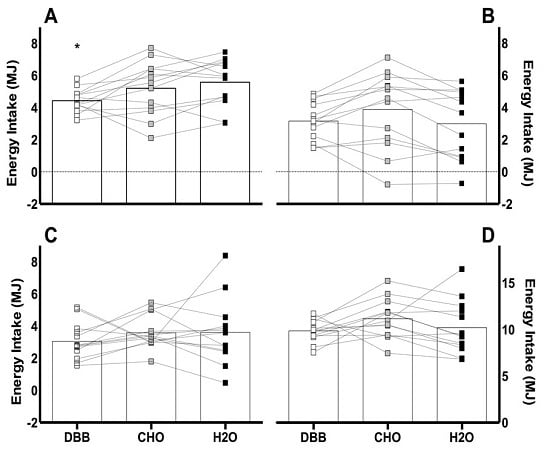
Gross energy cost during the 60 min cycling exercise was 2.64 ± 0.26 MJ (DBB), 2.69 ± 0.29 MJ (CHO), and 2.59 ± 0.24 MJ (H2O) and was not different between trials (p = 0.409; (grand mean 95% CI: 2.07, 3.21)). Sessional RPEs were not significantly different between trials (p = 0.657; (grand mean of 12 ± 1 and 95% CI: 11, 13)). Similarly the mean HR during the 60 min exercise was not different between trials (p = 0.326; (grand mean of 155 ± 4 and 95% CI: 146, 164 bpm)).

3.2. Energy Intake

Energy intake at the ad libitum pasta meal (Figure 1) was lower following DBB compared to H2O (4.43 ± 0.20, 5.58 ± 0.41 MJ, respectively; p = 0.046; (95% CI: −2.28, −0.20)), but was no different to CHO (5.21 ± 0.46 MJ p = 0.211; (95% CI: −1.88, 0.31)). Further analysis revealed this was not influenced by trial order (p = 0.164). No statistical differences were found between trials for relative energy intake, free-living energy intake or total energy intake. At the ad libitum meal, the Delta (Δ) relative energy intake between trials were 0.16 ± 0.38, 0.89 ± 0.29, and −0.73 ± 0.42 MJ for DBB-H2O, CHO-H2O, and DBB-CHO, respectively. For total daily energy intake, Delta (Δ) values between trials were −0.34 ± 0.89, 0.95 ± 0.61, and −1.29 ± 0.67 MJ for DBB-H2O, CHO-H2O, and DBB-CHO, respectively.

3.3. Subjective Appetite Responses

Analysis revealed differences across all trials for time-averaged subjective appetite measures, except for nausea (Table 2). Relative to H2O control, DBB, and CHO enhanced subjective fullness (p = 0.003; (95% CI: 10.8, 44.9 mm), and p = 0.021; (95% CI: 2.0, 24.5 mm), respectively), and satisfaction (p = 0.014; (95% CI: 5.3, 44.0 mm), and p = 0.012; (95% CI: 3.8, 30.1 mm), respectively). Consistent with this, subjective hunger was lower following DBB and CHO compared to H2O control (p = 0.032; (95% CI: −37.9, −1.7 mm), and p = 0.019; (95% CI: −18.5, −1.8 mm), respectively). In addition, DBB reduced prospective food consumption (p = 0.008; (95% CI: −31.5, −5.4 mm)) compared to H2O. Analysis revealed main effects of time and trial for all subjective appetite measures. Time × trial interaction (p = 0.005) showed that satisfaction was reduced at 30 and 60 min following H2O control relative to DBB (p = 0.019; (95% CI: −62.8, −5.8 mm), and p = 0.009; (95% CI: −53.8, −8.6 mm), respectively) and CHO (p = 0.032; (95% CI: −37.9, −1.7 mm), and p = 0.004; (95% CI: −34.2, −7.2 mm), respectively). At 120 min, satisfaction following CHO consumption was greater than that following H2O (p = 0.036; (95% CI: 0.6, 17.6 mm)).

3.4. Blood Parameters

3.4.1. Plasma Glucose

Time-averaged glucose was higher following CHO compared to DBB (4.84 ± 0.39, 3.67 ± 0.17 mmol/L, respectively; p = 0.001; (95% CI: 0.38, 1.96)) but not to H2O (4.05 ± 0.16 mmol/L; p = 0.169; (95% CI: −0.16, 1.75)). There was no difference between DBB and H2O (p = 0.355; (95% CI: −0.96, 0.22)) (Figure 2A). A time × trial interaction (p < 0.001) revealed that the increase in glucose at 30 min post beverage ingestion was highest in CHO compared to DBB and H2O control (p = 0.023; (95% CI: 0.23, 3.23), and p = 0.007; (95% CI: 0.58, 3.61) respectively), and remained elevated compared to DBB at 60 and 90 min post beverage consumption (p = 0.015; (95% CI: 0.22, 2.01), and p = 0.007; (95% CI: 0.29, 1.67), respectively) (Figure 2B).

3.4.2. Plasma NEFA

Time-averaged NEFA was lower following DBB (0.36 ± 0.06 mmol/L) compared to CHO (0.58 ± 0.09 mmol/L; p = 0.039; (95% CI: −0.47, 0.03)) and H2O (1.21 ± 0.16 mmol/L; p < 0.001; (95% CI: −1.33, −0.37)). There was no difference between CHO and H2O (p = 0.068; (95% CI: −1.25, −0.01)) (Figure 2C). Main effects for time and trial were observed following two-way repeated measures ANOVA. A time × trial interaction (p = 0.001) revealed that increases in NEFA at 30 min post beverage consumption were greater in H2O compared to DBB (p = 0.042; (95% CI: 0.01, 0.61)). Plasma NEFA concentrations 60 min post beverage consumption were reduced in DBB (p = 0.001; (95% CI: −0.93, −0.25)), and for both DBB and CHO at 90 min (p < 0.001; (95% CI: −1.04, −0.43), and p = 0.028; (95% CI: −0.97, −0.05), respectively) and 120 min (p < 0.001; (95% CI: −0.62, −0.22), and p = 0.030; (95% CI: −0.62, −0.03), respectively) post beverage consumption compared to H2O (Figure 2D).

3.4.3. Plasma Leptin

No differences in time-averaged leptin were evident between test beverages (17.17 ± 1.59, 22.08 ± 6.79, 25.30 ± 6.67 ng/mL for DBB, CHO and H2O, respectively; p = 0.289; (grand mean 95% CI: 11.42, 31.62)) (Figure 2E) and two-way anova demonstrated main effect of time across trials only (Figure 2F).

3.4.4. Plasma Insulin

Time-averaged insulin was higher following consumption of DBB compared to H2O (783.85 ± 83.96, 392.58 ± 98.14 pmol/L respectively; p = 0.015; (95% CI: 69.18, 713.36)) but not to CHO (747.3 ± 109.73 pmol/L; p = 1.00; (95% CI: −270.02, 343.11)). There was no difference between CHO and H2O (p = 0.152; (95% CI: −136.94, 846.39) (Figure 3A). Main effects for time and trial were observed following two-way repeated measures ANOVA. A time × trial interaction (p < 0.001) revealed that the increase in insulin was greater in DBB compared to H2O at 30 min (p = 0.001; (95% CI: 0.27, 0.96)) and 60 min (p < 0.001; (95% CI: 0.22, 0.69)) post beverage ingestion (Figure 3B).

3.4.5. Plasma Glucagon

Time-averaged glucagon was higher following DBB compared to CHO (133.6 ± 6.1, 105.4 ± 9.0 pg/mL respectively; p = 0.008; (95% CI: 5.3, 51.1)) but not to H2O (113.2 ± 10.1 pg/mL; p = 0.074; (95% CI: −9.7, 50.6)). There was no difference between CHO and H2O (p = 0.911; (95% CI: −28.4, 12.9) (Figure 3C). While main effects for time and trial were observed, no interaction effects were present (Figure 3D).

3.4.6. Plasma GLP-17-36

Time-averaged GLP-17-36 was higher following DBB compared to H2O (6.13 ± 0.69, 3.55 ± 0.38 pmol/L respectively; p = 0.001; (95% CI: 0.79, 4.36)) but not to CHO (5.24 ± 0.81 pmol/L; p = 0.146; (95% CI: −0.63, 2.41)). There was no difference between CHO and H2O (p = 0.249; (95% CI: −0.53, 3.91) (Figure 3E). Two-way ANOVA demonstrated a main effect of time across trials and a main effect of trial (Figure 3F).

4. Discussion

To our knowledge, while our previous work has examined the effect of post-exercise DBB consumption on subsequent appetite and energy intake in active females [28], this is the first study where measures of relevant hormonal appetite-related peptides were also quantified. The main findings arising from this study are that post-exercise DBB consumption reduced energy intake at the ad libitum meal by 23% (1.14 MJ; p = 0.046), and 16% (0.78 MJ; p = 0.211) compared to H2O and CHO consumption, respectively, while subsequent appetite (subjective and hormonal appetite-related peptides) and energy intake was similar between the commercially available beverages. In addition, although significance was not obtained, DBB reduced overall energy intake by −1.29 ± 0.67 MJ compared to a volume and energy matched CHO beverage. It is recognized that post-exercise DBB consumption may enhance muscle protein synthesis [2], attenuate exercise-induced muscle damage [3,4,5,6,7], and increase rehydration [8], thus manifesting in accelerated recovery and improved performance [9]. Consequently, these data may begin to illustrate an additional role for DBB consumption in the immediate post-exercise period for individuals exercising for weight loss/maintenance purposes, though further research is warranted to substantiate these initial findings.
The results concerning energy intake at the ad libitum meal are concordant with a previous study investigating the effects of post-exercise beverage macro-nutrient content on appetite and energy intake [39]. Clayton and colleagues [39] found that ad libitum energy intake (following 30 min cycling exercise and 60 min after drink ingestion) was lower following a 6% whey protein isolate solution compared to a placebo, but was not different after an isoenergetic carbohydrate beverage. Early research suggests that the energy content of a beverage is the only property that significantly affects energy intake at a subsequent meal as opposed to nutritional composition [40]. Consequently, considering the recovery beverages used in this study were matched for energy content it may be unsurprising that energy intake at a subsequent ad libitum meal was similar between DBB and CHO. Interestingly, at the ad libitum meal, 10 of 13 participants consumed less energy following DBB when compared to both H2O and CHO. However as expected, when the energy content of the beverages were considered, H2O elicited the greatest reduction in relative energy intake at the ad libitum meal as demonstrated by the delta (Δ) values; 0.16 ± 0.38, 0.89 ± 0.29, and −0.73 ± 0.42 MJ for DBB-H2O, CHO-H2O and DBB-CHO, respectively. Similarly, when all food intake was considered, total daily energy intake was not significantly different between DBB (9.86 ± 0.33 MJ) compared to H2O (10.20 ± 0.79 MJ) and CHO (11.15 ± 0.58 MJ). These findings are in agreement with the recent study by Clayton et al. [39]. However, when delta (Δ) between trials for total daily energy intake is considered, DBB delivered the greatest reduction in total daily energy intake compared to other trials (−0.34 ± 0.89, 0.95 ± 0.61 and −1.29 ± 0.67 MJ for DBB-H2O, CHO-H2O ,and DBB-CHO, respectively). Indeed, 11 of 13 participants consumed less total daily energy following DBB compared to CHO and six compared to H2O. It has been suggested in the scientific literature that daily deficits in energy intake of 0.71 MJ (712 kJ, 170 kcal) may be “clinically” meaningful from a weight loss and/or maintenance perspective [41]. Based on our findings, one may speculate that post-exercise DBB and/or H2O consumption shows some promise as a potential application for weight maintenance or loss compared to a volume and energy matched CHO beverage, although the added nutritional benefit of DBB must be considered. Nevertheless, further research is certainly warranted to establish whether longer-term post-exercise DBB consumption serves as a beverage to aid weight maintenance and weight loss.
Relative to carbohydrate-based beverages and water, dairy beverages contribute significantly to the consumption of high-quality proteins. It is suggested that dietary proteins are more satiating than energetic equivalents of carbohydrate or fat under most conditions, and suppress short-term energy intake at the next available opportunity [19,42,43]. In support of this, the effect of high protein food on short-term food intake reflects subjective measurements of appetite [19]. Foods high in protein not only suppress short-term food intake to a greater extent than carbohydrate and fat but also provide strong feelings of satiety after their consumption [43,44]. In this study, consumption of DBB and CHO recovery beverages elicited similar responses on subjective appetite compared with H2O, and may suggest that the energy content of a beverage remains the primary characteristic influencing subsequent appetite responses [39]. It is important to note, however, that alterations in subjective perceptions of food-related emotions do not always translate and reflect actual eating behaviour [45]. In our previous study, for example, significant reductions in relative energy intake were observed 60 min following 30 min of cycling, yet did not impact on subjective appetite [28]. Furthermore, reductions in subsequent energy intake and appetite responses have principally been observed after consuming beverages containing large amounts (30 + g) of protein [28,46]. It is probable that our study was underpowered to detect differences in energy intake deemed clinically meaningful [41] following DBB consumption. In addition, we may not have observed a sufficiently large reduction in energy intake following DBB consumption due to our methodological approach (e.g., insufficient protein content of the beverages, exercise duration, and time lapse between exercise and consumption of the test meal).
In an attempt to establish the physiological effects of exercise and post-exercise dairy beverage consumption, we measured hormonal peptides of gastrointestinal, pancreatic, and adipose tissue origin that are implicated in appetite regulation and metabolism. Importantly, a growing body of evidence suggests that an acute bout of aerobic exercise (perhaps more so than resistance exercise) influences appetite-related hormones (for review please refer to [47]). While exercise may confer only transient changes in circulating hormones, the suppression offered by the exercise itself may have contributed to the appetite responses and subsequent energy intake that was observed in the present investigation. Having said this, given that the acute exercise bout employed was repeated across trials, the contribution of exercise would have been analogous. Consequently, any differences between trials were likely due to the recovery beverage consumed. The postprandial response of these peptides is profoundly influenced by energy consumed as well as the distribution of ingested macro- (and micro-) nutrients. For example, circulating concentrations of GLP-17-36 increase immediately following food consumption in direct proportion to energy content [48], but similarly when carbohydrates and fats are present [49]. Postprandial concentrations of glucagon are more capricious, but rise following fasting, protein ingestion [50] or exercise [51]. It may therefore be unsurprising that post-exercise DBB and CHO consumption resulted in a greater plasma GLP-17-36, considering both beverages were isoenergetic (1.36 MJ). Furthermore, the elevated postprandial glucagon and insulin concentrations following DBB consumption may have been predictable due to its protein content. Although several studies have demonstrated glucagon, GLP-17-36 and insulin to potently increase satiety and acutely reduce food intake in humans [52,53,54], the findings from this study do not fully support this. Together, the differences in subjective appetite and appetite-related peptides may have been insufficient to stimulate larger differences in subsequent energy intake; namely when comparing CHO and H2O, and DBB and CHO at the ad libitum meal, and energy intake beyond the first meal. Outside of the effects of protein on satiety, it is well established that protein elicits a greater effect on diet induced thermogenesis (20%–35% of energy consumed) compared to energy matched intakes of carbohydrate (5%–15% of energy consumed) or fat (0%–3% of energy consumed) [55]. Indeed, early investigations have reported an increased thermogenic effect after consumption of a DBB in comparison to an energy matched sugary beverage [56]. Additionally, there is evidence suggesting that glucagon [57,58] and calcium exerts properties that may stimulate energy expenditure and lipid utilization [58]. While not directly measured in the present investigation, collectively, this suggests that post-exercise DBB consumption may have further impacted on energy balance through an increase in energy expenditure and, perhaps, through altered substrate utilization.
Though the work presented throughout this manuscript has numerous strengths, the findings are not without limitation and warrant mention. Firstly, the results arising from this manuscript are drawn from an acute intervention. Consequently, observations require careful interpretation, as study findings may not translate over extended periods. In addition, the present findings are limited by the relatively small population sample of healthy recreationally-active females and, thus, the relevance to a wider population needs further evaluation. Nonetheless, research concerning the consumption of DBB on appetite and postprandial hormonal response is sparse, particularly in females. The observations arising from this study are therefore novel and present important information about post-exercise beverage consumption for females, especially as differences in energy-regulating hormones following exercise have been reported between men and women [59]. In turn, participants’ preconceived attitudes concerning the recovery beverages may have confounded any observations. While our study design provided robust experimental control, the provision of a limited meal (cheese and tomato pasta) and a pre-determined volume of the recovery beverage may not truly reflect actual free-living behaviours, especially considering this was repeated over three trials. Indeed, factors associated with palatability and gastrointestinal discomfort may have induced an element of progressive dislike that (if faced with) may have influenced subsequent eating behaviour and, thus, satiety.

5. Conclusions

Considered together nonetheless, the present study demonstrates that the consumption of a DBB beverage immediately following exercise reduces overall energy intake by approximately −1.29 ± 0.67 MJ, compared to a volume and energy matched CHO beverage, despite eliciting similar responses concerning subsequent appetite and hormonal peptide responses. Consequently, the influence of post-exercise DBB consumption on subsequent appetite and energy intake remain unclear. Despite this, it is important to consider that DBB represent a nutrient-dense foodstuff and encompass an array of nutrients that confer numerous health benefits and may enhance post-exercise recovery, while contributing significantly to the consumption of high-quality nutrients and numerous bioactive constituents. Further research is warranted to fully elucidate the mechanisms influencing subsequent appetite and energy intake suppression in response to DBB and exercise, both alone and in combination.

Acknowledgments

The authors thank all participants for volunteering to take part in the study. The authors would also like to extend their gratitude to Emily Shaw and Sarah Cunnold for their assistance with data collection. Emma J. Stevenson and Penny L.S. Rumbold have previously received funding from The Dairy Council (UK), which was not related in any way to the work in this article. In addition, Emma J. Stevenson and Penny L.S. Rumbold received funding from nouriSH me now™ to conduct the present study, but the founding sponsors had no role in the design of the study; in the collection, analyses, or interpretation of data, in the writing of the manuscript, and in the decision to publish the results.

Author Contributions

Conceived and designed the experiments: Benjamin P. Green, Lewis J. James, Emma J. Stevenson, and Penny L.S. Rumbold. Performed the experiments: Benjamin P. Green and Meghan A. Brown. Analyzed the data: Meghan A. Brown. Wrote the manuscript: Benjamin P. Green and Meghan A. Brown. All authors critically reviewed and approved the final manuscript.

Conflicts of Interest

The authors declare no conflict of interest.

Abbreviations

The following abbreviations have been used throughout this manuscript.
CHOCarbohydrate beverage
CIConfidence interval
DBBDairy-based beverage
GLP-17-36Glucagon-like peptide-1
H2OWater control
NEFANon-esterified fatty acids
VASVisual analogue scale

References

  1. James, L. Milk ingestion in athletes and physically active individuals. Nutr. Bull. 2012, 37, 257–261. [Google Scholar] [CrossRef]
  2. Moore, D.R.; Robinson, M.J.; Fry, J.L.; Tang, J.E.; Glover, E.I.; Wilkinson, S.B.; Prior, T.; Tarnopolsky, M.A.; Phillips, S.M. Ingested protein dose response of muscle and albumin protein synthesis after resistance exercise in young men. Am. J. Clin. Nutr. 2009, 89, 161–168. [Google Scholar] [CrossRef] [PubMed]
  3. Cockburn, E.; Bell, P.G.; Stevenson, E. Effect of milk on team sport performance after exercise-induced muscle damage. Med. Sci. Sports Exerc. 2013, 45, 1585–1592. [Google Scholar] [CrossRef] [PubMed]
  4. Cockburn, E.; Hayes, P.R.; French, D.N.; Stevenson, E.; St Clair, G.A. Acute milk-based protein—CHO supplementation attenuates exercise-induced muscle damage. Appl. Physiol. Nutr. Metab. 2008, 33, 775–783. [Google Scholar] [CrossRef] [PubMed]
  5. Cockburn, E.; Robson-Ansley, P.; Hayes, P.R.; Stevenson, E. Effect of volume of milk consumed on the attenuation of exercise-induced muscle damage. Eur. J. Appl. Physiol. 2012, 112, 3187–3194. [Google Scholar] [CrossRef] [PubMed]
  6. Cockburn, E.; Stevenson, E.; Hayes, P.R.; Robson-Ansley, P.; Howatson, G. Effect of milk-based carbohydrate-protein supplement timing on the attenuation of exercise-induced muscle damage. Appl. Physiol. Nutr. Metab. 2010, 35, 270–277. [Google Scholar] [CrossRef] [PubMed]
  7. Rankin, P.; Stevenson, E.; Cockburn, E. The effect of milk on the attenuation of exercise-induced muscle damage in males and females. Eur. J. Appl. Physiol. 2015, 115, 1245–1261. [Google Scholar] [CrossRef] [PubMed]
  8. Shirreffs, S.M.; Waston, P.; Maughan, R.J. Milk as an effective post-exercise rehydration drink. Br. J. Nutr. 2007, 98, 173–180. [Google Scholar] [CrossRef] [PubMed]
  9. Thomas, K.; Morris, P.; Stevenson, E.J. Improved endurance capacity following chocolate milk consumption compared with 2 commercially available sports drink. Appl. Physiol. Nutr. Metab. 2009, 34, 78–82. [Google Scholar] [CrossRef] [PubMed]
  10. Kliem, K.E.; Givens, D.I. Dairy products in the food chain: Their Impact on Health. Annu. Rev. Food Sci. Technol. 2011, 2, 21–36. [Google Scholar] [CrossRef] [PubMed]
  11. Bos, C.; Metges, C.C.; Gaudichon, C.; Petze, K.J.; Pueyo, M.E.; Morens, C.; Everwand, J.; Benamouzig, R.; Tome, D. Postprandial kinetics of dietary amino acids are the main determinant of their metabolism after soy or milk protein ingestion in humans. J. Nutr. 2003, 133, 1308–1315. [Google Scholar] [PubMed]
  12. Wilkinson, S.B.; Tarnopolsky, M.A.; Macdonald, M.J.; Macdonald, J.R.; Armstrong, D.; Phillips, S.M. Consumption of fluid skim milk promotes greater muscle protein accretion after resistance exercise than does consumption of an isonitrogenous and isoenergetic soy-protein beverage. Am. J. Clin. Nutr. 2007, 85, 1031–1040. [Google Scholar] [PubMed]
  13. Beelen, M.; Burke, L.M.; Gibala, M.J.; van Loon, L.J.C. Nutritional strategies to promote postexercise Recovery. Int. J. Sport Nutr. Exerc. Metab. 2010, 20, 515–532. [Google Scholar] [PubMed]
  14. James, L.J.; Clayton, D.; Evans, G.E. Effect of milk protein addition to a carbohydrate-electrolyte rehydration solution ingested after exercise in the heat. Br. J. Nutr. 2011, 105, 393–399. [Google Scholar] [CrossRef] [PubMed]
  15. Zemel, M.B.; Donnelly, J.E.; Smith, B.K.; Sullivan, D.K.; Richards, J.; Morgan-Hanusa, D.; Bailey, B.W. Effects of dairy intake on weight maintenance. Nutr. Metab. 2008, 5, 28. [Google Scholar] [CrossRef] [PubMed]
  16. Zemel, M.B.; Shi, H.; Greer, B.; Dirienzo, D.; Zemel, P.C. Regulation of adiposity by dietary calcium. FASEB J. 2000, 14, 1132–1138. [Google Scholar] [PubMed]
  17. Dougkas, A.; Minihane, A.M.; Givens, D.I.; Reynolds, C.K.; Yaqoob, P. Differential effects of dairy snacks on appetite, but not overall energy intake. Br. J. Nutr. 2012, 108, 1–12. [Google Scholar] [CrossRef] [PubMed]
  18. Schneeman, B.O.; Burton-Freeman, B.; Davis, P. Incorporating dairy foods into low and high fat diets increases the postprandial cholecystokinin response in men and women. J. Nutr. 2003, 133, 4124–4128. [Google Scholar] [PubMed]
  19. Anderson, G.H.; Moore, S.E. Dietary proteins in the regulation of food intake and body weight in humans. J. Nutr. 2004, 134, 974S–979S. [Google Scholar] [PubMed]
  20. Bowen, J.; Noakes, M.; Clifton, P.M. Appetite regulatory hormone responses to various dietary proteins differ by body mass index status despite similar reductions in ad libitum energy intake. J. Clin. Endocrinol. Metab. 2006, 91, 2913–2919. [Google Scholar] [CrossRef] [PubMed]
  21. Luhovyy, B.L.; Akhavan, T.; Anderson, G.H. Whey proteins in the regulation of food intake and satiety. J. Am. Coll. Nutr. 2007, 26, 704S–712S. [Google Scholar] [CrossRef] [PubMed]
  22. Lluch, A.; Hanet-Geisen, N.; Salah, S.; Salas-Salvadó, J.; L’Heureux-Bouron, D.; Halford, J.C.G. Short-term appetite-reducing effects of a low-fat dairy product enriched with protein and fibre. Food Qual. Pref. 2010, 21, 402–409. [Google Scholar] [CrossRef]
  23. Dove, E.R.; Hodgson, J.M.; Puddey, I.B.; Beilin, L.J.; Lee, Y.P.; Mori, T.A. Skim milk compared with a fruit drink acutely reduces appetite and energy intake in overweight men and women. Am. J. Clin. Nutr. 2009, 90, 70–75. [Google Scholar] [CrossRef] [PubMed]
  24. Aziz, A.; Anderson, G.; Saarela, M. The effects of dairy components on food intake and satiety. Funct. Dairy Prod. 2007, 2, 19–44. [Google Scholar]
  25. King, J.A.; Miyashita, M.; Wasse, L.K.; Stensel, D.J. Influence of prolonged treadmill running on appetite, energy intake and circulating concentrations of acylated ghrelin. Appetite 2010, 54, 492–498. [Google Scholar] [CrossRef] [PubMed] [Green Version]
  26. Schubert, M.M.; Desbrow, B.; Sabapathy, S.; Leveritt, M. Acute exercise and subsequent energy intake. A meta-analysis. Appetite 2013, 6, 92–104. [Google Scholar] [CrossRef] [PubMed]
  27. Duckworth, L.C.; Backhouse, S.H.; Stevenson, E.J. The effect of galactose ingestion on affect of perceived exertion in recreationally active females. Appetite 2013, 71, 252–258. [Google Scholar] [CrossRef] [PubMed]
  28. Rumbold, P.L.S.; Shaw, E.; James, L.; Stevenson, E. Milk consumption following exercise reduces subsequent energy intake in female recreational exercisers. Nutrients 2015, 7, 293–305. [Google Scholar] [CrossRef] [PubMed]
  29. Urbaniak, G.C.; Plous, S. Research Randomizer (version 4.0). Middletown, CT, USA, 2013. Available online: http://www.randomizer.org (accessed on 28 May 2014).
  30. Zderic, T.W.; Coggan, A.R.; Ruby, B.C. Glucose kinetics and substrate oxidation during exercise in the follicular and luteal phases. J. Appl. Physiol. 2001, 90, 447–453. [Google Scholar] [CrossRef] [PubMed]
  31. Livingstone, M.B.; Prentice, A.M.; Coward, W.A.; Strain, J.J.; Black, A.E.; Davies, P.S.; Stewart, C.M.; McKenna, P.G.; Whitehead, R.G. Validation of estimates of energy intake by weighed dietary record and diet history in children and adolescents. Am. J. Clin. Nutr. 1992, 56, 29–35. [Google Scholar] [PubMed]
  32. Astbury, N.M.; Taylor, M.A.; French, S.J.; Macdonald, I.A. Snacks containing whey protein and polydextrose induce a sustained reduction in daily energy intake over 2 wk under free-living conditions. Am. J. Clin. Nutr. 2014, 99, 1131–1140. [Google Scholar] [CrossRef] [PubMed]
  33. Schofield, W.M. Predicting basal metabolic rate, new standards and review of previous work. Hum. Nutr. Clin. Nutr. 1985, 39, 5–41. [Google Scholar] [PubMed]
  34. Flint, A.; Raben, A.; Blundell, J.E.; Astrup, A. Reproducibility, power and validity of visual analogue scales in assessment of appetite sensations in single test meal studies. Int. J. Obes. 2000, 24, 38–48. [Google Scholar] [CrossRef]
  35. Gonzalez, J.T.; Green, B.P.; Brown, M.A.; Rumbold, P.L.S.; Turner, L.A.; Stevenson, E.J. Calcium ingestion suppresses appetite and produces acute overcompensation of energy intake independent of protein in healthy adults. J. Nutr. 2015, 145, 476–482. [Google Scholar] [CrossRef] [PubMed]
  36. Gonzalez, J.T.; Green, B.P.; Campbell, M.D.; Rumbold, P.L.S.; Stevenson, E.J. The influence of calcium supplementation on substrate metabolism during exercise in humans: A randomized controlled trial. Eur. J. Clin. Nutr. 2014, 68, 712–718. [Google Scholar] [CrossRef] [PubMed] [Green Version]
  37. Bielohuby, M.; Popp, S.; Bidlingmaier, M. A guide for measurement of circulating metabolic hormones in rodents: Pitfalls during the pre-analytical phase. Mol. Metab. 2012, 1, 47–60. [Google Scholar] [CrossRef] [PubMed]
  38. Wolever, T.M.; Jenkins, D.J. The use of the glycemic index in predicting the blood glucose response to mixed meals. Am. J. Clin. Nutr. 1986, 43, 167–172. [Google Scholar] [PubMed]
  39. Clayton, D.J.; Stensel, D.J.; Watson, P.; James, L.J. The effect of post-exercise drink macronutrient content on appetite and energy intake. Appetite 2014, 82, 173–179. [Google Scholar] [CrossRef] [PubMed]
  40. DellaValle, D.M.; Roe, L.S.; Rolls, B.J. Does the consumption of caloric and non-caloric beverages with a meal affect energy intake? Appetite 2005, 44, 187–193. [Google Scholar] [CrossRef] [PubMed]
  41. Hill, J.O.; Wyatt, H.R.; Reed, G.W.; Peters, J.C. Obesity and the environment: Where do we go from here? Science 2003, 299, 853–855. [Google Scholar] [CrossRef] [PubMed]
  42. Astrup, A. The satiating power of protein—A key to obesity prevention? Am. J. Clin. Nutr. 2005, 82, 1–2. [Google Scholar] [PubMed]
  43. Rolls, B.J.; Hetherington, M.; Burley, V.J. The specificity of satiety: The influence of foods of different macronutrient content on the development of satiety. Physiol. Behav. 1988, 43, 145–153. [Google Scholar] [CrossRef]
  44. Stubbs, R.J.; O’Reilly, L.M.; Johnstone, A.M.; Harrison, C.L.; Clark, H.; Franklin, M.F.; Reid, C.A.; Mazlan, N. Description and evaluation of an experimental model to examine changes in selection between high-protein, high-carbohydrate and high-fat foods in humans. Eur. J. Clin. Nutr. 1999, 53, 13–21. [Google Scholar] [CrossRef] [PubMed]
  45. Mattes, R. Hunger ratings are not a valid proxy measure of reported food intake in humans. Appetite 1990, 15, 103–113. [Google Scholar] [CrossRef]
  46. Bertenshaw, E.J.; Lluch, A.; Yoemans, M.R. Satiating effects of protein but not carbohydrate consumed in between-meal beverage context. Physiol. Behav. 2008, 93, 427–436. [Google Scholar] [CrossRef] [PubMed]
  47. Howe, S.M.; Hand, T.M.; Manore, M.M. Exercise-trained men and women: Role of exercise and diet on appetite and energy intake. Nutrients 2014, 6, 4935–4960. [Google Scholar] [CrossRef] [PubMed]
  48. Huda, M.S.B.; Wilding, J.P.H.; Pinkney, J.H. Gut peptides and the regulation of appetite. Obes. Rev. 2006, 7, 163–182. [Google Scholar] [CrossRef] [PubMed]
  49. Iakoubov, R.; Izzo, A.; Yeung, A.; Whiteside, C.I.; Brubaker, P.L. Protein kinase Cζ is required for oleic acid-induced secretion of glucagon-like peptide-1 by intestinal endocrine L cells. Endocrinology 2007, 148, 1089–1098. [Google Scholar] [CrossRef] [PubMed]
  50. Marroquí, L.; Alonso-Magdalena, P.; Merino, B.; Fuentes, E.; Nadal, A.; Quesada, I. Nutrient regulation of glucagon secretion: Involvement in metabolism and diabetes. Nutr. Res. Rev. 2014, 27, 48–62. [Google Scholar] [CrossRef] [PubMed]
  51. Anderson, R.A.; Polansaky, M.M.; Bryden, N.A.; Roginski, E.E.; Patterson, K.Y.; Reamer, D.C. Effect of exercise (running) on serum glucose, Insulin, Glucagon, and Chromium Excretion. Diabetes 1982, 31, 212–216. [Google Scholar] [CrossRef] [PubMed]
  52. Flint, A.; Gregersen, N.T.; Gluud, L.L.; Møller, B.K.; Raben, A.; Tetens, A.; Verdich, C.; Astrup, A. Associations between postprandial insulin and blood glucose responses, appetite sensations and energy intake in normal weight and overweight individuals: A meta-analysis of test meal studies. Br. J. Nutr. 2007, 98, 17–25. [Google Scholar] [CrossRef] [PubMed]
  53. Parker, J.A.; McCullough, K.A.; Field, B.C.T.; Minnion, J.S.; Martin, N.M.; Ghatei, M.A.; Bloom, S.R. Glucagon and GLP-1 inhibit food intake and increase c-fos expression in similar appetite regulating centres in the brainstem and amygdala. Int. J. Obes. 2013, 37, 1391–1398. [Google Scholar] [CrossRef] [PubMed]
  54. Penick, S.B.; Hinkle, L.E.; Paulsen, E.G. Depression of food intake induced in healthy subjects by glucagon. N. Engl. J. Med. 1961, 264, 893–897. [Google Scholar] [CrossRef] [PubMed]
  55. Halton, T.L.; Hu, F.B. The effects of high protein diets on thermogenesis, satiety and weight loss: A critical review. J. Am. Coll. Nutr. 2004, 23, 373–385. [Google Scholar] [CrossRef] [PubMed]
  56. St-Onge, M.P.; Rubiano, F.; DeNino, W.F.; Jones, A., Jr.; Greenfield, D.; Ferguson, P.W.; Akrabawi, S.; Heymsfield, S.B. Added thermogenic and satiety effects of a mixed nutrient vs. a sugar-only beverage. Int. J. Obes. 2004, 28, 248–253. [Google Scholar] [CrossRef] [PubMed]
  57. Heppner, K.M.; Habegger, K.M.; Day, J.; Pfluger, P.T.; Perez-Tilve, D.; Ward, B.; Gelfanov, V.; Woods, S.C.; DiMarchi, R.; Tschöp, M. Glucagon regulation of energy metabolism. Physiol. Behav. 2010, 100, 545–548. [Google Scholar] [CrossRef] [PubMed]
  58. Melanson, E.L.; Sharp, T.A.; Schneider, J.; Donahoo, W.T.; Grunwald, G.K.; Hill, J.O. Relation between calcium intake and fat oxidation in adult humans. Int. J. Obes. 2003, 27, 196–203. [Google Scholar] [CrossRef] [PubMed]
  59. Hagobian, T.A.; Sharoff, C.G.; Stephens, B.R.; Wade, G.N.; Silva, E.; Chipkin, S.R.; Braun, B. Effects of exercise on energy-regulating hormones and appetite in men and women. Am. J. Physiol. Regul. Integr. Comp. Physiol. 2009, 296, R233–R242. [Google Scholar] [CrossRef] [PubMed]
Figure 1. Mean and individual responses for absolute (A, n = 13), and relative (B, n = 13) energy intake at the ad libitum meal, free-living (C, n = 13) and total (D, n = 13) energy intake (MJ). Values are presented as mean alongside individual responses. Significance at the p < 0.05 level. * denotes a significant difference compared to H2O.
Nutrients 08 00355 g001
Figure 2. Time-average (90 min) (A,C,E) and plasma concentrations (B,D,F) of glucose (mmol/L), NEFA (mmol/L), and leptin (ng/mL), respectively, pre (−60) and throughout the 120 min recovery period (n = 13). Vertical grey shaded area (B,D,F) represent the 60 min cycling bout. Values are presented as mean ± SEM. Values with unlike letters (a,b) denote significant difference between trials. White filled boxes ( Nutrients 08 00355 i001
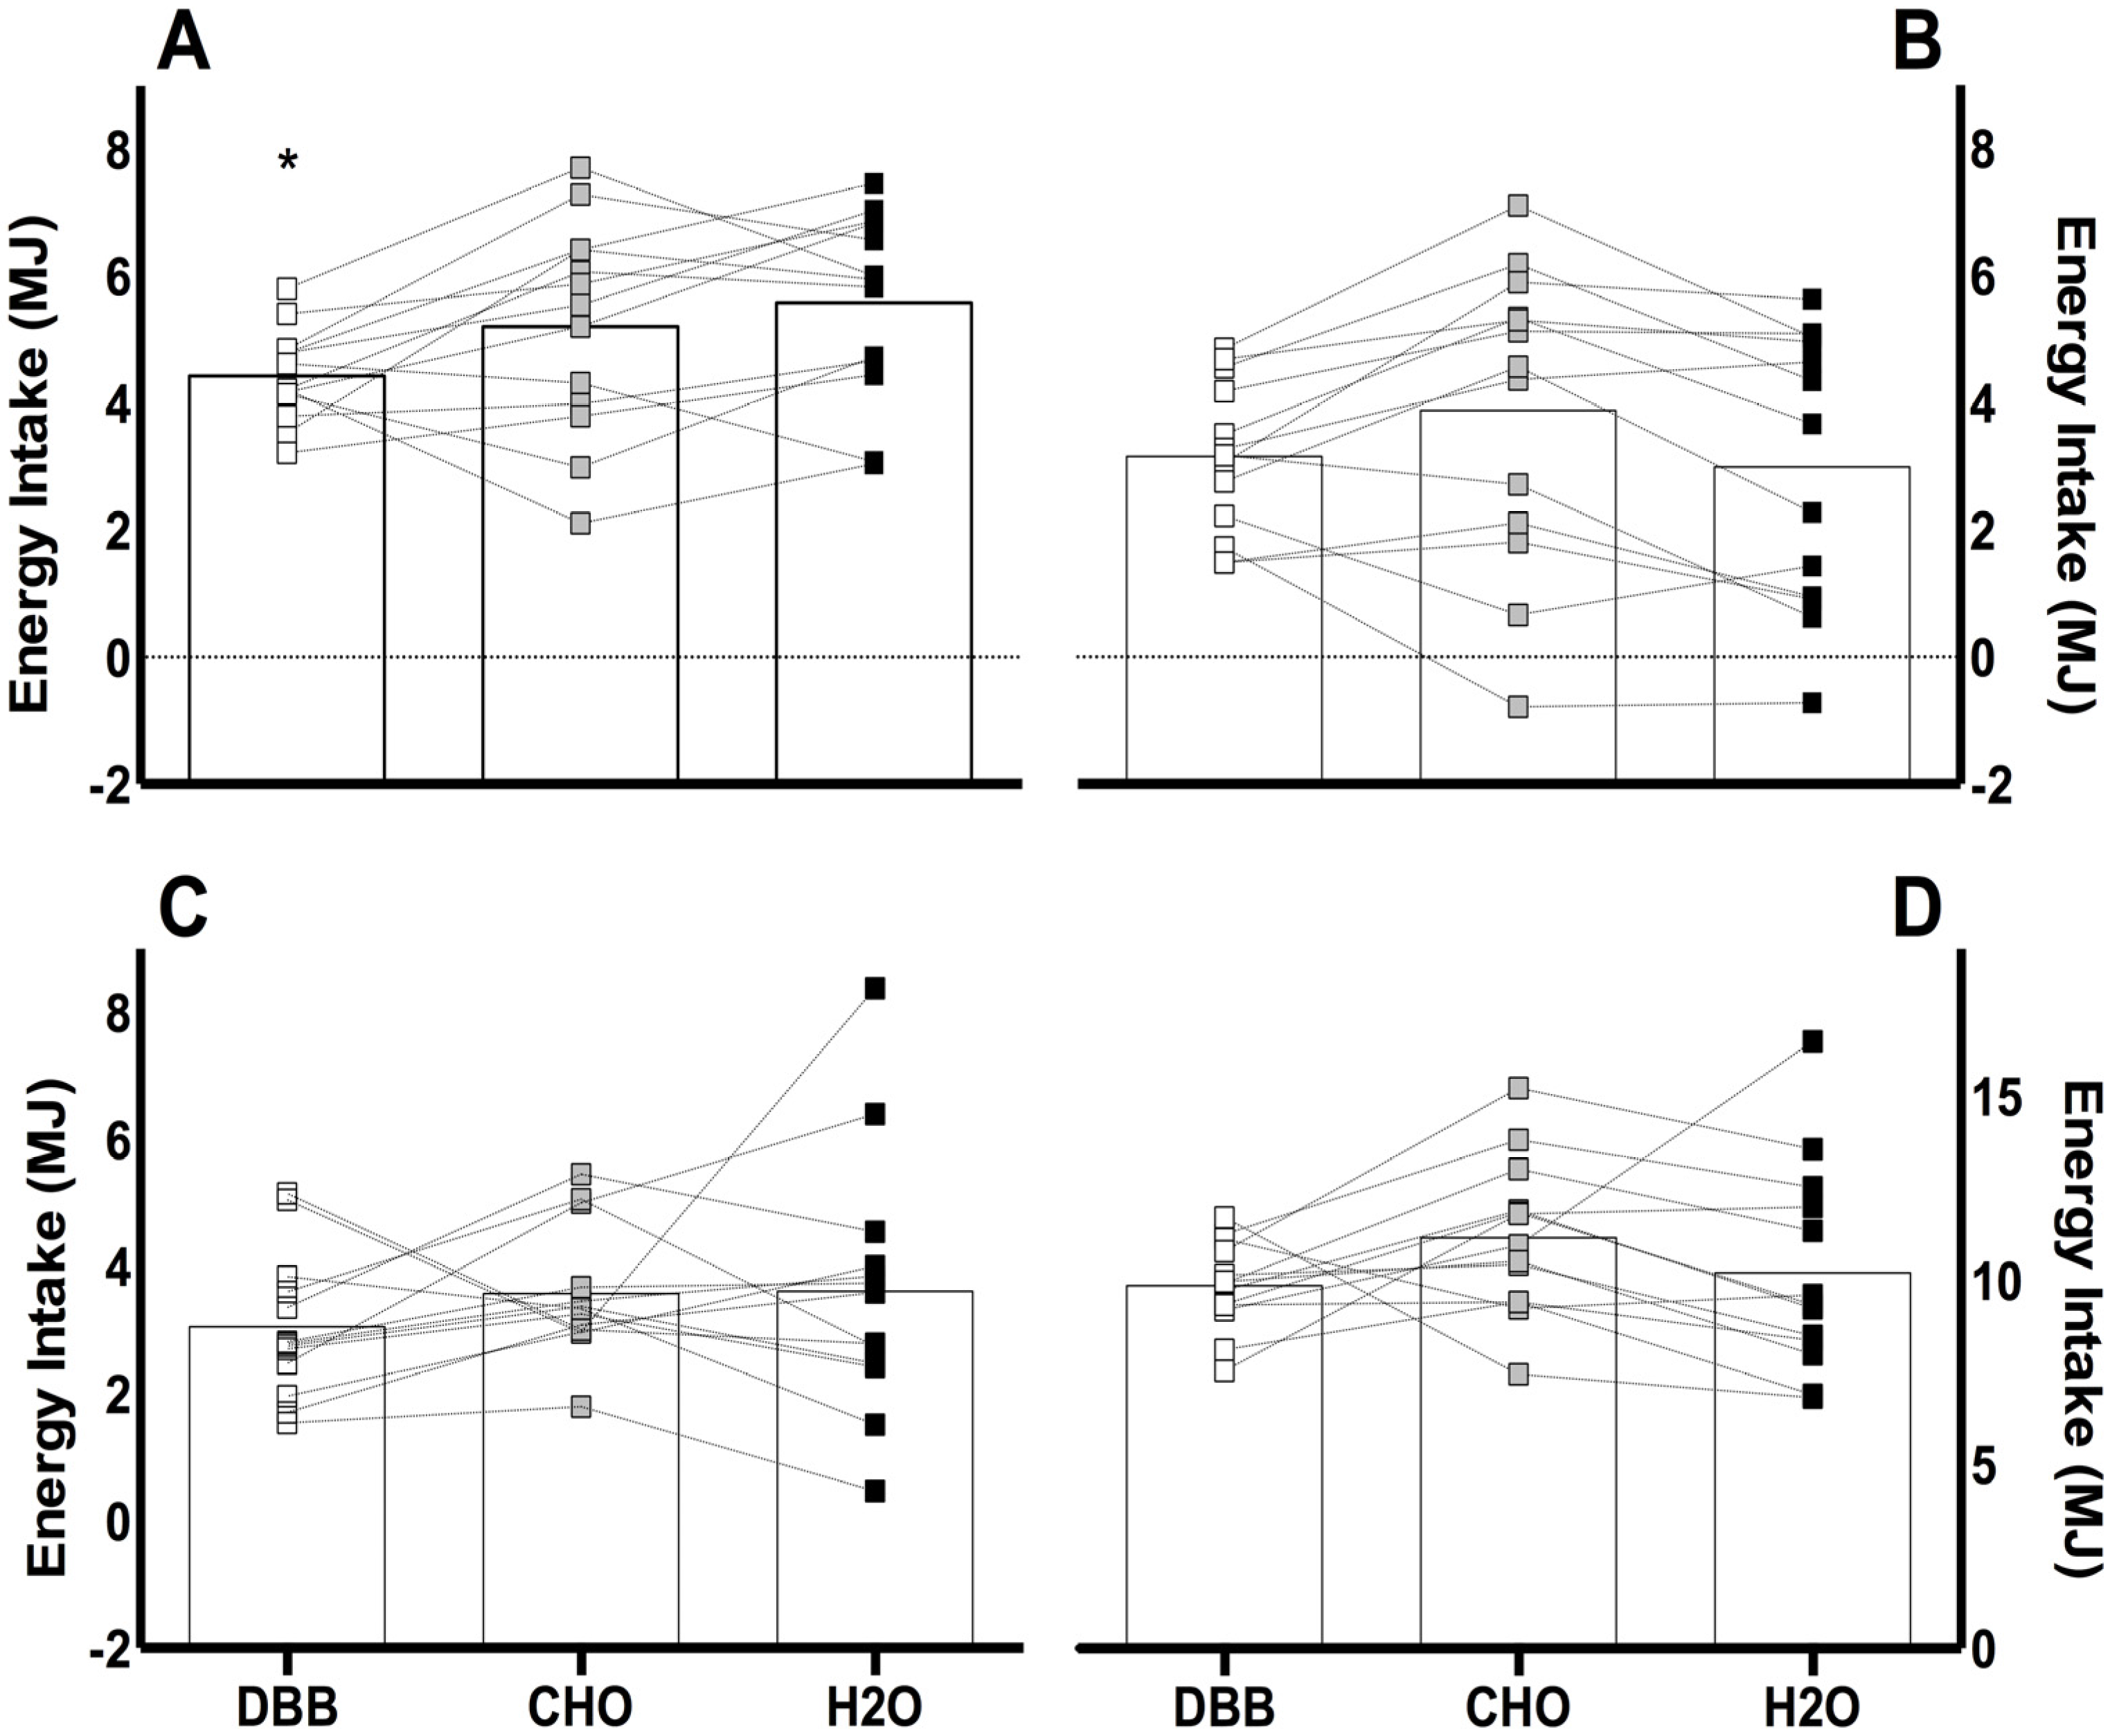
) represent DBB, grey filled boxes ( Nutrients 08 00355 i002) represent CHO, and black filled boxes ( Nutrients 08 00355 i003) represent H2O. Significance at the p < 0.05 level. ϕ denotes significant difference between DBB and H2O; # denotes significant difference between CHO and H2O; * denotes significant difference between DBB and CHO.
Nutrients 08 00355 g002
Figure 3. Time-average (90 min) (A,C,E) and absolute postprandial plasma concentrations (B,D,F) of insulin (pmol/L), glucagon (pg/mL), and GLP-17-36 (pmol/L) respectively pre (−60) and throughout the 120 min recovery period (n = 13); Vertical grey shaded area (B,D,F) represent the 60 min cycling bout. Values are presented as mean ± SEM. Values with unlike letters (a,b) denote significant difference between trials. White filled boxes ( Nutrients 08 00355 i001) represent DBB; grey filled boxes ( Nutrients 08 00355 i002) represent CHO; and black filled boxes ( Nutrients 08 00355 i003) represent H2O. Significance at the p < 0.05 level. ϕ denotes significant difference between DBB and H2O.
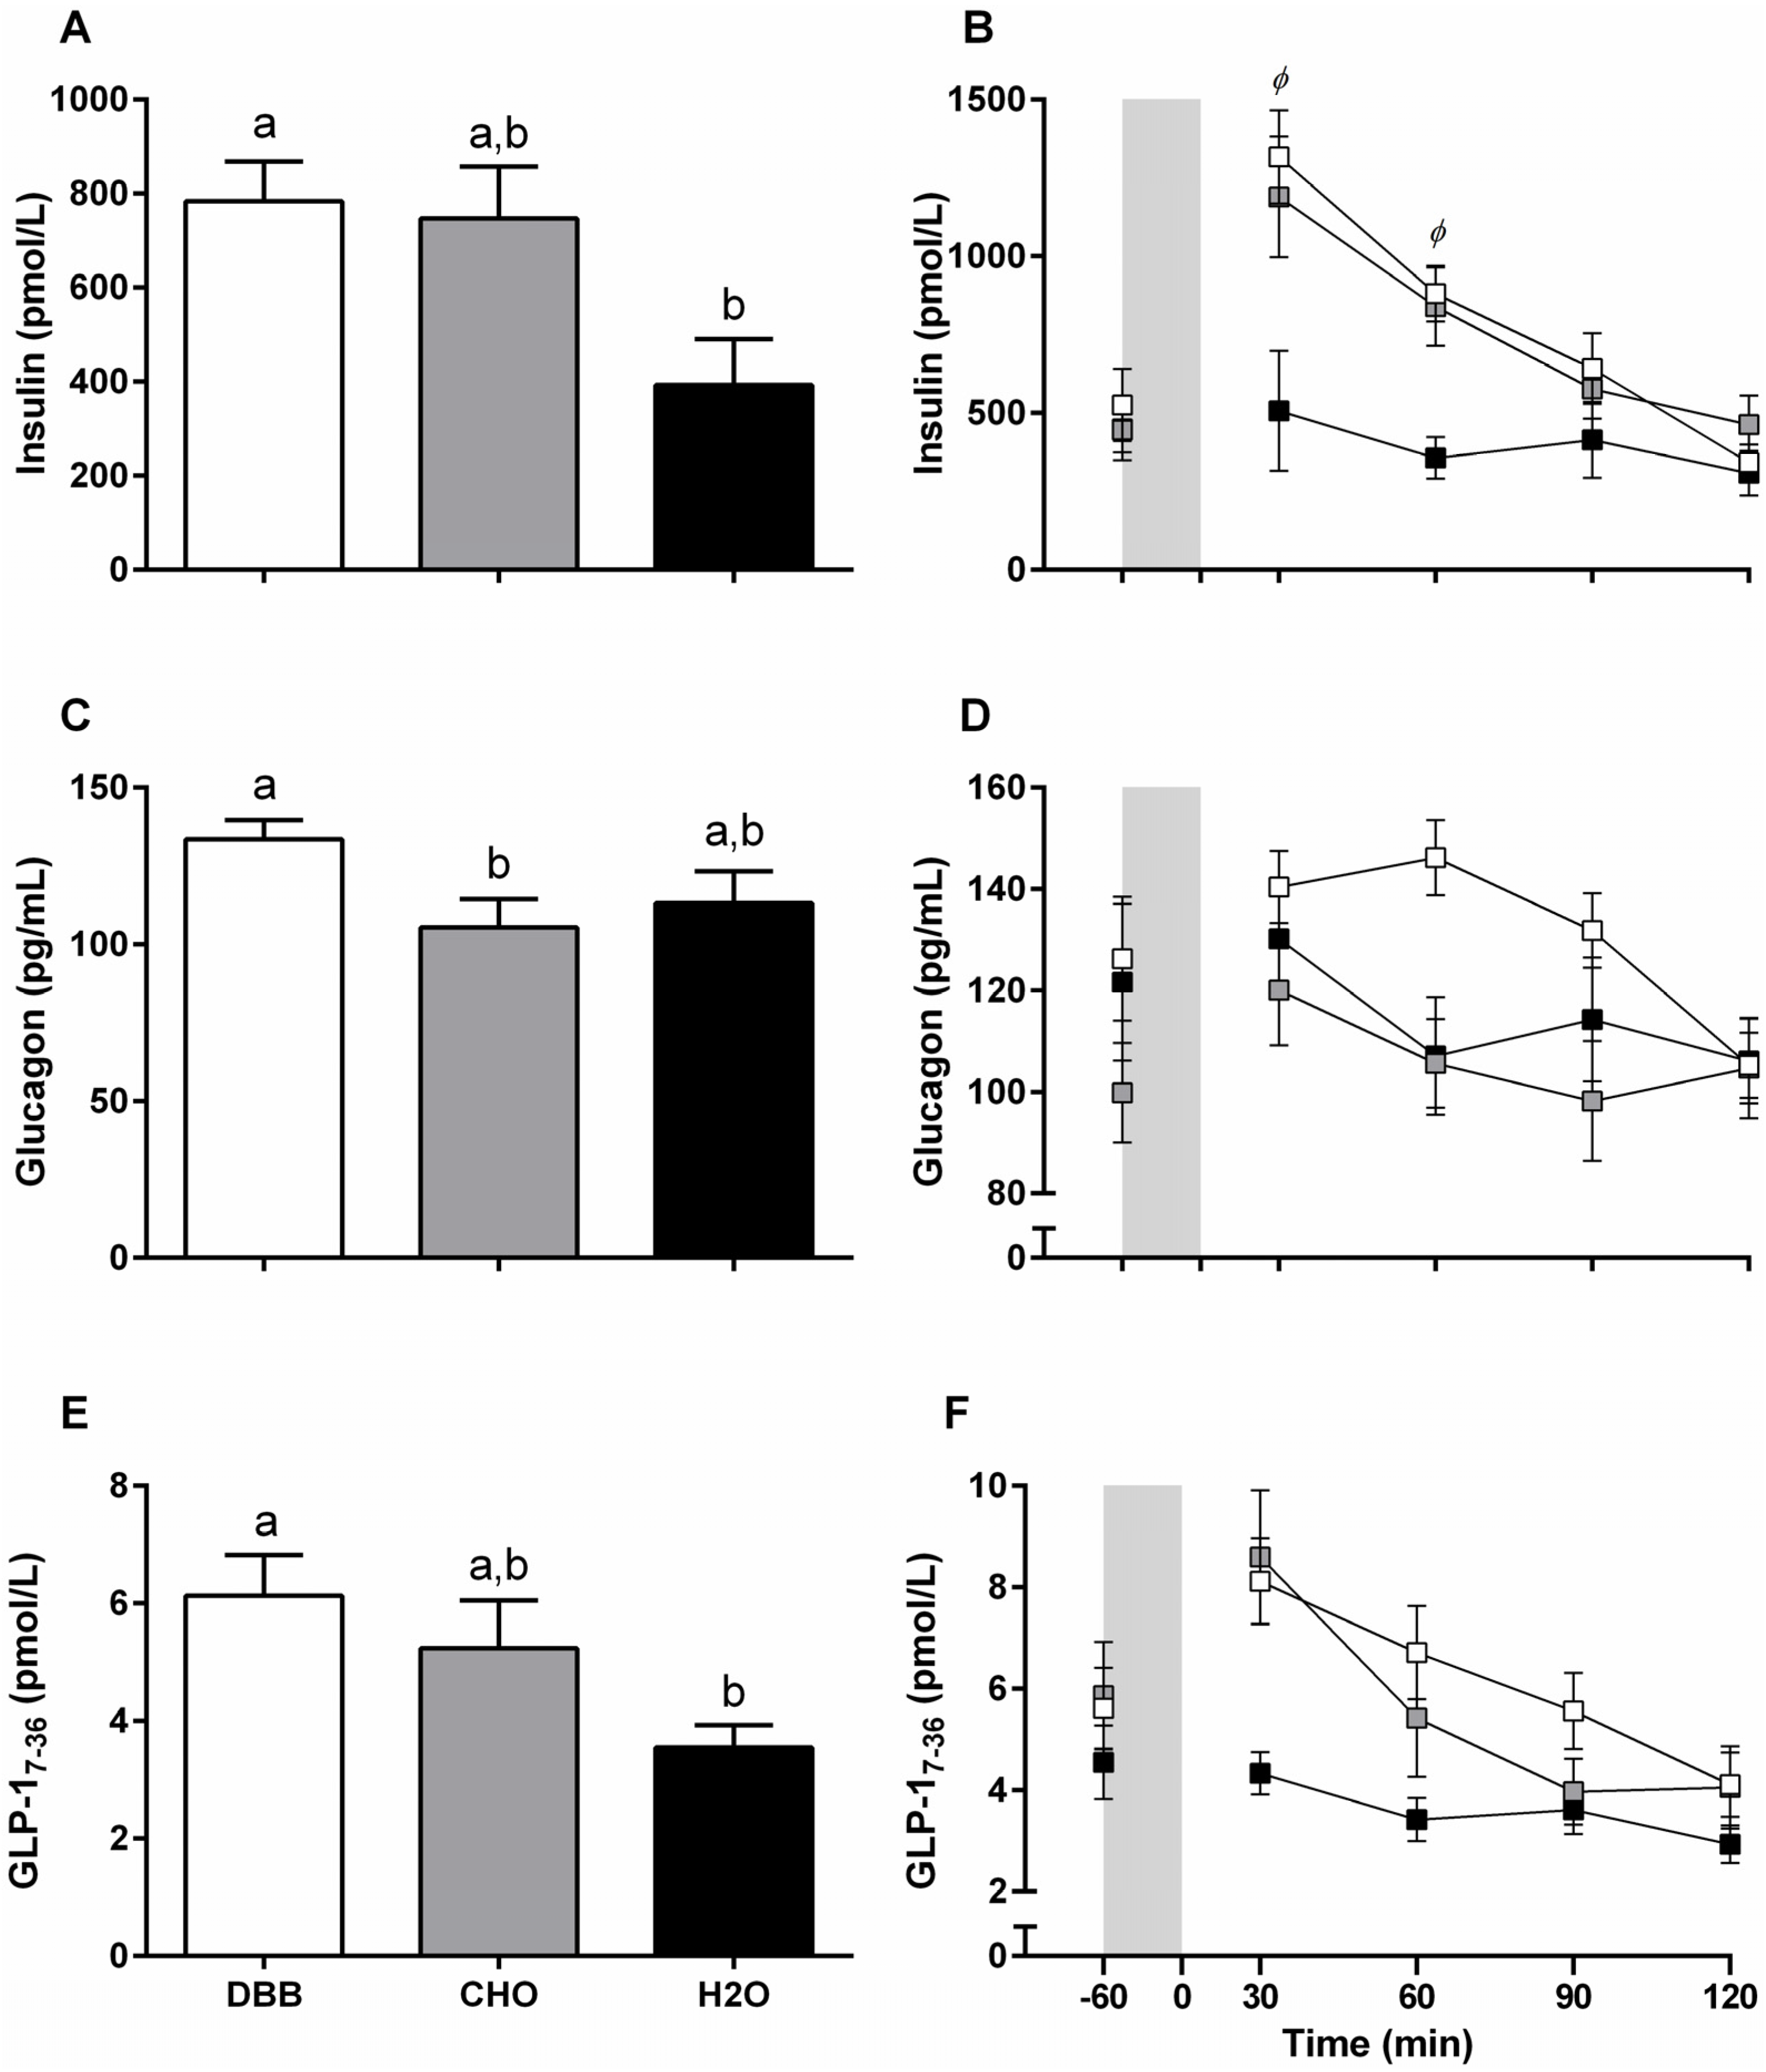
Nutrients 08 00355 g003
Table 1. Nutritional composition of the recovery beverages.
Nutritional CompositionDBBCHOH2O
Serving size (+mL water)500 (24)524524
Energy (MJ)1.361.360
Energy (kcal)3253250
Carbohydrate (g)56.778.60
Fat (g)1.100
Protein (g)22.2<0.50
Abbreviations: DBB, Dairy-based beverage; CHO, carbohydrate beverage; H2O, water control.
Table 2. Time-averaged concentrations in the 2 h postprandial recovery period for all subjective appetite sensations (mm), n = 10, mean ± SEM.
Subjective SensationDBBCHOH2O
Hunger63 ± 8 a72 ± 4 a83 ± 4 b
Fullness42 ± 6 a27 ± 5 a14 ± 4 b
Satisfaction37 ± 6 a29 ± 5 a12 ± 3 b
Prospective Food Consumption65 ± 3 a76 ± 4 a,b84 ± 3 b
Nausea13 ± 517 ± 89 ± 5
Abbreviations: DBB, dairy-based beverage; CHO, carbohydrate beverage; H2O, water control. a,b Values with unlike letters denote significant difference between trials. Significance at the p < 0.05 level.

