Food Habits, Lifestyle Factors and Mortality among Oldest Old Chinese: The Chinese Longitudinal Healthy Longevity Survey (CLHLS)

 ,
,  ,
,
Abstract
:1. Introduction
2. Methods
2.1. Study Population
2.2. Data Collection and Measurements
2.2.1. Dietary Measurements
2.2.2. Healthy Lifestyle Score
2.2.3. Death Ascertainment
2.2.4. Covariates
2.3. Statistical Analysis
3. Results

| Men | Women | p-value | |
|---|---|---|---|
| N | 3567 | 5392 | |
| Age (years), mean (S.D.1) | 90.1 (6.9) | 93.8 (7.7) | <0.001 |
| Weight (kg), mean (S.D.) | 52.8(9.9) | 42.0(8.5) | <0.001 |
| Years of education | <0.001 | ||
| 0 | 1325 (37.1%) | 4677 (86.7%) | |
| 1–5 | 1413 (39.6%) | 468 (8.7%) | |
| 6–9 | 456 (12.8%) | 112 (2.1%) | |
| >9 | 363 (10.2%) | 95 (1.8%) | |
| Missing | 10 (0.3%) | 40 (0.7%) | |
| Co-residence | 0.140 | ||
| With household member(s) | 3056 (85.7%) | 4574 (84.8%) | |
| Alone | 330 (9.3%) | 569 (10.6%) | |
| Nursing home | 181 (5.1%) | 248 (4.6%) | |
| Missing | 0 (0.0%) | 1 (<1%) | |
| Residence | <0.001 | ||
| Urban (city and town) | 1426 (40.0%) | 1952 (36.2%) | |
| Rural | 2141 (60.0%) | 3440 (63.8%) | |
| Smoking | <0.001 | ||
| Current smoker | 1116 (31.3%) | 397 (7.4%) | |
| Ex-smoker | 928 (26.0%) | 445 (8.3%) | |
| Non-smoker | 1520 (42.6%) | 4547 (84.4%) | |
| Alcohol drink or not at present? | <0.001 | ||
| Yes | 1175 (33.0%) | 930 (17.3%) | |
| No | 2385 (67.0%) | 4459 (82.7%) | |
| Exercise or not at present? | <0.001 | ||
| No physical activity | 2195 (61.6%) | 4349 (80.8%) | |
| Having physical activity | 1370 (38.4%) | 1036 (19.2%) | |
| Quartiles of other activities score | <0.001 | ||
| Q1 (0) | 693 (19.4%) | 1742 (32.3%) | |
| Q2 (3–7) | 951 (26.7%) | 1723 (32.0%) | |
| Q3 (9–14) | 888 (24.9%) | 1068 (19.8%) | |
| Q4 (15–56) | 1035 (29.0%) | 859 (15.9%) | |
| ADL disability | <0.001 | ||
| No | 4071 (60.3%) | 1528 (69.3%) | |
| Yes | 2658 (39.4%) | 664 (30.1%) | |
| Missing | 24 (0.4%) | 14 (0.6%) | |
| Number of chronic diseases, mean (S.D.) | 0.9 (1.1) | 0.8 (0.9) | <0.001 |
| Intake of fruit | 0.045 | ||
| Never | 1037 (29.1%) | 1548 (28.7%) | |
| Occasionally | 1875 (52.7%) | 2957 (54.9%) | |
| Almost daily | 648 (18.2%) | 883 (16.4%) | |
| Intake of vegetable | 0.009 | ||
| Never | 161 (4.5%) | 265 (4.9%) | |
| Occasionally | 592 (16.6%) | 1024 (19.0%) | |
| Almost daily | 2807 (78.8%) | 4100 (76.1%) | |
| Intake of meat | <0.001 | ||
| Never | 600 (16.9%) | 1144 (21.4%) | |
| Occasionally | 1731 (48.8%) | 2717 (50.8%) | |
| Almost daily | 1218 (34.3%) | 1485 (27.8%) | |
| Intake of fish | <0.001 | ||
| Never | 1010 (28.5%) | 1807 (34.0%) | |
| Occasionally | 2055 (58.0%) | 2860 (53.8%) | |
| Almost daily | 476 (13.4%) | 653 (12.3%) | |
| Intake of tea | <0.001 | ||
| Never | 1606 (46.8%) | 3253 (63.3%) | |
| Occasionally | 647 (18.9%) | 850 (16.5%) | |
| Almost daily | 1176 (34.3%) | 1040 (20.2%) | |
| Intake of sugar | 0.093 | ||
| Never | 1159 (32.8%) | 1634 (30.6%) | |
| Occasionally | 1459 (41.2%) | 2288 (42.8%) | |
| Almost daily | 920 (26.0%) | 1421 (26.6%) | |
| Intake of salt-preserved vegetable | 0.880 | ||
| Never | 1589 (45.1%) | 2381 (44.8%) | |
| Occasionally | 1161 (32.9%) | 1775 (33.4%) | |
| Almost daily | 775 (22.0%) | 1153 (21.7%) | |
| Intake of garlic | <0.001 | ||
| Never | 1578 (45.1%) | 2745 (52.3%) | |
| Occasionally | 1443 (41.3%) | 2028 (38.7%) | |
| Almost daily | 476 (13.6%) | 471 (9.0%) | |
| Intake of egg | <0.001 | ||
| Never | 650 (18.3%) | 1154 (21.6%) | |
| Occasionally | 1765 (49.7%) | 2665 (49.9%) | |
| Almost daily | 1138 (32.0%) | 1520 (28.5%) | |
| Intake of bean | <0.001 | ||
| Never | 597 (16.8%) | 1081 (20.2%) | |
| Occasionally | 2024 (57.0%) | 3130 (58.4%) | |
| Almost daily | 932 (26.2%) | 1151 (21.5%) | |
| Staple food intake (liang/day), mean (S.D.) | 6.8 (2.6) | 5.7 (2.3) | <0.001 |
| N | HR (95% CI 1) | Differences (95% CI) in Median Age at Death (Years) | |||
|---|---|---|---|---|---|
| Unadjusted | Multivariable Model 2 | Unadjusted | Multivariable Model 2 | ||
| Staple food patterns | |||||
| Wheat | 1708 | 1.00 | 1.00 | Ref. | Ref. |
| Rice | 6736 | 1.05 (0.99–1.12) | 1.01 (0.95–1.08) | −0.24 (−0.44–−0.03) * | −0.12 (−0.32–0.08) |
| Maize | 463 | 1.04 (0.93–1.18) | 0.93 (0.83–1.05) | −0.39 (−0.76–−0.02) * | −0.19 (−0.51–0.13) |
| Others | 45 | 1.02 (0.72–1.46) | 1.04 (0.72–1.51) | −0.57 (−2.07–0.93) | −0.12 (−0.65–0.41) |
| Quartiles of staple food intake | |||||
| Q1 (≤4 liang/day) 3 | 2371 | 1.00 | 1.00 | Ref. | Ref. |
| Q2 (5–6 liang/day) | 3450 | 0.84 (0.79–0.90) ** | 0.92 (0.86–0.98) ** | 0.67 (0.46–0.89) ** | 0.24 (0.04–0.43) * |
| Q3 (7–8 liang/day) | 1593 | 0.80 (0.75–0.87) ** | 0.92 (0.85–0.99) * | 0.62 (0.37–0.87) ** | 0.12 (−0.11–0.34) |
| Q4 (≥9 liang/day) | 1521 | 0.79 (0.74–0.85) ** | 0.91 (0.84–0.98) * | 0.82 (0.57–1.07) ** | 0.26 (0.01–0.50) * |
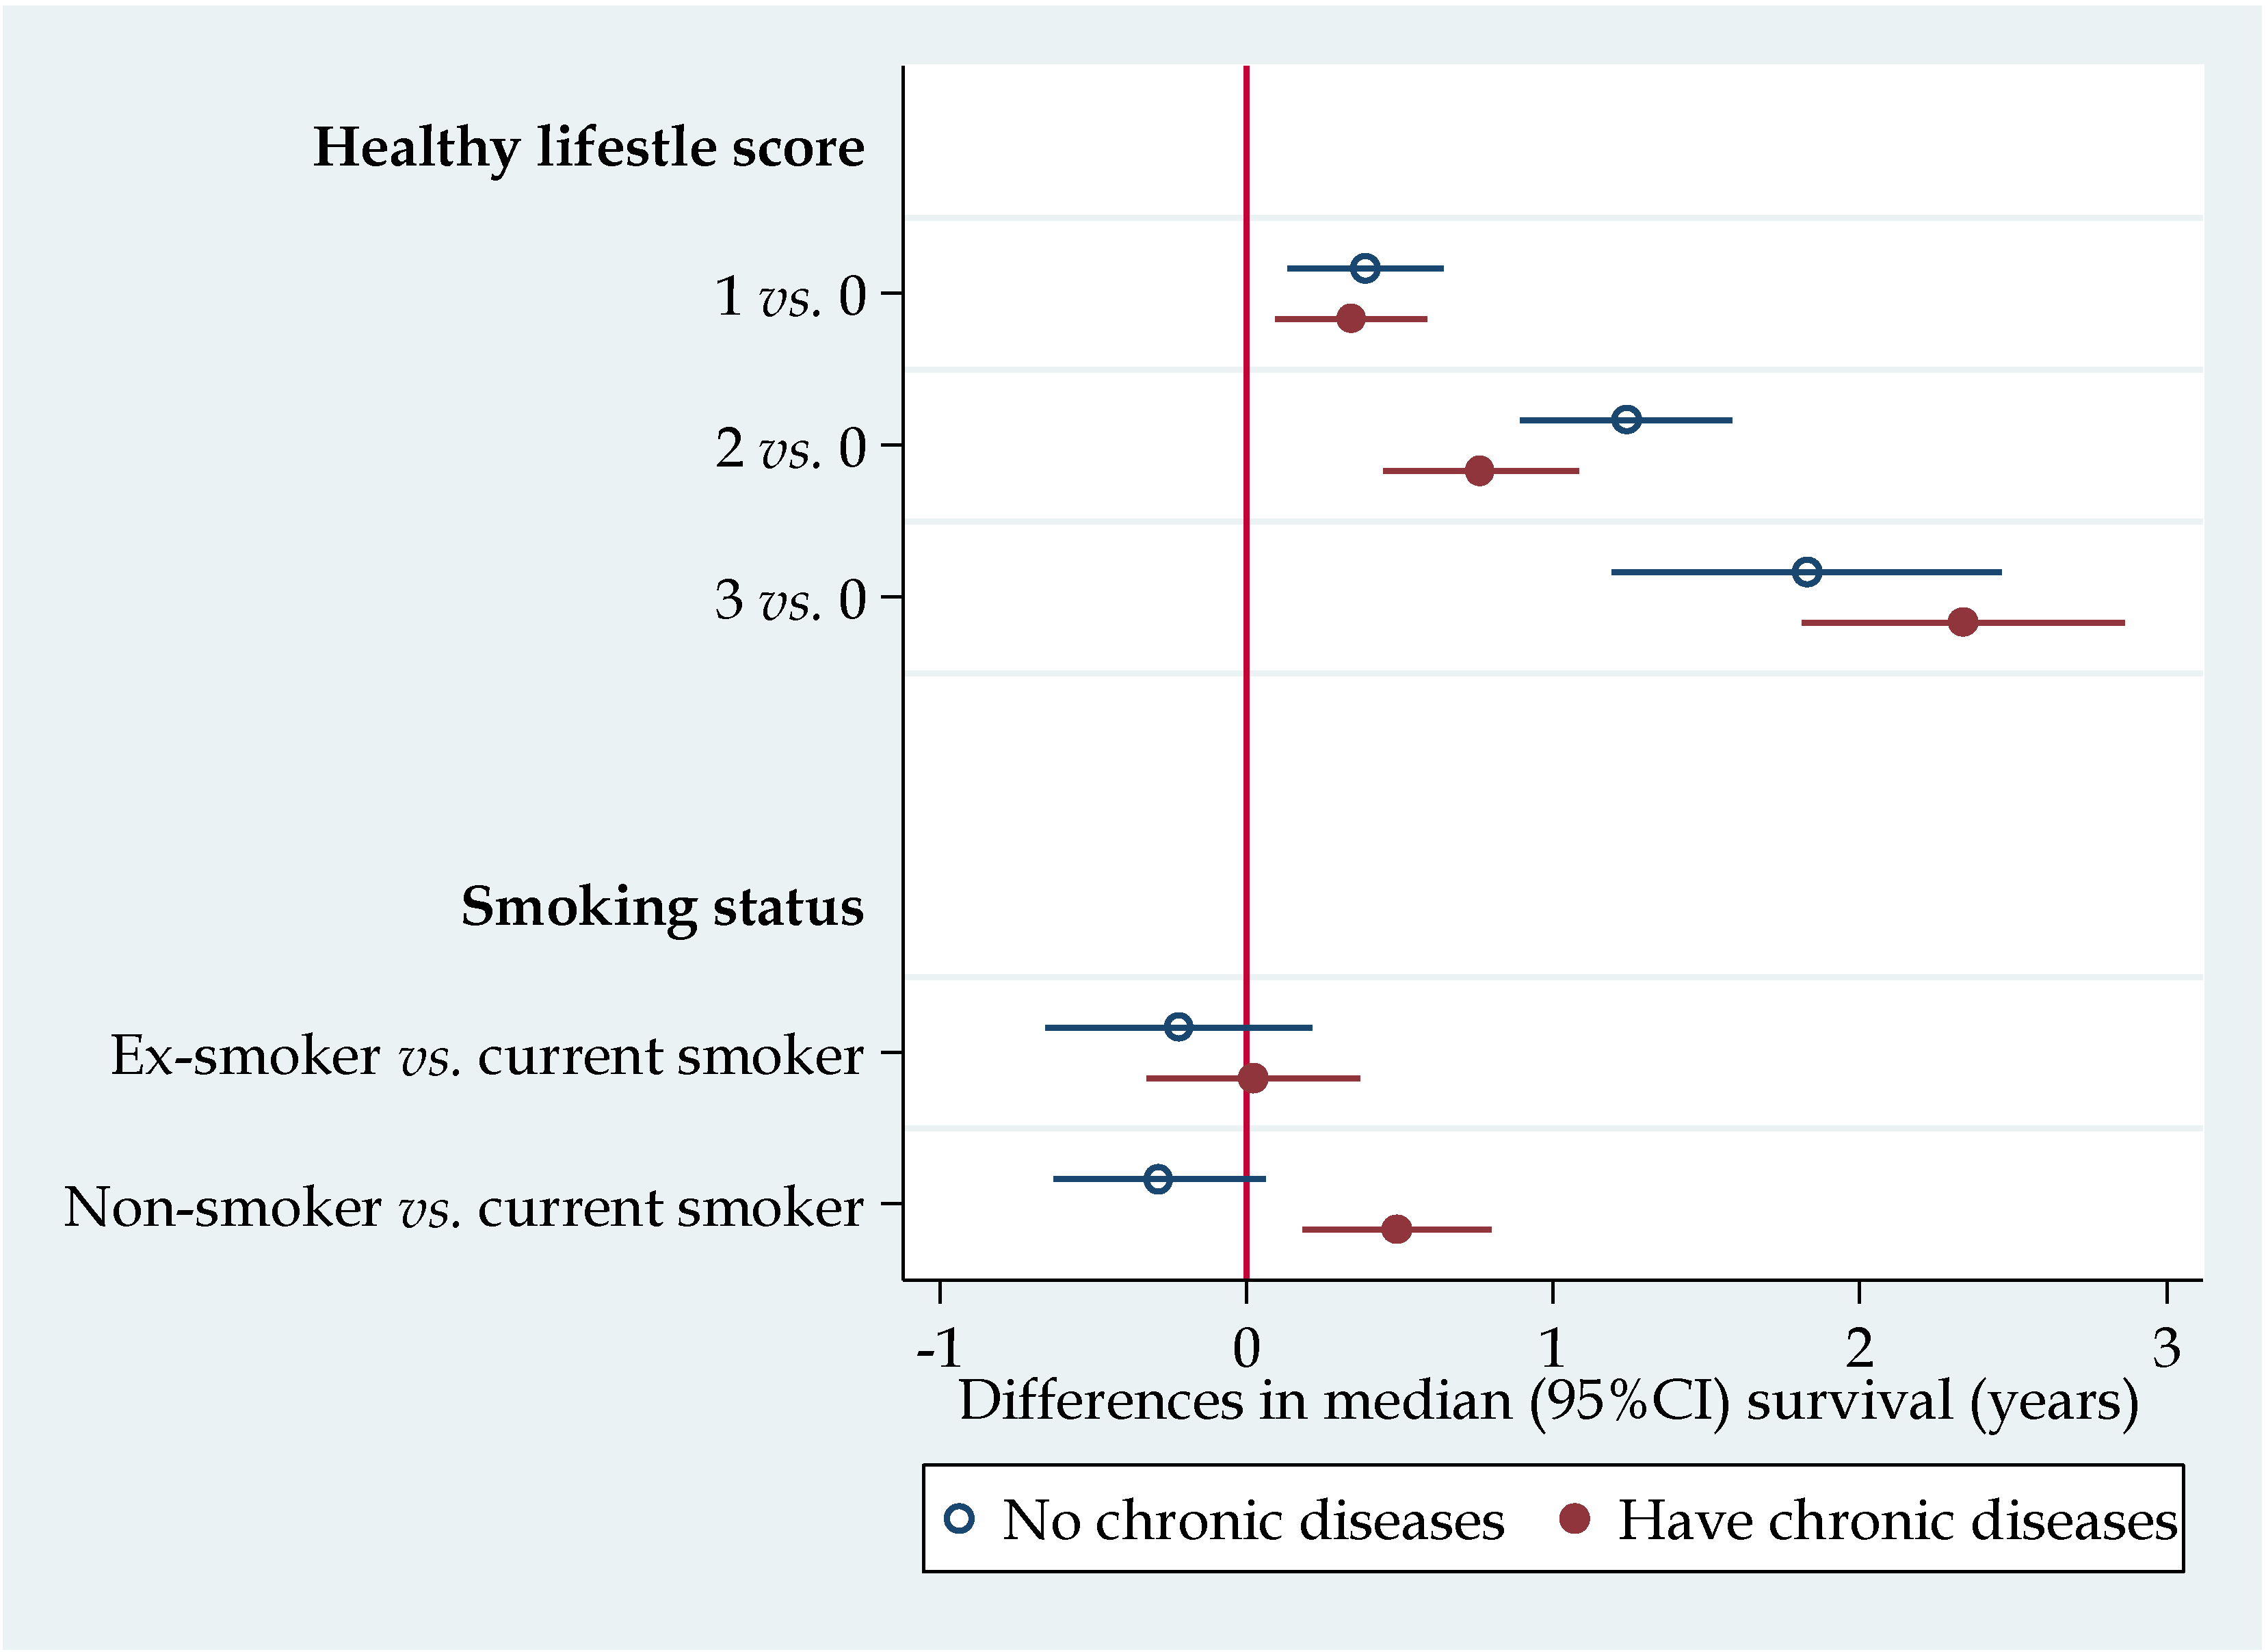
| HR (95% CI) | Differences (95% CI) in Median Age at Death (Years) | |||
|---|---|---|---|---|
| Unadjusted | Multivariable Adjusted 1 | Unadjusted | Multivariable Adjusted 1 | |
| Age | 1.07 (1.06–1.07) ** | 1.07 (1.06–1.07) ** | −0.19 (−0.21–−0.18) ** | −0.18 (−0.19–−0.17) ** |
| Urban vs. rural | 0.75 (0.72–0.79) ** | 0.92 (0.87–0.97) ** | −0.77 (−0.97–−0.56) ** | 0.14(0.04−0.32) ** |
| Women vs. men | 1.07 (1.02–1.12) * | 0.79 (0.74–0.84) ** | −0.34 (−0.51–−0.17) ** | 0.66 (0.47–0.85) ** |
| Number of chronic diseases | 1.01 (0.98–1.03) | 1.06 (1.03–1.09) ** | −0.06 (−0.14–0.02) | −0.17 (−0.24–−0.09) ** |
| Manual job vs. non-manual job | 1.89 (1.69–2.11) ** | 1.37 (1.21–1.55) ** | −2.41 (−2.83–−1.99) ** | −0.97 (−1.50–−0.44) ** |
| Smoking status | ||||
| Current smokers | 1.00 | 1.00 | Ref.2 | Ref. |
| Ex-smokers | 1.04 (0.95–1.13) | 1.00 (0.92–1.10) | −0.21 (−0.51–0.08) | −0.08 (−0.40–0.23) |
| Non-smokers | 1.09 (1.02–1.16) * | 0.94 (0.87–1.02) | −0.37 (−0.61–−0.13) ** | 0.15 (−0.12–0.43) |
| Non-alcohol drinking vs. drinking | 0.98 (0.92–1.03) | 1.02 (0.96–1.09) | 0.06 (−0.15–0.28) | −0.06 (−0.26–0.14) |
| Having physical activity vs. no physical activity | 0.60 (0.57–0.64) ** | 0.73 (0.68–0.77) ** | 2.05 (1.78–2.31) ** | 1.18 (0.95–1.41) ** |
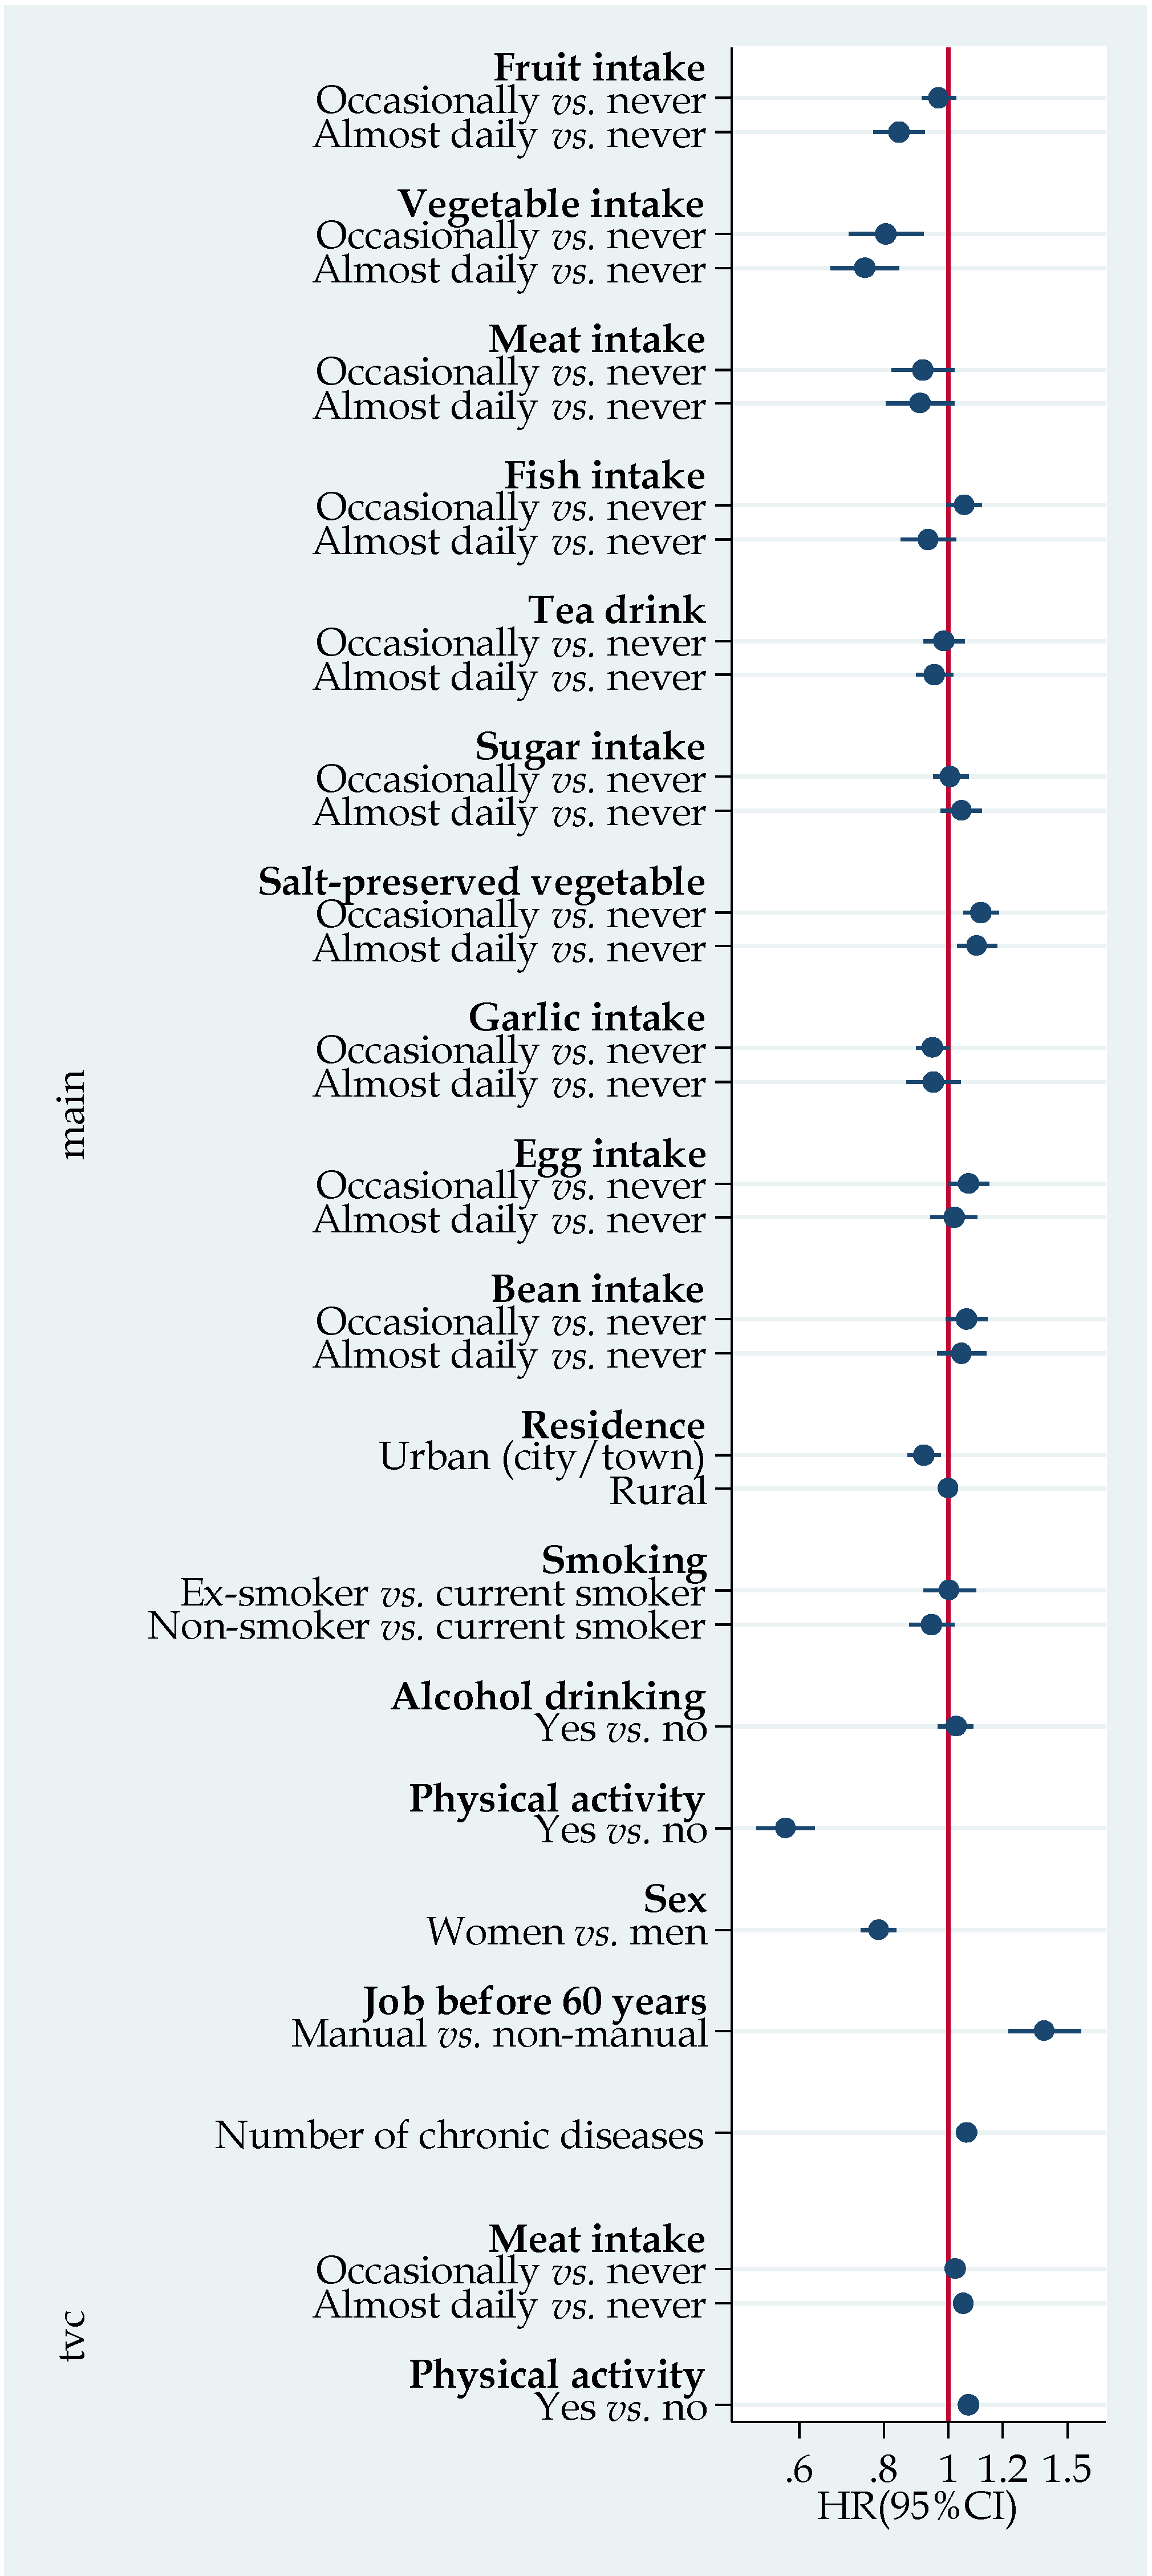
| Fruit intake | ||||
| Never | 1.00 | 1.00 | Ref. | Ref. |
| Occasionally | 0.91 (0.86–0.96) ** | 0.96 (0.91–1.02) | 0.37 (0.17–0.57) ** | 0.08 (−0.11–0.26) |
| Daily | 0.70 (0.64–0.75) ** | 0.85 (0.77–0.92) ** | 1.07 (0.72–1.42) ** | 0.38 (0.07–0.69) * |
| Vegetable intake | ||||
| Never | 1.00 | 1.00 | Ref. | Ref. |
| Occasionally | 0.77 (0.68–0.86) ** | 0.80 (0.70–0.91) ** | 0.73 (0.32–1.15) ** | 0.36 (0.02–0.70) * |
| Daily | 0.63 (0.57–0.70) ** | 0.74 (0.66–0.83) ** | 1.41 (1.04–1.79) ** | 0.60 (0.28–0.91) ** |
| Intake of meat | ||||
| Never | 1.00 | 1.00 | Ref. | Ref. |
| Occasionally | 1.01 (0.95–1.08) | 0.97 (0.90–1.04) | 0.05 (−0.18–0.28) | 0.17 (−0.06–0.41) |
| Daily | 0.95 (0.88–1.02) | 1.05 (0.97–1.14) | 0.40 (0.16–0.64)** | 0.04 (−0.22–0.30) |
| Intake of fish | ||||
| Never | 1.00 | 1.00 | Ref. | Ref. |
| Occasionally | 1.03 (0.98–1.09) | 1.06 (1.00–1.13) * | −0.07 (−0.27–0.12) | −0.13 (−0.32–0.07) |
| Daily | 0.86 (0.79–0.93) ** | 0.94 (0.85–1.03) | 0.38 (0.12–0.65) ** | 0.31 (0.01–0.62) * |
| Intake of tea | ||||
| Never | 1.00 | 1.00 | Ref. | Ref. |
| Occasionally | 0.95 (0.89–1.02) | 0.98 (0.92–1.05) | 0.21 (−0.03–0.45) | 0.11 (−0.11–0.32) |
| Daily | 0.80 (0.75–0.85) ** | 0.95 (0.89–1.02) | 0.68 (0.42–0.93) ** | 0.18 (−0.04–0.41) |
| Intake of sugar | ||||
| Never | 1.00 | 1.00 | Ref. | Ref. |
| Occasionally | 1.04 (0.98–1.10) | 1.00 (0.95–1.07) | −0.18 (−0.38–0.03) | −0.07 (−0.26–0.13) |
| Daily | 1.05 (0.99–1.13) | 1.04 (0.97–1.12) | −0.32 (−0.56–−0.08) ** | −0.15 (−0.38–0.08) |
| Intake of salt-preserved vegetable | ||||
| Never | 1.00 | 1.00 | Ref. | Ref. |
| Occasionally | 1.02 (0.97–1.08) | 1.12 (1.06–1.19) ** | −0.05 (−0.26–0.16) | −0.18 (−0.37–0.02) |
| Daily | 0.96 (0.90–1.03) | 1.10 (1.03–1.18) ** | 0.13 (−0.09–0.35) | −0.14 (−0.36–0.07) |
| Intake of garlic | ||||
| Never | 1.00 | 1.00 | Ref. | Ref. |
| Occasionally | 0.95 (0.90–1.00) * | 0.95 (0.90–1.00) | 0.13 (−0.06–0.32) | 0.12 (−0.06–0.30) |
| Daily | 0.81 (0.75–0.88) ** | 0.95 (0.87–1.04) | 0.52 (0.21–0.83) ** | 0.14 (−0.16–0.45) |
| Intake of egg | ||||
| Never | 1.00 | 1.00 | Ref. | Ref. |
| Occasionally | 1.06 (0.99–1.13) | 1.07 (0.99–1.14) | −0.14 (−0.37–0.09) | −0.16 (−0.39–0.07) |
| Daily | 0.91 (0.85–0.98) * | 1.02 (0.94–1.10) | 0.25 (0.00–0.49) * | −0.11 (−0.38–0.17) |
| Intake of beans | ||||
| Never | 1.00 | 1.00 | Ref. | Ref. |
| Occasionally | 1.00 (0.94–1.07) | 1.06 (0.99–1.14) | −0.01 (−0.24–0.22) | −0.17 (−0.40–0.06) |
| Daily | 0.86 (0.80–0.93) ** | 1.05 (0.96–1.14) | 0.48 (0.20–0.76) ** | −0.13 (−0.41–0.15) |

4. Discussion
5. Conclusions
Supplementary Files
Supplementary File 1Acknowledgments
Author Contributions
Conflicts of Interest
References
- Spijker, J.; MacInnes, J. Population ageing: The timebomb that isn’t? BMJ 2013, 347, f6598. [Google Scholar] [CrossRef] [PubMed]
- Rechel, B.; Grundy, E.; Robine, J.M.; Cylus, J.; Mackenbach, J.P.; Knai, C.; McKee, M. Ageing in the European union. Lancet 2013, 381, 1312–1322. [Google Scholar] [CrossRef]
- United Nations World population 2012. Available online: http://www.un.org/en/development/desa/population/publications/pdf/trends/WPP2012_Wallchart.pdf (accessed on 17 July 2015).
- Wang, X.Q.; Chen, P.J. Population ageing challenges health care in China. Lancet 2014, 383, 870. [Google Scholar] [CrossRef]
- Candore, G.; Balistreri, C.R.; Listi, F.; Grimaldi, M.P.; Vasto, S.; Colonna-Romano, G.; Franceschi, C.; Lio, D.; Caselli, G.; Caruso, C. Immunogenetics, gender, and longevity. Ann. N. Y. Acad. Sci. 2006, 1089, 516–537. [Google Scholar] [CrossRef] [PubMed]
- Lin, R.T.; Chen, Y.M.; Chien, L.C.; Chan, C.C. Political and social determinants of life expectancy in less developed countries: A longitudinal study. BMC Public Health 2012, 12, 85. [Google Scholar] [CrossRef] [PubMed]
- Dupre, M.E.; Liu, G.; Gu, D. Predictors of longevity: Evidence from the oldest old in China. Am. J. Public Health 2008, 98, 1203–1208. [Google Scholar] [CrossRef] [PubMed]
- Jankovic, N.; Geelen, A.; Streppel, M.T.; de Groot, L.C.; Orfanos, P.; van den Hooven, E.H.; Pikhart, H.; Boffetta, P.; Trichopoulou, A.; Bobak, M.; et al. Adherence to a healthy diet according to the world health organization guidelines and all-cause mortality in elderly adults from Europe and the United States. Am. J. Epidemiol. 2014, 180, 978–988. [Google Scholar] [CrossRef] [PubMed]
- Haveman-Nies, A.; de Groot, L.; Burema, J.; Cruz, J.A.; Osler, M.; van Staveren, W.A.; Investigators, S. Dietary quality and lifestyle factors in relation to 10-year mortality in older Europeans: The SENECA Study. Am. J. Epidemiol. 2002, 156, 962–968. [Google Scholar] [CrossRef] [PubMed]
- Nybo, H.; Petersen, H.C.; Gaist, D.; Jeune, B.; Andersen, K.; McGue, M.; Vaupel, J.W.; Christensen, K. Predictors of mortality in 2249 Nonagenarians—The Danish 1905-cohort survey. J. Am. Geriatr. Soc. 2003, 51, 1365–1373. [Google Scholar] [CrossRef] [PubMed]
- Newson, R.S.; Witteman, J.C.; Franco, O.H.; Stricker, B.H.; Breteler, M.M.; Hofman, A.; Tiemeier, H. Predicting survival and morbidity-free survival to very old age. Age 2010, 32, 521–534. [Google Scholar] [CrossRef] [PubMed]
- Benetos, A.; Thomas, F.; Bean, K.E.; Pannier, B.; Guize, L. Role of modifiable risk factors in life expectancy in the elderly. J. Hypertens. 2005, 23, 1803–1808. [Google Scholar] [CrossRef] [PubMed]
- Spencer, C.A.; Jamrozik, K.; Norman, P.E.; Lawrence-Brown, M. A simple lifestyle score predicts survival in healthy elderly men. Prev. Med. 2005, 40, 712–717. [Google Scholar] [CrossRef] [PubMed]
- Hagberg, B.; Samuelsson, G. Survival after 100 years of age: A multivariate model of exceptional survival in Swedish Centenarians. J. Gerontol. A. Biol. Sci. Med. Sci. 2008, 63, 1219–1226. [Google Scholar] [CrossRef] [PubMed]
- Wang, X.; Ouyang, Y.; Liu, J.; Zhu, M.; Zhao, G.; Bao, W.; Hu, F.B. Fruit and vegetable consumption and mortality from all causes, cardiovascular disease, and cancer: Systematic review and dose-response meta-analysis of prospective cohort studies. BMJ 2014, 349, g4490. [Google Scholar] [CrossRef] [PubMed]
- Hu, E.A.; Pan, A.; Malik, V.; Sun, Q. White rice consumption and risk of type 2 diabetes: Meta-analysis and systematic review. BMJ 2012, 344, e1454. [Google Scholar] [CrossRef] [PubMed]
- Eshak, E.S.; Iso, H.; Yamagishi, K.; Kokubo, Y.; Saito, I.; Yatsuya, H.; Sawada, N.; Inoue, M.; Tsugane, S. Rice consumption is not associated with risk of cardiovascular disease morbidity or mortality in Japanese men and women: A large population-based, prospective cohort study. Am. J. Clin. Nutr. 2014, 100, 199–207. [Google Scholar] [CrossRef] [PubMed]
- Eshak, E.S.; Iso, H.; Date, C.; Yamagishi, K.; Kikuchi, S.; Watanabe, Y.; Wada, Y.; Tamakoshi, A.; Group, J.S. Rice intake is associated with reduced risk of mortality from cardiovascular disease in Japanese men but not women. J. Nutr. 2011, 141, 595–602. [Google Scholar] [CrossRef] [PubMed]
- Noto, H.; Goto, A.; Tsujimoto, T.; Noda, M. Low-carbohydrate diets and all-cause mortality: A systematic review and meta-analysis of observational studies. PLoS ONE 2013, 8, e55030. [Google Scholar] [CrossRef] [PubMed]
- Knoops, K.T.; de Groot, L.C.; Kromhout, D.; Perrin, A.E.; Moreiras-Varela, O.; Menotti, A.; van Staveren, W.A. Mediterranean diet, lifestyle factors, and 10-year mortality in elderly European men and women: The hale project. JAMA 2004, 292, 1433–1439. [Google Scholar] [CrossRef] [PubMed]
- Zhai, F.; Wang, H.; Du, S.; He, Y.; Wang, Z.; Ge, K.; Popkin, B.M. Lifespan nutrition and changing socio-economic conditions in China. Asia Pac. J. Clin. Nutr. 2007, 16, 374–382. [Google Scholar] [PubMed]
- Xu, X.; Byles, J.E.; Shi, Z.; Hall, J.J. Evaluation of older chinese people’s macronutrient intake status: Results from the China health and nutrition survey. Br. J. Nutr. 2015, 113, 159–171. [Google Scholar] [CrossRef] [PubMed]
- Levine, M.E.; Suarez, J.A.; Brandhorst, S.; Balasubramanian, P.; Cheng, C.W.; Madia, F.; Fontana, L.; Mirisola, M.G.; Guevara-Aguirre, J.; Wan, J.; et al. Low protein intake is associated with a major reduction in IGF-1, cancer, and overall mortality in the 65 and younger but not older population. Cell Metab. 2014, 19, 407–417. [Google Scholar] [CrossRef] [PubMed]
- Nilsson, L.M.; Winkvist, A.; Eliasson, M.; Jansson, J.H.; Hallmans, G.; Johansson, I.; Lindahl, B.; Lenner, P.; Van Guelpen, B. Low-carbohydrate, high-protein score and mortality in a Northern Swedish population-based cohort. Eur. J. Clin. Nutr. 2012, 66, 694–700. [Google Scholar] [CrossRef] [PubMed]
- Rizzuto, D.; Orsini, N.; Qiu, C.; Wang, H.X.; Fratiglioni, L. Lifestyle, social factors, and survival after age 75: Population based study. BMJ 2012, 345, e5568. [Google Scholar] [CrossRef] [PubMed]
- Huang, C.; Elo, I.T. Mortality of the oldest old chinese: The role of early-life nutritional status, socio-economic conditions, and sibling sex-composition. Popul. Stud. 2009, 63, 7–20. [Google Scholar] [CrossRef] [PubMed]
- Zeng, Y. Introduction to the chinese longitudinal healthy longevity survey (CLHLS). In Health Longevity in China: Demographic, Socioeconomic, and Psychological Dimensions; Zeng, Y., Poston, D., Eds.; Springer: Dordrecht, The Netherlands, 2008. [Google Scholar]
- Katz, S.; Ford, A.B.; Moskowitz, R.W.; Jackson, B.A.; Jaffe, M.W. Studies of illness in the aged. The index of ADL: A standardized measure of biological and psychosocial function. JAMA 1963, 185, 914–919. [Google Scholar] [CrossRef] [PubMed]
- Bottai, M.; Zhang, J. Laplace regression with censored data. Biom. J. Biom. Z. 2010, 52, 487–503. [Google Scholar] [CrossRef] [PubMed]
- Bottai, M.; Orsini, N. A command for laplace regression. Stata J. 2013, 13, 302–314. [Google Scholar]
- Djousse, L.; Gaziano, J.M.; Buring, J.E.; Lee, I.M. Egg consumption and risk of type 2 diabetes in men and women. Diabetes Care 2009, 32, 295–300. [Google Scholar] [CrossRef] [PubMed]
- Shi, Z.; Yuan, B.; Zhang, C.; Zhou, M.; Holmboe-Ottesen, G. Egg consumption and the risk of diabetes in adults, Jiangsu, China. Nutrition 2011, 27, 194–198. [Google Scholar] [CrossRef] [PubMed]
- Shi, Z.; Zhen, S.; Qi, L.; Zhou, Y.; Taylor, A. Rice intake is inversely related to cardiovascular mortality among Chinese adults. In Proceedings of the Thirty-Eight Annual Scientific Meeting of the Nutrition Society of Australia, Hobart, Australia, 26–28 November 2014; Volume 38, p. 81.
- Nagata, C.; Wada, K.; Tsuji, M.; Kawachi, T.; Nakamura, K. Dietary glycaemic index and glycaemic load in relation to all-cause and cause-specific mortality in a Japanese community: The Takayama study. Br. J. Nutr. 2014, 112, 2010–2017. [Google Scholar] [CrossRef] [PubMed]
- Islami, F.; Ren, J.S.; Taylor, P.R.; Kamangar, F. Pickled vegetables and the risk of oesophageal cancer: A meta-analysis. Br. J. Cancer 2009, 101, 1641–1647. [Google Scholar] [CrossRef] [PubMed]
- A Survey Report on Centenarians in Jiangsu Province. Available online: http://wenku.baidu.com/view/784c1ad3360cba1aa811da41.html (accessed on 17 July 2015).
© 2015 by the authors; licensee MDPI, Basel, Switzerland. This article is an open access article distributed under the terms and conditions of the Creative Commons Attribution license (http://creativecommons.org/licenses/by/4.0/).
Share and Cite
Shi, Z.; Zhang, T.; Byles, J.; Martin, S.; Avery, J.C.; Taylor, A.W. Food Habits, Lifestyle Factors and Mortality among Oldest Old Chinese: The Chinese Longitudinal Healthy Longevity Survey (CLHLS). Nutrients 2015, 7, 7562-7579. https://doi.org/10.3390/nu7095353
Shi Z, Zhang T, Byles J, Martin S, Avery JC, Taylor AW. Food Habits, Lifestyle Factors and Mortality among Oldest Old Chinese: The Chinese Longitudinal Healthy Longevity Survey (CLHLS). Nutrients. 2015; 7(9):7562-7579. https://doi.org/10.3390/nu7095353
Chicago/Turabian StyleShi, Zumin, Tuohong Zhang, Julie Byles, Sean Martin, Jodie C. Avery, and Anne W. Taylor. 2015. "Food Habits, Lifestyle Factors and Mortality among Oldest Old Chinese: The Chinese Longitudinal Healthy Longevity Survey (CLHLS)" Nutrients 7, no. 9: 7562-7579. https://doi.org/10.3390/nu7095353
APA StyleShi, Z., Zhang, T., Byles, J., Martin, S., Avery, J. C., & Taylor, A. W. (2015). Food Habits, Lifestyle Factors and Mortality among Oldest Old Chinese: The Chinese Longitudinal Healthy Longevity Survey (CLHLS). Nutrients, 7(9), 7562-7579. https://doi.org/10.3390/nu7095353