
Effect of Important Food Sources of Fructose-Containing Sugars on Inflammatory Biomarkers: A Systematic Review and Meta-Analysis of Controlled Feeding Trials


 , , , , , and
Abstract
1. Introduction
2. Materials and Methods
2.1. Data Sources and Search Strategy
2.2. Study Selection
2.3. Data Extraction
2.4. Risk of Bias Assessment
2.5. Outcomes
2.6. Data Syntheses and Analyses
2.7. Certainty of the Evidence
3. Results
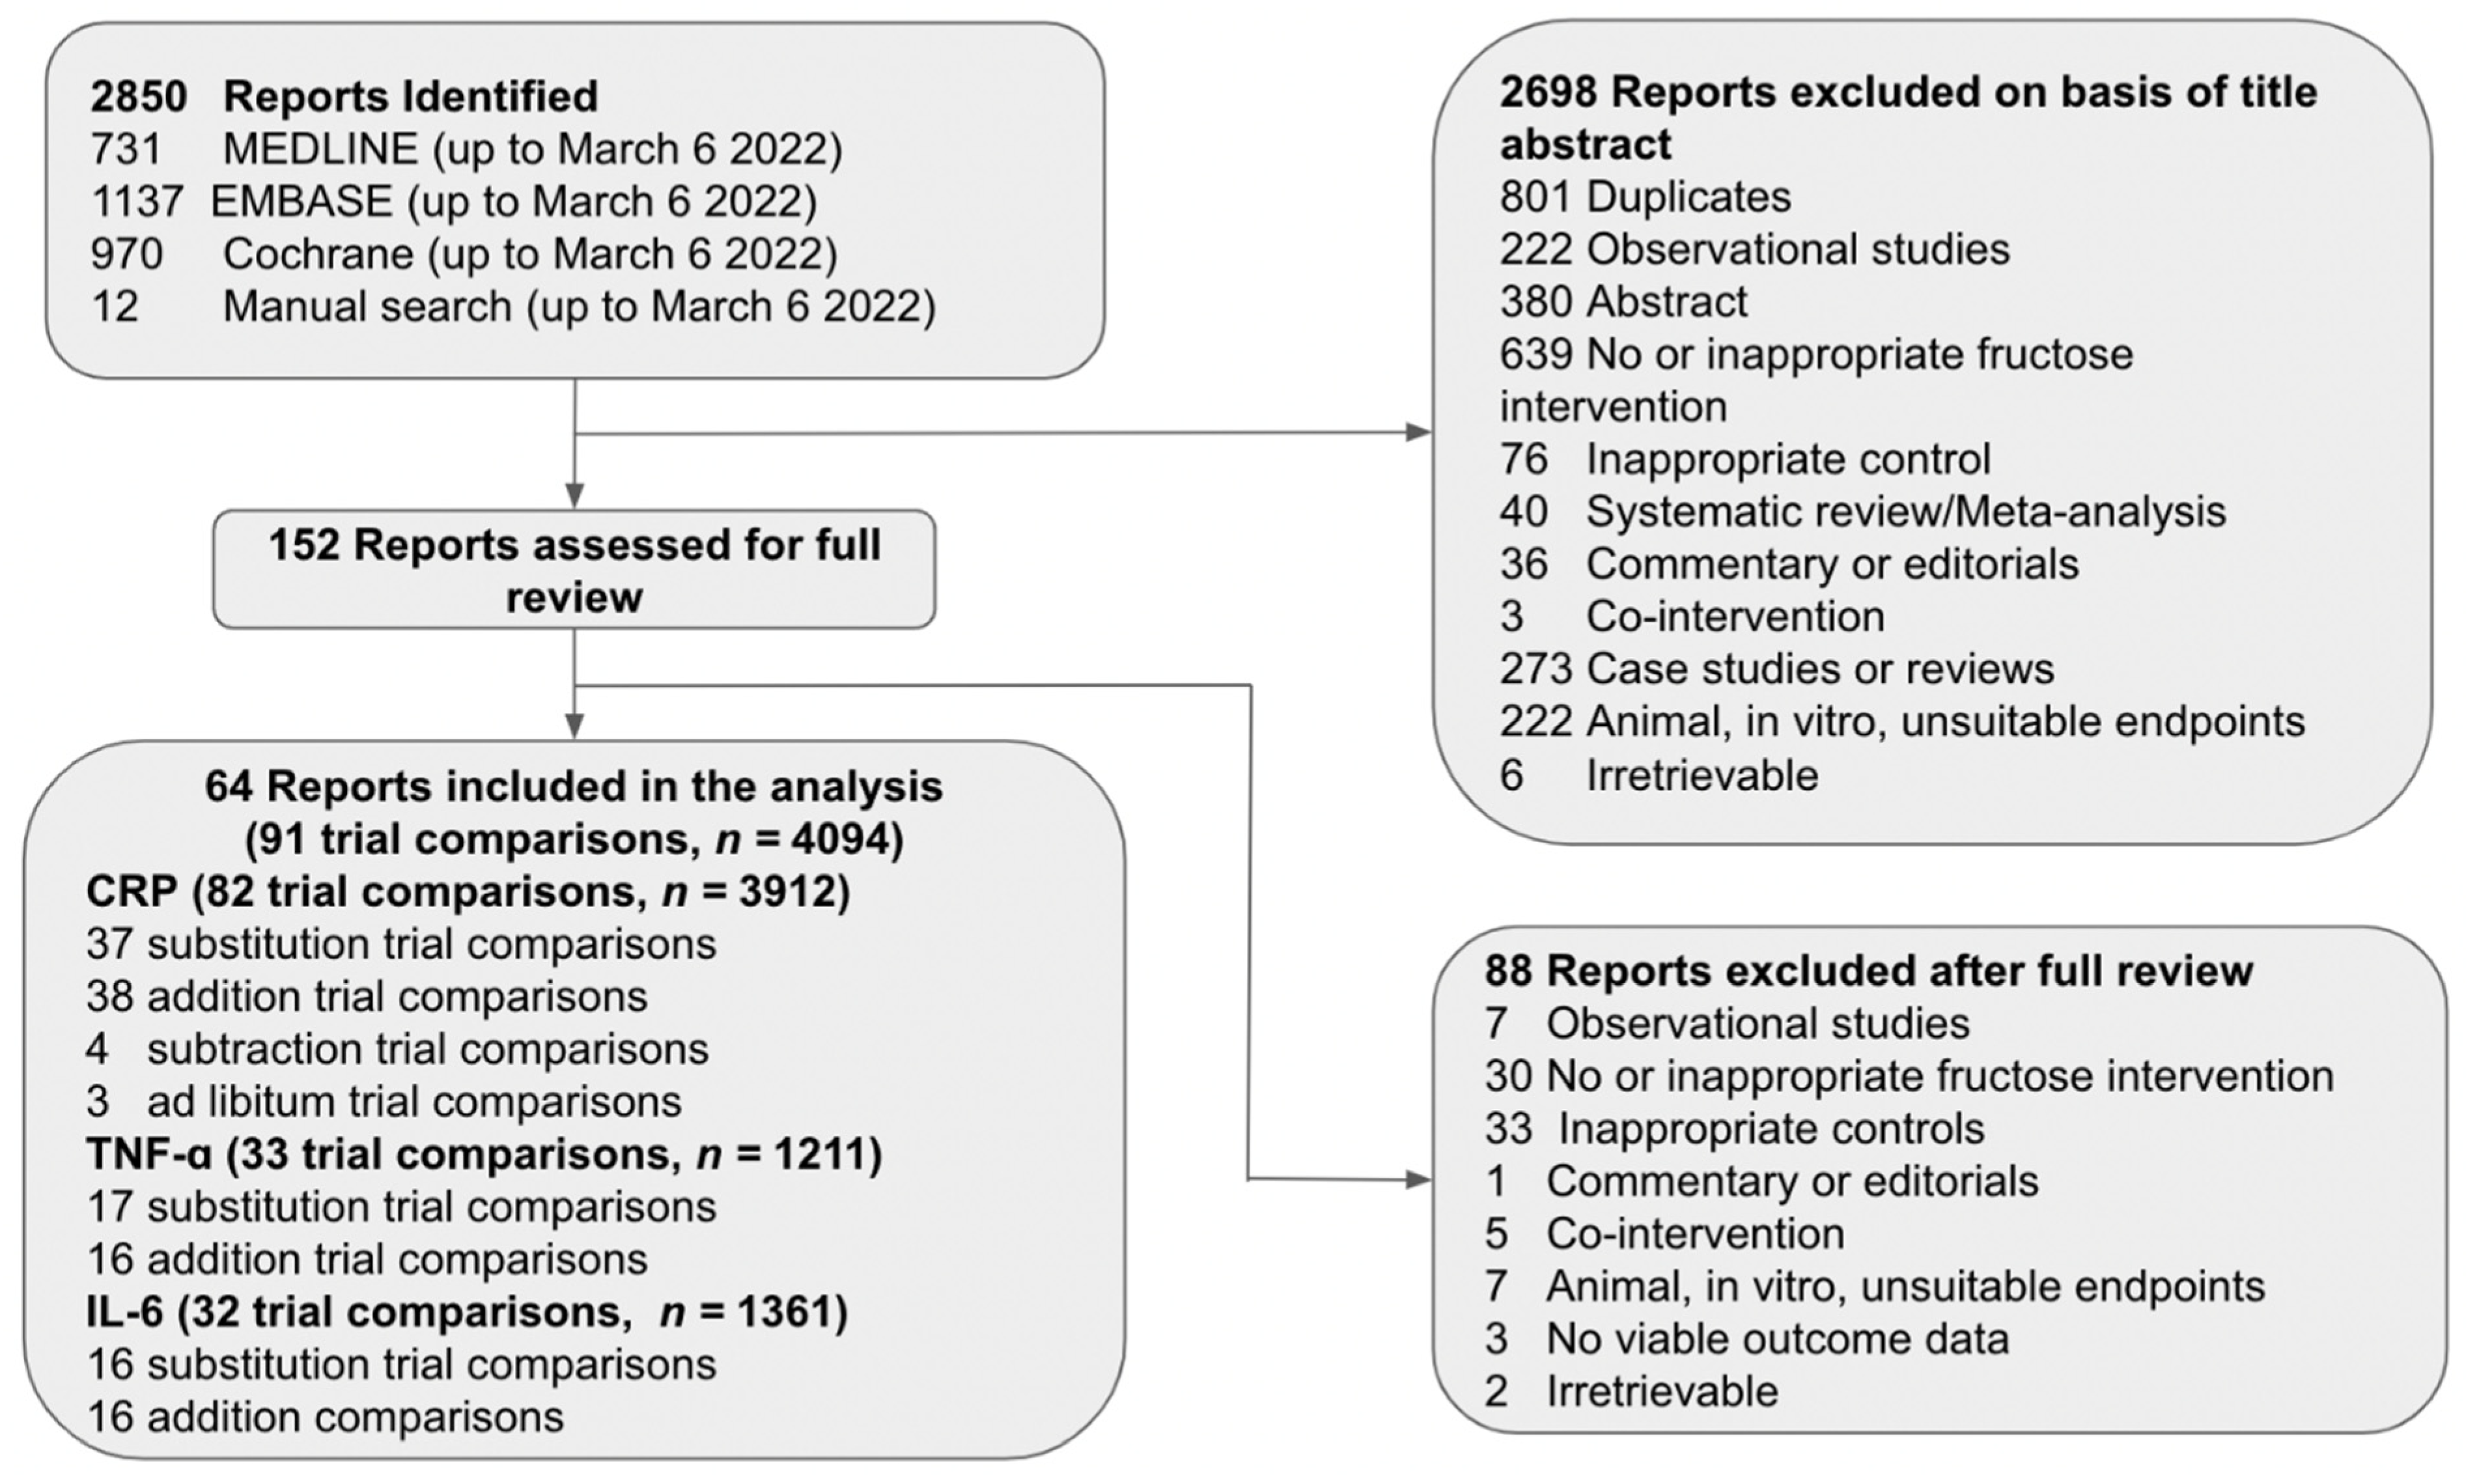
3.1. Search Results
3.2. Trial Characteristics
3.3. Risk of Bias
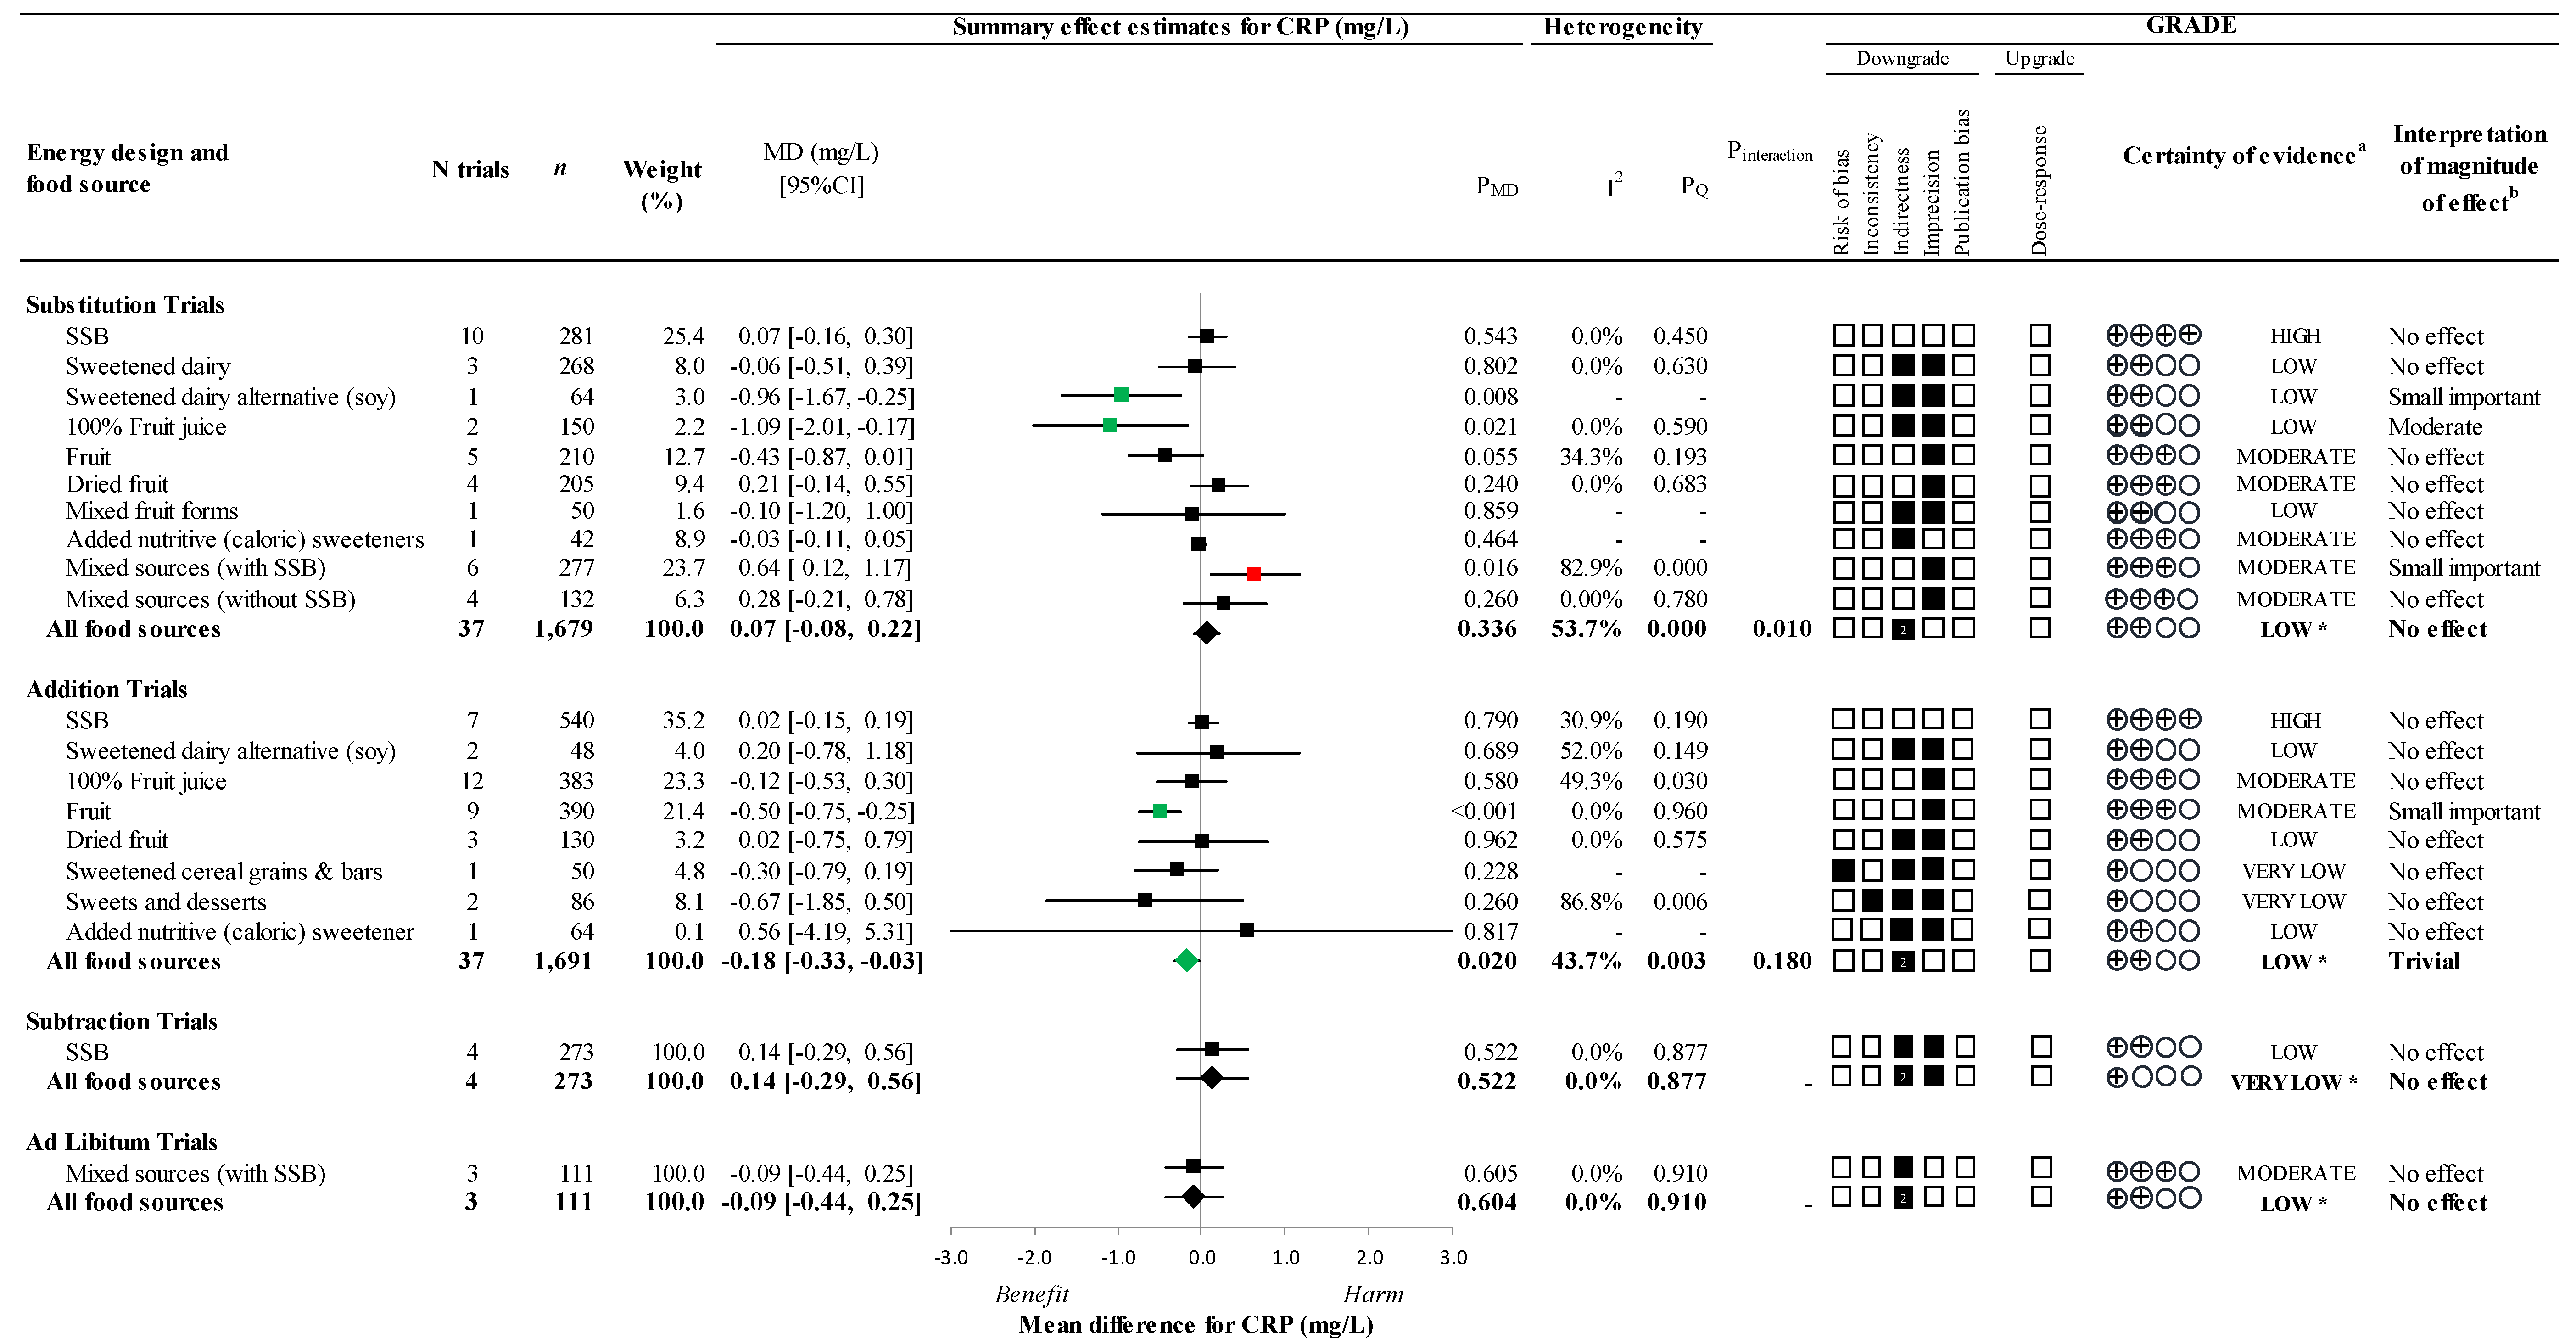
3.4. Primary Outcome
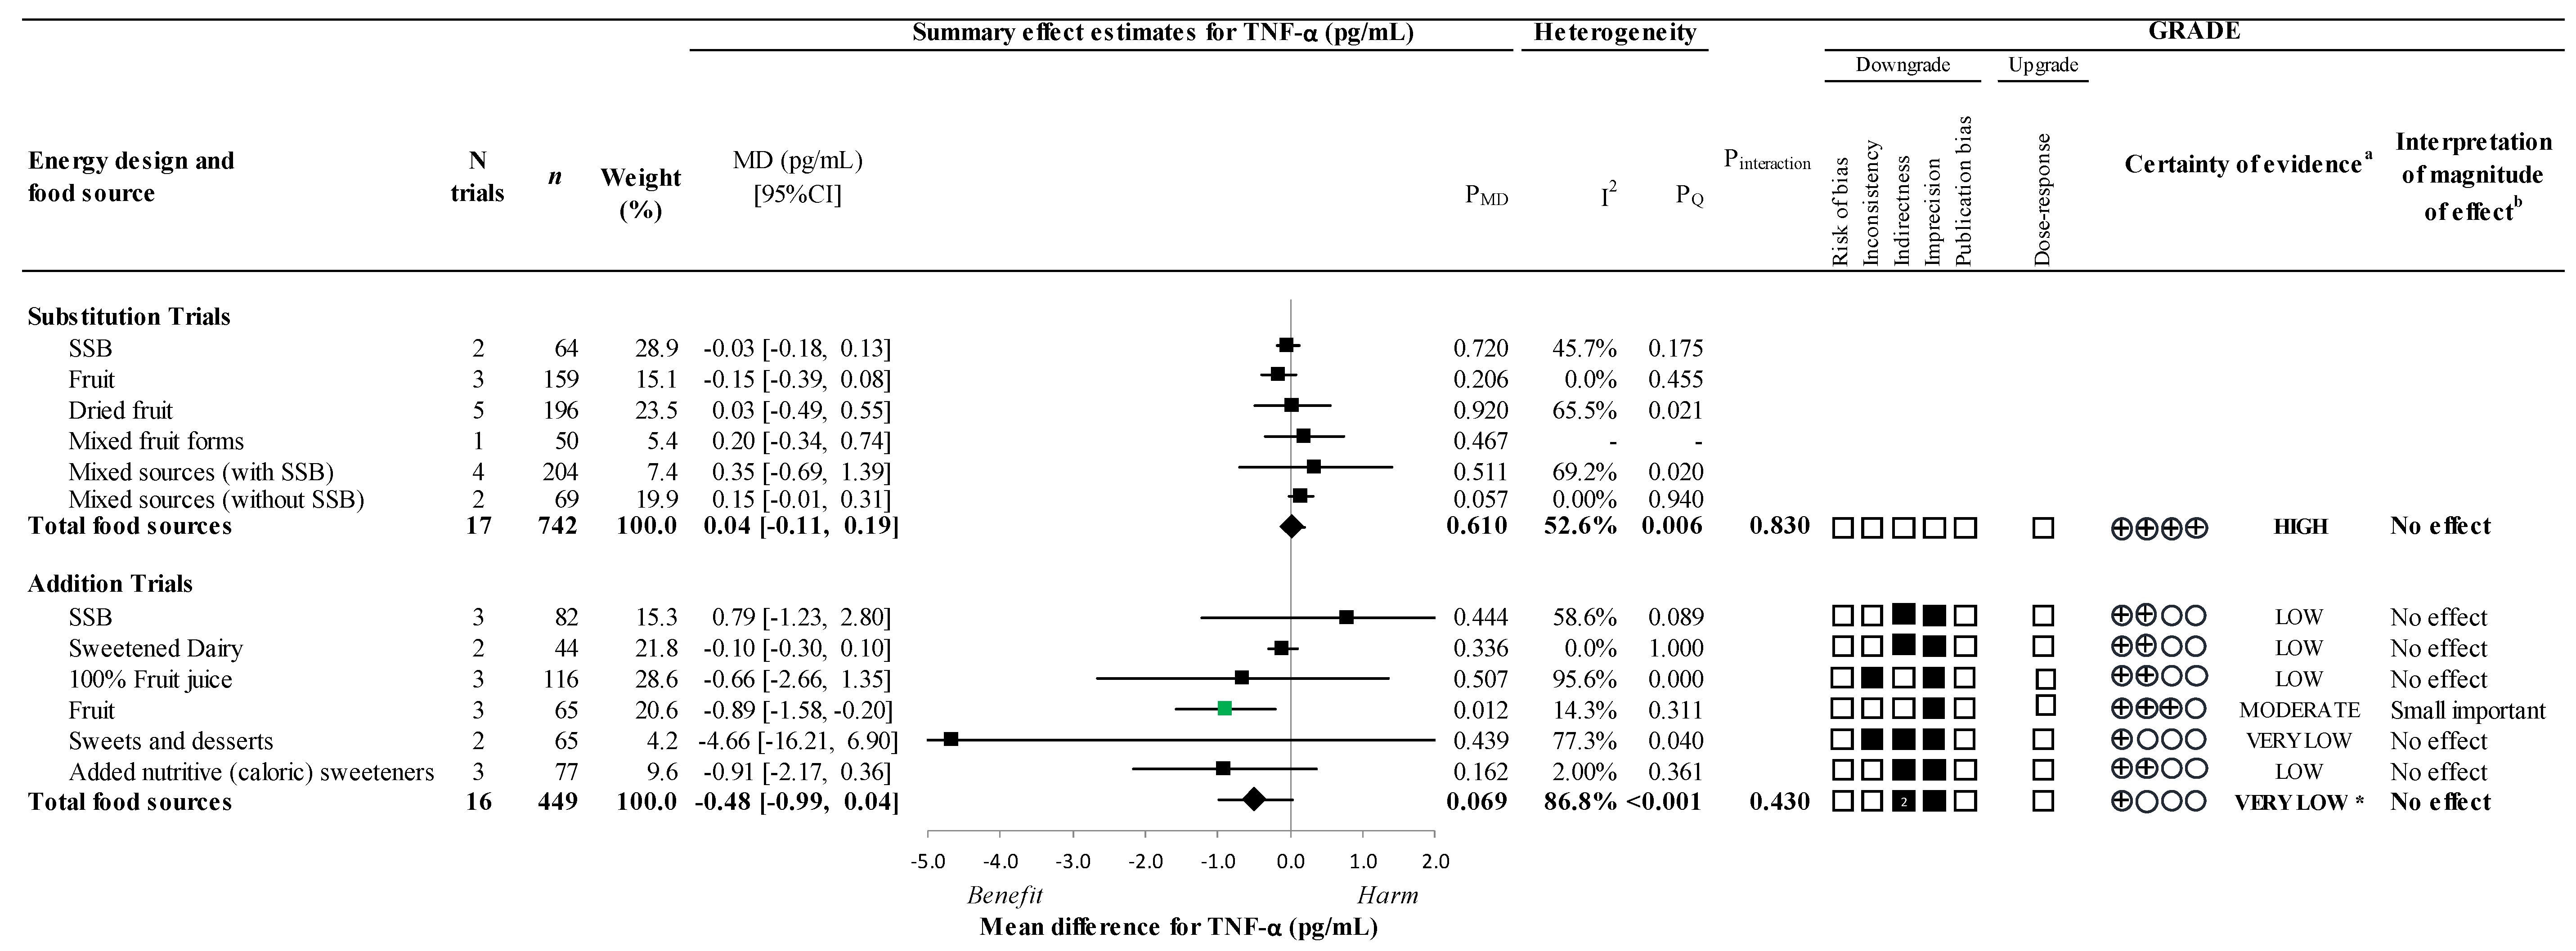
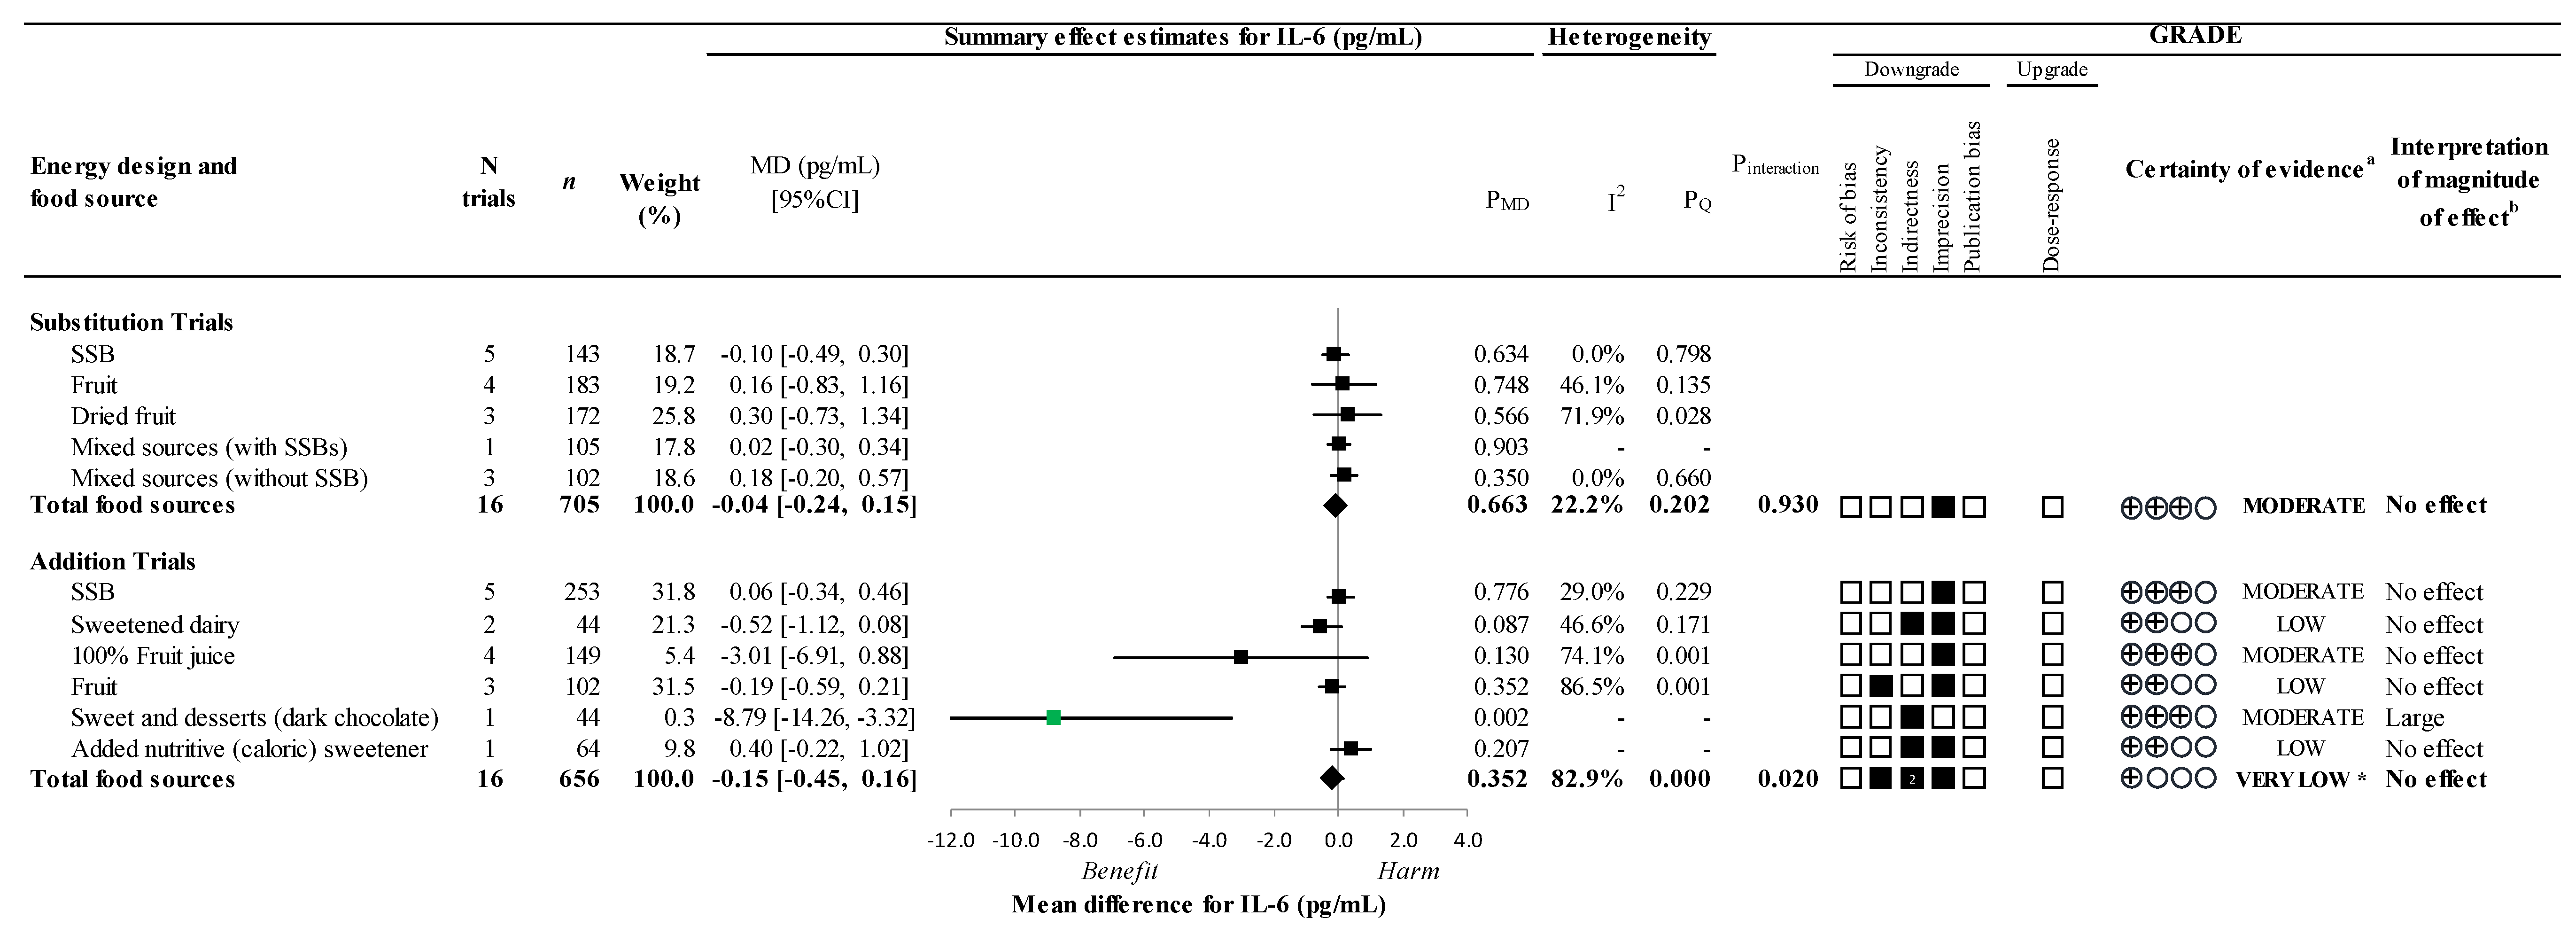
3.5. Secondary Outcomes
3.6. Sensitivity and Subgroup Analyses
3.7. Dose Response Analyses
3.8. Publication Bias
3.9. GRADE Assessment
4. Discussion
4.1. Findings in Relation to the Literature
4.2. Potential Mechanisms
4.3. Strengths and Limitations
4.4. Implications
5. Conclusions
Supplementary Materials
Author Contributions
Funding
Institutional Review Board Statement
Informed Consent Statement
Data Availability Statement
Conflicts of Interest
References
- Berg, A.H.; Scherer, P.E. Adipose tissue, inflammation, and cardiovascular disease. Circ. Res. 2005, 96, 939–949. [Google Scholar] [CrossRef] [PubMed]
- Ridker, P.M. From Cantos to Cirt to Colcot to Clinic: Will All Atherosclerosis Patients Soon Be Treated with Combination Lipid-Lowering and Inflammation-Inhibiting Agents? Circulation 2020, 141, 787–789. [Google Scholar] [CrossRef] [PubMed]
- Calder, P.C.; Ahluwalia, N.; Brouns, F.; Buetler, T.; Clement, K.; Cunningham, K.; Esposito, K.; Jonsson, L.S.; Kolb, H.; Lansink, M.; et al. Dietary factors and low-grade inflammation in relation to overweight and obesity. Br. J. Nutr. 2011, 106 (Suppl. 3), S5–S78. [Google Scholar] [CrossRef] [PubMed]
- Li, J.; Lee, D.H.; Hu, J.; Tabung, F.K.; Li, Y.; Bhupathiraju, S.N.; Rimm, E.B.; Rexrode, K.M.; Manson, J.E.; Willett, W.C.; et al. Dietary Inflammatory Potential and Risk of Cardiovascular Disease Among Men and Women in the U.S. J. Am. Coll. Cardiol. 2020, 76, 2181–2193. [Google Scholar] [CrossRef]
- World Health Organization. Guideline: Sugars Intake for Adults and Children; World Health Organization: Geneva, Switzerland, 2015; Available online: http://apps.who.int/iris/bitstream/handle/10665/149782/9789241549028_eng.pdf;jsessionid=F9FAD19E165BB45830BA1A484FC6FD93?sequence=1 (accessed on 30 June 2022).
- Campos, V.C.; Tappy, L. Physiological handling of dietary fructose-containing sugars: Implications for health. Int. J. Obes. 2016, 40 (Suppl. 1), S6–S11. [Google Scholar] [CrossRef]
- Sun, S.Z.; Empie, M.W. Fructose metabolism in humans—What isotopic tracer studies tell us. Nutr. Metab. 2012, 9, 89. [Google Scholar] [CrossRef]
- Ayoub-Charette, S.; Chiavaroli, L.; Liu, Q.; Khan, T.A.; Zurbau, A.; Au-Yeung, F.; Cheung, A.; Ahmed, A.; Lee, D.; Choo, V.L.; et al. Different Food Sources of Fructose-Containing Sugars and Fasting Blood Uric Acid Levels: A Systematic Review and Meta-Analysis of Controlled Feeding Trials. J. Nutr. 2021, 151, 2409–2421. [Google Scholar] [CrossRef]
- Chiavaroli, L.; de Souza, R.J.; Ha, V.; Cozma, A.I.; Mirrahimi, A.; Wang, D.D.; Yu, M.; Carleton, A.J.; Di Buono, M.; Jenkins, A.L.; et al. Effect of Fructose on Established Lipid Targets: A Systematic Review and Meta-Analysis of Controlled Feeding Trials. J. Am. Heart Assoc. 2015, 4, e001700. [Google Scholar] [CrossRef]
- Chiu, S.; Sievenpiper, J.L.; de Souza, R.J.; Cozma, A.I.; Mirrahimi, A.; Carleton, A.J.; Ha, V.; Di Buono, M.; Jenkins, A.L.; Leiter, L.A.; et al. Effect of fructose on markers of non-alcoholic fatty liver disease (NAFLD): A systematic review and meta-analysis of controlled feeding trials. Eur. J. Clin. Nutr. 2014, 68, 416–423. [Google Scholar] [CrossRef]
- Choo, V.L.; Viguiliouk, E.; Blanco Mejia, S.; Cozma, A.I.; Khan, T.A.; Ha, V.; Wolever, T.M.S.; Leiter, L.A.; Vuksan, V.; Kendall, C.W.C.; et al. Food sources of fructose-containing sugars and glycaemic control: Systematic review and meta-analysis of controlled intervention studies. BMJ 2018, 363, k4644. [Google Scholar] [CrossRef]
- Sievenpiper, J.L.; de Souza, R.J.; Mirrahimi, A.; Yu, M.E.; Carleton, A.J.; Beyene, J.; Chiavaroli, L.; Di Buono, M.; Jenkins, A.L.; Leiter, L.A.; et al. Effect of fructose on body weight in controlled feeding trials: A systematic review and meta-analysis. Ann. Intern. Med. 2012, 156, 291–304. [Google Scholar] [CrossRef]
- Gersch, M.S.; Mu, W.; Cirillo, P.; Reungjui, S.; Zhang, L.; Roncal, C.; Sautin, Y.Y.; Johnson, R.J.; Nakagawa, T. Fructose, but not dextrose, accelerates the progression of chronic kidney disease. Am. J. Physiol. Ren. Physiol. 2007, 293, F1256–F1261. [Google Scholar] [CrossRef] [PubMed]
- Malik, V.S.; Hu, F.B. The role of sugar-sweetened beverages in the global epidemics of obesity and chronic diseases. Nat. Rev. Endocrinol. 2022, 18, 205–218. [Google Scholar] [CrossRef] [PubMed]
- Schulze, M.B.; Hoffmann, K.; Manson, J.E.; Willett, W.C.; Meigs, J.B.; Weikert, C.; Heidemann, C.; Colditz, G.A.; Hu, F.B. Dietary pattern, inflammation, and incidence of type 2 diabetes in women. Am. J. Clin. Nutr. 2005, 82, 675–684. [Google Scholar] [CrossRef] [PubMed]
- DeChristopher, L.R.; Uribarri, J.; Tucker, K.L. Intake of high fructose corn syrup sweetened soft drinks, fruit drinks and apple juice is associated with prevalent coronary heart disease, in U.S. adults, ages 45–59 y. BMC Nutr. 2017, 3, 51. [Google Scholar] [CrossRef] [PubMed]
- Higgins, J.P.T.T.J.; Chandler, J.; Cumpston, M.; Li, T.; Page, M.J.; Welch, V.A. Cochrane Handbook for Systematic Reviews of Interventions Version 6.3. Cochrane. 2022. Available online: https://training.cochrane.org/handbook/current (accessed on 10 June 2022).
- Moher, D.; Liberati, A.; Tetzlaff, J.; Altman, D.G. Preferred reporting items for systematic reviews and meta-analyses: The PRISMA statement. PLoS Med. 2009, 6, e1000097. [Google Scholar] [CrossRef] [PubMed]
- Wilczynski, N.L.; Morgan, D.; Haynes, R.B.; Hedges, T. An overview of the design and methods for retrieving high-quality studies for clinical care. BMC Med. Inf. Decis. Mak. 2005, 5, 20. [Google Scholar] [CrossRef]
- Te Morenga, L.; Mallard, S.; Mann, J. Dietary sugars and body weight: Systematic review and meta-analyses of randomised controlled trials and cohort studies. BMJ 2012, 346, e7492. [Google Scholar] [CrossRef]
- SourceForge. Plot Digitizer. 2001. Available online: http://plotdigitizer.sourceforge.net/ (accessed on 24 October 2015).
- Luo, D.; Wan, X.; Liu, J.; Tong, T. Optimally estimating the sample mean from the sample size, median, mid-range, and/or mid-quartile range. Stat. Methods Med. Res. 2018, 27, 1785–1805. [Google Scholar] [CrossRef]
- Wan, X.; Wang, W.; Liu, J.; Tong, T. Estimating the sample mean and standard deviation from the sample size, median, range and/or interquartile range. BMC Med. Res. Methodol. 2014, 14, 135. [Google Scholar] [CrossRef]
- Furukawa, T.A.; Barbui, C.; Cipriani, A.; Brambilla, P.; Watanabe, N. Imputing missing standard deviations in meta-analyses can provide accurate results. J. Clin. Epidemiol. 2006, 59, 7–10. [Google Scholar] [CrossRef] [PubMed]
- Borenstein, M.; Higgins, J.P. Meta-analysis and subgroups. Prev. Sci. 2013, 14, 134–143. [Google Scholar] [CrossRef] [PubMed]
- Borenstein, M.; Hedges, L.V.; Higgins, J.P.; Rothstein, H.R. Introduction to Meta-Analysis; John Wiley & Sons: London, UK, 2009. [Google Scholar]
- Deeks, J.J.; Higgins, J.P.; Altman, D.G.; Cochrane Statistical Methods Group. Analysing data and undertaking meta-analyses. In Cochrane Handbook for Systematic Reviews of Interventions; Wiley: New York, NY, USA, 2019; pp. 241–284. [Google Scholar]
- DerSimonian, R.; Laird, N. Meta-analysis in clinical trials. Control. Clin. Trials 1986, 7, 177–188. [Google Scholar] [CrossRef]
- Tufanaru, C.; Munn, Z.; Stephenson, M.; Aromataris, E. Fixed or random effects meta-analysis? Common methodological issues in systematic reviews of effectiveness. Int. J. Evid. Based Healthc. 2015, 13, 196–207. [Google Scholar] [CrossRef]
- Elbourne, D.R.; Altman, D.G.; Higgins, J.P.T.; Curtin, F.; Worthington, H.V.; Vail, A. Meta-analyses involving cross-over trials: Methodological issues. Int. J. Epidemiol. 2002, 31, 140–149. [Google Scholar] [CrossRef]
- Follmann, D.; Elliott, P.; Suh, I.; Cutler, J. Variance imputation for overviews of clinical trials with continuous response. J. Clin. Epidemiol. 1992, 45, 769–773. [Google Scholar] [CrossRef]
- Balk, E.M.; Earley, A.; Patel, K.; Trikalinos, T.A.; Dahabreh, I.J. AHRQ Methods for Effective Health Care. In Empirical Assessment of Within-Arm Correlation Imputation in Trials of Continuous Outcomes; Agency for Healthcare Research and Quality (US): Rockville, MD, USA, 2012. [Google Scholar]
- Reynolds Risk Score. Available online: http://www.reynoldsriskscore.org/Default.aspx (accessed on 14 March 2020).
- Ridker, P.M.; Buring, J.E.; Rifai, N.; Cook, N.R. Development and validation of improved algorithms for the assessment of global cardiovascular risk in women: The Reynolds Risk Score. JAMA 2007, 297, 611–619. [Google Scholar] [CrossRef]
- Ridker, P.M.; Paynter, N.P.; Rifai, N.; Gaziano, J.M.; Cook, N.R. C-reactive protein and parental history improve global cardiovascular risk prediction: The Reynolds Risk Score for men. Circulation 2008, 118, 2243–2251. [Google Scholar] [CrossRef]
- Mayoclinic. Tumour Necrosis Factor (TNF), Plasma. Available online: https://www.mayocliniclabs.com/test-catalog/Clinical+and+Interpretive/63022 (accessed on 18 March 2020).
- Mayoclinic. Interleukin 6, Plasma. Available online: https://www.mayocliniclabs.com/test-catalog/Clinical+and+Interpretive/63020 (accessed on 18 March 2020).
- Thompson, S.G.; Higgins, J.P. How should meta-regression analyses be undertaken and interpreted? Stat. Med. 2002, 21, 1559–1573. [Google Scholar] [CrossRef]
- Fu, R.; Gartlehner, G.; Grant, M.; Shamliyan, T.; Sedrakyan, A.; Wilt, T.J.; Griffith, L.; Oremus, M.; Raina, P.; Ismaila, A.; et al. Conducting quantitative synthesis when comparing medical interventions: AHRQ and the Effective Health Care Program. J. Clin. Epidemiol. 2011, 64, 1187–1197. [Google Scholar] [CrossRef]
- Carbohydrates and Health: Scientific Advisory Committee on Nutrition. 2015. Available online: https://www.gov.uk/government/publications/sacn-carbohydrates-and-health-report#:~:text=The%20Scientific%20Advisory%20Committee%20on%20Nutrition%20(%20SACN%20)%20was%20asked%20by,2%20diabetes%2C%20bowel%20health%20and (accessed on 18 March 2020).
- U.S. Department of Health and Human Services; U.S. Department of Agriculture. 2015–2020 Dietary Guidelines for Americans; National Academies Press: Washington, DC, USA, 2015; ISBN 9780160934650.
- Dietary Reference Intakes for Energy, Carbohydrate, Fiber, Fat, Fatty Acids, Cholesterol, Protein, and Amino Acids; Institute of Medicine, The National Academies Press: Washington, DC, USA, 2005; 1358p.
- Egger, M.; Smith, G.D.; Schneider, M.; Minder, C. Bias in meta-analysis detected by a simple, graphical test. BMJ 1997, 315, 629–634. [Google Scholar] [CrossRef] [PubMed]
- Begg, C.B.; Mazumdar, M. Operating Characteristics of a Rank Correlation Test for Publication Bias. Biometrics 1994, 50, 1088–1101. [Google Scholar] [CrossRef] [PubMed]
- Sterne, J.A.; Gavaghan, D.; Egger, M. Publication and related bias in meta-analysis: Power of statistical tests and prevalence in the literature. J. Clin. Epidemiol. 2000, 53, 1119–1129. [Google Scholar] [CrossRef]
- Duval, S.; Tweedie, R. Trim and fill: A simple funnel-plot-based method of testing and adjusting for publication bias in meta-analysis. Biometrics 2000, 56, 455–463. [Google Scholar] [CrossRef] [PubMed]
- Higgins, J.P.T.; Green, S. GRADE Handbook. 2013. Available online: https://handbook-5-1.cochrane.org (accessed on 10 November 2018).
- Andrews, J.; Guyatt, G.; Oxman, A.D.; Alderson, P.; Dahm, P.; Falck-Ytter, Y.; Nasser, M.; Meerpohl, J.; Post, P.N.; Kunz, R.; et al. GRADE guidelines: 14. Going from evidence to recommendations: The significance and presentation of recommendations. J. Clin. Epidemiol. 2013, 66, 719–725. [Google Scholar] [CrossRef] [PubMed]
- Brunetti, M.; Shemilt, I.; Pregno, S.; Vale, L.; Oxman, A.D.; Lord, J.; Sisk, J.; Ruiz, F.; Hill, S.; Guyatt, G.H.; et al. GRADE guidelines: 10. Considering resource use and rating the quality of economic evidence. J. Clin. Epidemiol. 2013, 66, 140–150. [Google Scholar] [CrossRef]
- Guyatt, G.H.; Oxman, A.D.; Schünemann, H.J. GRADE guidelines-an introduction to the 10th–13th articles in the series. J. Clin. Epidemiol. 2013, 66, 121–123. [Google Scholar] [CrossRef]
- Guyatt, G.H.; Thorlund, K.; Oxman, A.D.; Walter, S.D.; Patrick, D.; Furukawa, T.A.; Johnston, B.C.; Karanicolas, P.; Akl, E.A.; Vist, G.; et al. GRADE guidelines: 13. Preparing summary of findings tables and evidence profiles-continuous outcomes. J. Clin. Epidemiol. 2013, 66, 173–183. [Google Scholar] [CrossRef]
- Guyatt, G.; Oxman, A.D.; Sultan, S.; Brozek, J.; Glasziou, P.; Alonso-Coello, P.; Atkins, D.; Kunz, R.; Montori, V.; Jaeschke, R.; et al. GRADE guidelines: 11. Making an overall rating of confidence in effect estimates for a single outcome and for all outcomes. J. Clin. Epidemiol. 2013, 66, 151–157. [Google Scholar] [CrossRef]
- Guyatt, G.H.; Oxman, A.D.; Santesso, N.; Helfand, M.; Vist, G.; Kunz, R.; Brozek, J.; Norris, S.; Meerpohl, J.; Djulbegovic, B.; et al. GRADE guidelines: 12. Preparing summary of findings tables-binary outcomes. J. Clin. Epidemiol. 2013, 66, 158–172. [Google Scholar] [CrossRef]
- Santesso, N.; Glenton, C.; Dahm, P.; Garner, P.; Akl, E.A.; Alper, B.; Brignardello-Petersen, R.; Carrasco-Labra, A.; De Beer, H.; Hultcrantz, M.; et al. GRADE guidelines 26: Informative statements to communicate the findings of systematic reviews of interventions. J. Clin. Epidemiol. 2020, 119, 126–135. [Google Scholar] [CrossRef] [PubMed]
- Guyatt, G.H.; Oxman, A.D.; Sultan, S.; Glasziou, P.; Akl, E.A.; Alonso-Coello, P.; Atkins, D.; Kunz, R.; Brozek, J.; Montori, V.; et al. GRADE guidelines: 9. Rating up the quality of evidence. J. Clin. Epidemiol. 2011, 64, 1311–1316. [Google Scholar] [CrossRef] [PubMed]
- Balshem, H.; Helfand, M.; Schunemann, H.J.; Oxman, A.D.; Kunz, R.; Brozek, J.; Vist, G.E.; Falck-Ytter, Y.; Meerpohl, J.; Norris, S.; et al. GRADE guidelines: 3. Rating the quality of evidence. J. Clin. Epidemiol. 2011, 64, 401–406. [Google Scholar] [CrossRef] [PubMed]
- Aeberli, I.; Gerber, P.A.; Hochuli, M.; Kohler, S.; Haile, S.R.; Gouni-Berthold, I.; Berthold, H.K.; Spinas, G.A.; Berneis, K. Low to moderate sugar-sweetened beverage consumption impairs glucose and lipid metabolism and promotes inflammation in healthy young men: A randomized controlled trial. Am. J. Clin. Nutr. 2011, 94, 479–485. [Google Scholar] [CrossRef]
- Aghababaee, S.K.; Vafa, M.; Shidfar, F.; Tahavorgar, A.; Gohari, M.; Katebi, D.; Mohammadi, V. Effects of blackberry (Morus nigra L.) consumption on serum concentration of lipoproteins, apo A-I, apo B, and high-sensitivity-C-reactive protein and blood pressure in dyslipidemic patients. J. Res. Med. Sci. 2015, 20, 685–691. [Google Scholar]
- Alavinejad, P.; Farsi, F.; Rezazadeh, A.; Mahmoodi, M.; Hajiani, E.; Mas-jedizadeh, A.R.; Mard, S.A.; Neisi, N.; Hoseini, H.; Moghaddam, E.K.; et al. The Effects of Dark Chocolate Consumption on Lipid Profile, Fasting Blood Sugar, Liver Enzymes, Inflammation, and Antioxidant Status in Patients with Non-Alcoholic Fatty Liver Disease: A Randomized, Placebo-Controlled, Pilot study. J. Gastroenterol. Hepatol. Res. 2015, 4, 1858–1864. [Google Scholar] [CrossRef]
- Angelopoulos, T.J.; Lowndes, J.; Sinnett, S.; Rippe, J.M. Fructose Containing Sugars at Normal Levels of Consumption Do Not Effect Adversely Components of the Metabolic Syndrome and Risk Factors for Cardiovascular Disease. Nutrients 2016, 8, 179. [Google Scholar] [CrossRef]
- Asgary, S.; Sahebkar, A.; Afshani, M.R.; Keshvari, M.; Haghjooyjavanmard, S.; Rafieian-Kopaei, M. Clinical evaluation of blood pressure lowering, endothelial function improving, hypolipidemic and anti-inflammatory effects of pomegranate juice in hypertensive subjects. Phytother. Res. 2014, 28, 193–199. [Google Scholar] [CrossRef]
- Basu, A.; Du, M.; Leyva, M.J.; Sanchez, K.; Betts, N.M.; Wu, M.; Aston, C.E.; Lyons, T.J. Blueberries decrease cardiovascular risk factors in obese men and women with metabolic syndrome. J. Nutr. 2010, 140, 1582–1587. [Google Scholar] [CrossRef]
- Blum, A.; Monir, M.; Khazim, K.; Peleg, A.; Blum, N. Tomato-rich (Mediterranean) diet does not modify inflammatory markers. Clin. Investig. Med. 2007, 30, E70–E74. [Google Scholar] [CrossRef]
- Brymora, A.; Flisinski, M.; Johnson, R.J.; Goszka, G.; Stefanska, A.; Manitius, J. Low-fructose diet lowers blood pressure and inflammation in patients with chronic kidney disease. Nephrol. Dial. Transpl. 2012, 27, 608–612. [Google Scholar] [CrossRef] [PubMed]
- Campos, V.; Despland, C.; Brandejsky, V.; Kreis, R.; Schneiter, P.; Chiolero, A.; Boesch, C.; Tappy, L. Sugar- and artificially sweetened beverages and intrahepatic fat: A randomized controlled trial. Obesity 2015, 23, 2335–2339. [Google Scholar] [CrossRef] [PubMed]
- Castilla, P.; Davalos, A.; Teruel, J.L.; Cerrato, F.; Fernandez-Lucas, M.; Merino, J.L.; Sanchez-Martin, C.C.; Ortuno, J.; Lasuncion, M.A. Comparative effects of dietary supplementation with red grape juice and vitamin E on production of superoxide by circulating neutrophil NADPH oxidase in hemodialysis patients. Am. J. Clin. Nutr. 2008, 87, 1053–1061. [Google Scholar] [CrossRef] [PubMed]
- Chiu, S.; Siri-Tarino, P.; Bergeron, N.; Suh, J.H.; Krauss, R.M. A Randomized Study of the Effect of Replacing Sugar-Sweetened Soda by Reduced Fat Milk on Cardiometabolic Health in Male Adolescent Soda Drinkers. Nutrients 2020, 12, 405. [Google Scholar] [CrossRef]
- Cox, C.L.; Stanhope, K.L.; Schwarz, J.M.; Graham, J.L.; Hatcher, B.; Griffen, S.C.; Bremer, A.A.; Berglund, L.; McGahan, J.P.; Keim, N.L.; et al. Circulating concentrations of monocyte chemoattractant protein-1, plasminogen activator inhibitor-1, and soluble leukocyte adhesion molecule-1 in overweight/obese men and women consuming fructose- or glucose-sweetened beverages for 10 weeks. J. Clin. Endocrinol. Metab. 2011, 96, E2034–E2038. [Google Scholar] [CrossRef]
- Dow, C.A.; Going, S.B.; Chow, H.H.; Patil, B.S.; Thomson, C.A. The effects of daily consumption of grapefruit on body weight, lipids, and blood pressure in healthy, overweight adults. Metabolism 2012, 61, 1026–1035. [Google Scholar] [CrossRef]
- Ebbeling, C.B.; Feldman, H.A.; Steltz, S.K.; Quinn, N.L.; Robinson, L.M.; Ludwig, D.S. Effects of Sugar-Sweetened, Artificially Sweetened, and Unsweetened Beverages on Cardiometabolic Risk Factors, Body Composition, and Sweet Taste Preference: A Randomized Controlled Trial. J. Am. Heart Assoc. 2020, 9, e015668. [Google Scholar] [CrossRef]
- Ellis, C.L.; Edirisinghe, I.; Kappagoda, T.; Burton-Freeman, B. Attenuation of meal-induced inflammatory and thrombotic responses in overweight men and women after 6-week daily strawberry (Fragaria) intake. A randomized placebo-controlled trial. J. Atheroscler. Thromb. 2011, 18, 318–327. [Google Scholar] [CrossRef]
- Eslami, O.; Shidfar, F.; Maleki, Z.; Jazayeri, S.; Hosseini, A.F.; Agah, S.; Ardiyani, F. Effect of Soy Milk on Metabolic Status of Patients with Nonalcoholic Fatty Liver Disease: A Randomized Clinical Trial. J. Am. Coll. Nutr. 2019, 38, 51–58. [Google Scholar] [CrossRef]
- Fatel, E.C.S.; Rosa, F.T.; Alfieri, D.F.; Flauzino, T.; Scavuzzi, B.M.; Lozovoy, M.A.B.; Iriyoda, T.M.V.; Simao, A.N.C.; Dichi, I. Beneficial effects of fish oil and cranberry juice on disease activity and inflammatory biomarkers in people with rheumatoid arthritis. Nutrition 2021, 86, 111183. [Google Scholar] [CrossRef]
- Franck, M.; de Toro-Martin, J.; Garneau, V.; Guay, V.; Kearney, M.; Pilon, G.; Roy, D.; Couture, P.; Couillard, C.; Marette, A.; et al. Effects of Daily Raspberry Consumption on Immune-Metabolic Health in Subjects at Risk of Metabolic Syndrome: A Randomized Controlled Trial. Nutrients 2020, 12, 3858. [Google Scholar] [CrossRef] [PubMed]
- Fridell, S.; Strom, E.; Agebratt, C.; Leanderson, P.; Guldbrand, H.; Nystrom, F.H. A randomised study in young subjects of the effects of eating extra fruit or nuts on periodontal inflammation. BDJ Open 2018, 4, 17022. [Google Scholar] [CrossRef] [PubMed]
- Ghazali, W.S.; Romli, A.C.; Mohamed, M. Effects of honey supplementation on inflammatory markers among chronic smokers: A randomized controlled trial. BMC Complement. Altern. Med. 2017, 17, 175. [Google Scholar] [CrossRef] [PubMed]
- Goss, A.M.; Dowla, S.; Pendergrass, M.; Ashraf, A.; Bolding, M.; Morrison, S.; Amerson, A.; Soleymani, T.; Gower, B. Effects of a carbohydrate-restricted diet on hepatic lipid content in adolescents with non-alcoholic fatty liver disease: A pilot, randomized trial. Pediatr. Obes. 2020, 15, e12630. [Google Scholar] [CrossRef]
- Hooshmand, S.; Kern, M.; Metti, D.; Shamloufard, P.; Chai, S.C.; Johnson, S.A.; Payton, M.E.; Arjmandi, B.H. The effect of two doses of dried plum on bone density and bone biomarkers in osteopenic postmenopausal women: A randomized, controlled trial. Osteoporos. Int. 2016, 27, 2271–2279. [Google Scholar] [CrossRef]
- Irannejad Niri, Z.; Shidfar, F.; Jabbari, M.; Zarrati, M.; Hosseini, A.; Malek, M.; Dehnad, A. The effect of dried Ziziphus vulgaris on glycemic control, lipid profile, Apo-proteins and hs-CRP in patients with type 2 diabetes mellitus: A randomized controlled clinical trial. J. Food Biochem. 2021, 45, e13193. [Google Scholar] [CrossRef]
- Jafarirad, S.; Ayoobi, N.; Karandish, M.; Jalali, M.T.; Haghighizadeh, M.H.; Jahanshahi, A. Dark Chocolate Effect on Serum Adiponectin, Biochemical and Inflammatory Parameters in Diabetic Patients: A Randomized Clinical Trial. Int. J. Prev. Med. 2018, 9, 86. [Google Scholar] [CrossRef]
- Jalilvand, A.; Behrouz, V.; Nikpayam, O.; Sohrab, G.; Hekmatdoost, A. Effects of low fructose diet on glycemic control, lipid profile and systemic inflammation in patients with type 2 diabetes: A single-blind randomized controlled trial. Diabetes Metab. Syndr. 2020, 14, 849–855. [Google Scholar] [CrossRef]
- Jin, R.; Welsh, J.A.; Le, N.A.; Holzberg, J.; Sharma, P.; Martin, D.R.; Vos, M.B. Dietary fructose reduction improves markers of cardiovascular disease risk in Hispanic-American adolescents with NAFLD. Nutrients 2014, 6, 3187–3201. [Google Scholar] [CrossRef]
- Johnston, R.D.; Stephenson, M.C.; Crossland, H.; Cordon, S.M.; Palcidi, E.; Cox, E.F.; Taylor, M.A.; Aithal, G.P.; Macdonald, I.A. No difference between high-fructose and high-glucose diets on liver triacylglycerol or biochemistry in healthy overweight men. Gastroenterology 2013, 145, 1016–1025.e1012. [Google Scholar] [CrossRef]
- Kaliora, A.C.; Kokkinos, A.; Diolintzi, A.; Stoupaki, M.; Gioxari, A.; Kanellos, P.T.; Dedoussis, G.V.Z.; Vlachogiannakos, J.; Revenas, C.; Ladas, S.D.; et al. The effect of minimal dietary changes with raisins in NAFLD patients with non-significant fibrosis: A randomized controlled intervention. Food Funct. 2016, 7, 4533–4544. [Google Scholar] [CrossRef] [PubMed]
- Kanellos, P.T.; Kaliora, A.C.; Protogerou, A.D.; Tentolouris, N.; Perrea, D.N.; Karathanos, V.T. The effect of raisins on biomarkers of endothelial function and oxidant damage; an open-label and randomized controlled intervention. Food Res. Int. 2017, 102, 674–680. [Google Scholar] [CrossRef] [PubMed]
- Kanellos, P.T.; Kaliora, A.C.; Tentolouris, N.K.; Argiana, V.; Perrea, D.; Kalogeropoulos, N.; Kountouri, A.M.; Karathanos, V.T. A pilot, randomized controlled trial to examine the health outcomes of raisin consumption in patients with diabetes. Nutrition 2014, 30, 358–364. [Google Scholar] [CrossRef] [PubMed]
- Karlsen, A.; Paur, I.; Bohn, S.K.; Sakhi, A.K.; Borge, G.I.; Serafini, M.; Erlund, I.; Laake, P.; Tonstad, S.; Blomhoff, R. Bilberry juice modulates plasma concentration of NF-kappaB related inflammatory markers in subjects at increased risk of CVD. Eur. J. Nutr. 2010, 49, 345–355. [Google Scholar] [CrossRef] [PubMed]
- Kelley, D.S.; Adkins, Y.; Reddy, A.; Woodhouse, L.R.; Mackey, B.E.; Erickson, K.L. Sweet bing cherries lower circulating concentrations of markers for chronic inflammatory diseases in healthy humans. J. Nutr. 2013, 143, 340–344. [Google Scholar] [CrossRef] [PubMed]
- Khodami, B.; Hatami, B.; Yari, Z.; Alavian, S.M.; Sadeghi, A.; Varkaneh, H.K.; Santos, H.O.; Hekmatdoost, A. Effects of a low free sugar diet on the management of nonalcoholic fatty liver disease: A randomized clinical trial. Eur. J. Clin. Nutr. 2022, 76, 987–994. [Google Scholar] [CrossRef] [PubMed]
- Kolehmainen, M.; Mykkanen, O.; Kirjavainen, P.V.; Leppanen, T.; Moilanen, E.; Adriaens, M.; Laaksonen, D.E.; Hallikainen, M.; Puupponen-Pimia, R.; Pulkkinen, L.; et al. Bilberries reduce low-grade inflammation in individuals with features of metabolic syndrome. Mol. Nutr. Food Res. 2012, 56, 1501–1510. [Google Scholar] [CrossRef] [PubMed]
- Kuzma, J.N.; Cromer, G.; Hagman, D.K.; Breymeyer, K.L.; Roth, C.L.; Foster-Schubert, K.E.; Holte, S.E.; Weigle, D.S.; Kratz, M. No differential effect of beverages sweetened with fructose, high-fructose corn syrup, or glucose on systemic or adipose tissue inflammation in normal-weight to obese adults: A randomized controlled trial. Am. J. Clin. Nutr. 2016, 104, 306–314. [Google Scholar] [CrossRef]
- Leelarungrayub, J.; Laskin, J.J.; Bloomer, R.J.; Pinkaew, D. Consumption of star fruit juice on pro-inflammatory markers and walking distance in the community dwelling elderly. Arch. Gerontol. Geriatr. 2016, 64, 6–12. [Google Scholar] [CrossRef] [PubMed]
- Lehtonen, H.M.; Suomela, J.P.; Tahvonen, R.; Vaarno, J.; Venojärvi, M.; Viikari, J.; Kallio, H. Berry meals and risk factors associated with metabolic syndrome. Eur. J. Clin. Nutr. 2010, 64, 614–621. [Google Scholar] [CrossRef]
- Lehtonen, H.M.; Suomela, J.P.; Tahvonen, R.; Yang, B.; Venojärvi, M.; Viikari, J.; Kallio, H. Different berries and berry fractions have various but slightly positive effects on the associated variables of metabolic diseases on overweight and obese women. Eur. J. Clin. Nutr. 2011, 65, 394–401. [Google Scholar] [CrossRef] [PubMed]
- Liddle, D.M.; Lin, X.; Cox, L.C.; Ward, E.M.; Ansari, R.; Wright, A.J.; Robinson, L.E. Daily apple consumption reduces plasma and peripheral blood mononuclear cell-secreted inflammatory biomarkers in adults with overweight and obesity: A 6-week randomized, controlled, parallel-arm trial. Am. J. Clin. Nutr. 2021, 114, 752–763. [Google Scholar] [CrossRef] [PubMed]
- Maki, K.C.; Palacios, O.M.; Kramer, M.W.; Trivedi, R.; Dicklin, M.R.; Wilcox, M.L.; Maki, C.E. Effects of substituting eggs for high-carbohydrate breakfast foods on the cardiometabolic risk-factor profile in adults at risk for type 2 diabetes mellitus. Eur. J. Clin. Nutr. 2020, 74, 784–795. [Google Scholar] [CrossRef] [PubMed]
- Markey, O.; Le Jeune, J.; Lovegrove, J.A. Energy compensation following consumption of sugar-reduced products: A randomized controlled trial. Eur. J. Nutr. 2016, 55, 2137–2149. [Google Scholar] [CrossRef] [PubMed]
- Martini, D.; Rosi, A.; Tassotti, M.; Antonini, M.; Dall’Asta, M.; Bresciani, L.; Fantuzzi, F.; Spigoni, V.; Dominguez-Perles, R.; Angelino, D.; et al. Effect of coffee and cocoa-based confectionery containing coffee on markers of cardiometabolic health: Results from the pocket-4-life project. Eur. J. Nutr. 2021, 60, 1453–1463. [Google Scholar] [CrossRef]
- Mietus-Snyder, M.L.; Shigenaga, M.K.; Suh, J.H.; Shenvi, S.V.; Lal, A.; McHugh, T.; Olson, D.; Lilienstein, J.; Krauss, R.M.; Gildengoren, G.; et al. A nutrient-dense, high-fiber, fruit-based supplement bar increases HDL cholesterol, particularly large HDL, lowers homocysteine, and raises glutathione in a 2-wk trial. FASEB J. 2012, 26, 3515–3527. [Google Scholar] [CrossRef]
- Moazen, S.; Amani, R.; Homayouni Rad, A.; Shahbazian, H.; Ahmadi, K.; Taha Jalali, M. Effects of freeze-dried strawberry supplementation on metabolic biomarkers of atherosclerosis in subjects with type 2 diabetes: A randomized double-blind controlled trial. Ann. Nutr. Metab. 2013, 63, 256–264. [Google Scholar] [CrossRef]
- Munsters, M.J.; Saris, W.H. The effect of sugar-sweetened beverage intake on energy intake in an ad libitum 6-month low-fat high-carbohydrate diet. Ann. Nutr. Metab. 2010, 57, 116–123. [Google Scholar] [CrossRef]
- Navaei, N.; Pourafshar, S.; Akhavan, N.S.; Litwin, N.S.; Foley, E.M.; George, K.S.; Hartley, S.C.; Elam, M.L.; Rao, S.; Arjmandi, B.H.; et al. Influence of daily fresh pear consumption on biomarkers of cardiometabolic health in middle-aged/older adults with metabolic syndrome: A randomized controlled trial. Food Funct. 2019, 10, 1062–1072. [Google Scholar] [CrossRef]
- Nilholm, C.; Larsson, E.; Sonestedt, E.; Roth, B.; Ohlsson, B. Assessment of a 4-Week Starch- and Sucrose-Reduced Diet and Its Effects on Gastrointestinal Symptoms and Inflammatory Parameters among Patients with Irritable Bowel Syndrome. Nutrients 2021, 13, 416. [Google Scholar] [CrossRef]
- Njike, V.Y.; Faridi, Z.; Shuval, K.; Dutta, S.; Kay, C.D.; West, S.G.; Kris-Etherton, P.M.; Katz, D.L. Effects of sugar-sweetened and sugar-free cocoa on endothelial function in overweight adults. Int. J. Cardiol. 2011, 149, 83–88. [Google Scholar] [CrossRef] [PubMed]
- Palacios, O.M.; Maki, K.C.; Xiao, D.; Wilcox, M.L.; Dicklin, M.R.; Kramer, M.; Trivedi, R.; Burton-Freeman, B.; Edirisinghe, I. Effects of Consuming Almonds on Insulin Sensitivity and Other Cardiometabolic Health Markers in Adults with Prediabetes. J. Am. Coll. Nutr. 2020, 39, 397–406. [Google Scholar] [CrossRef]
- Ponce, O.; Benassi, R.; Cesar, T. Orange juice associated with a balanced diet mitigated risk factors of metabolic syndrome: A randomized controlled trial. J. Nutr. Intermed. Metab. 2019, 17, 100101. [Google Scholar] [CrossRef]
- Puglisi, M.J.; Vaishnav, U.; Shrestha, S.; Torres-Gonzalez, M.; Wood, R.J.; Volek, J.S.; Fernandez, M.L. Raisins and additional walking have distinct effects on plasma lipids and inflammatory cytokines. Lipids Health Dis/ 2008, 7, 14. [Google Scholar] [CrossRef]
- Ravn-Haren, G.; Dragsted, L.O.; Buch-Andersen, T.; Jensen, E.N.; Jensen, R.I.; Németh-Balogh, M.; Paulovicsová, B.; Bergström, A.; Wilcks, A.; Licht, T.R.; et al. Intake of whole apples or clear apple juice has contrasting effects on plasma lipids in healthy volunteers. Eur. J. Nutr. 2013, 52, 1875–1889. [Google Scholar] [CrossRef]
- Ribeiro, C.; Dourado, G.; Cesar, T. Orange juice allied to a reduced-calorie diet results in weight loss and ameliorates obesity-related biomarkers: A randomized controlled trial. Nutrition 2017, 38, 13–19. [Google Scholar] [CrossRef]
- Sadeghi, F.; Akhlaghi, M.; Salehi, S. Adverse effects of honey on low-density lipoprotein cholesterol and adiponectin concentrations in patients with type 2 diabetes: A randomized controlled cross-over trial. J. Diabetes Metab. Disord. 2020, 19, 373–380. [Google Scholar] [CrossRef]
- Sanchez-Delgado, M.; Estrada, J.A.; Paredes-Cervantes, V.; Kaufer-Horwitz, M.; Contreras, I. Changes in nutrient and calorie intake, adipose mass, triglycerides and TNF-alpha concentrations after non-caloric sweetener intake: A pilot study. Int. J. Vitam Nutr. Res. 2021, 91, 87–98. [Google Scholar] [CrossRef]
- Schell, J.; Betts, N.M.; Lyons, T.J.; Basu, A. Raspberries Improve Postprandial Glucose and Acute and Chronic Inflammation in Adults with Type 2 Diabetes. Ann. Nutr. Metab. 2019, 74, 165–174. [Google Scholar] [CrossRef]
- Simao, T.N.; Lozovoy, M.A.; Simao, A.N.; Oliveira, S.R.; Venturini, D.; Morimoto, H.K.; Miglioranza, L.H.; Dichi, I. Reduced-energy cranberry juice increases folic acid and adiponectin and reduces homocysteine and oxidative stress in patients with the metabolic syndrome. Br. J. Nutr. 2013, 110, 1885–1894. [Google Scholar] [CrossRef]
- Souto, D.L.; Zajdenverg, L.; Rodacki, M.; Rosado, E.L. Does sucrose intake affect antropometric variables, glycemia, lipemia and C-reactive protein in subjects with type 1 diabetes?: A controlled-trial. Diabetol. Metab. Syndr. 2013, 5, 67. [Google Scholar] [CrossRef] [PubMed]
- Thimoteo, N.S.B.; Iryioda, T.M.V.; Alfieri, D.F.; Rego, B.E.F.; Scavuzzi, B.M.; Fatel, E.; Lozovoy, M.A.B.; Simao, A.N.C.; Dichi, I. Cranberry juice decreases disease activity in women with rheumatoid arthritis. Nutrition 2019, 60, 112–117. [Google Scholar] [CrossRef] [PubMed]
- van Meijl, L.E.; Mensink, R.P. Low-fat dairy consumption reduces systolic blood pressure, but does not improve other metabolic risk parameters in overweight and obese subjects. Nutr. Metab. Cardiovasc. Dis. 2011, 21, 355–361. [Google Scholar] [CrossRef] [PubMed]
- Vaz, M.; Pauline, M.; Unni, U.S.; Parikh, P.; Thomas, T.; Bharathi, A.V.; Avadhany, S.; Muthayya, S.; Mehra, R.; Kurpad, A.V. Micronutrient supplementation improves physical performance measures in Asian Indian school-age children. J. Nutr. 2011, 141, 2017–2023. [Google Scholar] [CrossRef]
- Zafrilla, P.; Masoodi, H.; Cerdá, B.; García-Viguera, C.; Villaño, D. Biological effects of stevia, sucralose and sucrose in citrus-maqui juices on overweight subjects. Food Funct. 2021, 12, 8535–8543. [Google Scholar] [CrossRef]
- Du, C.; Smith, A.; Avalos, M.; South, S.; Crabtree, K.; Wang, W.; Kwon, Y.H.; Vijayagopal, P.; Juma, S. Blueberries Improve Pain, Gait Performance, and Inflammation in Individuals with Symptomatic Knee Osteoarthritis. Nutrients 2019, 11, 290. [Google Scholar] [CrossRef]
- Pothasak, Y.; Leelarungrayub, J.; Natakankitkul, S.; Singhatong, S. Prototype Star Fruit-Honey Product and Effectiveness on Antixidants, Inflammation and Walking Distance in Participants with Stable Chronic Obstructive Pulmonary Disease (COPD). Pharm. J. 2020, 12, 1121–1134. [Google Scholar] [CrossRef]
- Della Corte, K.W.; Perrar, I.; Penczynski, K.J.; Schwingshackl, L.; Herder, C.; Buyken, A.E. Effect of Dietary Sugar Intake on Biomarkers of Subclinical Inflammation: A Systematic Review and Meta-Analysis of Intervention Studies. Nutrients 2018, 10, 606. [Google Scholar] [CrossRef]
- Huang, H.; Chen, G.; Liao, D.; Zhu, Y.; Xue, X. Effects of Berries Consumption on Cardiovascular Risk Factors: A Meta-analysis with Trial Sequential Analysis of Randomized Controlled Trials. Sci. Rep. 2016, 6, 23625. [Google Scholar] [CrossRef]
- Hosseini, B.; Berthon, B.S.; Saedisomeolia, A.; Starkey, M.R.; Collison, A.; Wark, P.A.B.; Wood, L.G. Effects of fruit and vegetable consumption on inflammatory biomarkers and immune cell populations: A systematic literature review and meta-analysis. Am. J. Clin. Nutr. 2018, 108, 136–155. [Google Scholar] [CrossRef]
- Chiavaroli, L.; Cheung, A.; Ayoub-Charette, S.; Ahmed, A.; Lee, D.; Au-Yeung, F.; Qi, X.; Back, S.; McGlynn, N.; Ha, V.; et al. Important food sources of fructose-containing sugars and adiposity: A systematic review and meta-analysis of controlled feeding trials. Am. J. Clin. Nutr. 2022, in press. [Google Scholar]
- Liu, Q.; Chiavaroli, L.; Ayoub-Charette, S.; Ahmed, A.; Khan, T.A.; Au-Yeung, F.; Lee, D.; Cheung, A.; Zurbau, A.; Choo, V.L.; et al. Fructose-containing food sources and blood pressure: A systematic review abnd meta-analysis of controlled feeding trials. PLoS ONE 2022, in press.
- Cara, K.C.; Beauchesne, A.R.; Wallace, T.C.; Chung, M. Effects of 100% Orange Juice on Markers of Inflammation and Oxidation in Healthy and At-Risk Adult Populations: A Scoping Review, Systematic Review, and Meta-analysis. Adv. Nutr. 2022, 13, 116–137. [Google Scholar] [CrossRef] [PubMed]
- Liu, Q.; Ayoub-Charette, S.; Khan, T.A.; Au-Yeung, F.; Blanco Mejia, S.; de Souza, R.J.; Wolever, T.M.S.; Leiter, L.A.; Kendall, C.W.C.; Sievenpiper, J.L. Important Food Sources of Fructose-Containing Sugars and Incident Hypertension: A Systematic Review and Dose-Response Meta-Analysis of Prospective Cohort Studies. J. Am. Heart Assoc. 2019, 8, e010977. [Google Scholar] [CrossRef] [PubMed]
- Semnani-Azad, Z.; Khan, T.A.; Blanco Mejia, S.; de Souza, R.J.; Leiter, L.A.; Kendall, C.W.C.; Hanley, A.J.; Sievenpiper, J.L. Association of Major Food Sources of Fructose-Containing Sugars with Incident Metabolic Syndrome: A Systematic Review and Meta-analysis. JAMA Netw. Open 2020, 3, e209993. [Google Scholar] [CrossRef] [PubMed]
- Zurbau, A.; Au-Yeung, F.; Blanco Mejia, S.; Khan, T.A.; Vuksan, V.; Jovanovski, E.; Leiter, L.A.; Kendall, C.W.C.; Jenkins, D.J.A.; Sievenpiper, J.L. Relation of Different Fruit and Vegetable Sources with Incident Cardiovascular Outcomes: A Systematic Review and Meta-Analysis of Prospective Cohort Studies. J. Am. Heart Assoc. 2020, 9, e017728. [Google Scholar] [CrossRef]
- Pan, A.; Malik, V.S.; Hao, T.; Willett, W.C.; Mozaffarian, D.; Hu, F.B. Changes in water and beverage intake and long-term weight changes: Results from three prospective cohort studies. Int. J. Obes. 2013, 37, 1378–1385. [Google Scholar] [CrossRef]
- Khodarahmi, M.; Foroumandi, E.; Asghari Jafarabadi, M. Effects of soy intake on circulating levels of TNF-alpha and interleukin-6: A systematic review and meta-analysis of randomized controlled trials. Eur. J. Nutr. 2021, 60, 581–601. [Google Scholar] [CrossRef]
- Bajerska, J.; Lagowska, K.; Mori, M.; Regula, J.; Skoczek-Rubinska, A.; Toda, T.; Mizuno, N.; Yamori, Y. A Meta-Analysis of Randomized Controlled Trials of the Effects of Soy Intake on Inflammatory Markers in Postmenopausal Women. J. Nutr. 2022, 152, 5–15. [Google Scholar] [CrossRef]
- Prokopidis, K.; Mazidi, M.; Sankaranarayanan, R.; Tajik, B.; McArdle, A.; Isanejad, M. Effects of whey and soy protein supplementation on inflammatory cytokines in older adults: A systematic review and meta-analysis. Br. J. Nutr. 2022, 1–12. [Google Scholar] [CrossRef]
- Chiavaroli, L.; Nishi, S.K.; Khan, T.A.; Braunstein, C.R.; Glenn, A.J.; Mejia, S.B.; Rahelic, D.; Kahleova, H.; Salas-Salvado, J.; Jenkins, D.J.A.; et al. Portfolio Dietary Pattern and Cardiovascular Disease: A Systematic Review and Meta-analysis of Controlled Trials. Prog. Cardiovasc. Dis. 2018, 61, 43–53. [Google Scholar] [CrossRef] [PubMed]
- Jenkins, D.J.; Kendall, C.W.; Marchie, A.; Faulkner, D.A.; Wong, J.M.; de Souza, R.; Emam, A.; Parker, T.L.; Vidgen, E.; Lapsley, K.G.; et al. Effects of a dietary portfolio of cholesterol-lowering foods vs lovastatin on serum lipids and C-reactive protein. JAMA 2003, 290, 502–510. [Google Scholar] [CrossRef]
- Zhao, B.; Gan, L.; Yu, K.; Mannisto, S.; Huang, J.; Albanes, D. Relationship between chocolate consumption and overall and cause-specific mortality, systematic review and updated meta-analysis. Eur. J. Epidemiol. 2022, 37, 321–333. [Google Scholar] [CrossRef] [PubMed]
- Rahmani, S.; Sadeghi, O.; Sadeghian, M.; Sadeghi, N.; Larijani, B.; Esmaillzadeh, A. The Effect of Whole-Grain Intake on Biomarkers of Subclinical Inflammation: A Comprehensive Meta-analysis of Randomized Controlled Trials. Adv. Nutr. 2020, 11, 52–65. [Google Scholar] [CrossRef]
- Reynolds, A.N.; Akerman, A.P.; Mann, J. Dietary fibre and whole grains in diabetes management: Systematic review and meta-analyses. PLoS Med. 2020, 17, e1003053. [Google Scholar] [CrossRef] [PubMed]
- Lee, D.; Chiavaroli, L.; Ayoub-Charette, S.; Khan, T.A.; Zurbau, A.; Au-Yeung, F.; Cheung, A.; Liu, Q.; Qi, X.; Ahmed, A.; et al. Important Food Sources of Fructose-Containing Sugars and Non-Alcoholic Fatty Liver Disease: A Systematic Review and Meta-Analysis of Controlled Trials. Nutrients 2022, 14, 2846. [Google Scholar] [CrossRef]
- Chiavaroli, L.; Cheung, A.; Ayoub-Charette, S.; Ahmed, A.; Lee, D.; Au-Yeung, F.; McGlynn, N.; Ha, V.; Khan, T.A.; Blanco Mejia, S.; et al. Important Food Sources of Fructose-Containing Sugars and Adiposity: A Systematic Review and Meta-Analysis of Controlled Feeding Trials. Curr. Dev. Nutr. 2021, 5, 1017. [Google Scholar] [CrossRef]
- Suen, J.; Thomas, J.; Kranz, A.; Vun, S.; Miller, M. Effect of Flavonoids on Oxidative Stress and Inflammation in Adults at Risk of Cardiovascular Disease: A Systematic Review. Healthcare 2016, 4, 69. [Google Scholar] [CrossRef]
- Amiot, M.J.; Riva, C.; Vinet, A. Effects of dietary polyphenols on metabolic syndrome features in humans: A systematic review. Obes. Rev. 2016, 17, 573–586. [Google Scholar] [CrossRef]
- Nakagawa, T.; Lanaspa, M.A.; Johnson, R.J. The effects of fruit consumption in patients with hyperuricaemia or gout. Rheumatology 2019, 58, 1133–1141. [Google Scholar] [CrossRef]
- Atkinson, F.S.; Brand-Miller, J.C.; Foster-Powell, K.; Buyken, A.E.; Goletzke, J. International tables of glycemic index and glycemic load values 2021: A systematic review. Am. J. Clin. Nutr. 2021, 114, 1625–1632. [Google Scholar] [CrossRef] [PubMed]
- Chiavaroli, L.; Lee, D.; Ahmed, A.; Cheung, A.; Khan, T.A.; Blanco, S.M.; Mirrahimi, A.; Jenkins, D.J.A.; Livesey, G.; Wolever, T.M.S.; et al. Effect of low glycaemic index or load dietary patterns on glycaemic control and cardiometabolic risk factors in diabetes: Systematic review and meta-analysis of randomised controlled trials. BMJ 2021, 374, n1651. [Google Scholar] [CrossRef] [PubMed]
- Colagiuri, S.; Dickinson, S.; Girgis, S.; Colagiuri, R. National Evidence Based Guideline for Blood Glucose Control in Type 2 Diabetes. Diabetes Australia and the NHMRC. Canberra. Available online: https://www.diabetesaustralia.com.au/wp-content/uploads/National-Evidence-Based-Guideline-for-Blood-Glucose-Control-in-Type-2-Diabetes.pdf2009 (accessed on 18 March 2020).
- Jenkins, D.J.; Kendall, C.W.; Augustin, L.S.; Mitchell, S.; Sahye-Pudaruth, S.; Blanco Mejia, S.; Chiavaroli, L.; Mirrahimi, A.; Ireland, C.; Bashyam, B.; et al. Effect of legumes as part of a low glycemic index diet on glycemic control and cardiovascular risk factors in type 2 diabetes mellitus: A randomized controlled trial. Arch. Intern. Med. 2012, 172, 1653–1660. [Google Scholar] [CrossRef]
- Slavin, J.L. Dietary fiber and body weight. Nutrition 2005, 21, 411–418. [Google Scholar] [CrossRef] [PubMed]
- Ludwig, D.S. Dietary glycemic index and obesity. J. Nutr. 2000, 130 (Suppl. S2), 280S–283S. [Google Scholar] [CrossRef] [PubMed]
- Viguiliouk, E.; Nishi, S.K.; Wolever, T.M.S.; Sievenpiper, J.L. Point: Glycemic Index—An Important but Oft misunderstood Marker of Carbohydrate Quality. Cereal Foods World 2018, 63, 158–164. [Google Scholar]
- Sievenpiper, J.L.; Dworatzek, P.D. Food and dietary pattern-based recommendations: An emerging approach to clinical practice guidelines for nutrition therapy in diabetes. Can. J. Diabetes 2013, 37, 51–57. [Google Scholar] [CrossRef]
- Afshin, A.; Sur, P.J.; Fay, K.A.; Cornaby, L.; Ferrara, G.; Salama, J.S.; Mullany, E.C.; Hassen, K.; Abbafati, A.C.; Murray, C.J.; et al. Health effects of dietary risks in 195 countries, 1990–2017: A systematic analysis for the Global Burden of Disease Study 2017. Lancet 2019, 393, 1958–1972. [Google Scholar] [CrossRef]
- Ahmed, M.; Praneet Ng, A.; L’Abbe, M.R. Nutrient intakes of Canadian adults: Results from the Canadian Community Health Survey (CCHS)-2015 Public Use Microdata File. Am. J. Clin. Nutr. 2021, 114, 1131–1140. [Google Scholar] [CrossRef]
- Lee, S.H.; Moore, L.V.; Park, S.; Harris, D.M.; Blanck, H.M. Adults Meeting Fruit and Vegetable Intake Recommendations—United States, 2019. MMWR Morb. Mortal. Wkly. Rep. 2022, 71, 1–9. [Google Scholar] [CrossRef]
- Brown, J.; Clarke, C.; Johnson Stoklossa, C.; Sievenpiper, J. Canadian Adult Obesity Clinical Practice Guidelines: Medical Nutrition Therapy in Obesity Management. Available online: https://obesitycanada.ca/guidelines/nutrition (accessed on 4 March 2022).
- Wharton, S.; Lau, D.C.W.; Vallis, M.; Sharma, A.M.; Biertho, L.; Campbell-Scherer, D.; Adamo, K.; Alberga, A.; Bell, R.; Boule, N.; et al. Obesity in adults: A clinical practice guideline. CMAJ 2020, 192, E875–E891. [Google Scholar] [CrossRef] [PubMed]
- Canadian Diabetes Association Clinical Practice Guidelines Expert Committee; Sievenpiper, J.L.; Chan, C.B.; Dworatzek, P.D.; Freeze, C.; Williams, S.L. Nutrition Therapy. Can. J. Diabetes 2018, 42 (Suppl. 1), S64–S79. [Google Scholar] [CrossRef]
- Anderson, T.J.; Gregoire, J.; Pearson, G.J.; Barry, A.R.; Couture, P.; Dawes, M.; Francis, G.A.; Genest, J., Jr.; Grover, S.; Gupta, M.; et al. 2016 Canadian Cardiovascular Society Guidelines for the Management of Dyslipidemia for the Prevention of Cardiovascular Disease in the Adult. Can. J. Cardiol. 2016, 32, 1263–1282. [Google Scholar] [CrossRef] [PubMed]
- Grundy, S.M.; Stone, N.J.; Bailey, A.L.; Beam, C.; Birtcher, K.K.; Blumenthal, R.S.; Braun, L.T.; de Ferranti, S.; Faiella-Tommasino, J.; Forman, D.E.; et al. 2018 AHA/ACC/AACVPR/AAPA/ABC/ACPM/ADA/AGS/APhA/ASPC/NLA/PCNA Guideline on the Management of Blood Cholesterol: A Report of the American College of Cardiology/American Heart Association Task Force on Clinical Practice Guidelines. Circulation 2019, 139, e1082–e1143. [Google Scholar] [CrossRef]
- Mach, F.; Baigent, C.; Catapano, A.L.; Koskinas, K.C.; Casula, M.; Badimon, L.; Chapman, M.J.; De Backer, G.G.; Delgado, V.; Ference, B.A.; et al. 2019 ESC/EAS Guidelines for the management of dyslipidaemias: Lipid modification to reduce cardiovascular risk. Eur. Heart J. 2020, 41, 111–188. [Google Scholar] [CrossRef] [PubMed]


| Trial Characteristics | Substitution Trials | Addition Trials | Subtraction Trials | Ad libitum Trials |
|---|---|---|---|---|
| Trials (N) | 39 | 45 | 4 | 3 |
| Participants (median n (range)) | 38 (21–267) | 40 (12–192) | 15 (12–120) | 40 (29–50) |
| Underlying disease status (N trials) | healthy mixed weight = 13, overweight or obese = 11, type 2 diabetes mellitus = 4, metabolic syndrome = 3, other = 8 | healthy mixed weight = 17, overweight or obese = 8, type 2 diabetes mellitus = 3, metabolic syndrome = 2, other = 15 | healthy mixed weight = 2, overweight or obese = 2 | healthy normal weight = 1, overweight or obese = 2 |
| Age (median years (range)) b | 46 (14–70) | 48 (8–72) | 27 (26–29) | 38 (32–39) |
| Sex ratio (% Male:Female) | 36:64 | 42:58 | 60:40 | 38:62 |
| Randomization (%) | 90 | 82 | 100 | 100 |
| Setting ratio (% N = IP:OP:IP + OP) | 0:97:3 | 0:100:0 | 0:100:0 | 0:100:0 |
| Country (N trials) | USA = 14, Iran = 5, Finland = 4, Brazil = 3, Greece = 3, Switzerland = 3, Sweden = 2, UK = 2, Poland = 2, Netherlands = 1 | USA = 10, Denmark = 6, Iran = 5, Spain = 4, Switzerland = 3, Thailand = 3, Brazil = 3, India = 2, Italy = 1, Canada = 2, Mexico = 2, Malaysia = 1, Norway = 1, Israel= 1, UK = 1 | USA = 2, Switzerland = 2 | Netherlands = 2, UK = 1 |
| Baseline CRP (median mg/L (range)) c | 2.2 (0.2–8.1) | 1.5 (0.2–55.5) | 2.2 (0.9–3.5) | 3.0 (1.0–3) |
| Baseline TNF-ɑ (median pg/mL (range)) d | 2.4 (1–6.8) | 5.4 (1.2–29.2) | Not reported | Not reported |
| Baseline IL-6 (median pg/mL (range)) e | 2.0 (0.8–27.4) | 3.1 (0.6–16.4) | Not reported | Not reported |
| Fructose-containing sugars dose (median %E (range)) | 9 (1–45) | 8 (1–35) | 15 (15–15) | 19 (6–19) |
| Study design (%; crossover:parallel) | 38:62 | 38:62 | 0:100 | 33:67 |
| Feeding control (%; met:supp:DA:met,supp:supp,DA) | 2.5:77:2.5:18 | 0:96:2:2 | 0:100:0:0 | 0:100:0:0 |
| Follow-up duration (median weeks (range)) | 6 (1–24) | 5 (1–24) | 30 (12–48) | 24 (8–24) |
| Fructose-containing sugars type (N trials) | fructose = 8, sucrose = 6, honey =1, fruit = 14, HFCS = 3, mixed type = 7 | fructose = 3, sucrose = 13, honey = 3, fruit = 25, mixed type = 1 | sucrose = 2, HFCS = 2 | sucrose = 1, mixed type = 2 |
| Comparator (N trials) | mixed = 13, glucose = 12, starch = 4, fat = 4, lactose = 3, maltodextrin = 2, protein= 1 | diet alone= 31, non-nutritive sweetener = 5, other = 5, water = 4 | non-nutritive sweetener = 3, water = 1 | mixed = 2, non-nutritive sweetener = 1 |
| Food sources of fructose-containing sugars (N trials) | SSB = 10, sweetened dairy = 3, sweetened dairy alternative (soy) = 1, 100% fruit juice = 2, fruit = 6, dried fruit = 5, mixed fruit forms = 1, added nutritive (caloric) sweeteners = 1, mixed sources (with SSBs) = 6, mixed sources (without SSBs) = 4 | SSB = 11, sweetened dairy = 2, 100% fruit juice = 13, fruit = 9, dried fruit = 3, sweetened cereal grains and bars = 1, sweets and desserts = 3, added nutritive sweeteners = 3 | SSB = 4 | mixed sources = 3 |
| Funding sources ratio (% n = A:I:A,I:NR) | 41:23:33:3 | 45:11:39:5 | 50:0:50:0 | 67:33:0:0 |
Publisher’s Note: MDPI stays neutral with regard to jurisdictional claims in published maps and institutional affiliations. |
© 2022 by the authors. Licensee MDPI, Basel, Switzerland. This article is an open access article distributed under the terms and conditions of the Creative Commons Attribution (CC BY) license (https://creativecommons.org/licenses/by/4.0/).
Share and Cite
Qi, X.; Chiavaroli, L.; Lee, D.; Ayoub-Charette, S.; Khan, T.A.; Au-Yeung, F.; Ahmed, A.; Cheung, A.; Liu, Q.; Blanco Mejia, S.; et al. Effect of Important Food Sources of Fructose-Containing Sugars on Inflammatory Biomarkers: A Systematic Review and Meta-Analysis of Controlled Feeding Trials. Nutrients 2022, 14, 3986. https://doi.org/10.3390/nu14193986
Qi X, Chiavaroli L, Lee D, Ayoub-Charette S, Khan TA, Au-Yeung F, Ahmed A, Cheung A, Liu Q, Blanco Mejia S, et al. Effect of Important Food Sources of Fructose-Containing Sugars on Inflammatory Biomarkers: A Systematic Review and Meta-Analysis of Controlled Feeding Trials. Nutrients. 2022; 14(19):3986. https://doi.org/10.3390/nu14193986
Chicago/Turabian StyleQi, XinYe, Laura Chiavaroli, Danielle Lee, Sabrina Ayoub-Charette, Tauseef A. Khan, Fei Au-Yeung, Amna Ahmed, Annette Cheung, Qi Liu, Sonia Blanco Mejia, and et al. 2022. "Effect of Important Food Sources of Fructose-Containing Sugars on Inflammatory Biomarkers: A Systematic Review and Meta-Analysis of Controlled Feeding Trials" Nutrients 14, no. 19: 3986. https://doi.org/10.3390/nu14193986
APA StyleQi, X., Chiavaroli, L., Lee, D., Ayoub-Charette, S., Khan, T. A., Au-Yeung, F., Ahmed, A., Cheung, A., Liu, Q., Blanco Mejia, S., Choo, V. L., de Souza, R. J., Wolever, T. M. S., Leiter, L. A., Kendall, C. W. C., Jenkins, D. J. A., & Sievenpiper, J. L. (2022). Effect of Important Food Sources of Fructose-Containing Sugars on Inflammatory Biomarkers: A Systematic Review and Meta-Analysis of Controlled Feeding Trials. Nutrients, 14(19), 3986. https://doi.org/10.3390/nu14193986