
Higher HEI-2015 Scores Are Associated with Lower Risk of Sleep Disorder: Results from a Nationally Representative Survey of United States Adults


Abstract
:1. Introduction
2. Materials and Methods
2.1. Data Source
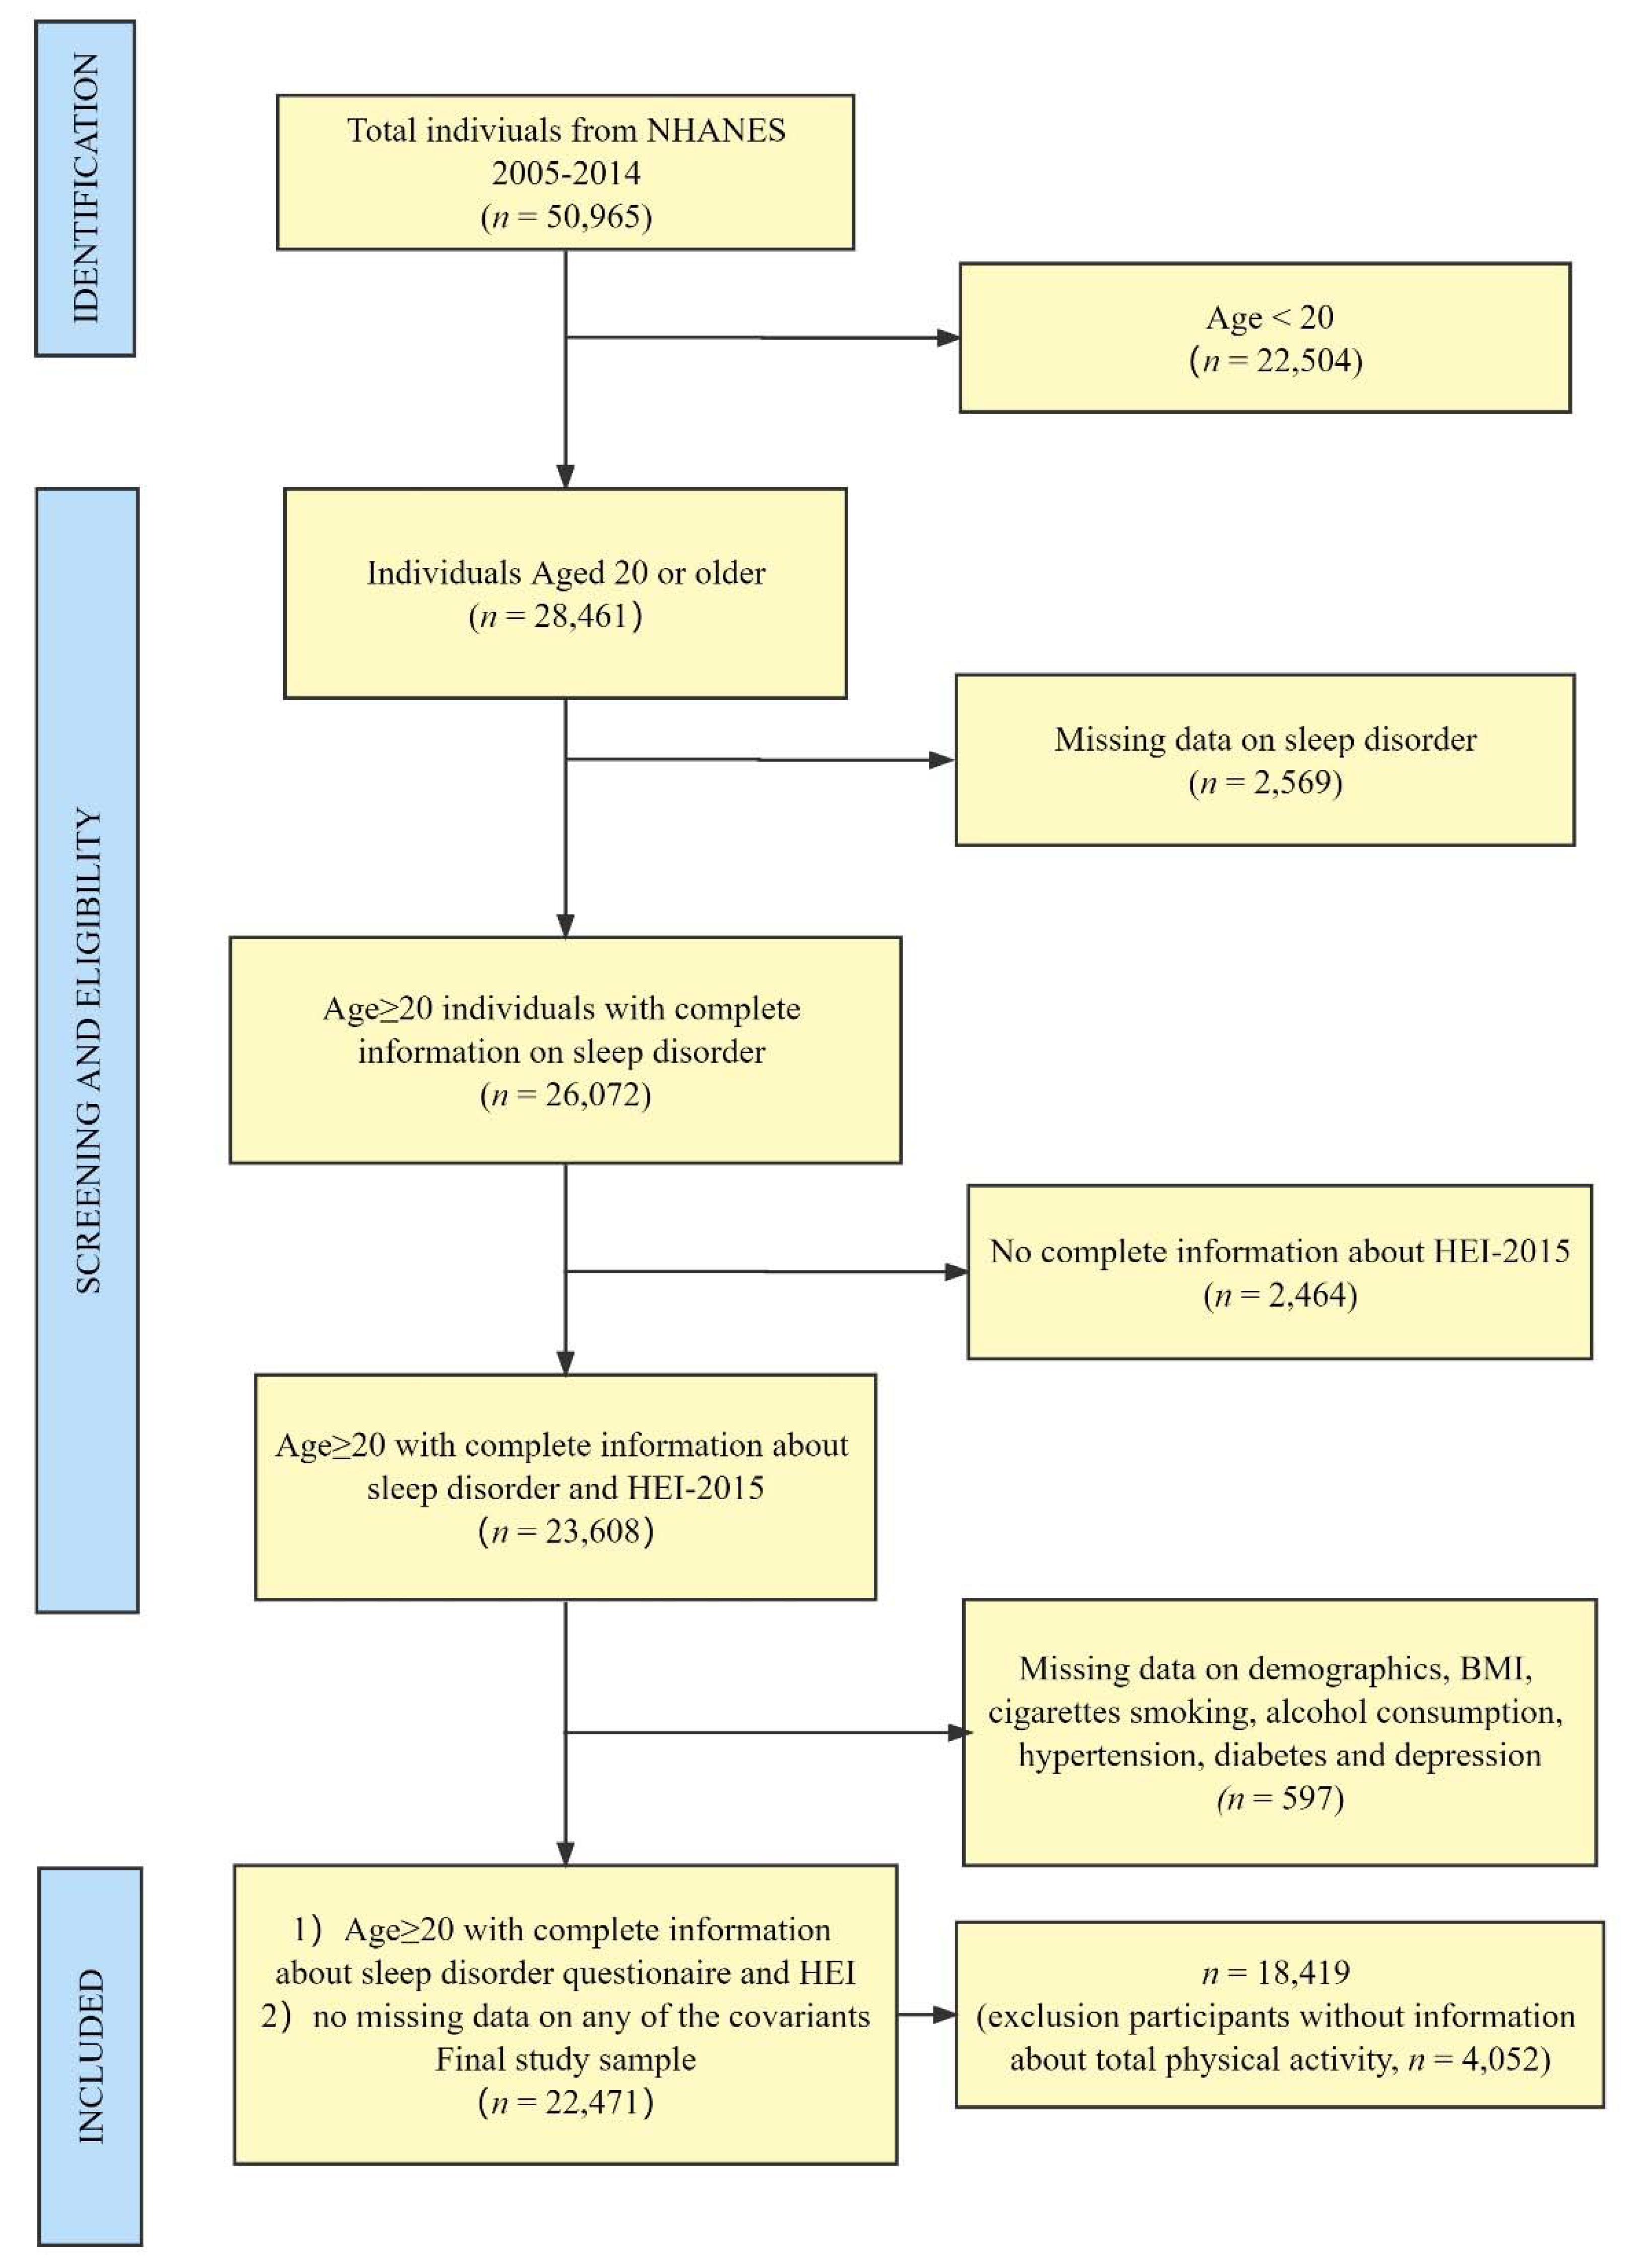
2.2. Participants
2.3. Measures
2.3.1. Sleep Disorder
2.3.2. Healthy Eating Index 2015
2.4. Covariates
2.5. Statistical Analysis
3. Results
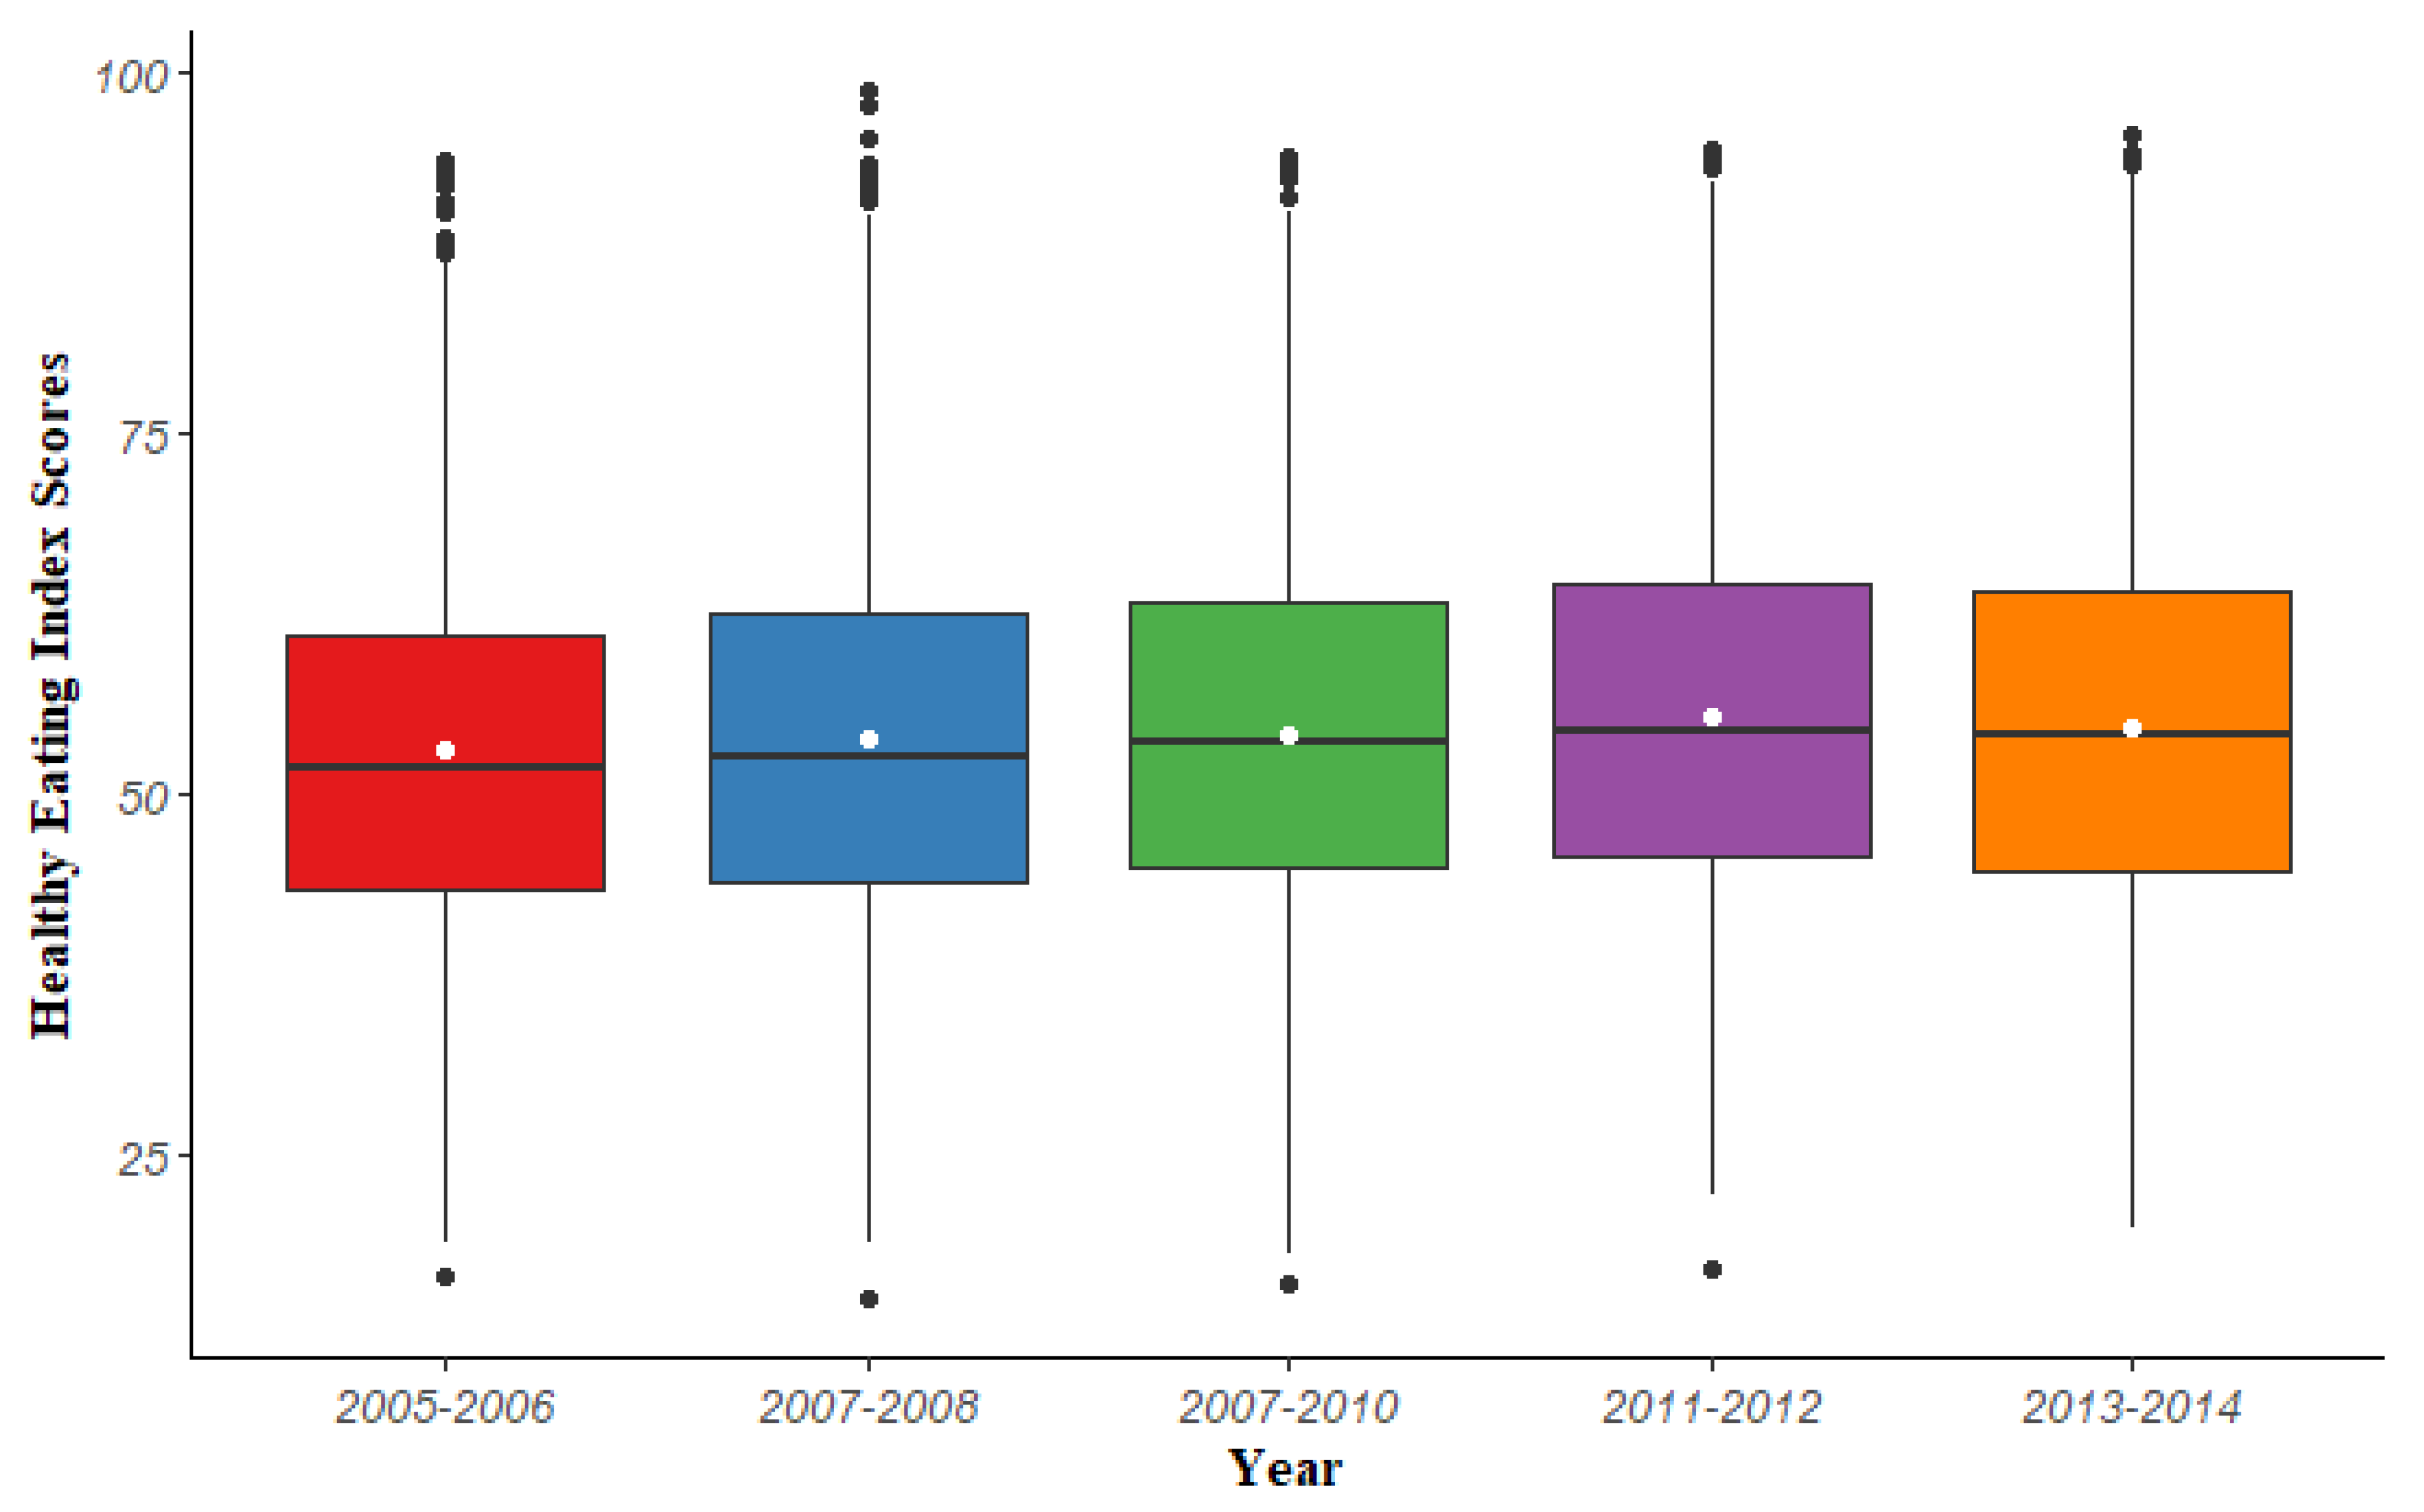
3.1. Descriptive Analysis
3.2. Logistic Regression Models to Assess the Association between HEI-2015 Total Scores and Sleep Disorder
3.3. WQS Regression Model to Assess the Association between HEI-2015 Components and Sleep Disorder
4. Discussion
Supplementary Materials
Author Contributions
Funding
Institutional Review Board Statement
Informed Consent Statement
Data Availability Statement
Conflicts of Interest
References
- Pavlova, M.K.; Latreille, V. Sleep Disorders. Am. J. Med. 2019, 132, 292–299. [Google Scholar] [CrossRef] [PubMed]
- Arnardottir, E.S.; Bjornsdottir, E.; Olafsdottir, K.A.; Benediktsdottir, B.; Gislason, T. Obstructive sleep apnoea in the general population: Highly prevalent but minimal symptoms. Eur. Respir. J. 2016, 47, 194–202. [Google Scholar] [CrossRef] [PubMed]
- Heinzer, R.; Vat, S.; Marques-Vidal, P.; Marti-Soler, H.; Andries, D.; Tobback, N.; Mooser, V.; Preisig, M.; Malhotra, A.; Waeber, G.; et al. Prevalence of sleep-disordered breathing in the general population: The HypnoLaus study. Lancet Respir. Med. 2015, 3, 310–318. [Google Scholar] [CrossRef] [Green Version]
- Piccolo, R.S.; Yang, M.; Bliwise, D.L.; Yaggi, H.K.; Araujo, A.B. Racial and socioeconomic disparities in sleep and chronic disease: Results of a longitudinal investigation. Ethn. Dis. 2013, 23, 499–507. [Google Scholar] [PubMed]
- Redline, S.; Foody, J. Sleep disturbances: Time to join the top 10 potentially modifiable cardiovascular risk factors? Circulation 2011, 124, 2049–2051. [Google Scholar] [CrossRef] [Green Version]
- Grandner, M.A.; Hale, L.; Moore, M.; Patel, N.P. Mortality associated with short sleep duration: The evidence, the possible mechanisms, and the future. Sleep Med. Rev. 2010, 14, 191–203. [Google Scholar] [CrossRef] [Green Version]
- Huyett, P.; Siegel, N.; Bhattacharyya, N. Prevalence of Sleep Disorders and Association With Mortality: Results From the NHANES 2009–2010. Laryngoscope 2021, 131, 686–689. [Google Scholar] [CrossRef]
- Kripke, D.F.; Garfinkel, L.; Wingard, D.L.; Klauber, M.R.; Marler, M.R. Mortality associated with sleep duration and insomnia. Arch. Gen. Psychiatry 2002, 59, 131–136. [Google Scholar] [CrossRef] [Green Version]
- Silva, G.E.; An, M.W.; Goodwin, J.L.; Shahar, E.; Redline, S.; Resnick, H.; Baldwin, C.M.; Quan, S.F. Longitudinal evaluation of sleep-disordered breathing and sleep symptoms with change in quality of life: The Sleep Heart Health Study (SHHS). Sleep 2009, 32, 1049–1057. [Google Scholar] [CrossRef] [Green Version]
- Grandner, M.A.; Kripke, D.F.; Naidoo, N.; Langer, R.D. Relationships among dietary nutrients and subjective sleep, objective sleep, and napping in women. Sleep Med. 2010, 11, 180–184. [Google Scholar] [CrossRef] [Green Version]
- Gao, Q.; Kou, T.; Zhuang, B.; Ren, Y.; Dong, X.; Wang, Q. The Association between Vitamin D Deficiency and Sleep Disorders: A Systematic Review and Meta-Analysis. Nutrients 2018, 10, 1395. [Google Scholar] [CrossRef] [PubMed] [Green Version]
- Grandner, M.A.; Jackson, N.; Gerstner, J.R.; Knutson, K.L. Dietary nutrients associated with short and long sleep duration. Data from a nationally representative sample. Appetite 2013, 64, 71–80. [Google Scholar] [CrossRef] [PubMed] [Green Version]
- Binks, H.; Vincent, G.E.; Gupta, C.; Irwin, C.; Khalesi, S. Effects of Diet on Sleep: A Narrative Review. Nutrients 2020, 12, 936. [Google Scholar] [CrossRef] [PubMed] [Green Version]
- van Egmond, L.; Tan, X.; Sjögren, P.; Cederholm, T.; Benedict, C. Association between Healthy Dietary Patterns and Self-Reported Sleep Disturbances in Older Men: The ULSAM Study. Nutrients 2019, 11, 1029. [Google Scholar] [CrossRef] [Green Version]
- Kase, B.E.; Liu, J.; Wirth, M.D.; Shivappa, N.; Hebert, J.R. Associations between dietary inflammatory index and sleep problems among adults in the United States, NHANES 2005–2016. Sleep Health 2021, 7, 273–280. [Google Scholar] [CrossRef]
- Godos, J.; Grosso, G.; Castellano, S.; Galvano, F.; Caraci, F.; Ferri, R. Association between diet and sleep quality: A systematic review. Sleep Med. Rev. 2021, 57, 101430. [Google Scholar] [CrossRef]
- Kirkpatrick, S.I.; Reedy, J.; Krebs-Smith, S.M.; Pannucci, T.E.; Subar, A.F.; Wilson, M.M.; Lerman, J.L.; Tooze, J.A. Applications of the Healthy Eating Index for Surveillance, Epidemiology, and Intervention Research: Considerations and Caveats. J. Acad. Nutr. Diet. 2018, 118, 1603–1621. [Google Scholar] [CrossRef]
- Panizza, C.E.; Shvetsov, Y.B.; Harmon, B.E.; Wilkens, L.R.; Le Marchand, L.; Haiman, C.; Reedy, J.; Boushey, C.J. Testing the Predictive Validity of the Healthy Eating Index-2015 in the Multiethnic Cohort: Is the Score Associated with a Reduced Risk of All-Cause and Cause-Specific Mortality? Nutrients 2018, 10, 452. [Google Scholar] [CrossRef] [Green Version]
- Reedy, J.; Lerman, J.L.; Krebs-Smith, S.M.; Kirkpatrick, S.I.; Pannucci, T.E.; Wilson, M.M.; Subar, A.F.; Kahle, L.L.; Tooze, J.A. Evaluation of the Healthy Eating Index-2015. J. Acad. Nutr. Diet. 2018, 118, 1622–1633. [Google Scholar] [CrossRef]
- Jansen, E.C.; Prather, A.; Leung, C.W. Associations between sleep duration and dietary quality: Results from a nationally-representative survey of US adults. Appetite 2020, 153, 104748. [Google Scholar] [CrossRef]
- Hu, E.A.; Steffen, L.M.; Coresh, J.; Appel, L.J.; Rebholz, C.M. Adherence to the Healthy Eating Index-2015 and Other Dietary Patterns May Reduce Risk of Cardiovascular Disease, Cardiovascular Mortality, and All-Cause Mortality. J. Nutr. 2020, 150, 312–321. [Google Scholar] [CrossRef] [PubMed]
- Fan, Y.; Zhang, Y.; Li, J.; Liu, Y.; Chang, H.; Jiang, Y.; Tuo, X.; Zhou, L.; Yu, Y. Association between healthy eating index-2015 and various cognitive domains in US adults aged 60 years or older: The National Health and Nutrition Examination Survey (NHANES) 2011–2014. BMC Public Health 2021, 21, 1862. [Google Scholar] [CrossRef] [PubMed]
- Krebs-Smith, S.M.; Pannucci, T.E.; Subar, A.F.; Kirkpatrick, S.I.; Lerman, J.L.; Tooze, J.A.; Wilson, M.M.; Reedy, J. Update of the Healthy Eating Index: HEI-2015. J. Acad. Nutr. Diet. 2018, 118, 1591–1602. [Google Scholar] [CrossRef] [PubMed] [Green Version]
- SSY, A.L.; Natto, Z.S.; Midle, J.B.; Gyurko, R.; O’Neill, R.; Steffensen, B. Association between time since quitting smoking and periodontitis in former smokers in the National Health and Nutrition Examination Surveys (NHANES) 2009 to 2012. J. Periodontol. 2019, 90, 16–25. [Google Scholar] [CrossRef] [Green Version]
- Gay, I.C.; Tran, D.T.; Paquette, D.W. Alcohol intake and periodontitis in adults aged ≥30 years: NHANES 2009-2012. J. Periodontol. 2018, 89, 625–634. [Google Scholar] [CrossRef] [PubMed]
- Soares, M.J.; Macedo, A.; Bos, S.C.; Maia, B.; Marques, M.; Pereira, A.T.; Gomes, A.A.; Valente, J.; Nogueira, V.; Azevedo, M.H. Sleep disturbances, body mass index and eating behaviour in undergraduate students. J. Sleep Res. 2011, 20, 479–486. [Google Scholar] [CrossRef] [PubMed]
- Leigh, L.; Hudson, I.L.; Byles, J.E. Sleep Difficulty and Disease in a Cohort of Very Old Women. J. Aging Health 2016, 28, 1090–1104. [Google Scholar] [CrossRef]
- Moon, C.; Hagen, E.W.; Johnson, H.M.; Brown, R.L.; Peppard, P.E. Longitudinal sleep characteristics and hypertension status: Results from the Wisconsin Sleep Cohort Study. J. Hypertens. 2021, 39, 683–691. [Google Scholar] [CrossRef]
- Li, Y.; Gao, X.; Winkelman, J.W.; Cespedes, E.M.; Jackson, C.L.; Walters, A.S.; Schernhammer, E.; Redline, S.; Hu, F.B. Association between sleeping difficulty and type 2 diabetes in women. Diabetologia 2016, 59, 719–727. [Google Scholar] [CrossRef] [Green Version]
- Kroenke, K.; Spitzer, R.L.; Williams, J.B. The PHQ-9: Validity of a brief depression severity measure. J. Gen. Intern. Med. 2001, 16, 606–613. [Google Scholar] [CrossRef]
- Fang, H.; Tu, S.; Sheng, J.; Shao, A. Depression in sleep disturbance: A review on a bidirectional relationship, mechanisms and treatment. J. Cell. Mol. Med. 2019, 23, 2324–2332. [Google Scholar] [CrossRef] [PubMed] [Green Version]
- Sadat, S.; Salehi-Sahlabadi, A.; Pourmasoumi, M.; Feizi, A.; Clark, C.C.T.; Akkasheh, G.; Ghiasvand, R. A healthy dietary pattern may be associated with primary insomnia among Iranian adults: A case-control study. Int. J. Vitam. Nutr. Res. 2021, 91, 479–490. [Google Scholar] [CrossRef] [PubMed]
- Mondin, T.C.; Stuart, A.L.; Williams, L.J.; Jacka, F.N.; Pasco, J.A.; Ruusunen, A. Diet quality, dietary patterns and short sleep duration: A cross-sectional population-based study. Eur. J. Nutr. 2019, 58, 641–651. [Google Scholar] [CrossRef] [PubMed]
- Castro-Diehl, C.; Wood, A.C.; Redline, S.; Reid, M.; Johnson, D.A.; Maras, J.E.; Jacobs, D.R., Jr.; Shea, S.; Crawford, A.; St-Onge, M.P. Mediterranean diet pattern and sleep duration and insomnia symptoms in the Multi-Ethnic Study of Atherosclerosis. Sleep 2018, 41, zsy158. [Google Scholar] [CrossRef]
- Reid, M.; Maras, J.E.; Shea, S.; Wood, A.C.; Castro-Diehl, C.; Johnson, D.A.; Huang, T.; Jacobs, D.R., Jr.; Crawford, A.; St-Onge, M.P.; et al. Association between diet quality and sleep apnea in the Multi-Ethnic Study of Atherosclerosis. Sleep 2019, 42, zsy194. [Google Scholar] [CrossRef]
- Edwards, B.A.; Bristow, C.; O’Driscoll, D.M.; Wong, A.M.; Ghazi, L.; Davidson, Z.E.; Young, A.; Truby, H.; Haines, T.P.; Hamilton, G.S. Assessing the impact of diet, exercise and the combination of the two as a treatment for OSA: A systematic review and meta-analysis. Respirology 2019, 24, 740–751. [Google Scholar] [CrossRef]
- Zuraikat, F.M.; Makarem, N.; Liao, M.; St-Onge, M.P.; Aggarwal, B. Measures of Poor Sleep Quality Are Associated With Higher Energy Intake and Poor Diet Quality in a Diverse Sample of Women From the Go Red for Women Strategically Focused Research Network. J. Am. Heart Assoc. 2020, 9, e014587. [Google Scholar] [CrossRef]
- Vernia, F.; Di Ruscio, M.; Ciccone, A.; Viscido, A.; Frieri, G.; Stefanelli, G.; Latella, G. Sleep disorders related to nutrition and digestive diseases: A neglected clinical condition. Int. J. Med. Sci. 2021, 18, 593–603. [Google Scholar] [CrossRef]
- Chaput, J.P. Sleep patterns, diet quality and energy balance. Physiol. Behav. 2014, 134, 86–91. [Google Scholar] [CrossRef]
- Schmid, S.M.; Hallschmid, M.; Schultes, B. The metabolic burden of sleep loss. Lancet Diabetes Endocrinol. 2015, 3, 52–62. [Google Scholar] [CrossRef]
- Haghighatdoost, F.; Karimi, G.; Esmaillzadeh, A.; Azadbakht, L. Sleep deprivation is associated with lower diet quality indices and higher rate of general and central obesity among young female students in Iran. Nutrition 2012, 28, 1146–1150. [Google Scholar] [CrossRef] [PubMed]
- Gaona-Pineda, E.B.; Martinez-Tapia, B.; Rodríguez-Ramírez, S.; Guerrero-Zúñiga, S.; Perez-Padilla, R.; Shamah-Levy, T. Dietary patterns and sleep disorders in Mexican adults from a National Health and Nutrition Survey. J. Nutr. Sci. 2021, 10, e34. [Google Scholar] [CrossRef] [PubMed]
- Zhou, X.; Bi, B.; Zheng, L.; Li, Z.; Yang, H.; Song, H.; Sun, Y. The prevalence and risk factors for depression symptoms in a rural Chinese sample population. PLoS ONE 2014, 9, e99692. [Google Scholar] [CrossRef] [PubMed] [Green Version]
- Peuhkuri, K.; Sihvola, N.; Korpela, R. Diet promotes sleep duration and quality. Nutr. Res. 2012, 32, 309–319. [Google Scholar] [CrossRef]
- Zhao, M.; Tuo, H.; Wang, S.; Zhao, L. The Effects of Dietary Nutrition on Sleep and Sleep Disorders. Mediat. Inflamm. 2020, 2020, 3142874. [Google Scholar] [CrossRef] [PubMed]
- Asghari, G.; Mirmiran, P.; Yuzbashian, E.; Azizi, F. A systematic review of diet quality indices in relation to obesity. Br. J. Nutr. 2017, 117, 1055–1065. [Google Scholar] [CrossRef] [Green Version]
- Chaudhary, N.S.; Grandner, M.A.; Jackson, N.J.; Chakravorty, S. Caffeine consumption, insomnia, and sleep duration: Results from a nationally representative sample. Nutrition 2016, 32, 1193–1199. [Google Scholar] [CrossRef]
- Hang, D.; Kværner, A.S.; Ma, W.; Hu, Y.; Tabung, F.K.; Nan, H.; Hu, Z.; Shen, H.; Mucci, L.A.; Chan, A.T.; et al. Coffee consumption and plasma biomarkers of metabolic and inflammatory pathways in US health professionals. Am. J. Clin. Nutr. 2019, 109, 635–647. [Google Scholar] [CrossRef]
- Irwin, M.R.; Olmstead, R.; Carroll, J.E. Sleep Disturbance, Sleep Duration, and Inflammation: A Systematic Review and Meta-Analysis of Cohort Studies and Experimental Sleep Deprivation. Biol. Psychiatry 2016, 80, 40–52. [Google Scholar] [CrossRef] [Green Version]


| Characteristics | 2005–2006 (n = 4046) | 2007–2008 (n = 4661) | 2009–2010 (n = 5010) | 2011–2012 (n = 4291) | 2013–2014 (n = 4463) | χ2 | p Value |
|---|---|---|---|---|---|---|---|
| Sleep disorder (No. Weighted%) | 286 (7.50%) | 384 (8.05%) | 395 (7.65%) | 382 (9.24%) | 462 (10.41%) | 5.48 | <0.001 |
| HEI Category (No. Weighted%) | 3.64 | 0.003 | |||||
| Inadequate | 1042 (27.28%) | 1145 (26.29%) | 1179 (23.22%) | 942 (21.76%) | 1093 (24.73%) | ||
| Average | 2129 (51.63%) | 2373 (50.08%) | 2610 (51.38%) | 2158 (50.36%) | 2149 (47.90%) | ||
| Optimal | 875 (21.09%) | 1143 (23.63%) | 1221 (25.40%) | 1191 (27.88%) | 1221 (27.37%) |
| Characteristics | Adults without Sleep Disorder | Adults With Sleep Disorder | χ2 | p Value |
|---|---|---|---|---|
| HEI Category (No. Weighted%) | 4.02 | 0.019 | ||
| Inadequate | 4881 (90.60%) | 520 (9.40%) | ||
| Average | 10467 (91.29%) | 952 (8.71%) | ||
| Optimal | 5214 (92.44%) | 437 (7.56%) | ||
| Age Group (No. Weighted%) | 56.40 | <0.001 | ||
| 20–39 | 6800 (95.10%) | 342 (4.90%) | ||
| 40–59 | 6766 (89.67%) | 785 (10.33%) | ||
| 60+ | 6996 (89.39%) | 782 (10.61%) | ||
| Gender (No. Weighted%) | 5.89 | 0.018 | ||
| Female | 10841 (91.97%) | 938 (8.03%) | ||
| Male | 9721 (90.79%) | 971 (9.21%) | ||
| Race (No. Weighted%) | 19.97 | <0.001 | ||
| Non-Hispanic White | 9504 (90.71%) | 1040 (9.29%) | ||
| Mexican American | 3260 (95.39%) | 175 (4.61%) | ||
| Non-Hispanic Black | 4347 (91.43%) | 417 (8.57%) | ||
| Other | 3451 (93.00%) | 277 (7.00%) | ||
| Education Level (No. Weighted%) | 2.89 | 0.045 | ||
| <High School | 5141 (92.20%) | 428 (7.80%) | ||
| High school /GED | 4711 (90.72%) | 461 (9.28%) | ||
| College/AA degree | 5966 (90.77%) | 615 (9.23%) | ||
| College or above | 4744 (92.20%) | 405 (7.80%) | ||
| Family Income (No. Weighted%) | 3.47 | 0.035 | ||
| 0~130% FPL | 5807 (90.12%) | 636 (9.88%) | ||
| 130%~350% FPL | 7108 (91.54%) | 626 (8.46%) | ||
| 350% FPL | 7647 (91.85%) | 647 (8.15%) | ||
| Smoke Status (No. Weighted%) | 27.61 | <0.001 | ||
| Never Smoker | 11450 (92.91%) | 843 (7.09%) | ||
| Former Smoker | 5031 (89.26%) | 605 (10.74%) | ||
| Current Smoker | 4081 (89.99%) | 461 (10.01%) | ||
| Drink Level (No. Weighted%) | 16.11 | <0.001 | ||
| None | 6377 (89.54%) | 700 (10.46%) | ||
| Light | 5883 (90.47%) | 598 (9.53%) | ||
| Moderate | 6566 (93.26%) | 476 (6.74%) | ||
| Heavy | 1736 (92.43%) | 135 (7.57%) | ||
| Caffeine Category (No. Weighted%) | 4.08 | 0.019 | ||
| <Q1 | 6310 (91.72%) | 524 (8.28%) | ||
| Q1~Q3 | 10556 (91.85%) | 928 (8.15%) | ||
| >Q3 | 3696 (90.19%) | 457 (9.81%) | ||
| BMI Category (No. Weighted%) | 80.31 | <0.001 | ||
| Normal Weight | 5655 (95.60%) | 256 (4.40%) | ||
| Underweight | 337 (94.46%) | 12 (5.54%) | ||
| Overweight | 6981 (93.93%) | 453 (6.07%) | ||
| Obese | 7589 (85.88%) | 1188 (14.12%) | ||
| Hypertension (No. Weighted%) | 196.81 | <0.001 | ||
| No | 13595 (93.88%) | 825 (6.12%) | ||
| Yes | 6967 (86.12%) | 1084 (13.88%) | ||
| Diabetes (No. Weighted%) | 157.57 | <0.001 | ||
| No | 18299 (92.43%) | 1449 (7.57%) | ||
| Yes | 2263 (81.09%) | 460 (18.91%) | ||
| Depression (No. Weighted%) | 183.08 | <0.001 | ||
| No | 17831 (92.71%) | 1341 (7.29%) | ||
| Yes | 2731 (82.41%) | 568 (17.59%) |
| Characteristics | OR (95% CI) | |||
|---|---|---|---|---|
| Crude Model | Model I | Model II | Model III | |
| HEI Category (reference, Inadequate) | ||||
| Average | 0.920 (0.919,0.921) | 0.875 (0.874,0.876) | 0.907 (0.906,0.909) | 0.961 (0.959,0.962) |
| Optimal | 0.789 (0.787,0.790) | 0.720 (0.719,0.721) | 0.771 (0.770,0.772) | 0.913 (0.912,0.915) |
| Age Group (reference, 20–39) | ||||
| 40–59 | 2.365 (2.361,2.368) | 2.255 (2.252,2.258) | 1.706 (1.704,1.709) | |
| 60+ | 2.460 (2.456,2.463) | 2.192 (2.188,2.195) | 1.468 (1.465,1.470) | |
| Sex (reference, Female) | ||||
| Male | 1.185 (1.183,1.186) | 1.227 (1.226,1.229) | 1.344 (1.342,1.346) | |
| Race (reference, Non-Hispanic White) | ||||
| Mexican American | 0.529 (0.528,0.530) | 0.549 (0.548,0.551) | 0.546 (0.545,0.548) | |
| Non-Hispanic Black | 0.915 (0.913,0.917) | 0.903 (0.901,0.904) | 0.728 (0.726,0.729) | |
| Other | 0.827 (0.825,0.828) | 0.812 (0.811,0.814) | 0.809 (0.808,0.811) | |
| Education Level (reference, <High School) | ||||
| High school /GED equivalent | 1.202 (1.199,1.204) | 1.256 (1.254,1.259) | 1.360 (1.358,1.363) | |
| College/AA degree | 1.319 (1.317,1.321) | 1.416 (1.414,1.419) | 1.522 (1.520,1.525) | |
| College or above | 1.143 (1.140,1.145) | 1.331 (1.328,1.333) | 1.682 (1.679,1.686) | |
| Family Income (reference, 0~130% FPL) | ||||
| 130%~350% FPL | 0.715 (0.714,0.716) | 0.744 (0.743,0.745) | 0.841 (0.84,0.842) | |
| 350% FPL | 0.645 (0.644,0.646) | 0.705 (0.704,0.706) | 0.871 (0.87,0.873) | |
| Smoke Status (reference, Never Smoker) | ||||
| Former Smoker | 1.437 (1.435,1.439) | 1.346 (1.345,1.348) | ||
| Current Smoker | 1.439 (1.436,1.441) | 1.509 (1.507,1.511) | ||
| Drink Level (reference, None) | ||||
| Light | 0.955 (0.953,0.956) | 0.991 (0.990,0.993) | ||
| Moderate | 0.617 (0.616,0.618) | 0.752 (0.751,0.754) | ||
| Heavy | 0.754 (0.753,0.756) | 0.411 (0.41,0.412) | ||
| Caffeine Category (reference, <Q1) | ||||
| Q1~Q3 | 0.900 (0.899,0.901) | 0.901 (0.900,0.902) | ||
| >Q3 | 0.886 (0.884,0.887) | 0.865 (0.864,0.867) | ||
| BMI Category (reference, Normal Weight) | ||||
| Underweight | 1.254 (1.248,1.261) | |||
| Overweight | 1.241 (1.239,1.243) | |||
| Obese | 2.733 (2.728,2.737) | |||
| Hypertension (reference, No) | ||||
| Yes | 1.605 (1.603,1.607) | |||
| Diabetes (reference, No) | ||||
| Yes | 1.616 (1.613,1.618) | |||
| Depression (reference, No) | ||||
| Yes | 3.365 (3.360,3.370) | |||
| Model | OR | 95% CI | p Value |
|---|---|---|---|
| Model I | 0.963 | (0.951,0.975) | <0.001 |
| Model II | 0.974 | (0.961,0.986) | <0.001 |
| Model III | 0.977 | (0.964,0.990) | <0.001 |
Publisher’s Note: MDPI stays neutral with regard to jurisdictional claims in published maps and institutional affiliations. |
© 2022 by the authors. Licensee MDPI, Basel, Switzerland. This article is an open access article distributed under the terms and conditions of the Creative Commons Attribution (CC BY) license (https://creativecommons.org/licenses/by/4.0/).
Share and Cite
Deng, M.-G.; Nie, J.-Q.; Li, Y.-Y.; Yu, X.; Zhang, Z.-J. Higher HEI-2015 Scores Are Associated with Lower Risk of Sleep Disorder: Results from a Nationally Representative Survey of United States Adults. Nutrients 2022, 14, 873. https://doi.org/10.3390/nu14040873
Deng M-G, Nie J-Q, Li Y-Y, Yu X, Zhang Z-J. Higher HEI-2015 Scores Are Associated with Lower Risk of Sleep Disorder: Results from a Nationally Representative Survey of United States Adults. Nutrients. 2022; 14(4):873. https://doi.org/10.3390/nu14040873
Chicago/Turabian StyleDeng, Ming-Gang, Jia-Qi Nie, Yuan-Yuan Li, Xue Yu, and Zhi-Jiang Zhang. 2022. "Higher HEI-2015 Scores Are Associated with Lower Risk of Sleep Disorder: Results from a Nationally Representative Survey of United States Adults" Nutrients 14, no. 4: 873. https://doi.org/10.3390/nu14040873