
Serum Levels of Plasmalogens and Fatty Acid Metabolites Associate with Retinal Microangiopathy in Participants from the Finnish Diabetes Prevention Study

 ,
, 
 and
and 
Abstract
:1. Introduction
2. Materials and Methods
2.1. Participants and Study Design
2.2. Biochemical Analyses
2.3. Statistical Methods
3. Results
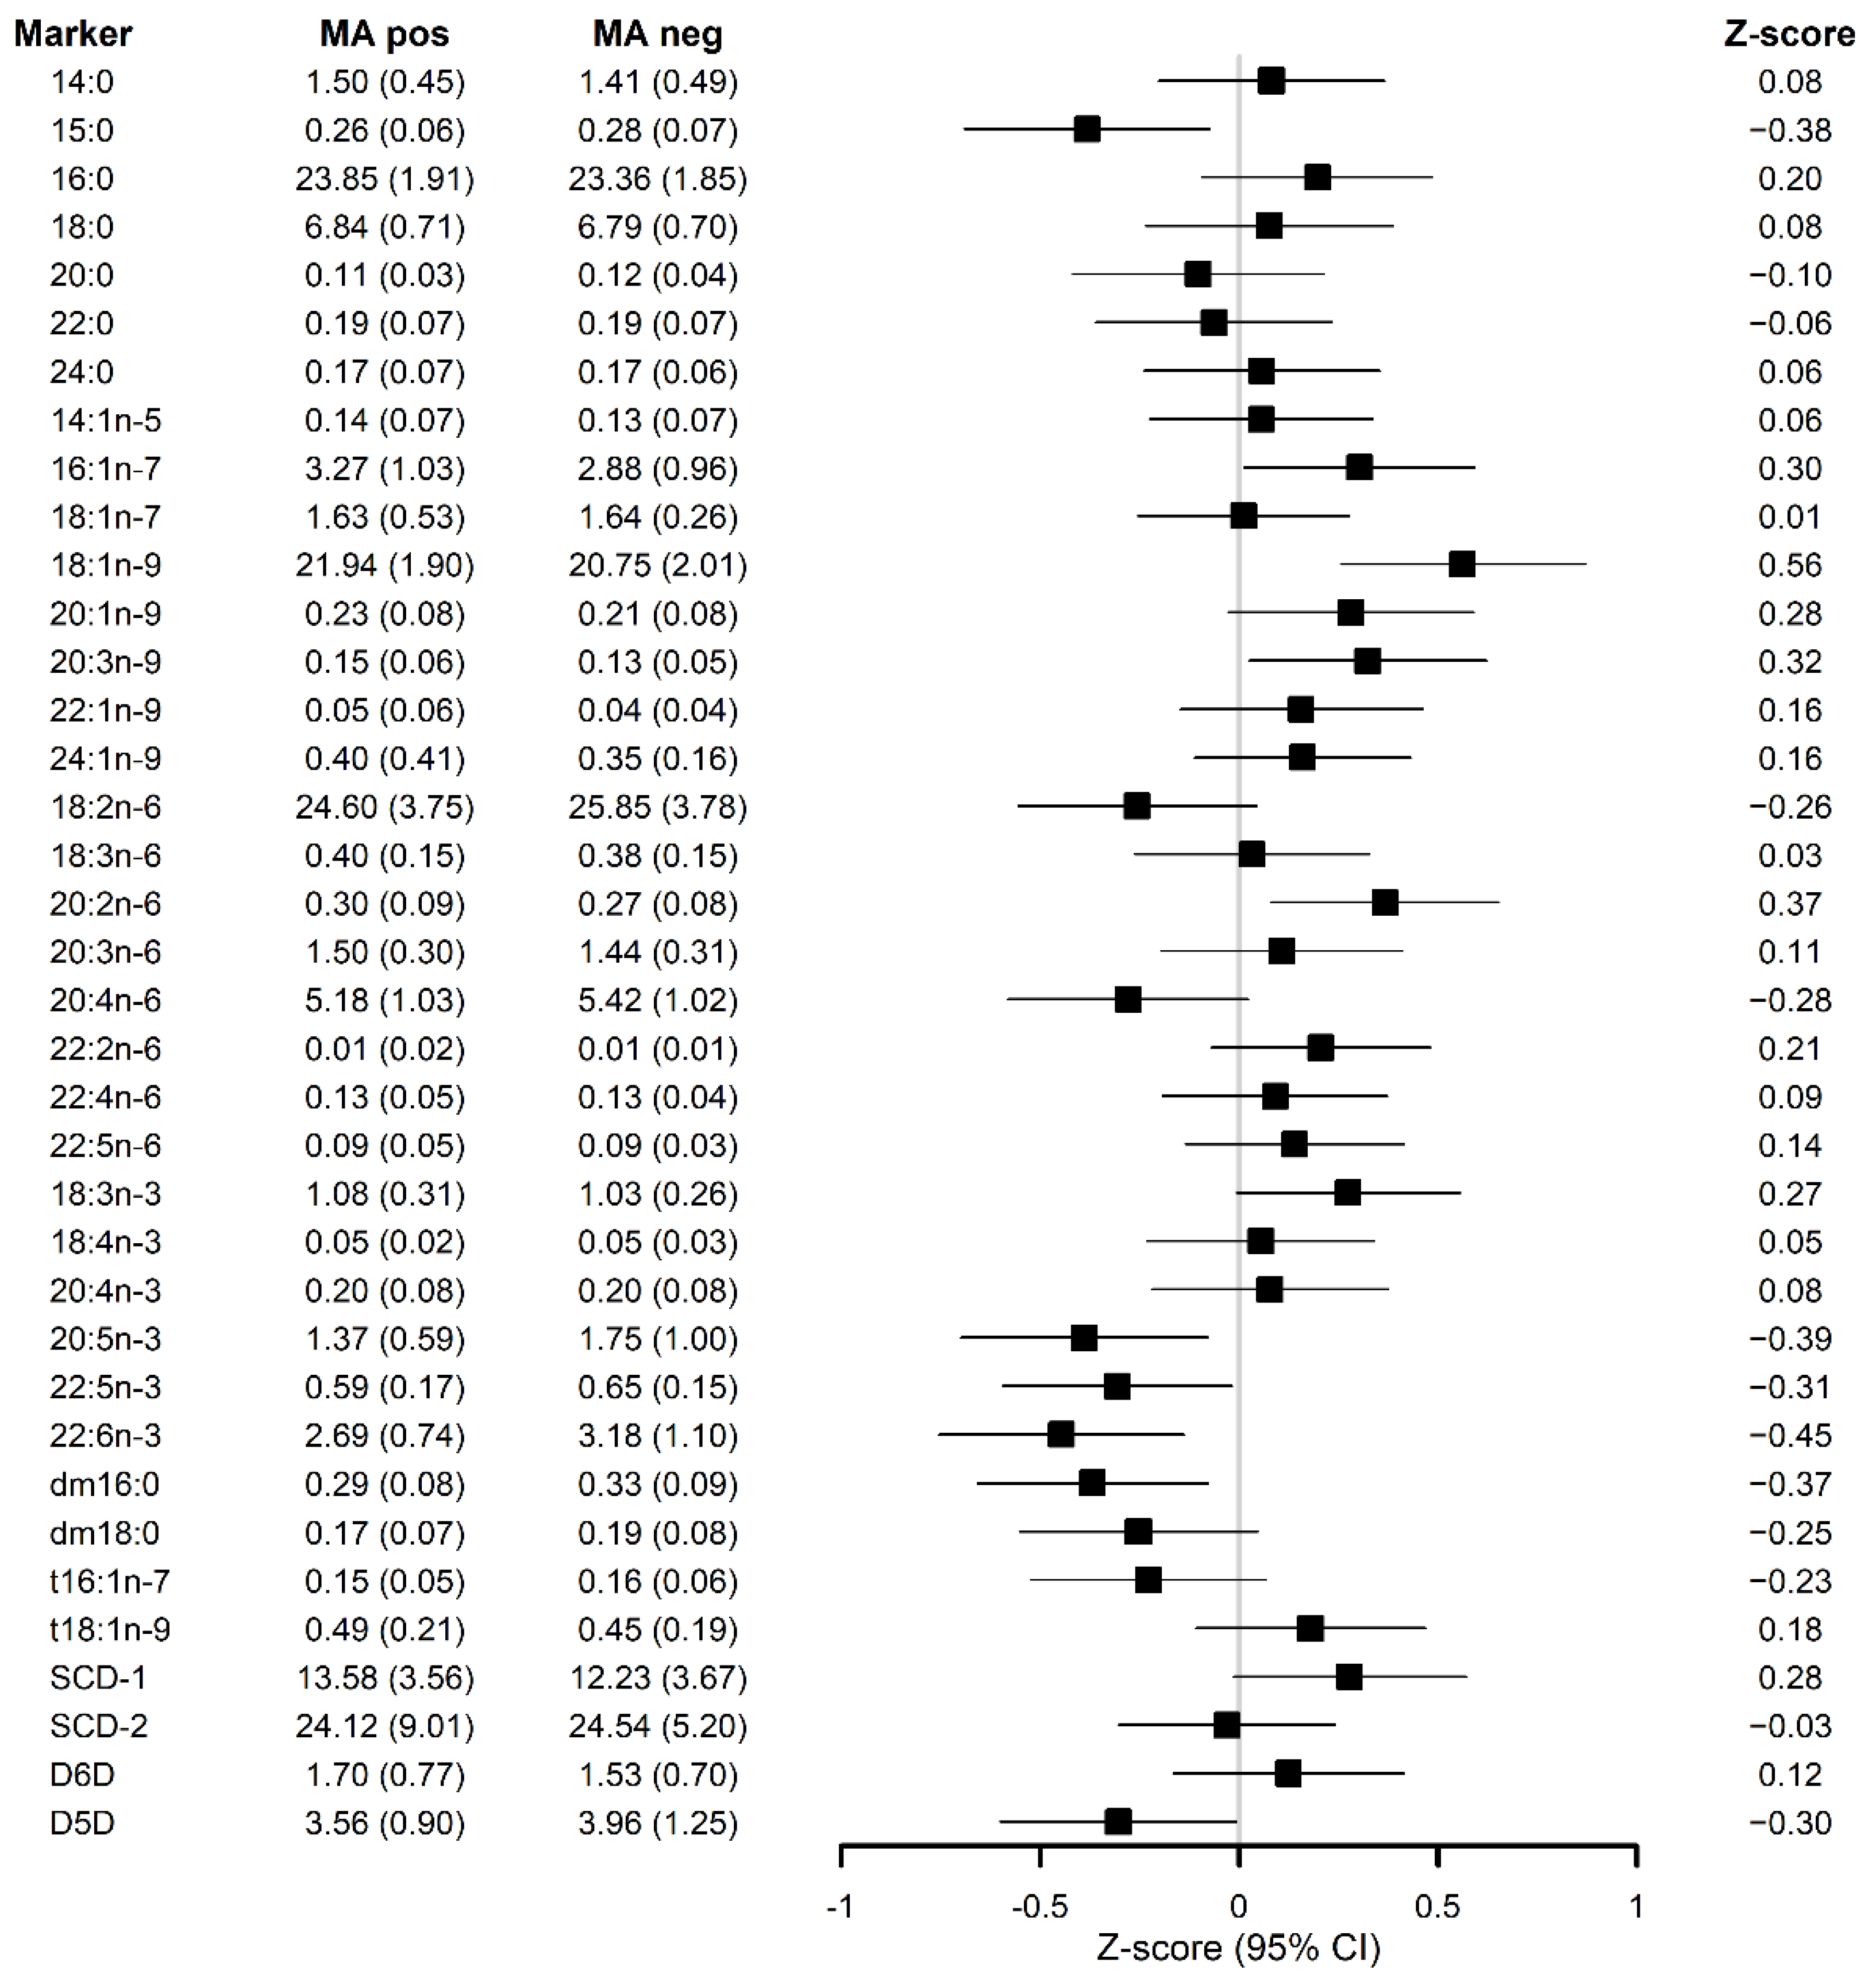
3.1. Serum FAs and Plasmalogens Relate with the Occurrence of MA Independently of the Study Group
3.2. MA-Associated Metabolites Attenuate the Relationship of Serum Triglycerides with MA Occurrence
3.3. Low-Grade Inflammation Is Not Associated with the Occurrence of MA
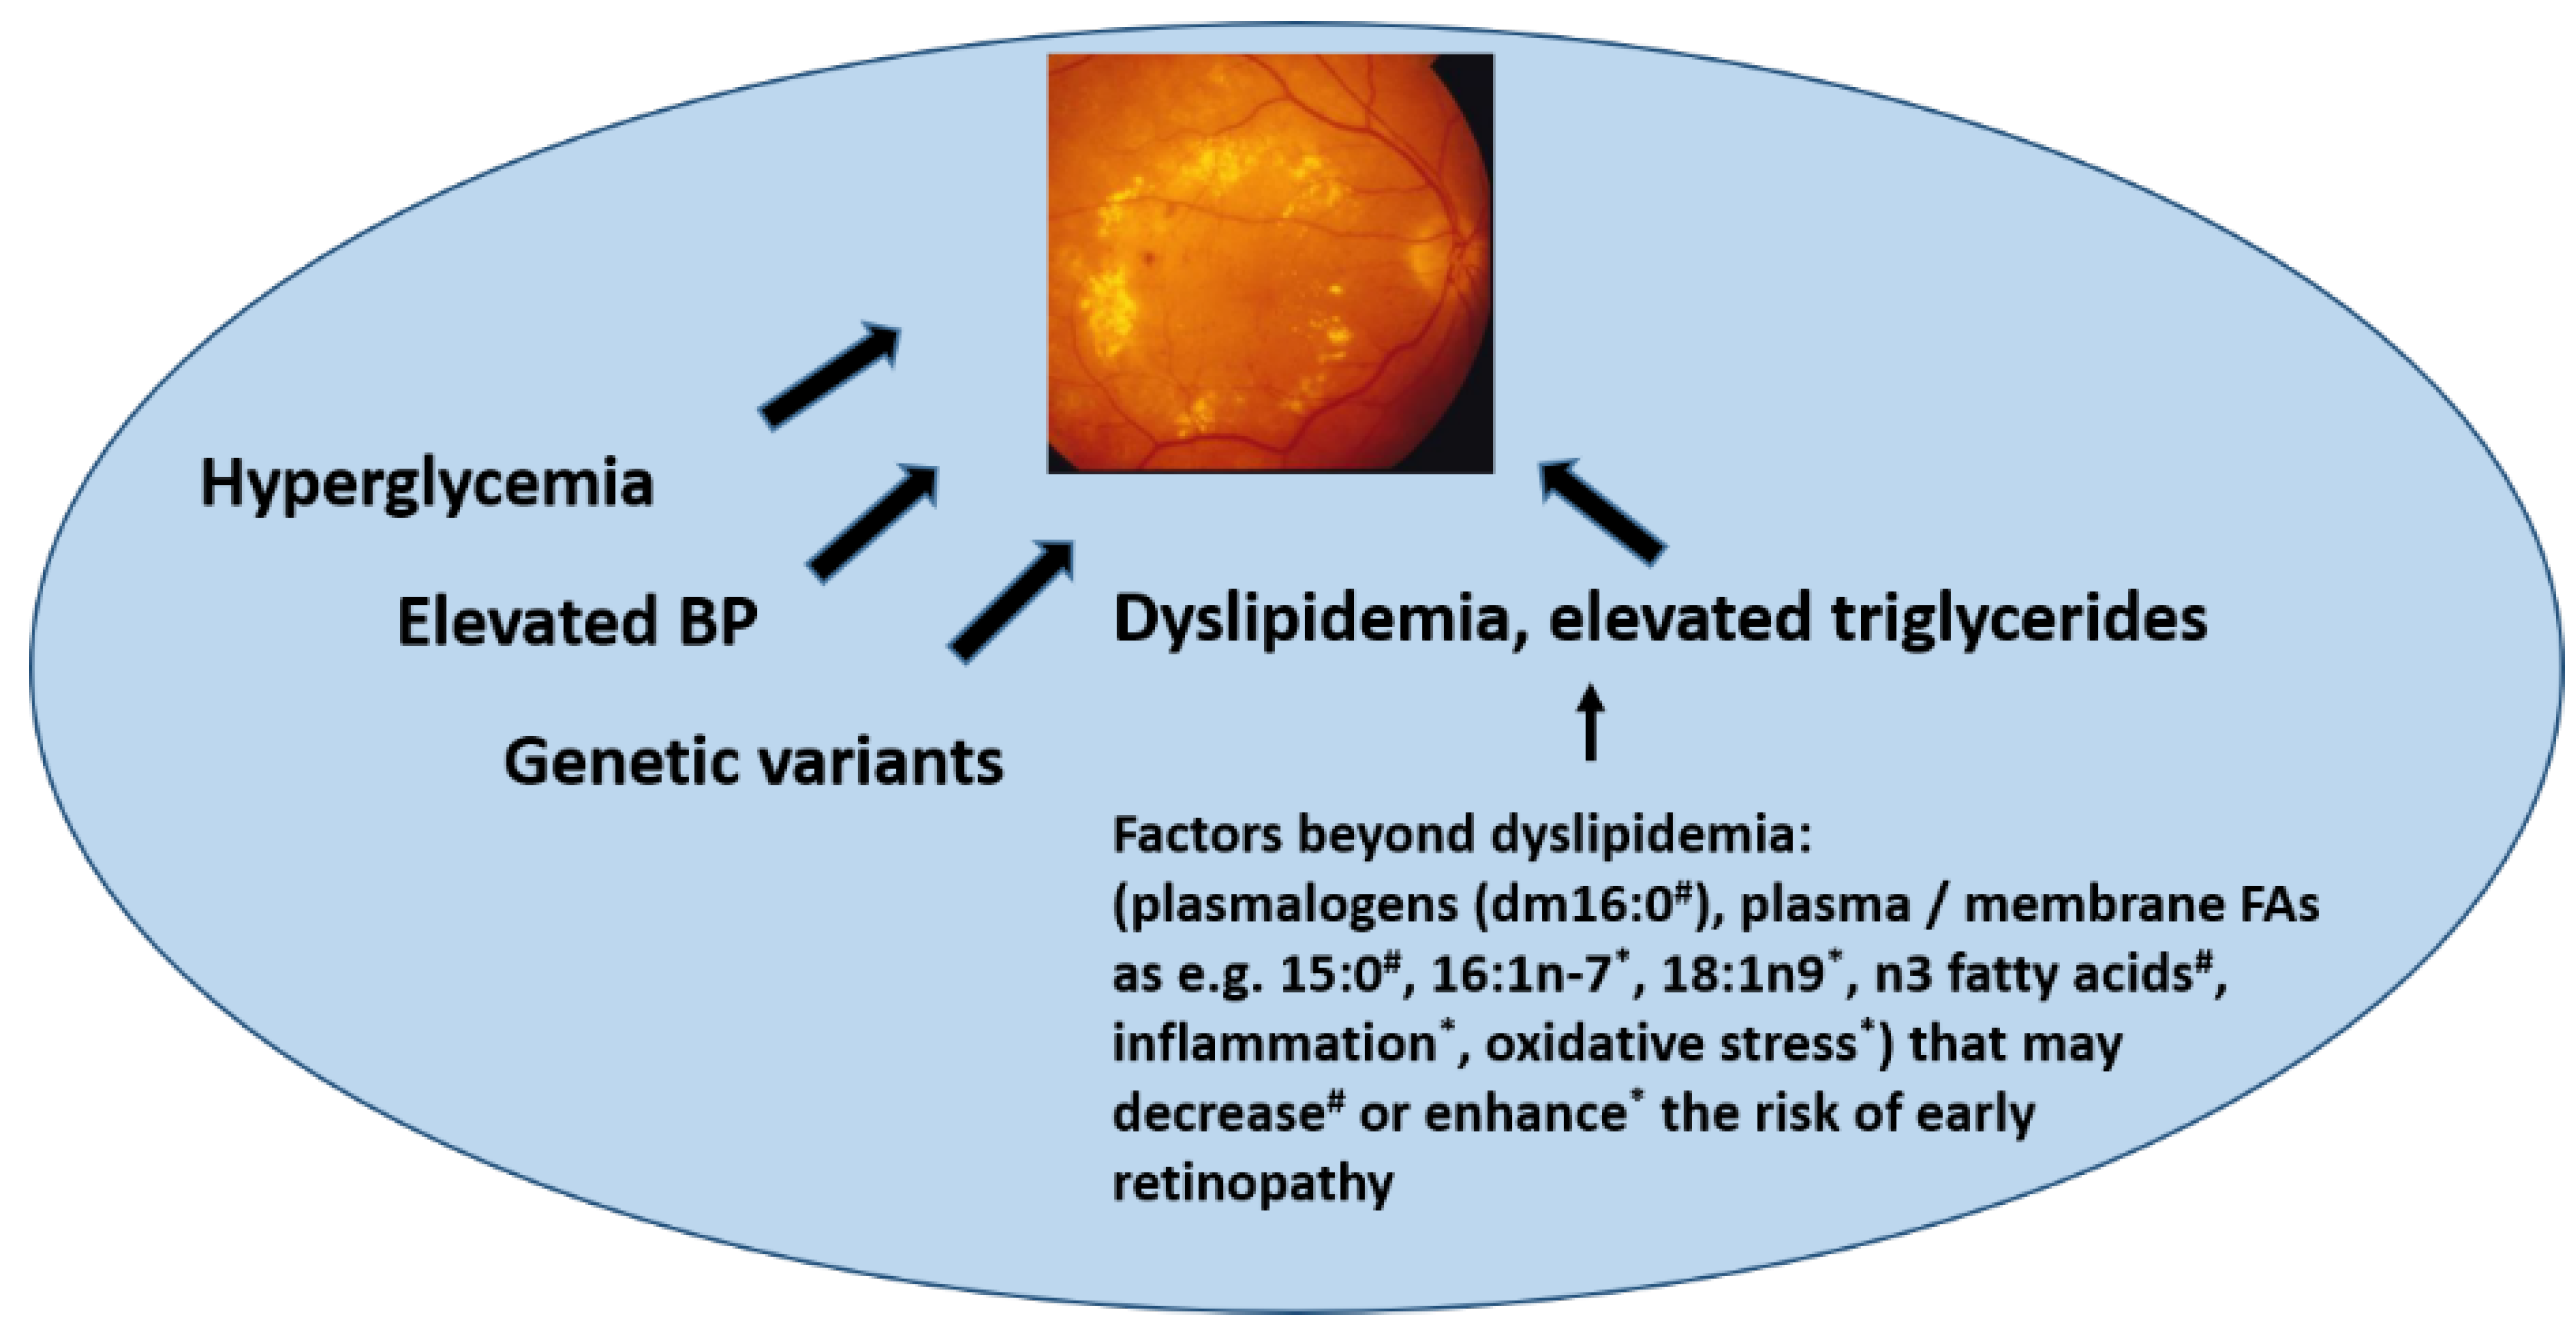
4. Discussion
5. Conclusions
Author Contributions
Funding
Institutional Review Board Statement
Informed Consent Statement
Conflicts of Interest
References
- Klein, R.; Klein, B.E.; Moss, S.E.; Davis, M.D.; DeMets, D.L. The Wisconsin Epidemiologic Study of Diabetic Retinopathy. III. Prevalence and Risk of Diabetic Retinopathy when Age at Diagnosis is 30 or More Years. Arch. Ophthalmol. 1984, 102, 527–532. [Google Scholar] [CrossRef]
- Klein, R.; Klein, B.E.K.; Moss, S.E. Epidemiology of Proliferative Diabetic Retinopathy. Diabetes Care 1992, 15, 1875–1891. [Google Scholar] [CrossRef] [PubMed]
- Yau, J.W.Y.; Rogers, S.L.; Kawasaki, R.; Lamoureux, E.L.; Kowalski, J.W.; Bek, T.; Chen, S.-J.; Dekker, J.M.; Fletcher, A.; Grauslund, J.; et al. Global Prevalence and Major Risk Factors of Diabetic Retinopathy. Diabetes Care 2012, 35, 556–564. [Google Scholar] [CrossRef] [Green Version]
- Das, R.; Kerr, R.; Chakravarthy, U.; Hogg, R.E. Dyslipidemia and Diabetic Macular Edema: A Systematic Review and Meta-Analysis. Ophthalmology 2015, 122, 1820–1827. [Google Scholar] [CrossRef] [PubMed]
- Golubovic-Arsovska, M. Association of dyslipidaemia with macular oedema and hard exudates in diabetic maculopathy. Prilozi 2007, 28, 149–160. [Google Scholar] [PubMed]
- Asensio-Sánchez, V.M.; Gómez-Ramírez, V.; Morales-Gómez, I.; Rodríguez-Vaca, I. Clinically Significant Diabetic Macular Edema: Systemic Risk Factors. Arch. Soc. Esp. Oftalmol. 2008, 83, 173–176. [Google Scholar] [CrossRef] [Green Version]
- Diep, T.M.; Tsui, I. Risk factors associated with diabetic macular edema. Diabetes Res. Clin. Pract. 2013, 100, 298–305. [Google Scholar] [CrossRef]
- Klein, B.E.; Moss, S.E.; Klein, R.; Surawicz, T.S. The Wisconsin Epidemiologic Study of Diabetic Retinopathy. XIII. Relationship of Serum Cholesterol to Retinopathy and Hard Exudate. Ophthalmology 1991, 98, 1261–1265. [Google Scholar] [CrossRef]
- Chew, E.Y.; Klein, M.L.; Ferris, F.L., 3rd; Remaley, N.A.; Murphy, R.P.; Chantry, K.; Hoogwerf, B.J.; Miller, D. Association of Elevated Serum Lipid Levels with Retinal Hard Exudate in Diabetic Retinopathy. Early Treatment Diabetic Retinopathy Study (ETDRS) Report 22. Arch. Ophthalmol. 1996, 114, 1079–1084. [Google Scholar] [CrossRef]
- Diabetes Prevention Program Research Group. Long-Term Effects of Lifestyle Intervention Or Metformin on Diabetes Development and Microvascular Complications Over 15-Year Follow-Up: The Diabetes Prevention Program Outcomes Study. Lancet Diabetes Endocrinol. 2015, 3, 866–875. [Google Scholar] [CrossRef] [Green Version]
- Aro, A.; Kauppinen, A.; Summanen, P.; Kivinen, N.; Selander, T.; Kinnunen, K.; Tuomilehto, J.; Keinänen-Kiukaanniemi, S.; Lindström, J.; Uusitupa, M.; et al. Life Style Intervention Improves Retinopathy Status—The Finnish Diabetes Prevention Study. Nutrients 2019, 11, 1691. [Google Scholar] [CrossRef] [Green Version]
- Tuomilehto, J.; Lindström, J.; Eriksson, J.G.; Valle, T.T.; Hämäläinen, H.; Ilanne-Parikka, P.; Keinänen-Kiukaanniemi, S.; Laakso, M.; Louheranta, A.; Rastas, M.; et al. Prevention of Type 2 Diabetes Mellitus by Changes in Lifestyle among Subjects with Impaired Glucose Tolerance. N. Engl. J. Med. 2001, 344, 1343–1350. [Google Scholar] [CrossRef] [PubMed]
- Lindström, J.; Ilanne-Parikka, P.; Peltonen, M.; Aunola, S.; Eriksson, J.; Hemiö, K.; Hämäläinen, H.; Härkönen, P.; Keinänen-Kiukaanniemi, S.; Laakso, M.; et al. Sustained reduction in the incidence of type 2 diabetes by lifestyle intervention: Follow-up of the Finnish Diabetes Prevention Study. Lancet 2006, 368, 1673–1679. [Google Scholar] [CrossRef]
- de Mello, V.D.; Lindström, J.; Eriksson, J.; Ilanne-Parikka, P.; Keinanen-Kiukaanniemi, S.; Sundvall, J.; Laakso, M.; Tuomilehto, J.; Uusitupa, M. Insulin Secretion and its Determinants in the Progression of Impaired Glucose Tolerance to Type 2 Diabetes in Impaired Glucose-Tolerant Individuals: The Finnish Diabetes Prevention Study. Diabetes Care 2012, 35, 211–217. [Google Scholar] [CrossRef] [Green Version]
- Adkins, Y.; Kelley, D.S. Mechanisms underlying the cardioprotective effects of omega-3 polyunsaturated fatty acids. J. Nutr. Biochem. 2010, 21, 781–792. [Google Scholar] [CrossRef]
- Kulacoglu, D.N.; Kocer, I.; Kurtul, N.; Keles, S.; Baykal, O. Alterations of fatty acid composition of erythrocyte membrane in type 2 diabetes patients with diabetic retinopathy. Jpn. J. Ophthalmol. 2003, 47, 551–556. [Google Scholar] [CrossRef] [PubMed]
- Pietiläinen, K.H.; Sysi-Aho, M.; Rissanen, A.; Seppänen-Laakso, T.; Yki-Jarvinen, H.; Kaprio, J.; Oresic, M. Acquired Obesity is Associated with Changes in the Serum Lipidomic Profile Independent of Genetic Effects—A Monozygotic Twin Study. PLoS ONE 2007, 2, e218. [Google Scholar] [CrossRef]
- Braverman, N.E.; Moser, A.B. Functions of plasmalogen lipids in health and disease. Biochim. Biophys. Acta 2012, 1822, 1442–1452. [Google Scholar] [CrossRef] [PubMed] [Green Version]
- Koehrer, P.; Saab, S.; Berdeaux, O.; Isaïco, R.; Grégoire, S.; Cabaret, S.; Bron, A.M.; Creuzot-Garcher, C.P.; Bretillon, L.; Acar, N. Erythrocyte Phospholipid and Polyunsaturated Fatty Acid Composition in Diabetic Retinopathy. PLoS ONE 2014, 9, e106912. [Google Scholar] [CrossRef] [Green Version]
- Mason, R.P.; Libby, P.; Bhatt, D.L. Emerging Mechanisms of Cardiovascular Protection for the Omega-3 Fatty Acid Eicosapentaenoic Acid. Arter. Thromb. Vasc. Biol. 2020, 40, 1135–1147. [Google Scholar] [CrossRef]
- Rivera, R.R.R.; Castellanos-González, J.A.; Montaño, C.O.; Flores-Martin, R.A.; Contreras, A.K.L.; Arevalo-Simental, D.E.; Cardona-Muñoz, E.G.; Roman-Pintos, L.M.; Rodríguez-Carrizalez, A.D. Adjuvant Therapies in Diabetic Retinopathy as an Early Approach to Delay Its Progression: The Importance of Oxidative Stress and Inflammation. Oxidative Med. Cell. Longev. 2020, 2020, 3096470. [Google Scholar] [CrossRef]
- Lindström, J.; Peltonen, M.; Eriksson, J.G.; Ilanne-Parikka, P.; Aunola, S.; Keinänen-Kiukaanniemi, S.; Uusitupa, M.; Tuomilehto, J.; for the Finnish Diabetes Prevention Study (DPS). Improved lifestyle and decreased diabetes risk over 13 years: Long-term follow-up of the randomised Finnish Diabetes Prevention Study (DPS). Diabetologia 2013, 56, 284–293. [Google Scholar] [CrossRef] [Green Version]
- Lindström, J.; Louheranta, A.; Mannelin, M.; Rastas, M.; Salminen, V.; Eriksson, J.; Uusitupa, M.; Tuomilehto, J. The Finnish Diabetes Prevention Study (DPS): Lifestyle intervention and 3-year results on diet and physical activity. Diabetes Care 2003, 26, 3230–3236. [Google Scholar] [CrossRef] [PubMed] [Green Version]
- De Mello, V.D.; Paananen, J.; Lindström, J.; Lankinen, M.A.; Shi, L.; Kuusisto, J.; Pihlajamäki, J.; Auriola, S.; Lehtonen, M.; Rolandsson, O.; et al. Indolepropionic acid and novel lipid metabolites are associated with a lower risk of type 2 diabetes in the Finnish Diabetes Prevention Study. Sci. Rep. 2017, 7, 46337. [Google Scholar] [CrossRef]
- Tuomainen, M.; Lindström, J.; Lehtonen, M.; Auriola, S.; Pihlajamäki, J.; Peltonen, M.; Tuomilehto, J.; Uusitupa, M.; De Mello, V.D.; Hanhineva, K. Associations of serum indolepropionic acid, a gut microbiota metabolite, with type 2 diabetes and low-grade inflammation in high-risk individuals. Nutr. Diabetes 2018, 8, 35. [Google Scholar] [CrossRef]
- Takkunen, M.J.; Schwab, U.S.; de Mello, V.D.; Eriksson, J.G.; Lindström, J.; Tuomilehto, J.; Uusitupa, M.I.; DPS Study Group. Longitudinal Associations of Serum Fatty Acid Composition with Type 2 Diabetes Risk and Markers of Insulin Secretion and Sensitivity in the Finnish Diabetes Prevention Study. Eur. J. Nutr. 2016, 55, 967–979. [Google Scholar] [CrossRef]
- Vessby, B.; Aro, A.; Skarfors, E.; Berglund, L.; Salminen, I.; Lithell, H. The Risk to Develop NIDDM is Related to the Fatty Acid Composition of the Serum Cholesterol Esters. Diabetes 1994, 43, 1353–1357. [Google Scholar] [CrossRef] [PubMed]
- ARIC Study Investigators; Wang, L.; Folsom, A.R.; Zheng, Z.-J.; Pankow, J.S.; Eckfeldt, J.H. Plasma fatty acid composition and incidence of diabetes in middle-aged adults: The Atherosclerosis Risk in Communities (ARIC) Study. Am. J. Clin. Nutr. 2003, 78, 91–98. [Google Scholar] [CrossRef] [PubMed] [Green Version]
- Krachler, B.; Norberg, M.; Eriksson, J.W.; Hallmans, G.; Johansson, I.; Vessby, B.; Weinehall, L.; Lindahl, B. Fatty acid profile of the erythrocyte membrane preceding development of Type 2 diabetes mellitus. Nutr. Metab. Cardiovasc. Dis. 2008, 18, 503–510. [Google Scholar] [CrossRef] [PubMed]
- Djoussé, L.; Biggs, M.L.; Lemaitre, R.N.; King, I.B.; Song, X.; Ix, J.H.; Mukamal, K.J.; Siscovick, D.S.; Mozaffarian, D. Plasma omega-3 fatty acids and incident diabetes in older adults. Am. J. Clin. Nutr. 2011, 94, 527–533. [Google Scholar] [CrossRef] [Green Version]
- Kröger, J.; Zietemann, V.; Enzenbach, C.; Weikert, C.; Jansen, E.H.; Döring, F.; Joost, H.-G.; Boeing, H.; Schulze, M.B. Erythrocyte membrane phospholipid fatty acids, desaturase activity, and dietary fatty acids in relation to risk of type 2 diabetes in the European Prospective Investigation into Cancer and Nutrition (EPIC)–Potsdam Study. Am. J. Clin. Nutr. 2011, 93, 127–142. [Google Scholar] [CrossRef] [Green Version]
- Mahendran, Y.; Ågren, J.; Uusitupa, M.; Cederberg, H.; Vangipurapu, J.; Stančáková, A.; Schwab, U.; Kuusisto, J.; Laakso, M. Association of erythrocyte membrane fatty acids with changes in glycemia and risk of type 2 diabetes. Am. J. Clin. Nutr. 2013, 99, 79–85. [Google Scholar] [CrossRef] [PubMed] [Green Version]
- Virtanen, J.K.; Mursu, J.; Voutilainen, S.; Uusitupa, M.; Tuomainen, T.-P. Serum Omega-3 Polyunsaturated Fatty Acids and Risk of Incident Type 2 Diabetes in Men: The Kuopio Ischemic Heart Disease Risk Factor Study. Diabetes Care 2014, 37, 189–196. [Google Scholar] [CrossRef] [PubMed] [Green Version]
- Saab, S.; Mazzocco, J.; Creuzot-Garcher, C.P.; Bron, A.M.; Bretillon, L.; Acar, N. Plasmalogens in the retina: From occurrence in retinal cell membranes to potential involvement in pathophysiology of retinal diseases. Biochimie 2014, 107, 58–65. [Google Scholar] [CrossRef]
- Lankinen, M.; Schwab, U.; Kolehmainen, M.; Paananen, J.; Nygren, H.; Seppänen-Laakso, T.; Poutanen, K.; Hyötyläinen, T.; Risérus, U.; Savolainen, M.J.; et al. A Healthy Nordic Diet Alters the Plasma Lipidomic Profile in Adults with Features of Metabolic Syndrome in a Multicenter Randomized Dietary Intervention. J. Nutr. 2015, 146, 662–672. [Google Scholar] [CrossRef] [PubMed] [Green Version]
- Malik, V.S.; Guasch-Ferre, M.; Hu, F.B.; Townsend, M.K.; Zeleznik, O.A.; Eliassen, A.H.; Tworoger, S.S.; Karlson, E.W.; Costenbader, K.H.; Ascherio, A.; et al. Identification of Plasma Lipid Metabolites Associated with Nut Consumption in US Men and Women. J. Nutr. 2019, 149, 1215–1221. [Google Scholar] [CrossRef]
- Broniec, A.; Klosinski, R.; Pawlak, A.; Wrona-Krol, M.; Thompson, D.; Sarna, T. Interactions of plasmalogens and their diacyl analogs with singlet oxygen in selected model systems. Free. Radic. Biol. Med. 2011, 50, 892–898. [Google Scholar] [CrossRef] [Green Version]
- Augustine, J.; Troendle, E.P.; Barabas, P.; McAleese, C.A.; Friedel, T.; Stitt, A.W.; Curtis, T.M. The Role of Lipoxidation in the Pathogenesis of Diabetic Retinopathy. Front. Endocrinol. 2021, 11, 621938. [Google Scholar] [CrossRef] [PubMed]
- Kang, Q.; Yang, C. Oxidative stress and diabetic retinopathy: Molecular mechanisms, pathogenetic role and therapeutic implications. Redox Biol. 2020, 37, 101799. [Google Scholar] [CrossRef]
- Sahajpal, N.S.; Goel, R.K.; Chaubey, A.; Aurora, R.; Jain, S.K. Pathological Perturbations in Diabetic Retinopathy: Hyperglycemia, AGEs, Oxidative Stress and Inflammatory Pathways. Curr. Protein Pept. Sci. 2019, 20, 92–110. [Google Scholar] [CrossRef]
- Mas, E.; Woodman, R.; Burke, V.; Puddey, I.B.; Beilin, L.J.; Durand, T.; Mori, T.A. The omega-3 fatty acids EPA and DHA decrease plasma F2-isoprostanes: Results from two placebo-controlled interventions. Free. Radic. Res. 2010, 44, 983–990. [Google Scholar] [CrossRef]
- Suzumura, A.; Terao, R.; Kaneko, H. Protective Effects and Molecular Signaling of n-3 Fatty Acids on Oxidative Stress and Inflammation in Retinal Diseases. Antioxidants 2020, 9, 920. [Google Scholar] [CrossRef] [PubMed]
- Thota, R.; Acharya, S.H.; Garg, M.L. Curcumin and/or omega-3 polyunsaturated fatty acids supplementation reduces insulin resistance and blood lipids in individuals with high risk of type 2 diabetes: A randomised controlled trial. Lipids Health Dis. 2019, 18, 31. [Google Scholar] [CrossRef] [PubMed] [Green Version]
- Abbott, K.; Burrows, T.; Acharya, S.; Thota, R.; Garg, M. DHA-enriched fish oil reduces insulin resistance in overweight and obese adults. Prostaglandins Leukot. Essent. Fat. Acids 2020, 159, 102154. [Google Scholar] [CrossRef] [PubMed]
- Alsbirk, K.E.; Seland, J.H.; Assmus, J. Diabetic retinopathy and visual impairment in a Norwegian diabetic coast population with a high dietary intake of fish oils. An observational study. Acta Ophthalmol. 2021. [Google Scholar] [CrossRef] [PubMed]
- Qian, F.; Korat, A.V.A.; Imamura, F.; Marklund, M.; Tintle, N.; Virtanen, J.K.; Zhou, X.; Bassett, J.K.; Lai, H.; Hirakawa, Y.; et al. n-3 Fatty Acid Biomarkers and Incident Type 2 Diabetes: An Individual Participant-Level Pooling Project of 20 Prospective Cohort Studies. Diabetes Care 2021, 44, 1133–1142. [Google Scholar] [CrossRef]
- Jenkins, B.J.; Seyssel, K.; Chiu, S.; Pan, P.H.; Lin, S.Y.; Stanley, E.; Ament, Z.; West, J.A.; Summerhill, K.; Griffin, J.L.; et al. Odd Chain Fatty Acids; New Insights of the Relationship between the Gut Microbiota, Dietary Intake, Biosynthesis and Glucose Intolerance. Sci. Rep. 2017, 7, 44845. [Google Scholar] [CrossRef] [PubMed] [Green Version]
- Weitkunat, K.; Schumann, S.; Nickel, D.; Hornemann, S.; Petzke, K.J.; Schulze, M.B.; Pfeiffer, A.F.H.; Klaus, S. Odd-chain fatty acids as a biomarker for dietary fiber intake: A novel pathway for endogenous production from propionate. Am. J. Clin. Nutr. 2017, 105, 1544–1551. [Google Scholar] [CrossRef] [Green Version]
- Imamura, F.; Fretts, A.; Marklund, M.; Ardisson Korat, A.V.; Yang, W.S.; Lankinen, M.; Qureshi, W.; Helmer, C.; Chen, T.A.; Wong, K.; et al. Fatty Acid Biomarkers of Dairy Fat Consumption and Incidence of Type 2 Diabetes: A Pooled Analysis of Prospective Cohort Studies. PLoS Med. 2018, 15, e1002670. [Google Scholar] [CrossRef] [Green Version]
- Saadatian-Elahi, M.; Slimani, N.; Chajès, V.; Jenab, M.; Goudable, J.; Biessy, C.; Ferrari, P.; Byrnes, G.; Autier, P.; Peeters, P.H.; et al. Plasma phospholipid fatty acid profiles and their association with food intakes: Results from a cross-sectional study within the European Prospective Investigation into Cancer and Nutrition. Am. J. Clin. Nutr. 2008, 89, 331–346. [Google Scholar] [CrossRef] [PubMed] [Green Version]
- Santaren, I.D.; Watkins, S.M.; Liese, A.D.; Wagenknecht, L.E.; Rewers, M.J.; Haffner, S.M.; Lorenzo, C.; Hanley, A.J. Serum pentadecanoic acid (15:0), a short-term marker of dairy food intake, is inversely associated with incident type 2 diabetes and its underlying disorders. Am. J. Clin. Nutr. 2014, 100, 1532–1540. [Google Scholar] [CrossRef] [PubMed] [Green Version]
- Chang, Y.-C.; Lin, C.-W.; Chang, Y.-S.; Chen, P.-H.; Li, C.-Y.; Wu, W.-C.; Kao, Y.-H. Monounsaturated oleic acid modulates autophagy flux and upregulates angiogenic factor production in human retinal pigment epithelial ARPE-19 cells. Life Sci. 2020, 259, 118391. [Google Scholar] [CrossRef]
- Fang, I.-M.; Yang, C.-H.; Yang, C.-M.; Chen, M.-S. Comparative effects of fatty acids on proinflammatory gene cyclooxygenase 2 and inducible nitric oxide synthase expression in retinal pigment epithelial cells. Mol. Nutr. Food Res. 2009, 53, 739–750. [Google Scholar] [CrossRef]
- Alcubierre, N.; Navarrete-Muñoz, E.M.; Rubinat, E.; Falguera, M.; Valls, J.; Traveset, A.; Vilanova, M.-B.; Marsal, J.R.; Hernández, M.; Granado-Casas, M.; et al. Association of low oleic acid intake with diabetic retinopathy in type 2 diabetic patients: A case–control study. Nutr. Metab. 2016, 13, 40. [Google Scholar] [CrossRef] [Green Version]
- Vessby, B.; Tengblad, S.; Lithell, H. Insulin Sensitivity is Related to the Fatty Acid Composition of Serum Lipids and Skeletal Muscle Phospholipids in 70-Year-Old Men. Diabetologia 1994, 37, 1044–1050. [Google Scholar] [CrossRef] [PubMed]
- Vessby, B. Dietary fat, fatty acid composition in plasma and the metabolic syndrome. Curr. Opin. Lipidol. 2003, 14, 15–19. [Google Scholar] [CrossRef]
- Haug, A.; Høstmark, A.T.; Harstad, O.M. Bovine Milk in Human Nutrition—A Review. Lipids Health Dis. 2007, 6, 25. [Google Scholar] [CrossRef] [PubMed] [Green Version]


| MA Neg | MA Pos | p-Value | |
|---|---|---|---|
| n | 115 | 51 | |
| Study group, n (I/C) | 67/48 | 21/30 | 0.062 |
| Sex, n (men/women) | 35/80 | 9/42 | 0.126 |
| Age, years | 54.4 ± 7.5 | 52.0 ± 6.2 | 0.036 |
| BMI, kg/m2 | 31.3 ± 5.0 | 31.7 ± 5.1 | 0.641 |
| Triglycerides, mmol/L | 1.60 ± 0.68 | 1.85 ± 0.68 | 0.035 |
| HbA1c, % | 5.53 ± 0.56 | 5.35 ± 0.55 | 0.051 |
| Hs-CRP, mg/L | 0.74 ± 0.99 | 0.68 ± 1.01 | 0.739 |
| Serum Lipid Marker | MA Pos 1 | MA Neg 1 | |||
|---|---|---|---|---|---|
| mmol% | Mean ± SD | Mean ± SD | β Value | CI | p 2 |
| 14:0 myristic | 1.5 ± 0.45 | 1.41 ± 0.49 | 0.04 | −0.10; 0.18 | 0.58 |
| 15:0 pentadecanoic | 0.26 ± 0.06 | 0.28 ± 0.07 | −0.03 | −0.05; −0.01 | 0.015 |
| 16:0 palmitic | 23.85 ± 1.91 | 23.36 ± 1.85 | 0.34 | −0.23; 0.91 | 0.25 |
| 18:0 stearic | 6.84 ± 0.71 | 6.79 ± 0.7 | 0.06 | −0.15; 0.27 | 0.58 |
| 20:0 arachidic | 0.11 ± 0.03 | 0.12 ± 0.04 | 0.00 | −0.02; 0.01 | 0.50 |
| 22:0 behenic | 0.19 ± 0.07 | 0.19 ± 0.07 | 0.00 | −0.02; 0.02 | 0.92 |
| 24:0 lignoceric | 0.17 ± 0.07 | 0.17 ± 0.06 | 0.00 | −0.02; 0.02 | 0.69 |
| 14:1n-5 myristoleate | 0.14 ± 0.07 | 0.13 ± 0.07 | 0.01 | −0.01; 0.03 | 0.56 |
| 16:1n-7 palmitoleic | 3.27 ± 1.03 | 2.88 ± 0.96 | 0.35 | 0.04; 0.66 | 0.026 |
| 18:1n-7 vaccenic | 1.63 ± 0.53 | 1.64 ± 0.26 | 0.00 | −0.10; 0.10 | 0.95 |
| 18:1n-9 oleic | 21.94 ± 1.9 | 20.75 ± 2.01 | 1.16 | 0.54; 1.78 | <0.001 |
| 20:1n-9 gondoic | 0.23 ± 0.08 | 0.21 ± 0.08 | 0.02 | 0.00; 0.04 | 0.11 |
| 20:3n-9 mead | 0.15 ± 0.06 | 0.13 ± 0.05 | 0.02 | 0.00; 0.04 | 0.013 |
| 22:1n-9 erucic | 0.05 ± 0.06 | 0.04 ± 0.04 | 0.01 | −0.01; 0.02 | 0.41 |
| 24:1n-9 nervonic | 0.4 ± 0.41 | 0.35 ± 0.16 | 0.05 | −0.02; 0.12 | 0.19 |
| 18:2n-6 linoleic | 24.6 ± 3.75 | 25.85 ± 3.78 | −0.95 | −2.12; 0.21 | 0.11 |
| 18:3n-6 γ-linolenic | 0.4 ± 0.15 | 0.38 ± 0.15 | 0.02 | −0.03; 0.06 | 0.48 |
| 20:2n-6 eicosadienoic | 0.3 ± 0.09 | 0.27 ± 0.08 | 0.03 | 0.01; 0.05 | 0.01 |
| 20:3n-6 dihomo-γ-linolenic | 1.5 ± 0.3 | 1.44 ± 0.31 | 0.06 | −0.03; 0.16 | 0.20 |
| 20:4n-6 arachidonic | 5.18 ± 1.03 | 5.42 ± 1.02 | −0.24 | −0.55; 0.07 | 0.13 |
| 22:2n-6 docosadienoic | 0.01 ± 0.02 | 0.01 ± 0.01 | 0.00 | 0.00; 0.01 | 0.12 |
| 22:4n-6 adrenic | 0.13 ± 0.05 | 0.13 ± 0.04 | 0.01 | −0.01; 0.02 | 0.30 |
| 22:5n-6 osbond | 0.09 ± 0.05 | 0.09 ± 0.03 | 0.01 | −0.01; 0.02 | 0.31 |
| 18:3n-3 ꭤ-linolenic | 1.08 ± 0.31 | 1.03 ± 0.26 | 0.05 | −0.03; 0.13 | 0.20 |
| 18:4n-3 stearidonic | 0.05 ± 0.02 | 0.05 ± 0.03 | 0.00 | −0.01; 0.01 | 0.68 |
| 20:4n-3 eicosatetraenoic | 0.2 ± 0.08 | 0.2 ± 0.08 | 0.00 | −0.02; 0.03 | 0.77 |
| 20:5n-3 eicosapentaenoic | 1.37 ± 0.59 | 1.75 ± 1 | −0.42 | −0.70; −0.14 | 0.003 |
| 22:5n-3 docosapentaenoic | 0.59 ± 0.17 | 0.65 ± 0.15 | −0.06 | −0.10; −0.01 | 0.018 |
| 22:6n-3 docosahexaenoic | 2.69 ± 0.74 | 3.18 ± 1.1 | −0.50 | −0.82; −0.19 | 0.002 |
| dm16:0 | 0.29 ± 0.08 | 0.33 ± 0.09 | −0.04 | −0.06; −0.01 | 0.006 |
| dm18:0 | 0.17 ± 0.07 | 0.19 ± 0.08 | −0.02 | −0.05; 0.00 | 0.044 |
| t16:1n-7 | 0.15 ± 0.05 | 0.16 ± 0.06 | −0.01 | −0.03; 0.00 | 0.13 |
| t18:1n-9 | 0.49 ± 0.21 | 0.45 ± 0.19 | 0.04 | −0.02; 0.10 | 0.17 |
| SCD-1 3 | 13.58 ± 3.56 | 12.23 ± 3.67 | 1.26 | 0.11; 2.41 | 0.032 |
| SCD-2 3 | 24.12 ± 9.01 | 24.54 ± 5.2 | −0.23 | −2.02; 1.57 | 0.81 |
| D5D 3 | 3.56 ± 0.90 | 3.96 ± 1.25 | −0.42 | −0.77; −0.07 | 0.021 |
| D6D 3 | 1.7 ± 0.77 | 1.53 ± 0.7 | 0.14 | −0.08; 0.35 | 0.21 |
| Serum Lipid Marker Included in the Model 1 | Triglyceride’s Resulting β Value | CI | p1 |
|---|---|---|---|
| 15:0 | 0.16 | (−0.02; 0.34) | 0.09 |
| 16:1n-7 | 0.10 | (−0.07; 0.27) | 0.24 |
| 18:1n-9 | 0.03 | (−0.12; 0.18) | 0.68 |
| 20:5n-3 | 0.13 | (−0.04; 0.31) | 0.14 |
| 22:5n-3 | 0.16 | (−0.02; 0.34) | 0.09 |
| 22:6n-3 | 0.13 | (−0.04; 0.31) | 0.14 |
| dm16:0 | 0.06 | (−0.09; 0.21) | 0.41 |
| Serum Lipid Marker | β | CI | p1 |
|---|---|---|---|
| 14:0 myristic | 0.04 | −0.10; 0.17 | 0.573 |
| 15:0 pentadecanoic | −0.03 | −0.05; 0.00 | 0.016 |
| 16:0 palmitic | 0.37 | −0.17; 0.92 | 0.184 |
| 18:0 stearic | 0.05 | −0.16; 0.27 | 0.630 |
| 20:0 arachidic | 0.00 | −0.02; 0.01 | 0.521 |
| 22:0 behenic | 0.00 | −0.03; 0.02 | 0.675 |
| 24:0 lignoceric | 0.00 | −0.02; 0.02 | 0.705 |
| 14:1n-5 myristoleate | 0.00 | −0.02; 0.02 | 0.698 |
| 16:1n-7 palmitoleic | 0.30 | 0.01; 0.59 | 0.042 |
| 18:1n-7 vaccenic | 0.00 | −0.09; 0.10 | 0.930 |
| 18:1n-9 oleic | 1.16 | 0.53; 1.79 | <0.001 |
| 20:1n-9 gondoic | 0.02 | 0.00; 0.05 | 0.075 |
| 20:3n-9 mead | 0.02 | 0.00; 0.03 | 0.035 |
| 22:1n-9 erucic | 0.01 | −0.01; 0.02 | 0.317 |
| 24:1n-9 nervonic | 0.04 | −0.03; 0.12 | 0.250 |
| 18:2n-6 linoleic | −0.98 | −2.12; 0.16 | 0.094 |
| 18:3n-6 γ-linolenic | 0.00 | −0.04; 0.05 | 0.827 |
| 20:2n-6 eicosadienoic | 0.03 | 0.01; 0.06 | 0.012 |
| 20:3n-6 dihomo-γ-linolenic | 0.03 | −0.06; 0.13 | 0.485 |
| 20:4n-6 arachidonic | −0.29 | −0.60; 0.02 | 0.070 |
| 22:2n-6 docosadienoic | 0.00 | 0.00; 0.01 | 0.147 |
| 22:4n-6 adrenic | 0.00 | −0.01; 0.02 | 0.529 |
| 22:5n-6 osbond | 0.01 | −0.01; 0.02 | 0.321 |
| 18:3n-3 ꭤ-linolenic | 0.08 | 0.00; 0.15 | 0.056 |
| 18:4n-3 stearidonic | 0.00 | −0.01; 0.01 | 0.709 |
| 20:4n-3 eicosatetraenoic | 0.01 | −0.02; 0.03 | 0.608 |
| 20:5n-3 eicosapentaenoic | −0.35 | −0.63; −0.07 | 0.015 |
| 22:5n-3 docosapentaenoic | −0.05 | −0.09; 0.00 | 0.039 |
| 22:6n-3 docosahexaenoic | −0.46 | −0.77; −0.14 | 0.005 |
| dm16:0 | −0.03 | −0.06; −0.01 | 0.013 |
| dm18:0 | −0.02 | −0.04; 0.00 | 0.099 |
| t16:1n-7 | −0.01 | −0.03; 0.00 | 0.132 |
| t18:1n-9 | 0.04 | −0.02; 0.09 | 0.223 |
| SCD-1 | 1.02 | −0.05; 2.10 | 0.064 |
| SCD-2 | −0.21 | −2.04; 1.63 | 0.825 |
| D5D | −0.35 | −0.70; −0.01 | 0.046 |
| D6D | 0.09 | −0.12; 0.30 | 0.400 |
Publisher’s Note: MDPI stays neutral with regard to jurisdictional claims in published maps and institutional affiliations. |
© 2021 by the authors. Licensee MDPI, Basel, Switzerland. This article is an open access article distributed under the terms and conditions of the Creative Commons Attribution (CC BY) license (https://creativecommons.org/licenses/by/4.0/).
Share and Cite
de Mello, V.D.; Selander, T.; Lindström, J.; Tuomilehto, J.; Uusitupa, M.; Kaarniranta, K. Serum Levels of Plasmalogens and Fatty Acid Metabolites Associate with Retinal Microangiopathy in Participants from the Finnish Diabetes Prevention Study. Nutrients 2021, 13, 4452. https://doi.org/10.3390/nu13124452
de Mello VD, Selander T, Lindström J, Tuomilehto J, Uusitupa M, Kaarniranta K. Serum Levels of Plasmalogens and Fatty Acid Metabolites Associate with Retinal Microangiopathy in Participants from the Finnish Diabetes Prevention Study. Nutrients. 2021; 13(12):4452. https://doi.org/10.3390/nu13124452
Chicago/Turabian Stylede Mello, Vanessa Derenji, Tuomas Selander, Jaana Lindström, Jaakko Tuomilehto, Matti Uusitupa, and Kai Kaarniranta. 2021. "Serum Levels of Plasmalogens and Fatty Acid Metabolites Associate with Retinal Microangiopathy in Participants from the Finnish Diabetes Prevention Study" Nutrients 13, no. 12: 4452. https://doi.org/10.3390/nu13124452
APA Stylede Mello, V. D., Selander, T., Lindström, J., Tuomilehto, J., Uusitupa, M., & Kaarniranta, K. (2021). Serum Levels of Plasmalogens and Fatty Acid Metabolites Associate with Retinal Microangiopathy in Participants from the Finnish Diabetes Prevention Study. Nutrients, 13(12), 4452. https://doi.org/10.3390/nu13124452