Abstract
(1) Background: Recent individual studies have demonstrated that consumption of ultra-processed food (UPF) may be related to type two diabetes mellitus (T2DM). We aimed to synthesize the results from these individual studies by conducting an updated systematic review and meta-analysis of observational studies evaluating the association between UPF consumption and the risk of T2DM. (2) Methods: A systematic search was conducted using ISI Web of Science, PubMed/MEDLINE and Scopus electronic databases from inception up to August 2021. Data were extracted from five studies (one cross-sectional study and four cohort studies, totaling 230,526 adults from four different countries). Risk ratios (RR) of pooled results were estimated using a random-effects model. (3) Results: Our results revealed that higher UPF consumption was significantly associated with an increased risk of T2DM (RR = 1.74; 95% CI: 1.36, 2.22; I2 = 68.9%; p < 0.001; n = 5). Linear dose-response analysis indicated that each 10% increase in UPF consumption (kcal/d) was associated with a 15% higher risk of T2DM (RR = 1.15; 95% CI: 1.06, 1.26; I2 = 86.0%; p < 0.001; n = 5) among adults. Non-linear dose-response analysis demonstrated a positive linear association between UPF consumption and T2DM (pnonlinearity = 0.13, pdose-response < 0.001; n = 5) among adults. (4) Conclusions: A higher intake of UPF was significantly associated with an increased risk of T2DM. However, underlying mechanisms remain unknown and future experimental studies are warranted.
1. Introduction
The growing incidence of chronic non-communicable diseases such as type two diabetes mellitus (T2DM) is the major healthcare concern worldwide [1]. According to reports from the International Diabetes Federation (IDF), approximately 6.28% (451 million) of the world population had T2DM in 2017, which resulted in more than 1 million deaths per year [2]. The prevalence of diabetes is projected to increase in the coming years, reaching 7079 and 7862 per 100,000 people in 2030 and 2040, respectively [3]. Across the globe, T2DM is one of the main causes of disability and reduced life expectancy [4]. Given the role of T2DM in the global burden of disease, there is an urgent need to investigate and address possible contributors to this disease, including modifiable lifestyle factors such as poor diet quality. Poor diet quality is characterized by low intakes of fruits, vegetables, whole grains, nuts and legumes and high intakes of added sugar, processed meats, refined grains and fried foods, which increase the risk of T2DM [5].
In the last half-century, the processing of foodstuffs has substantially evolved [6]. The NOVA food classification system, developed in 2009 by researchers from the University of São Paulo, is a relatively novel tool that categorizes foods based on the degree of processing. According to NOVA, foods and food products are classified into four groups, unprocessed or minimally processed food, processed culinary ingredients, processed food and ultra-processed foods (UPF). UPF is industrial formulations generated through compounds extracted, derived, or synthesized from food or food components [6,7,8]. They typically contain five or more ingredients made from high-yield food substances, including ingredients rarely used in the kitchen such as hydrogenated oil and fructose corn syrup and artificial food additives including sweeteners and colors emulsifiers and preservatives [6,7,8]. The products are inexpensive and shelf-stable formulations that are virtually imperishable, easily consumable and highly pleasurable in terms of their sensory properties; these are formulations that are ultimately displacing non-UPF [9,10]. UPF also typically contain nutrient profiles that are implicated in the risk of T2DM, such as high amounts of energy, trans- and saturated fat, sugar and salt, coupled with low levels of fiber and nutrient densities compared to non-UPF [6,8,11,12,13,14,15]. Concerns exist because of a global and upward trend in recent decades in the consumption of UPF in place of non-UPF, with a recent systematic review and meta-analysis of observational studies showing that UPF accounted for up to half of total daily energy [16]. Indeed, this review also demonstrated that increased consumption of UPF was associated with a higher risk of more than 10 chronic non-communicable diseases and premature death [16]. However, a meta-analysis on the association between UPF intake and risk of T2DM was not possible at the time of this review’s publication, due to a limited number of studies (n = 1). Since then, several individual studies have assessed this association. Therefore, the present study aimed to build on previous work by synthesizing the findings of observational studies investigating the association between UPF intake and the risk of T2DM.
2. Materials and Methods
The current systematic review and meta-analysis were conducted based on the 2020 PRISMA guidelines [17]. The study protocol was submitted and approved in the international prospective register of systematic reviews database (PROSPERO) under the registration number: CRD42021273097.
2.1. Literature Search and Selection
A systematic search was conducted using the following electronic databases: ISI Web of Science, PubMed/MEDLINE and Scopus, from database inception up to 10 August 2021 without restrictions for language. Search terms were a combination of free-text terms and controlled vocabulary related to UPF and diabetes, including the following that were applicable to a search via MELINE: ((“fast foods” [All Fields] OR “fast foods” [MeSH Terms] OR “ultra processed food *” [All Fields] OR “ultraprocessed food *” [All Fields] OR “ultra processed food *” [All Fields] OR “processed food *” [All Fields] OR “ultra-processed” [All Fields] OR “ultraprocessed” [All Fields] OR “ultra-processed” [All Fields] OR “NOVA” [All Fields] OR “nova food classif *” [All Fields] OR “nova food *” [All Fields] OR “nova food classif *” [All Fields] OR “NOVA food classification system” [All Fields]) AND (“Diabetes Mellitus” [MeSH Terms] OR “diabetes mellitus, type 2” [MeSH Terms] OR “Diabetes Mellitus” [All Fields] OR “diabetes” [All Fields] OR “T2DM” [All Fields] OR “type 2 diabetes mellitus” [All Fields])) (see Supplementary Table S2 for search terms used across the varied databases). The search strategy for grey literature consisted of a manual search of all original articles cited in the retrieved review articles.
2.2. Inclusion and Exclusion Criteria
The inclusion criteria consisted of the following: observational studies (cohort, case–control, or cross-sectional studies) undertaken in adults (≥18 years) that reported on the association between UPF consumption and the risk of T2DM, and provided effect estimates in the form of hazard ratio (HR), relative risk (RR), or odds ratios (OR) with 95% Confidence Interval (95% CI). Studies conducted in children and adolescents (<18 years), reviews, conference letters, notes, reports, short surveys and case reports were excluded. The population, intervention, comparator and outcome (PICO) description can be observed in Supplementary Table S1.
2.3. Study Selection
The assessment of titles and abstracts and the full-text review process for studies retrieved through our search strategy were undertaken separately by two researchers (S.M. and H.M.), with any disagreements about the inclusion and exclusion of selected studies decided by consensus or discussion. A standardized method was applied to the inclusion and exclusion criteria, which took into consideration the setting, population and evaluated exposure(s) and outcome(s) of individual studies.
2.4. Data Extraction
A standardized method was also applied to the data extraction process undertaken independently by two researchers (S.M. and H.M.) through Microsoft Office Excel 2013 (Microsoft Corporation, Redmond, WA, USA). The following parameters were extracted: (a) the first author’s name; (b) year of publication; (c) country and setting of the study; (d) number of participants, (e) age, (f) gender; (h) follow-up duration in cohort studies; (i) methods for evaluating exposure; (j) study main findings; and (k) covariates applied for adjustments in the multivariable analyses. Any discrepancies and disagreements about data extraction were determined by consensus or discussion with a third researcher (A.J.).
2.5. Quality Assessment
Two researchers (S.M. and H.M.) independently evaluated the quality of each study by applying the Newcastle–Ottawa Scale (NOS) [18]. The NOS was designed to examine the quality of non-randomized studies to fit for meta-analyses and assigns a maximum of nine points for the least risk of bias in three broad domains: Study group selection (four points); study group comparability (two points); and exposure and outcome ascertainment for case–control or cohort studies, respectively (three points). Disagreements that were resolved by the consensus outcome of the quality assessment for each study are reported in Table 1.

Table 1.
Characteristics of the included studies.
2.6. Data Synthesis and Statistical Analyses
We conducted statistical analyses with STATA version 14.0 (StataCorp, College Station, Lakeway, TX, USA) and SPSS version 25.0 (IBM, Armonk, NY, USA). The OR and its 95% CI were assumed as the effect size. The effect estimates reported by the original studies and considered for inclusion in our meta-analyses included OR and HR (and their 95% CI); HR was considered equal to RR [23]. The synthesized effect estimates for the current study were expressed as pooled OR with 95% CI. Due to anticipated heterogeneity between studies, the effect estimates were calculated using a weighted random-effects model using the DerSimonian–Laird approach [24]. First, we conducted a pairwise meta-analysis by combining the effect sizes for the highest compared with the lowest category of UPF consumption. Heterogeneity among the studies was examined by the Cochran Q and I-squared (I2) statistics. The I2 value was calculated as ([Q-df])/Q × 100%, Q being the χ2 value and df the corresponding degrees of freedom. The heterogeneity was considered significant where the Q statistics were significant (p < 0.01) or I2 > 50%; more specifically, low, moderate, high and extreme heterogeneity was defined according to the I2 statistics cut-offs of <25%, 25–50%, 50–75% and ˃75%, respectively. Sensitivity analysis was carried out by removing each study and recalculating the pooled effect estimates (i.e., one study-removed analysis). Publication bias was assessed by the visual inspection of funnel plots, formal testing by the Egger’s regression asymmetry and Begg’s rank correlation tests [25,26] and results were considered significant at p < 0.05.
We also conducted a dose-response meta-analysis to estimate the RRs for each 10% increment in UPF intake, according to the method introduced by Greenland and Orsini [27,28]. For this purpose, studies needed to report the number of cases and non-cases or person-years and median point of UPF across more than three categories of UPF consumption. Finally, we performed a one-stage linear mixed-effects meta-analysis to model the dose-response associations [29]. This method estimates the study-specific slope lines and combines them to obtain an average slope in a single stage. It includes studies with two categories of exposures in the dose-response analysis.
3. Results
3.1. Study Characteristics
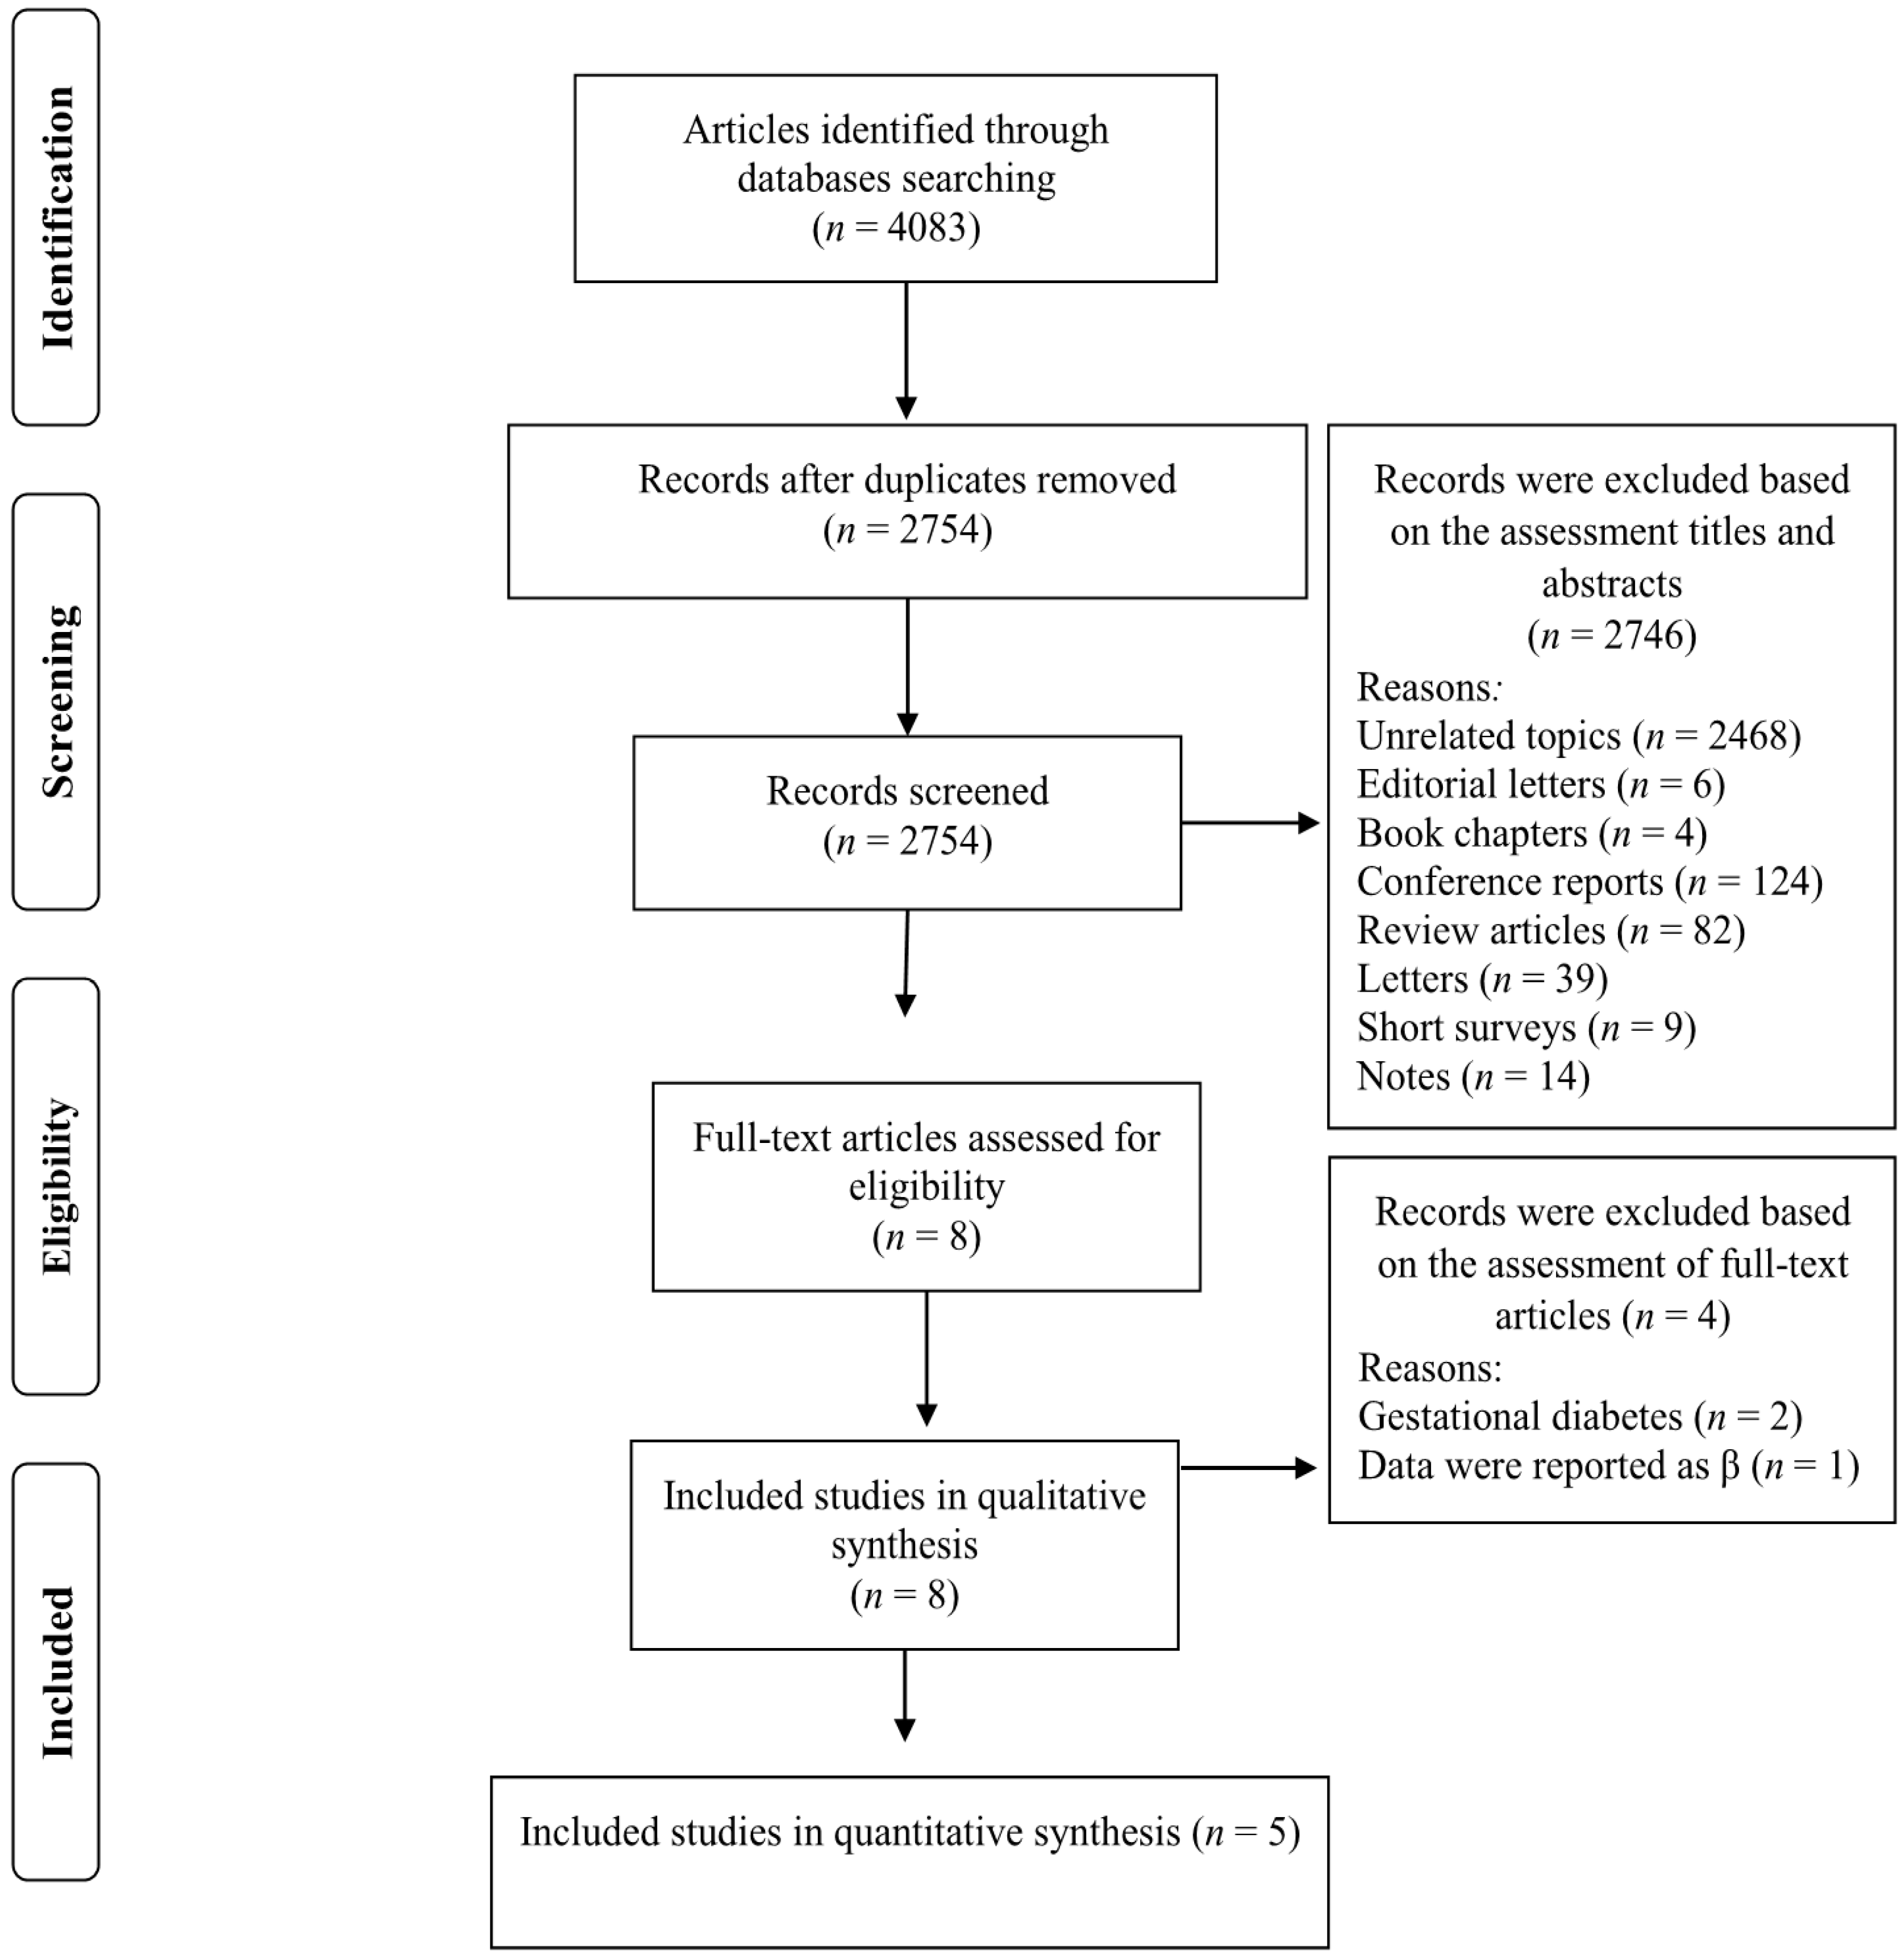
Our search strategy retrieved 4083 studies and, after removing duplicates records, 2754 studies remained. The titles and abstracts of these studies were assessed and 2745 records were subsequently excluded based on our inclusion criteria. Eight full-text articles were reviewed and three of these studies were omitted due to the following reasons: two studies were conducted on women with gestational diabetes [30,31] and one study reported relevant data as βeta coefficients [32] (Figure 1). Five studies met our inclusion criteria and were included in our meta-analysis [7,19,20,21,22]. The characteristics of the included studies are summarized in Table 1 and described below. Of the five included studies, four were prospective cohort study designs [7,19,20,22] and the other was cross-sectional [21]. The follow-up duration for the cohort studies ranged from 3.4 to 12.0 years. The selected studies were published between 2019 and 2021 and were carried out in France [19], Spain [22], Netherlands [20], United Kingdom [7] and Canada [21]. The study-specific, maximally adjusted OR, HR, or RR were extracted across the selected studies and were pooled for meta-analysis to evaluate the association between UPF consumption and the risk of T2DM in a total of 230,526 adults. The quality of studies assessed via the Newcastle–Ottawa Scale indicated that all of the included articles had high quality (≥8 stars) (Table 1).
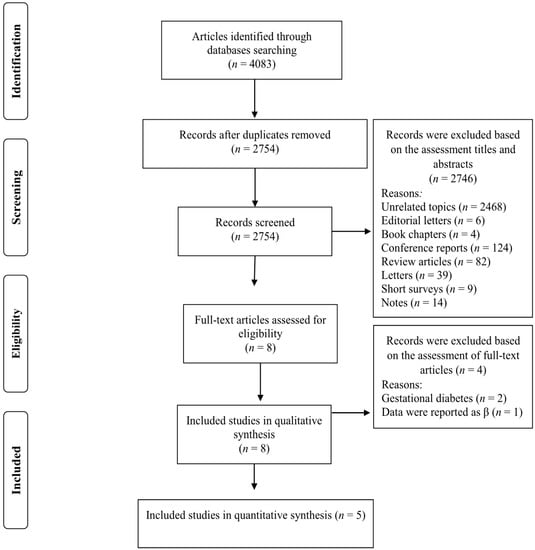
Figure 1.
Flow chart of the process of the study selection.
3.2. Ultra-Processed Food Consumption and T2DM Risk
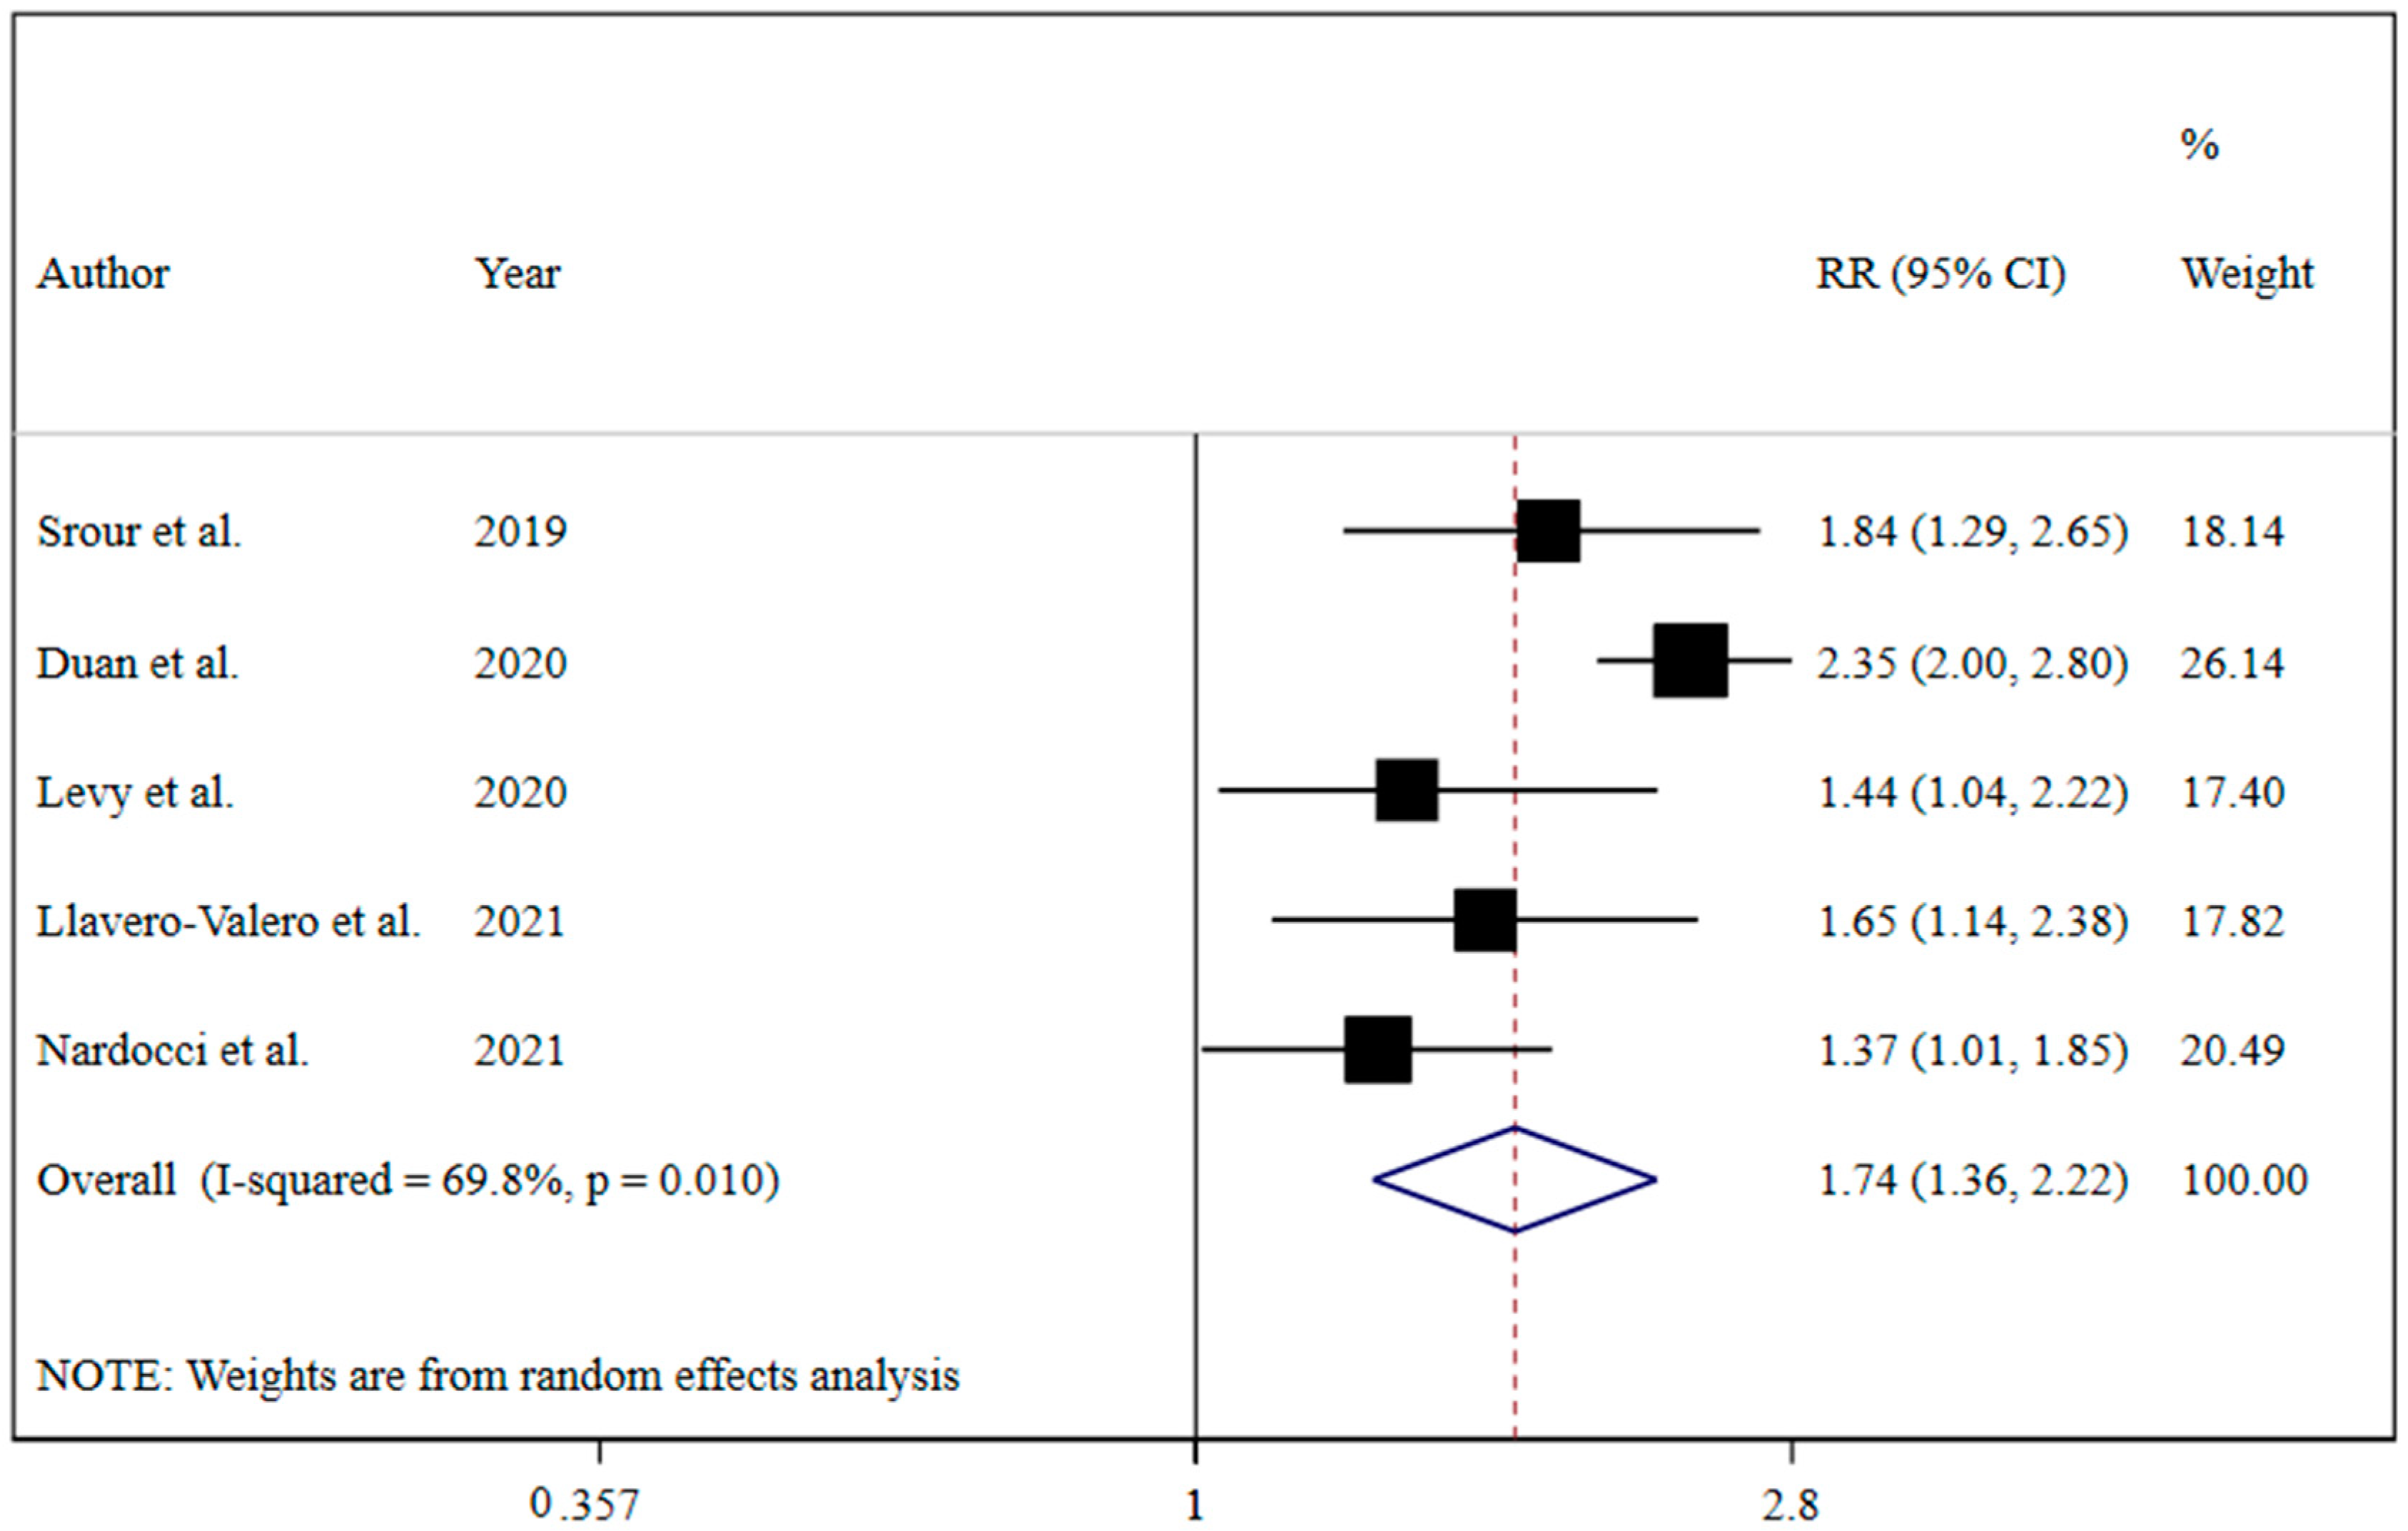
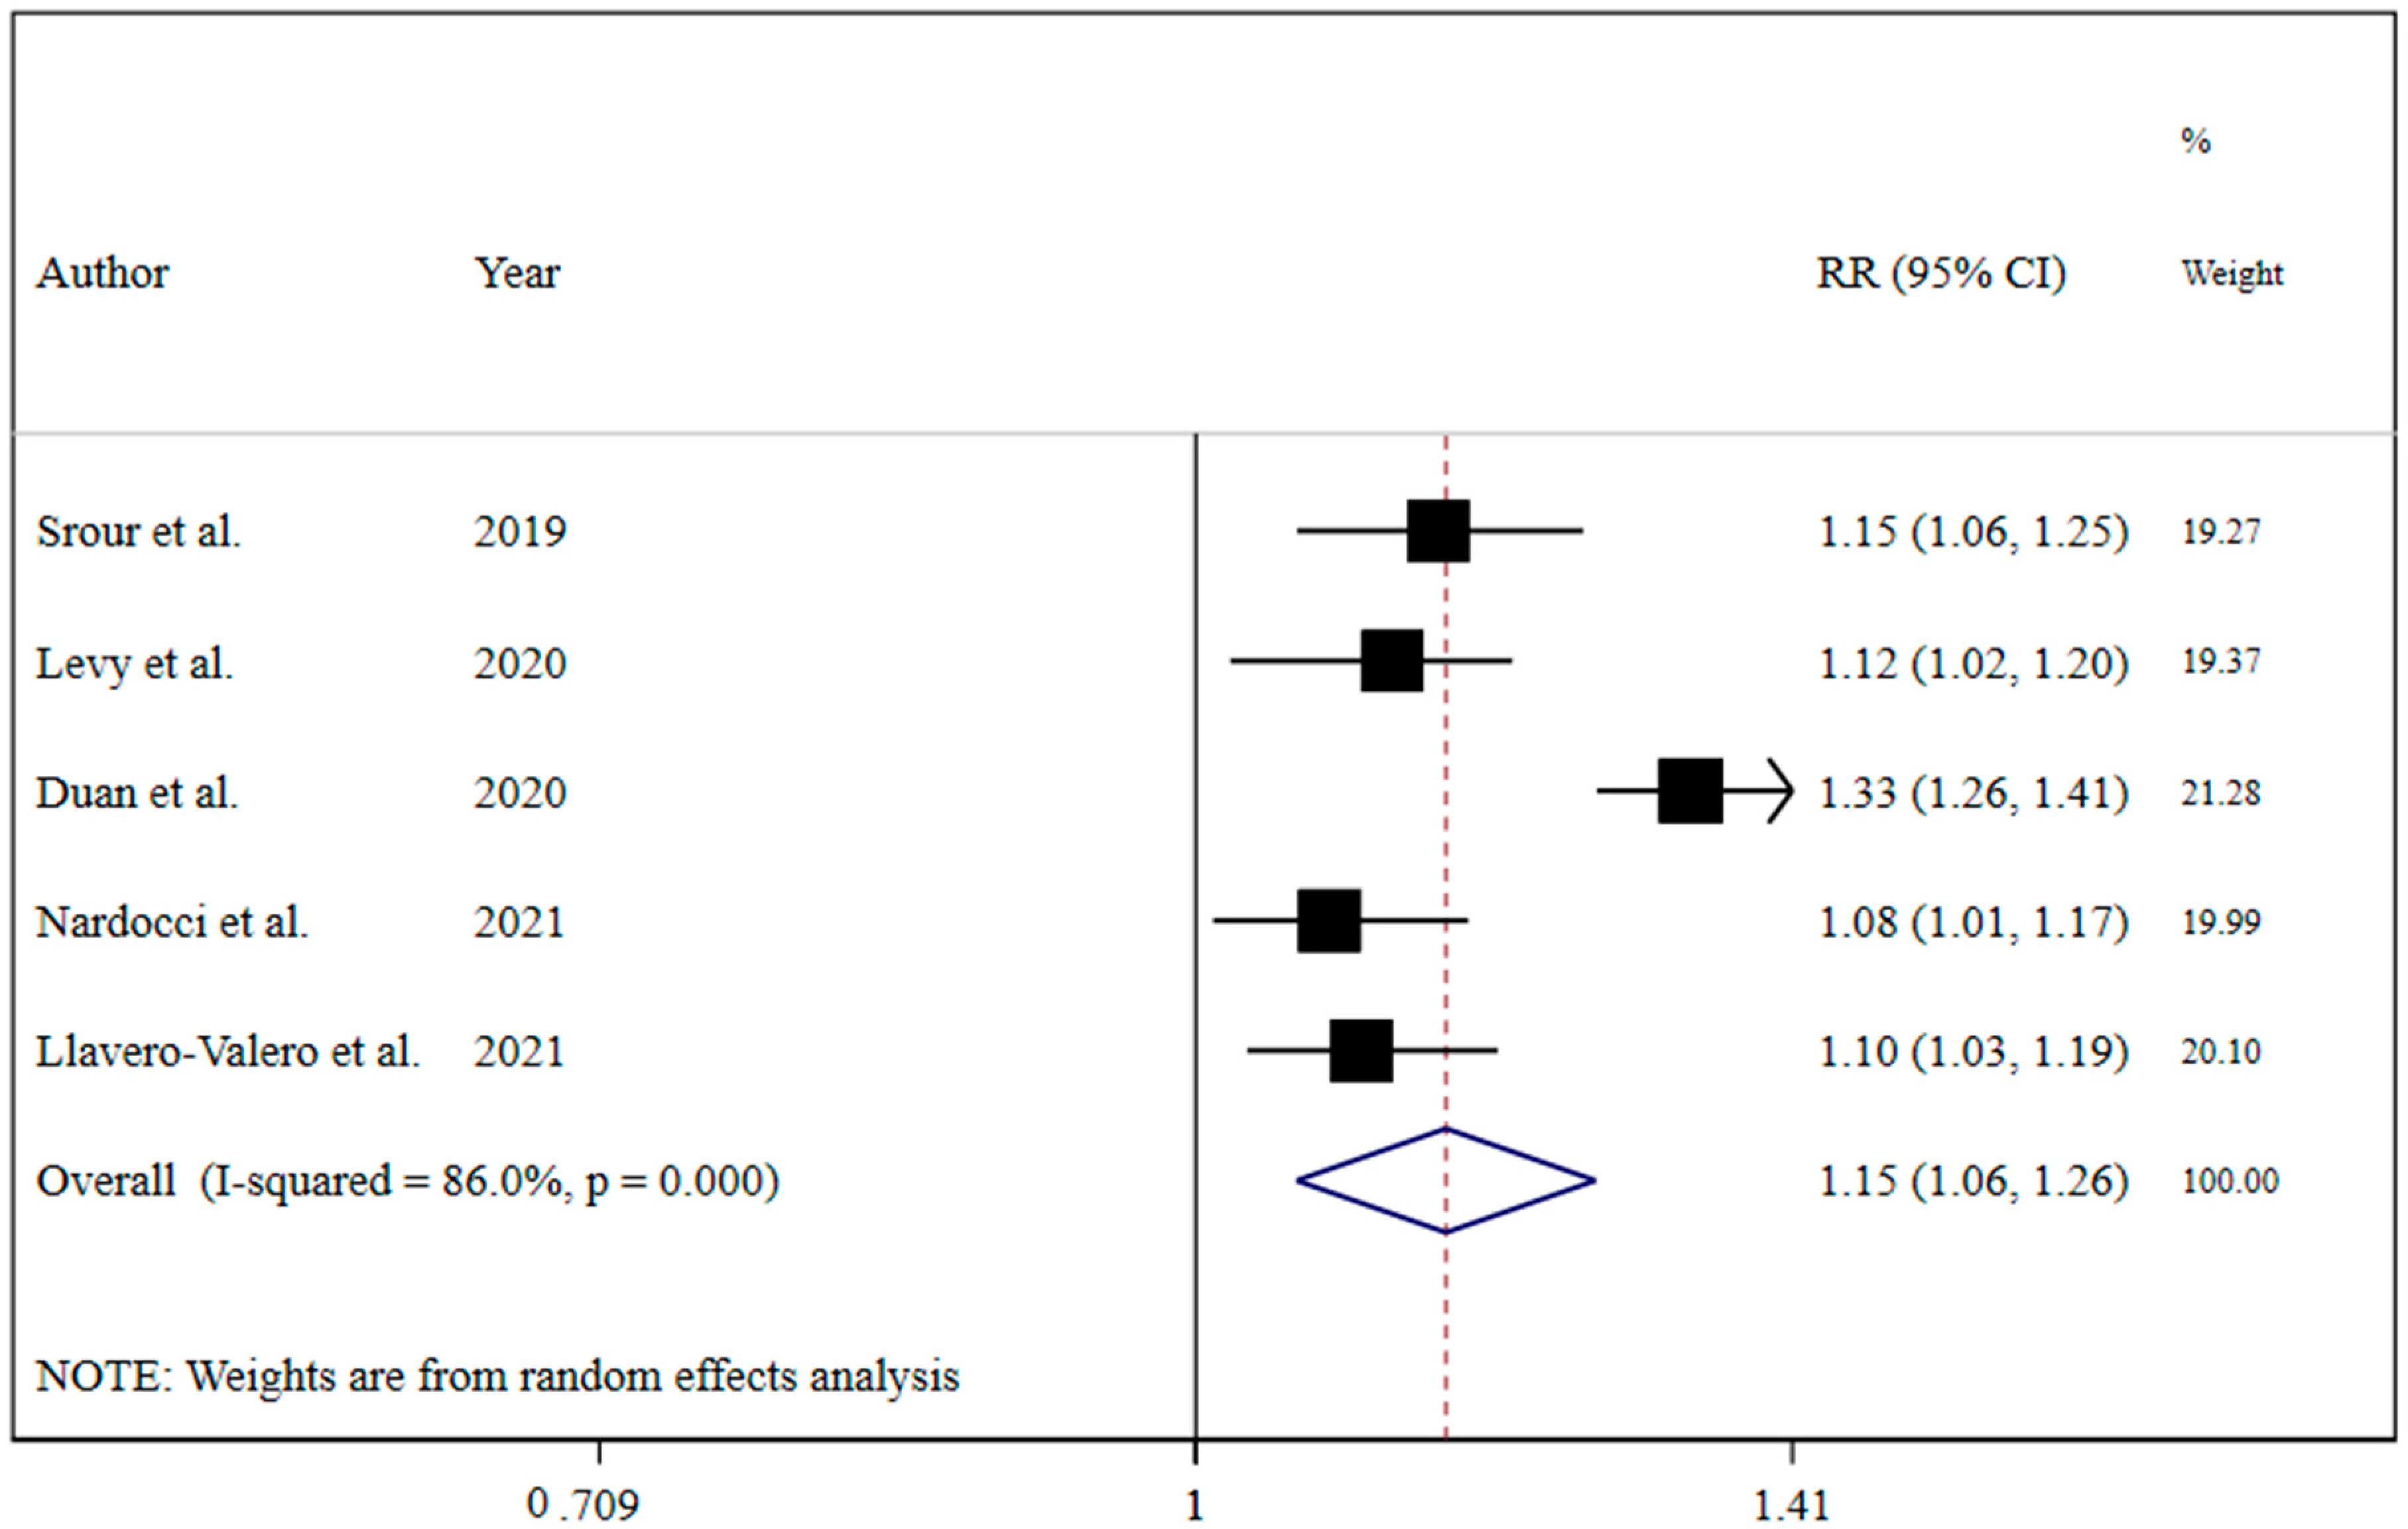
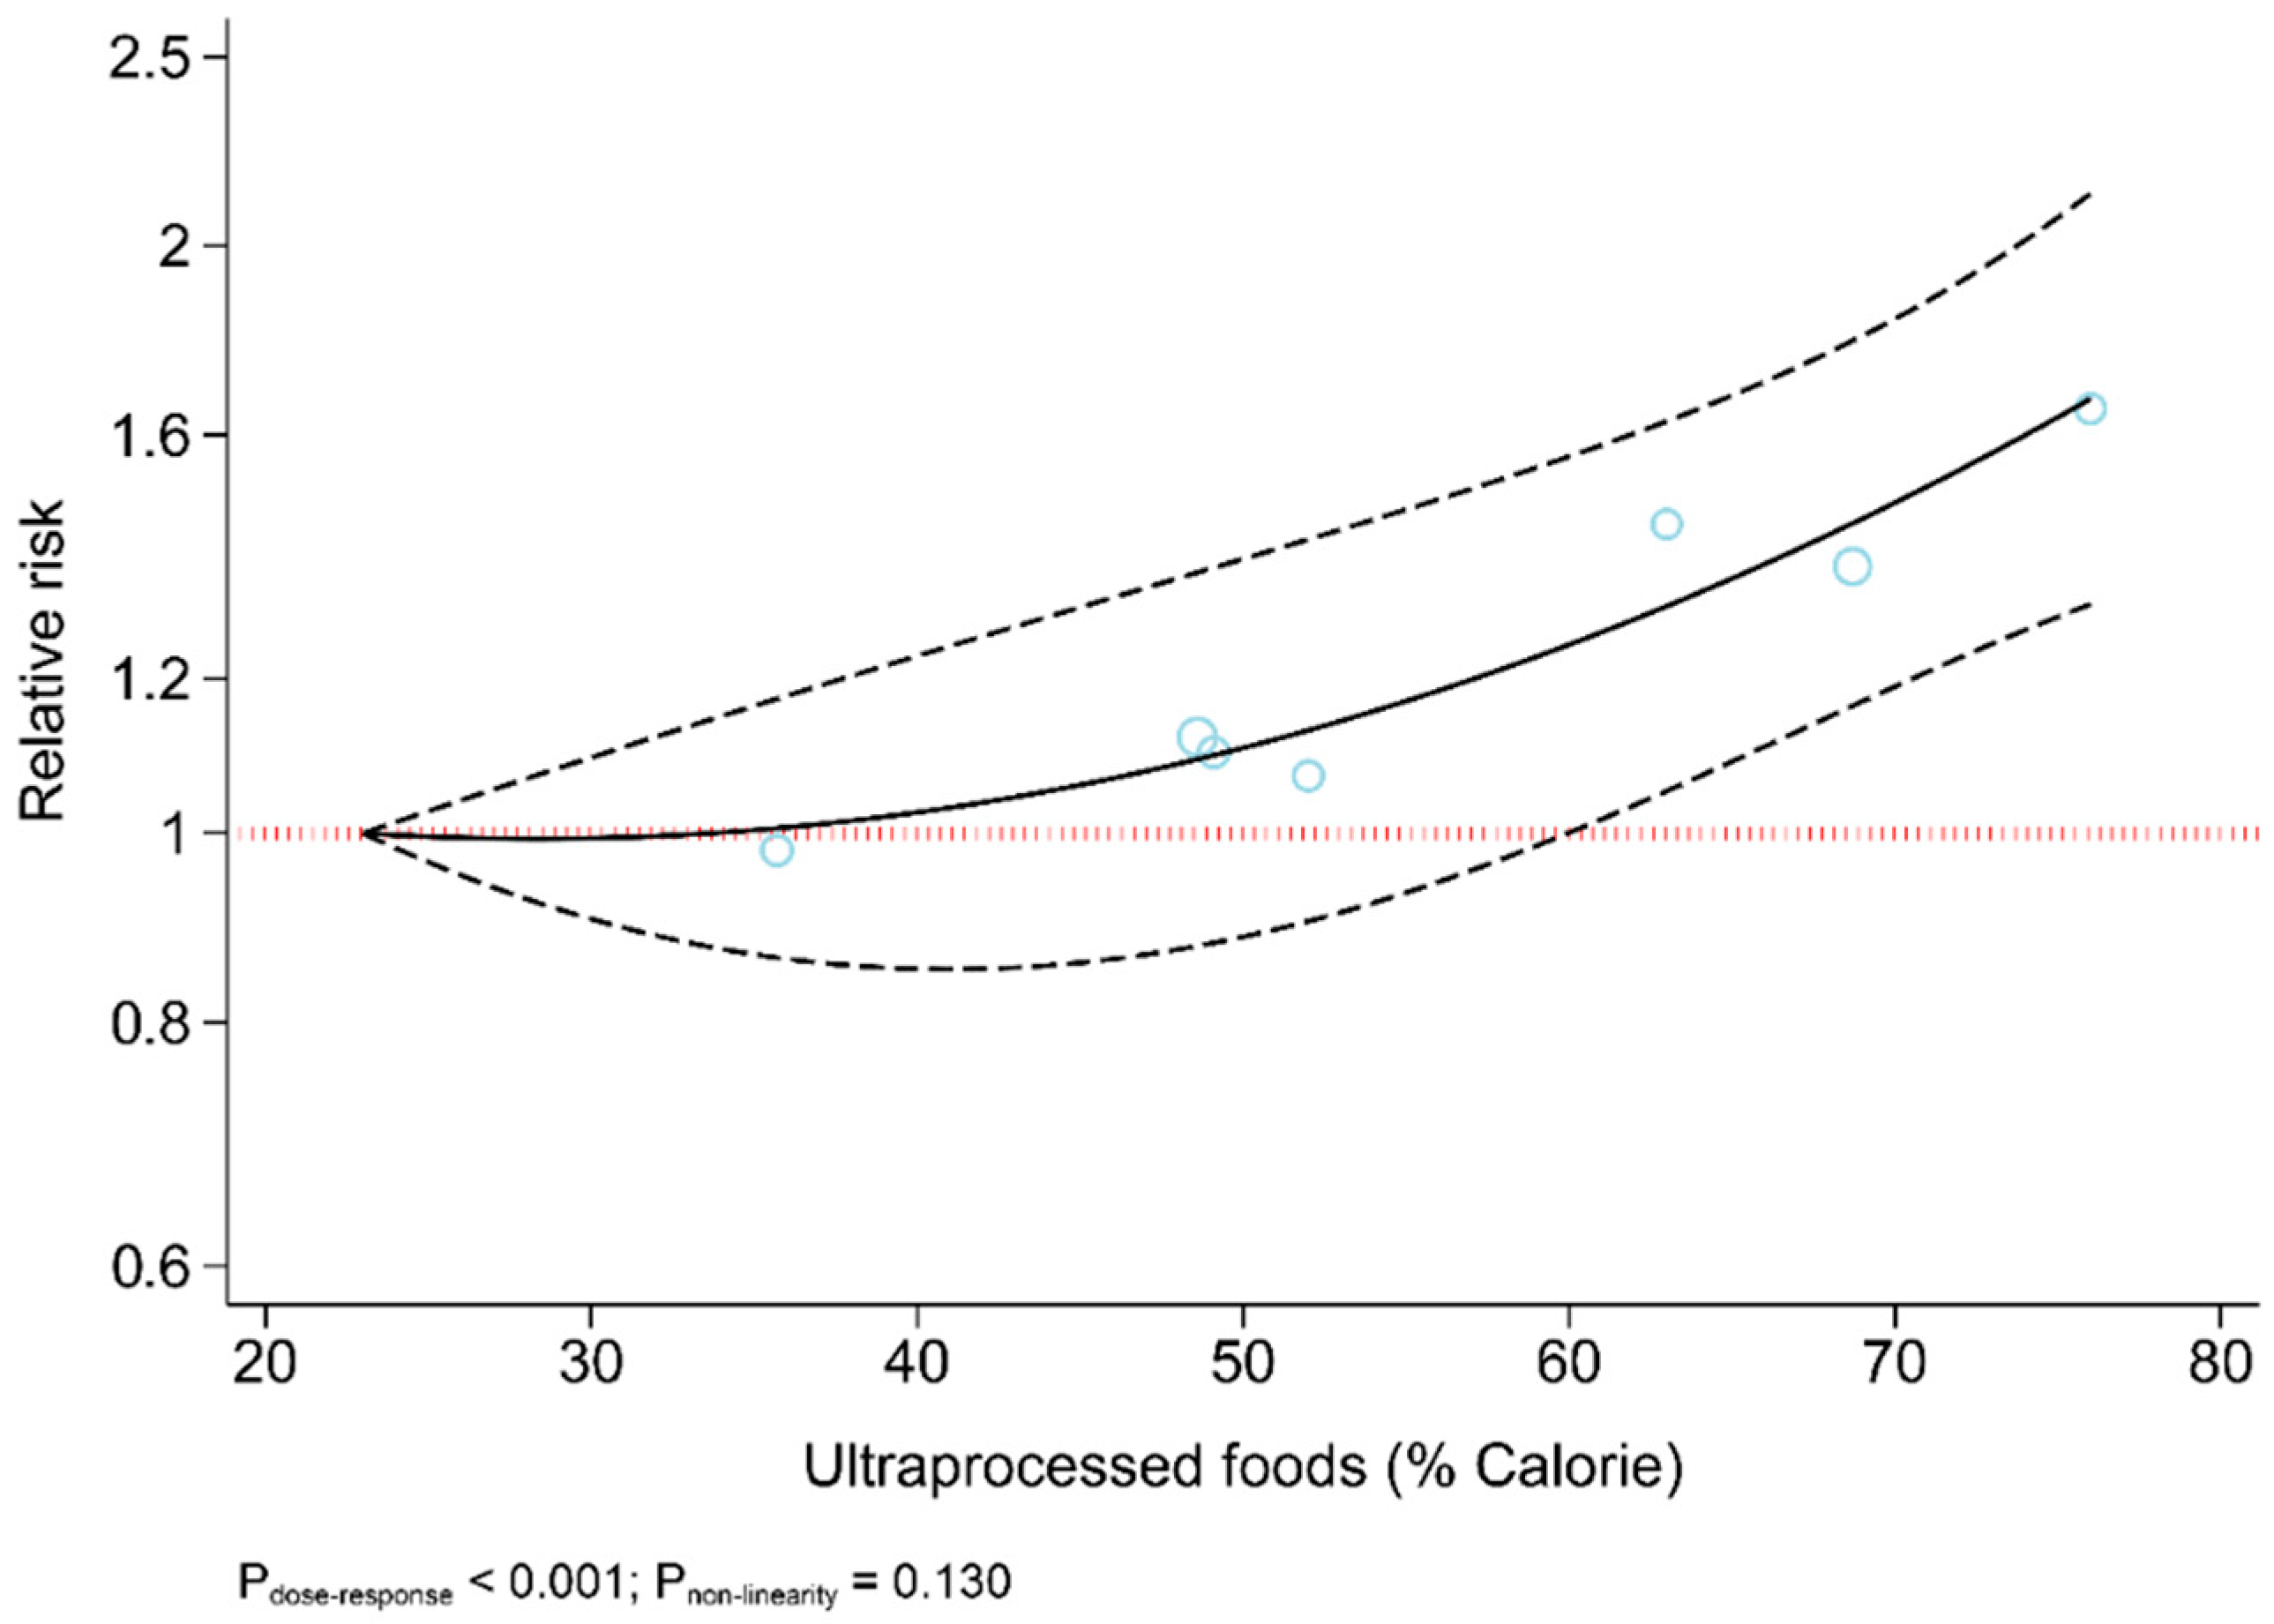
The results revealed that UPF consumption was associated with an increased risk of T2DM (RR = 1.74; 95% CI: 1.36, 2.22; I2 = 68.9%; p < 0.001) (Figure 2). Linear dose-response analysis indicated that each 10% increase in UPF consumption was associated with a 15% higher risk of T2DM (RR = 1.15; 95% CI: 1.06, 1.26; I2 = 86.0%; p < 0.001) among adults (Figure 3). Moreover, non-linear dose-response associations are shown in Figure 4. This analysis demonstrated a positive linear association between UPF consumption with T2DM (pnonlinearity = 0.13, pdose-response ≤ 0.001) among adults.
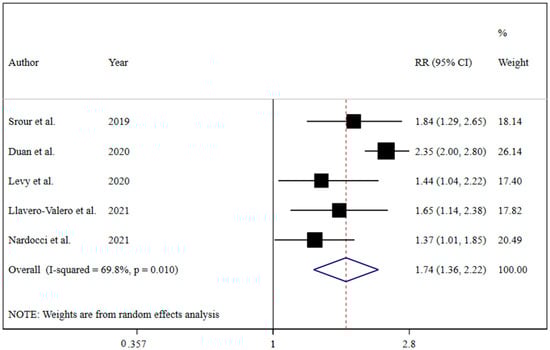
Figure 2.
Forest plots demonstrating OR and 95% CI of pooled results from the random-effects models to evaluate the relationship between ultra-processed food consumption and risk of type 2 diabetes [7,19,20,21,22].
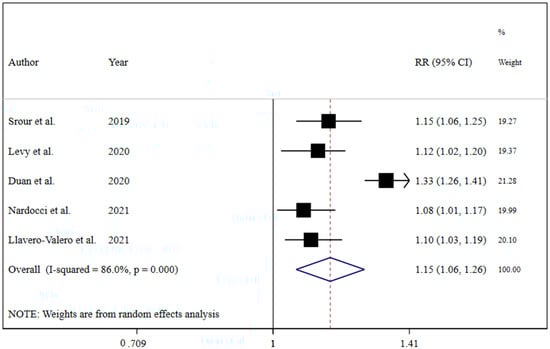
Figure 3.
Forest plots showing the linear dose-response meta-analysis of type 2 diabetes risk for each 10% increase in ultra-processed food consumption in daily calorie intake [7,19,20,21,22].
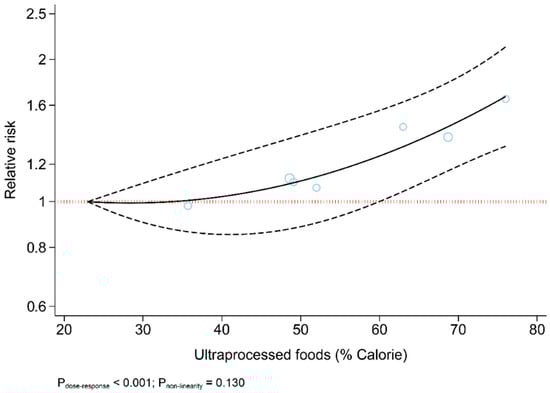
Figure 4.
Dose-response association between ultra-processed food consumption and risk of type 2 diabetes.
3.3. Sensitivity Analyses
Sensitivity analysis showed that the study results were not affected by any single study.
3.4. Publication Bias
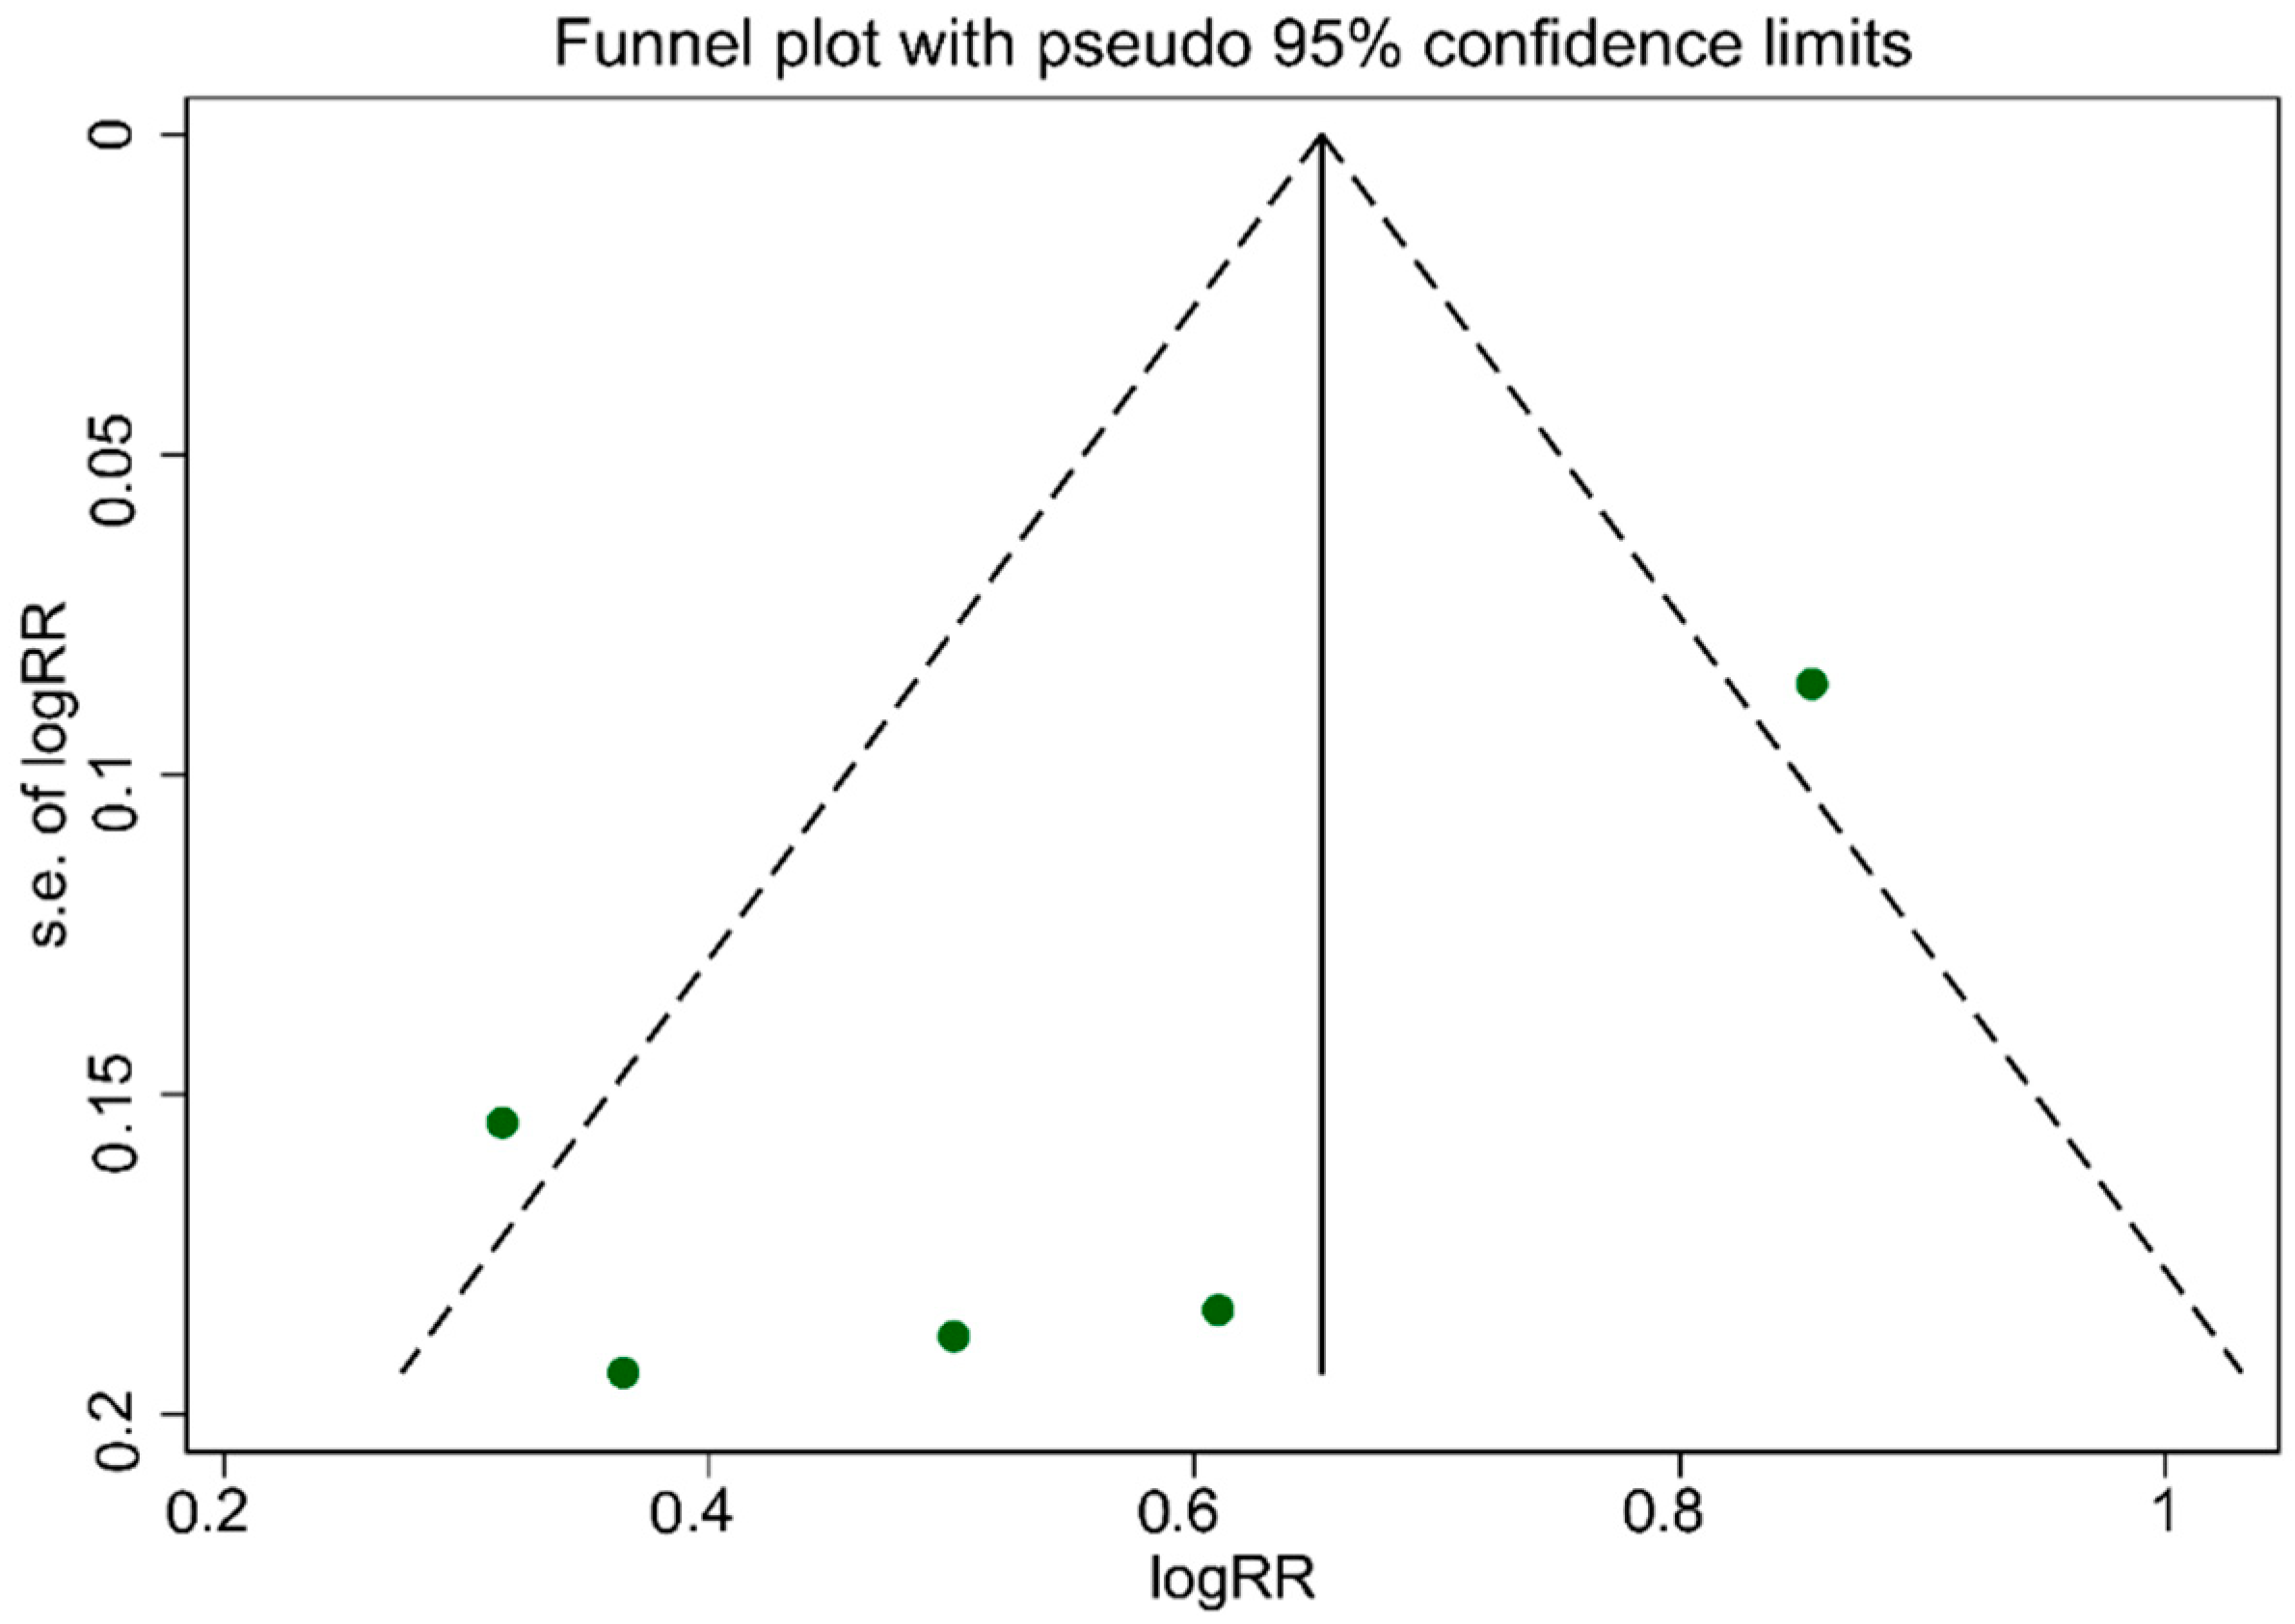
As illustrated in Figure 5, the funnel plot was asymmetrical, which indicated publication bias. The evidence of publication bias among studies associated with UPF consumption, which is related to an increased risk of T2DM, was confirmed according to Egger’s regression asymmetry (p = 0.007). However, Begg’s rank correlation tests (p = 0.463) result did not show publication bias among studies.

Figure 5.
Funnel plot for evaluation publication bias.
4. Discussion
This study demonstrated that higher UPF intake was associated with an increased risk of T2DM. Additionally, increasing the intake of processed foods by 10% leads to a 15% increase in the risk of T2DM. A linear positive association was found between UPF intake and the risk of T2DM. The results of each study included in our meta-analyses were in line with our findings; they each showed that increased UPF intake was associated with an increased odds of the prevalence or incidence of T2DM. Two cohort studies conducted in Netherlands and Brazil reported a 10% increase in UPF consumption was associated with a 33% and 13% enhanced risk of developing T2DM, respectively. The other two cohort studies conducted in Spain and the United Kingdom showed that participants who consumed a higher versus a lower amount of UPF had a 53% and 44% higher risk of developing T2DM [7,22]. The last study, which was cross-sectional by design and conducted in Canada, demonstrated that participants with higher versus lower UPF intakes had 37% higher odds of T2DM [21].
Our study adds to the body of literature showing that particular dietary factors such as those common to UPF may foster certain aberrant health states, including diabetes. These dietary factors mainly include low nutritional quality, which more specifically consists of higher intakes of sodium, energy, fat, sugar, lower amounts of fiber, protein, essential vitamins and minerals. Indeed, our findings are consistent with a recent meta-analysis of observational studies that showed individuals with diabetes had higher sodium status compared to individuals without diabetes [33]. The authors hypothesized that underlying mechanisms for this association might be linked with the notion that excessive salt intake (>2.3 g/d) may activate the aldose reductase–fructokinase pathway in the hypothalamus and liver [33]. This activation of the aldose reductase–fructokinase pathway may lead to increased endogenous production of fructose and enhanced leptin resistance, both of which are implicated in insulin resistance [34].
The typically scarce levels and limited types of dietary fiber in UPF may also play a role in the observed association between UPF intake and T2DM. Dietary fiber is often recommended as adjunctive nutritional therapy in diabetes management. This is because dietary fiber lowers postprandial hyperglycemia and increases satiety by delaying digestion and absorption of carbohydrates and improving blood lipids, body mass and inflammation [35]. In addition, dietary fiber may increase peripheral insulin sensitivity through short-chain fatty acids produced by the gut microbiota and their capacity to ferment fiber [36,37]. Some studies also demonstrated that UPFs might directly modulate gut microbiota configuration, richness and diversity [38,39].
Another possible mechanism relevant to the dietary properties of UPF that may partly explain the association between UPF intake and T2DM is the added sugar content of UPF. A study conducted in the United States showed that almost 90% of the added sugar consumed by people is obtained from UPF [40]. It is widely accepted that excess sugar consumption can indirectly promote insulin resistance and diabetes by increasing body mass. Refined sugars common to UPF such as fructose and sucrose may also not be easily absorbed and metabolized by the liver, leading to increased lipid accumulation in the liver and decreased insulin sensitivity [41]. Fructose may also increase inflammatory responses that have been evidenced in impaired hepatic insulin signaling [42]. Furthermore, UPF may affect the glycemic response of these foods, with UPF being linked with a higher glycemic response compared to less processed or minimally processed foods [43].
While nutrition research has historically targeted the role of dietary calorie intake and macro and micronutrients in T2DM, the relevance of the NOVA food classification is underscored when considering non-nutritional factors related to food processing. These include incorporating artificial additives into UPF and the manifestation and/or migration of chemical compounds that may occur due to the production process and the encasing of formulations with packaging made from synthetic materials, respectively. For example, food additives such as carrageenan as a thickener and stabilizer can interfere with insulin signaling and may cultivate insulin resistance [44]. UPF is also often packaged in synthetic substances that may be a source of endocrine hormone-disrupting chemicals, including bisphenol A (BPA) and phthalates, both of which are associated with diabetes [45]. More specifically, BPA may promote T2DM through several pathways, including increased body mass, insulin resistance, inflammation and oxidative stress, as well as impaired glucose homeostasis and disrupted beta-cell function [46]. A recent meta-analysis study showed a positive, significant association between exposure to chemical compounds commonly used in industrial processes and food packaging, such as phthalates and insulin resistance [47]. Other common neoformed contaminants associated with food ultra-processing include acrolein, acrylamide and polycyclic aromatic hydrocarbons (PAH). Cooking fat and starchy foods at high temperatures produce acrolein (an unsaturated aldehyde) and acrylamide, respectively [48]. Acrolein and Acrylamide exposure have been linked with an increased risk of insulin resistance and diabetes and cardiovascular disease [49,50,51]. Exposure to PAH may cause oxidative stress and inflammation implicated in the pathogenesis of insulin resistance and beta-cell dysfunction [52,53]. Indeed, a study conducted in National Health And Nutrition Examination Survey (for the years 2005–2014) showed a positive, cross-sectional association between PAH exposure and diabetes prevalence [54].
While the high quality of studies included in our review, as per the NOS that was applied, may indicate reliable evidence, results from our meta-analyses should be viewed considering the following limitations. Few original studies were included in our syntheses, where inadequate estimation of the between-study variance remains possible [55]. In addition, dietary records of individuals at the time of measurement in the cross-sectional study may not represent habitual dietary intake. However, the inclusion of four other longitudinal studies, particularly the repeated dietary measurements after ten years of follow-up utilized by the prospective SUN cohort study in Spain [22], with identical findings, suggest robust results. In addition, information bias cannot be ruled out considering dietary intake data were self-reported and given that the dietary intake tools used by the original studies were not developed to identify UPF. While the longitudinal studies included in our review underscore a temporal order of the observed associations that moves from the intake of UPF to the subsequent development of T2DM, the observational nature of these studies means that causation cannot be determined and residual confounding not be eliminated. Another limitation that may partly explain the high heterogeneity, as per the I2 > 50% for our meta-analyses, was the between-study difference in expressing UPF intake as the exposure variable. For example, UPF intake was expressed as a continuous-only variable in two studies (10% increments) [19,20] compared to a categorical variable in the other three studies, which were also defined by the original study samples rather than a predetermined cut-off point (tertiles [21,22] and quartiles [7]). UPF intake was also calculated as either absolute intake or a proportion (%) per day of energy (kilocalorie) [21] or weight (grams) [7,19,22], which may have contributed to the high heterogeneity. Moreover, the identifications of T2DM incidents and ultra-processed food intake among included studies were according to self-reported or nurse interview reports. Self-reported records are usually limited by underreporting ultra-processed food intake and misclassification of subjects resulting in a potential bias in the under-finding of T2DM cases. Ultimately, the ultra-processed classification includes various products; this exploratory strategy was not intended to focus on a particular food class or isolate a specific process/additive. Nonetheless, it let us examine general exposure to UPF and observe relations with T2DM resulting from cumulative intakes and possible effects of their components.
5. Conclusions
The current systematic review and dose-response meta-analysis was conducted to elucidate whether the UPF consumption has a potential association with the risk of T2DM. Observational studies undertaken in adults that met inclusion criteria were included in the final analysis. In summary, our outcomes suggested that higher UPF consumption may be significantly associated with an increased risk of T2DM. In addition, the linear dose-response analysis showed that each 10% increase in UPF consumption (kcal/d) was associated with a 15% higher risk of T2DM among adults. Non-linear dose-response analysis also demonstrated a positive linear association between UPF consumption and T2DM among adults. In terms of directions for future research, further studies could investigate the following points. Current tools available for estimating UPF intakes are subjective (food records, FFQ, 24 h recalls, diet history with interviewer-assisted data collection), rather limited in scope, with a majority evaluating only one dimension (i.e., cumulative UPF intakes). To more precisely estimate the actual burden of UPF intakes, new tools should be adapted or progressed to evaluate all UPF consumption dimensions, namely food class, UPF foods specific components, their effects on health and specific processes or additives. The new technology-based dietary assessment methods (web-based and mobile device applications) may help more precise UPF intakes evaluation. However, underlying mechanisms remain unknown. In future studies, evaluation of associated variables including lifestyle, demographic, genetic background, socioeconomic and clinical factors, as well as differences in treatment, can accelerate the finding of possible mechanisms. Due to identified limitations, to better understand the association between UPF consumption and the risk of T2DM, more prospective cohort studies with further extended follow-up periods are necessary.
Supplementary Materials
The following are available online at https://www.mdpi.com/article/10.3390/nu13124410/s1, Table S1: Description of population, intervention, comparator and outcome (PICO). Table S2: Search strategies including the key terms and the queries for each database.
Author Contributions
S.M. (Sajjad Moradi) conceived and designed research. S.M. (Sanaz Mehrabani) and H.M. conducted experiments. S.M. (Sajjad Moradi) contributed new reagents or analytical tools. A.J. and S.M. (Sajjad Moradi) analyzed data. S.M. (Sajjad Moradi), S.M. (Sanaz Mehrabani), M.a.H.K. and O.A. wrote the manuscript. S.M. (Sajjad Moradi), M.M.L., R.B. and K.S. revised the manuscript. All authors have read and agreed to the published version of the manuscript.
Funding
This research received no external funding.
Conflicts of Interest
The authors declare no conflict of interest.
References
- Lin, X.; Xu, Y.; Pan, X.; Xu, J.; Ding, Y.; Sun, X.; Song, X.; Ren, Y.; Shan, P.F. Global, regional, and national burden and trend of diabetes in 195 countries and territories: An analysis from 1990 to 2025. Sci. Rep. 2020, 10, 14790. [Google Scholar] [CrossRef] [PubMed]
- Cho, N.H.; Shaw, J.E.; Karuranga, S.; Huang, Y.; da Rocha Fernandes, J.D.; Ohlrogge, A.W.; Malanda, B. IDF Diabetes Atlas: Global estimates of diabetes prevalence for 2017 and projections for 2045. Diabetes Res. Clin. Pract. 2018, 138, 271–281. [Google Scholar] [CrossRef] [PubMed]
- Khan, M.A.B.; Hashim, M.J.; King, J.K.; Govender, R.D.; Mustafa, H.; Al Kaabi, J. Epidemiology of Type 2 Diabetes–Global Burden of Disease and Forecasted Trends. J. Epidemiol. Glob. Health 2020, 10, 107–111. [Google Scholar] [CrossRef] [PubMed] [Green Version]
- Chen, H.; Chen, G.; Zheng, X.; Guo, Y. Contribution of specific diseases and injuries to changes in health adjusted life expectancy in 187 countries from 1990 to 2013: Retrospective observational study. BMJ 2019, 364, l969. [Google Scholar] [CrossRef] [Green Version]
- Wang, Z.; Siega-Riz, A.; Gordon-Larsen, P.; Cai, J.; Adair, L.; Zhang, B.; Popkin, B. Diet quality and its association with type 2 diabetes and major cardiometabolic risk factors among adults in China. Nutr. Metab. Cardiovasc. Dis. 2018, 28, 987–1001. [Google Scholar] [CrossRef]
- Moubarac, J.-C.; Batal, M.; Louzada, M.L.; Martinez Steele, E.; Monteiro, C.A. Consumption of Ultra-Processed Foods Predicts Diet Quality in Canada. Appetite 2017, 108, 512–520. [Google Scholar] [CrossRef]
- Levy, R.B.; Rauber, F.; Chang, K.; da Costa Louzada, M.L.; Monteiro, C.A.; Millett, C.; Vamos, E.P. Ultra-Processed Food Consumption and Type 2 Diabetes Incidence: A Prospective Cohort Study. Clin. Nutr. 2020, 40, 3608–3614. [Google Scholar] [CrossRef]
- Louzada, M.L.D.C.; Martins, A.P.B.; Canella, D.S.; Baraldi, L.G.; Levy, R.B.; Claro, R.M.; Moubarac, J.C.; Cannon, G.; Monteiro, C.A. Ultra-processed foods and the nutritional dietary profile in Brazil. Rev. Saude Publica 2015, 49, 38. [Google Scholar] [CrossRef]
- Monteiro, C.A.; Cannon, G.; Levy, R.B.; Moubarac, J.-C.; Louzada, M.L.C.; Rauber, F.; Khandpur, N.; Cediel, G.; Neri, D.; Martinez-Steele, E.; et al. Ultra-Processed Foods: What They Are and How to Identify Them. Public Health Nutr. 2019, 22, 936–941. [Google Scholar] [CrossRef]
- Baker, P.; Machado, P.; Santos, T.; Sievert, K.; Backholer, K.; Hadjikakou, M.; Russell, C.; Huse, O.; Bell, C.; Scrinis, G.; et al. Ultra-processed foods and the nutrition transition: Global, regional and national trends, food systems transformations and political economy drivers. Obes. Rev. 2020, 21, e13126. [Google Scholar] [CrossRef]
- Cediel, G.; Reyes, M.; Da Costa Louzada, M.L.; Steele, E.M.; Monteiro, C.A.; Corvalan, C.; Uauy, R. Ultra-processed foods and added sugars in the Chilean diet (2010). Public Health Nutr. 2017, 21, 125–133. [Google Scholar] [CrossRef] [PubMed] [Green Version]
- Louzada, M.L.D.C.; Martins, A.P.B.; Canella, D.S.; Baraldi, L.G.; Levy, R.B.; Claro, R.M.; Moubarac, J.C.; Cannon, G.; Monteiro, C.A. Impact of ultra-processed foods on micronutrient content in the Brazilian diet. Rev. Saude Publica 2015, 49. [Google Scholar] [CrossRef] [PubMed]
- Luiten, C.M.; Steenhuis, I.H.; Eyles, H.; Ni Mhurchu, C.; Waterlander, W.E. Ultra-processed foods have the worst nutrient profile, yet they are the most available packaged products in a sample of New Zealand supermarkets—CORRIGENDUM. Public Health Nutr. 2016, 19, 539. [Google Scholar] [CrossRef] [PubMed] [Green Version]
- Adams, J.M.; White, M. Characterisation of UK diets according to degree of food processing and associations with socio-demographics and obesity: Cross-sectional analysis of UK National Diet and Nutrition Survey (2008–2012). Int. J. Behav. Nutr. Phys. Act. 2015, 12, 160. [Google Scholar] [CrossRef] [PubMed] [Green Version]
- Poti, J.M.; Mendez, M.A.; Ng, S.W.; Popkin, B.M. Is the degree of food processing and convenience linked with the nutritional quality of foods purchased by US households? Am. J. Clin. Nutr. 2015, 101, 1251–1262. [Google Scholar] [CrossRef] [PubMed] [Green Version]
- Lane, M.M.; Davis, J.A.; Beattie, S.; Gómez-Donoso, C.; Loughman, A.; O’Neil, A.; Jacka, F.; Berk, M.; Page, R.; Marx, W.; et al. Ultraprocessed Food and Chronic Noncommunicable Diseases: A Systematic Review and Meta-Analysis of 43 Observational Studies. Obes. Rev. 2021, 22, e13146. [Google Scholar] [CrossRef] [PubMed]
- Page, M.J.; McKenzie, J.E.; Bossuyt, P.M.; Boutron, I.; Hoffmann, T.C.; Mulrow, C.D.; Shamseer, L.; Tetzlaff, J.M.; Akl, E.A.; Brennan, S.E.; et al. The PRISMA 2020 statement: An updated guideline for reporting systematic reviews. BMJ 2021, 372, n71. [Google Scholar] [CrossRef]
- Modesti, P.A.; Reboldi, G.; Cappuccio, F.P.; Agyemang, C.; Remuzzi, G.; Rapi, S.; Perruolo, E.; Parati, G. ESH Working Group on CV Risk in Low Resource Settings Panethnic Differences in Blood Pressure in Europe: A Systematic Review and Meta-Analysis. PLoS ONE 2016, 11, e0147601. [Google Scholar] [CrossRef] [Green Version]
- Srour, B.; Fezeu, L.K.; Kesse-Guyot, E.; Allès, B.; Debras, C.; Druesne-Pecollo, N.; Chazelas, E.; Deschasaux, M.; Hercberg, S.; Galan, P.; et al. Ultraprocessed food consumption and risk of type 2 diabetes among participants of the NutriNet-Sante prospective cohort. JAMA Intern Med. 2019, 180, 283–291. [Google Scholar] [CrossRef]
- Duan, M.-J.; Vinke, P.C.; Navis, G.; Corpeleijn, E.; Dekker, L. Associations of Ultra-Processed Food and Its Underlying Consumption Patterns With Incident Type 2 Diabetes: The Lifelines Cohort Study. Curr. Dev. Nutr. 2021, 5, 402. [Google Scholar] [CrossRef]
- Nardocci, M.; Polsky, J.Y.; Moubarac, J.-C. Consumption of ultra-processed foods is associated with obesity, diabetes and hypertension in Canadian adults. Can. J. Public Health 2021, 112, 421–429. [Google Scholar] [CrossRef] [PubMed]
- Llavero-Valero, M.; Martín, J.E.-S.; Martínez-González, M.A.; Basterra-Gortari, F.J.; de la Fuente-Arrillaga, C.; Bes-Rastrollo, M. Ultra-processed foods and type-2 diabetes risk in the SUN project: A prospective cohort study. Clin. Nutr. 2021, 40, 2817–2824. [Google Scholar] [CrossRef]
- Symons, M.; Moore, D. Hazard rate ratio and prospective epidemiological studies. J. Clin. Epidemiol. 2002, 55, 893–899. [Google Scholar] [CrossRef]
- DerSimonian, R.; Laird, N. Meta-analysis in clinical trials. Control. Clin. Trials 1986, 7, 77–88. [Google Scholar] [CrossRef]
- Begg, C.B.; Mazumdar, M. Operating characteristics of a rank correlation test for publication bias. Biometrics 1994, 50, 1088–1101. [Google Scholar] [CrossRef]
- Egger, M.; Smith, G.D.; Schneider, M.; Minder, C. Bias in meta-analysis detected by a simple, graphical test. BMJ 1997, 315, 629–634. [Google Scholar] [CrossRef] [Green Version]
- Greenland, S.; Longnecker, M. Methods for Trend Estimation from Summarized Dose-Response Data, with Applications to Meta-Analysis. Am. J. Epidemiol. 1992, 135, 1301–1309. [Google Scholar] [CrossRef] [PubMed]
- Orsini, N.; Bellocco, R.; Greenland, S. Generalized Least Squares for Trend Estimation of Summarized Dose-Response Data. Stata J. Promot. Commun. Stat. Stata 2006, 6, 40–57. [Google Scholar] [CrossRef] [Green Version]
- Crippa, A.; Discacciati, A.; Bottai, M.; Spiegelman, D.; Orsini, N. One-stage dose-response meta-analysis for aggregated data. Stat. Methods Med. Res. 2019, 28, 1579–1596. [Google Scholar] [CrossRef] [PubMed]
- Sartorelli, D.S.; Crivellenti, L.C.; Zuccolotto, D.C.C.; Franco, L.J. Relationship between minimally and ultra-processed food intake during pregnancy with obesity and gestational diabetes mellitus. Cad. Saúde Pública 2019, 35, e00049318. [Google Scholar] [CrossRef]
- Leone, A.; Martínez-González, M.; Craig, W.; Fresán, U.; Gómez-Donoso, C.; Bes-Rastrollo, M. Pre-Gestational Consumption of Ultra-Processed Foods and Risk of Gestational Diabetes in a Mediterranean Cohort. The SUN Project. Nutrients 2021, 13, 2202. [Google Scholar] [CrossRef] [PubMed]
- Silva, C.F.M.; Saunders, C.; Peres, W.; Folino, B.; Kamel, T.; dos Santos, M.S.; Padilha, P. Effect of ultra-processed foods consumption on glycemic control and gestational weight gain in pregnant with pregestational diabetes mellitus using carbohydrate counting. PeerJ 2021, 9, e10514. [Google Scholar] [CrossRef]
- Kolahdouz-Mohammadi, R.; Soltani, S.; Clayton, Z.S.; Salehi-Abargouei, A. Sodium status is associated with type 2 diabetes mellitus: A systematic review and meta-analysis of observational studies. Eur. J. Nutr. 2021, 60, 3543–3565. [Google Scholar] [CrossRef]
- Lanaspa, M.A.; Kuwabara, M.; Andres-Hernando, A.; Li, N.; Cicerchi, C.; Jensen, T.; Orlicky, D.J.; Roncal-Jimenez, C.A.; Ishimoto, T.; Nakagawa, T.; et al. High salt intake causes leptin resistance and obesity in mice by stimulating endogenous fructose production and metabolism. Proc. Natl. Acad. Sci. USA 2018, 115, 3138–3143. [Google Scholar] [CrossRef] [PubMed] [Green Version]
- Reynolds, A.N.; Akerman, A.P.; Mann, J. Dietary fibre and whole grains in diabetes management: Systematic review and meta-analyses. PLoS Med. 2020, 17, e1003053. [Google Scholar] [CrossRef] [PubMed]
- Robertson, M.D.; Wright, J.W.; Loizon, E.; Debard, C.; Vidal, H.; Shojaee-Moradie, F.; Russell-Jones, D.; Umpleby, A.M. Insulin-Sensitizing Effects on Muscle and Adipose Tissue after Dietary Fiber Intake in Men and Women with Metabolic Syndrome. J. Clin. Endocrinol. Metab. 2012, 97, 3326–3332. [Google Scholar] [CrossRef] [PubMed] [Green Version]
- Post, R.E.; Mainous, A.G., 3rd; King, D.E.; Simpson, K.N. Dietary fiber for the treatment of type 2 diabetes mellitus: A meta-analysis. J. Am. Board Fam. Med. 2012, 25, 16–23. [Google Scholar] [CrossRef] [PubMed] [Green Version]
- Cuevas-Sierra, A.; Milagro, F.; Aranaz, P.; Martínez, J.; Riezu-Boj, J. Gut Microbiota Differences According to Ultra-Processed Food Consumption in a Spanish Population. Nutrients 2021, 13, 2710. [Google Scholar] [CrossRef]
- Zinöcker, M.K.; Lindseth, I.A. The Western Diet–Microbiome-Host Interaction and Its Role in Metabolic Disease. Nutrients 2018, 10, 365. [Google Scholar] [CrossRef] [PubMed] [Green Version]
- Martínez Steele, E.; Baraldi, L.G.; Louzada, M.L.d.C.; Moubarac, J.-C.; Mozaffarian, D.; Monteiro, C.A. Ultra-processed foods and added sugars in the US diet: Evidence from a nationally representative cross-sectional study. BMJ Open 2016, 6, e009892. [Google Scholar] [CrossRef] [PubMed] [Green Version]
- Stanhope, K.L. Sugar consumption, metabolic disease and obesity: The state of the controversy. Crit. Rev. Clin. Lab. Sci. 2016, 53, 52–67. [Google Scholar] [CrossRef] [PubMed]
- Cox, C.L.; Stanhope, K.L.; Schwarz, J.M.; Graham, J.; Hatcher, B.; Griffen, S.C.; Bremer, A.A.; Berglund, L.; McGahan, J.P.; Keim, N.L.; et al. Circulating Concentrations of Monocyte Chemoattractant Protein-1, Plasminogen Activator Inhibitor-1, and Soluble Leukocyte Adhesion Molecule-1 in Overweight/Obese Men and Women Consuming Fructose- or Glucose-Sweetened Beverages for 10 Weeks. J. Clin. Endocrinol. Metab. 2011, 96, E2034–E2038. [Google Scholar] [CrossRef] [PubMed] [Green Version]
- Fardet, A. Minimally processed foods are more satiating and less hyperglycemic than ultra-processed foods: A preliminary study with 98 ready-to-eat foods. Food Funct. 2016, 7, 2338–2346. [Google Scholar] [CrossRef]
- Paula Neto, H.A.; Ausina, P.; Gomez, L.S.; Leandro, J.G.; Zancan, P.; Sola-Penna, M. Effects of Food Additives on Immune Cells As Contributors to Body Weight Gain and Immune-Mediated Metabolic Dysregulation. Front. Immunol. 2017, 8, 1478. [Google Scholar] [CrossRef] [PubMed] [Green Version]
- Martínez Steele, E.; Khandpur, N.; da Costa Louzada, M.L.; Monteiro, C.A. Association between dietary contribution of ultra-processed foods and urinary concentrations of phthalates and bisphenol in a nationally representative sample of the US population aged 6 years and older. PLoS ONE 2020, 15, e0236738. [Google Scholar] [CrossRef] [PubMed]
- Takeuchi, T.; Tsutsumi, O.; Ikezuki, Y.; Takai, Y.; Taketani, Y. Positive Relationship between Androgen and the Endocrine Disruptor, Bisphenol A, in Normal Women and Women with Ovarian Dysfunction. Endocr. J. 2004, 51, 165–169. [Google Scholar] [CrossRef] [PubMed] [Green Version]
- Shoshtari-Yeganeh, B.; Zarean, M.; Mansourian, M.; Riahi, R.; Poursafa, P.; Teiri, H.; Rafiei, N.; Dehdashti, B.; Kelishadi, R. Systematic review and meta-analysis on the association between phthalates exposure and insulin resistance. Environ. Sci. Pollut. Res. 2019, 26, 9435–9442. [Google Scholar] [CrossRef] [PubMed]
- Matos, R.A.; Adams, M.; Sabaté, J. Review: The Consumption of Ultra-Processed Foods and Non-communicable Diseases in Latin America. Front. Nutr. 2021, 8, 110. [Google Scholar] [CrossRef]
- DeJarnett, N.; Conklin, D.J.; Riggs, D.W.; Myers, J.A.; O’Toole, T.E.; Hamzeh, I.; Wagner, S.; Chugh, A.; Ramos, K.S.; Srivastava, S.; et al. Acrolein Exposure Is Associated with Increased Cardiovascular Disease Risk. J. Am. Heart Assoc. 2014, 3, e000934. [Google Scholar] [CrossRef] [PubMed] [Green Version]
- Feroe, A.G.; Attanasio, R.; Scinicariello, F. Acrolein metabolites, diabetes and insulin resistance. Environ. Res. 2016, 148, 1–6. [Google Scholar] [CrossRef] [Green Version]
- Lin, C.-Y.; Lin, Y.-C.; Kuo, H.-K.; Hwang, J.-J.; Lin, J.-L.; Chen, P.-C.; Lin, L.-Y. Association among Acrylamide, Blood Insulin, and Insulin Resistance in Adults. Diabetes Care 2009, 32, 2206–2211. [Google Scholar] [CrossRef] [PubMed] [Green Version]
- Guo, H.; Huang, K.; Zhang, X.; Zhang, W.; Guan, L.; Kuang, D.; Deng, Q.; Deng, H.; Zhang, X.; He, M.; et al. Women are more susceptible than men to oxidative stress and chromosome damage caused by polycyclic aromatic hydrocarbons exposure. Environ. Mol. Mutagen. 2014, 55, 472–481. [Google Scholar] [CrossRef] [PubMed]
- Alshaarawy, O.; Zhu, M.; Ducatman, A.; Conway, B.; Andrew, M.E. Polycyclic aromatic hydrocarbon biomarkers and serum markers of inflammation. A positive association that is more evident in men. Environ. Res. 2013, 126, 98–104. [Google Scholar] [CrossRef] [PubMed] [Green Version]
- Stallings-Smith, S.; Mease, A.; Johnson, T.M.; Arikawa, A.Y. Exploring the association between polycyclic aromatic hydrocarbons and diabetes among adults in the United States. Environ. Res. 2018, 166, 588–594. [Google Scholar] [CrossRef] [PubMed]
- Borenstein, M.; Hedges, L.V.; Higgins, J.P.T.; Rothstein, H.R. When Does it Make Sense to Perform a Meta-Analysis? In Introduction to Meta-Analysis; John Wiley & Sons: Hoboken, NJ, USA, 2009. [Google Scholar]
Publisher’s Note: MDPI stays neutral with regard to jurisdictional claims in published maps and institutional affiliations. |
© 2021 by the authors. Licensee MDPI, Basel, Switzerland. This article is an open access article distributed under the terms and conditions of the Creative Commons Attribution (CC BY) license (https://creativecommons.org/licenses/by/4.0/).