
Meta-Analysis of Carbohydrate Solution Intake during Prolonged Exercise in Adults: From the Last 45+ Years’ Perspective

 , ,
, ,
Abstract
1. Introduction
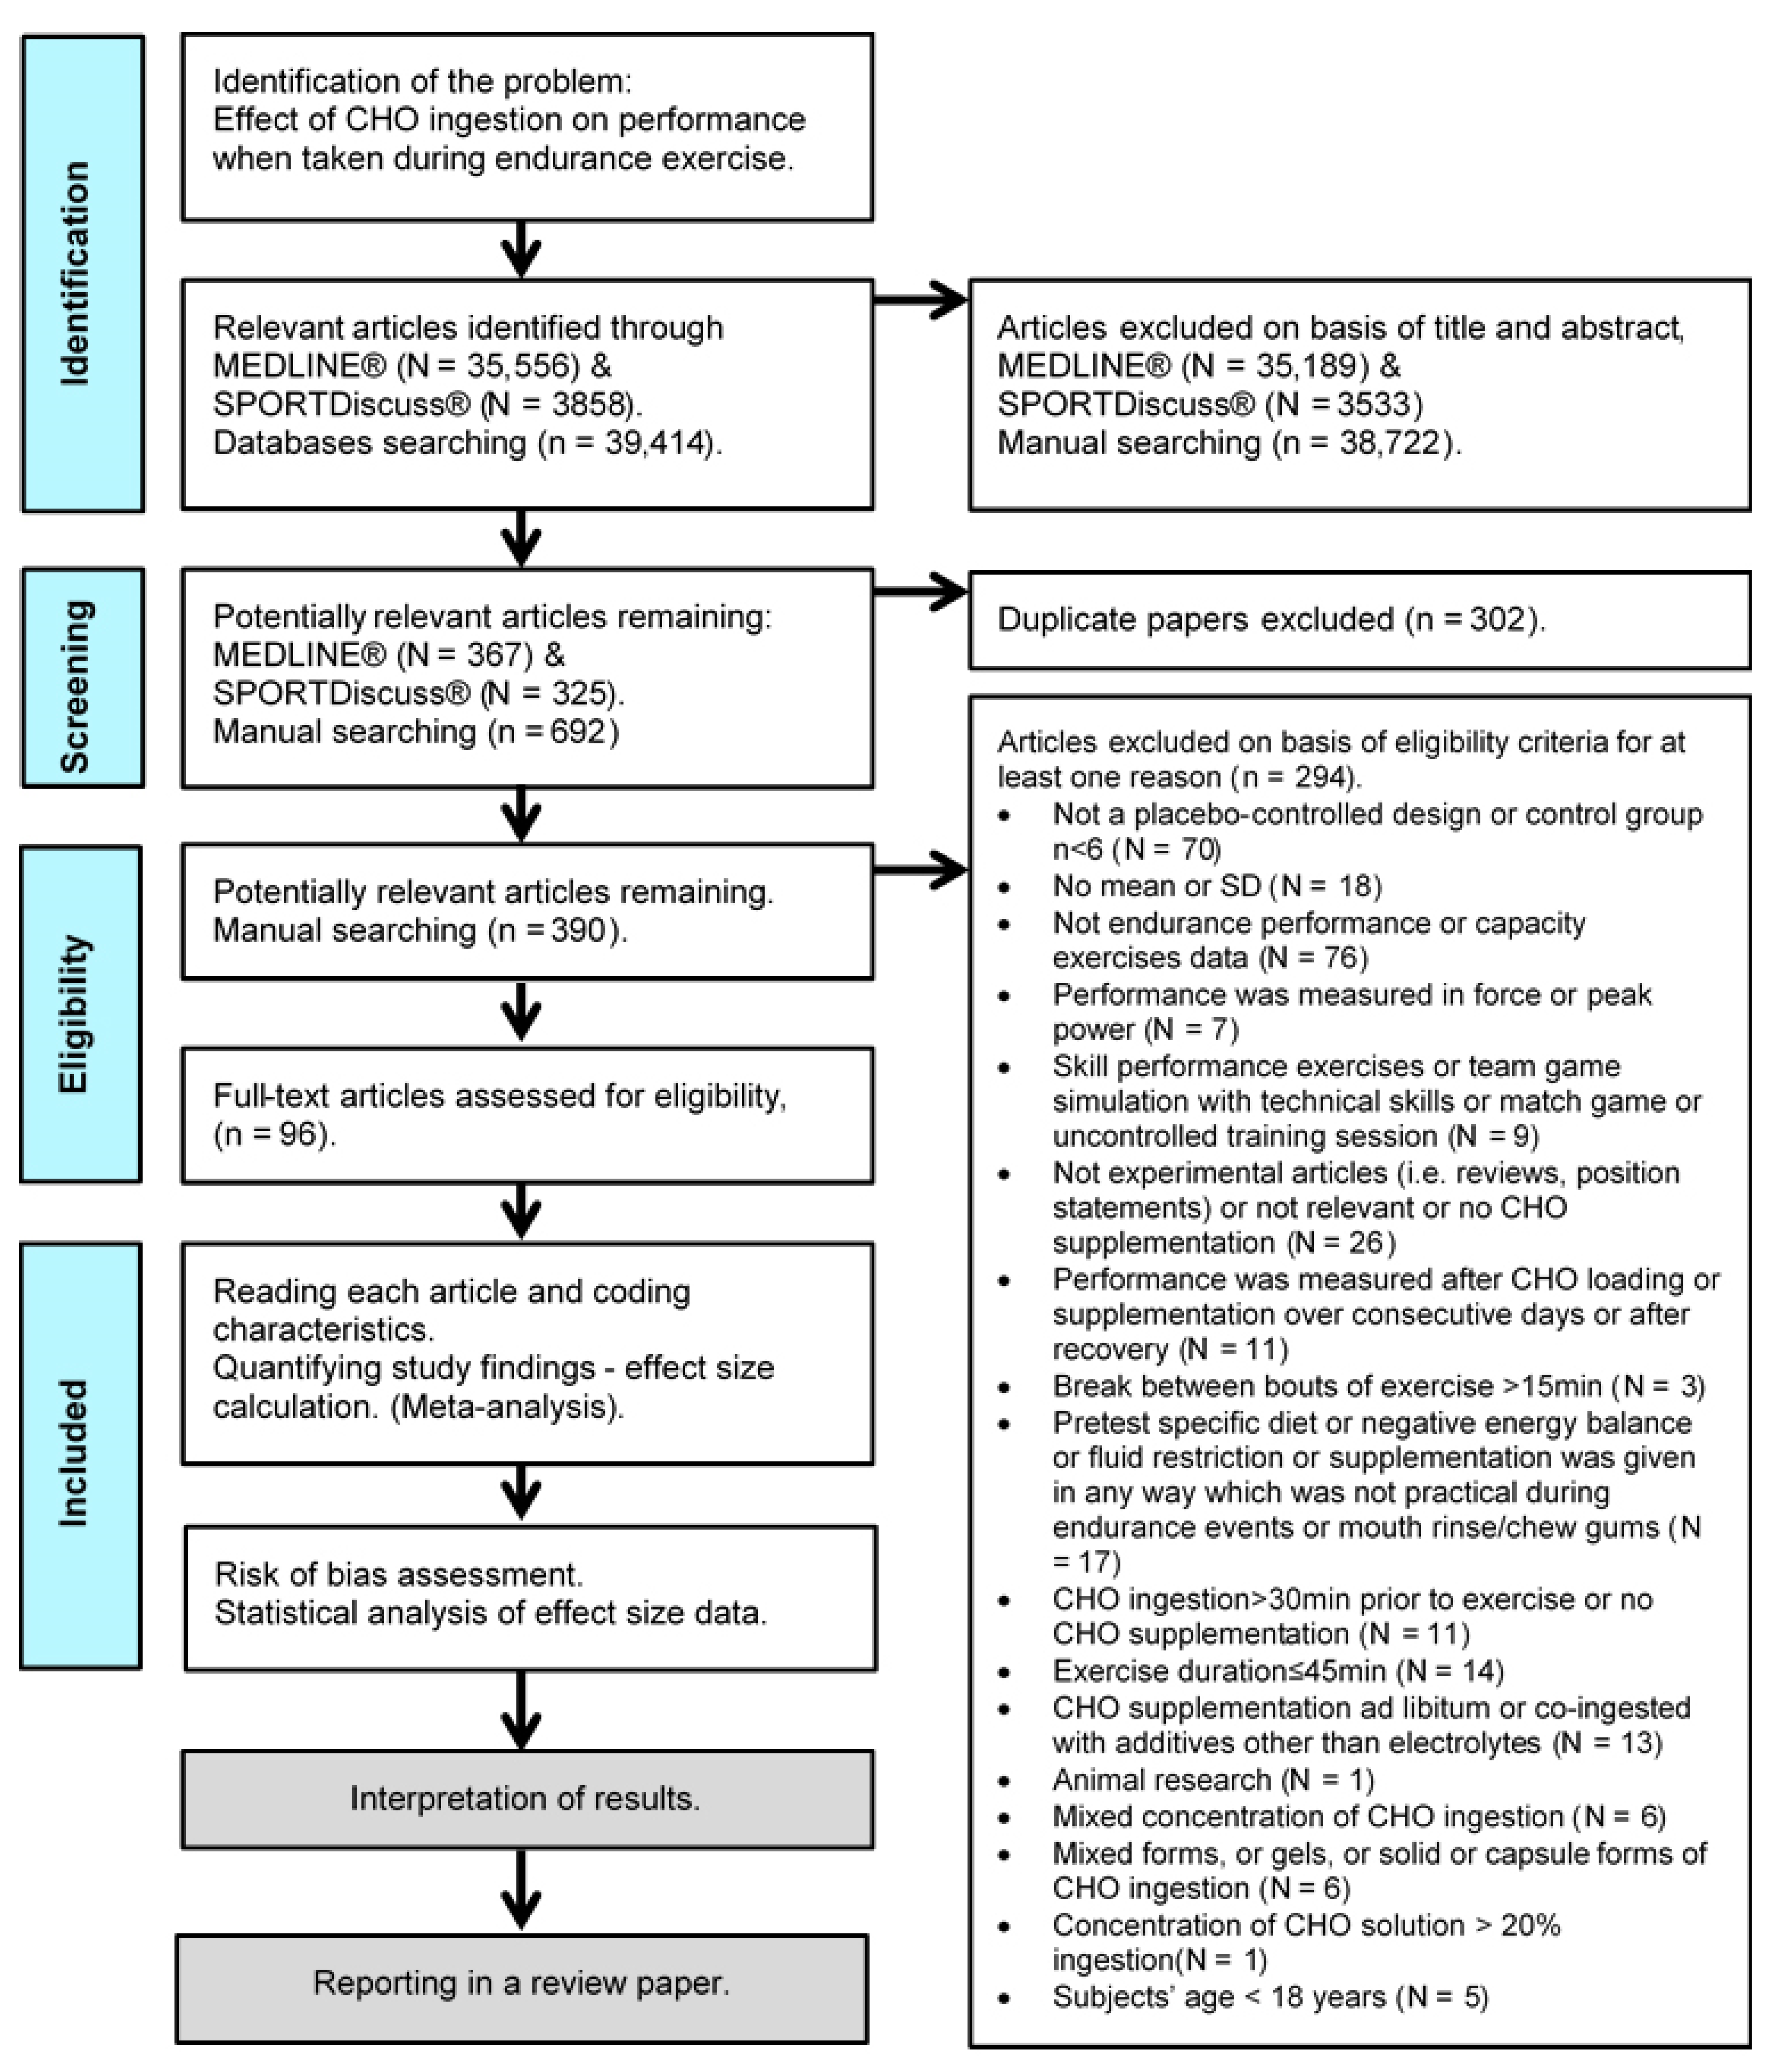
2. Materials and Methods
2.1. Search Strategy
2.2. Databases and Search
2.3. Eligibility Criteria
2.4. Data Extraction
2.5. Risk-of-Bias Assessment and Deficiencies in Scientific Design or Reporting
2.6. Statistical Analyses
3. Results
3.1. Study Characteristics
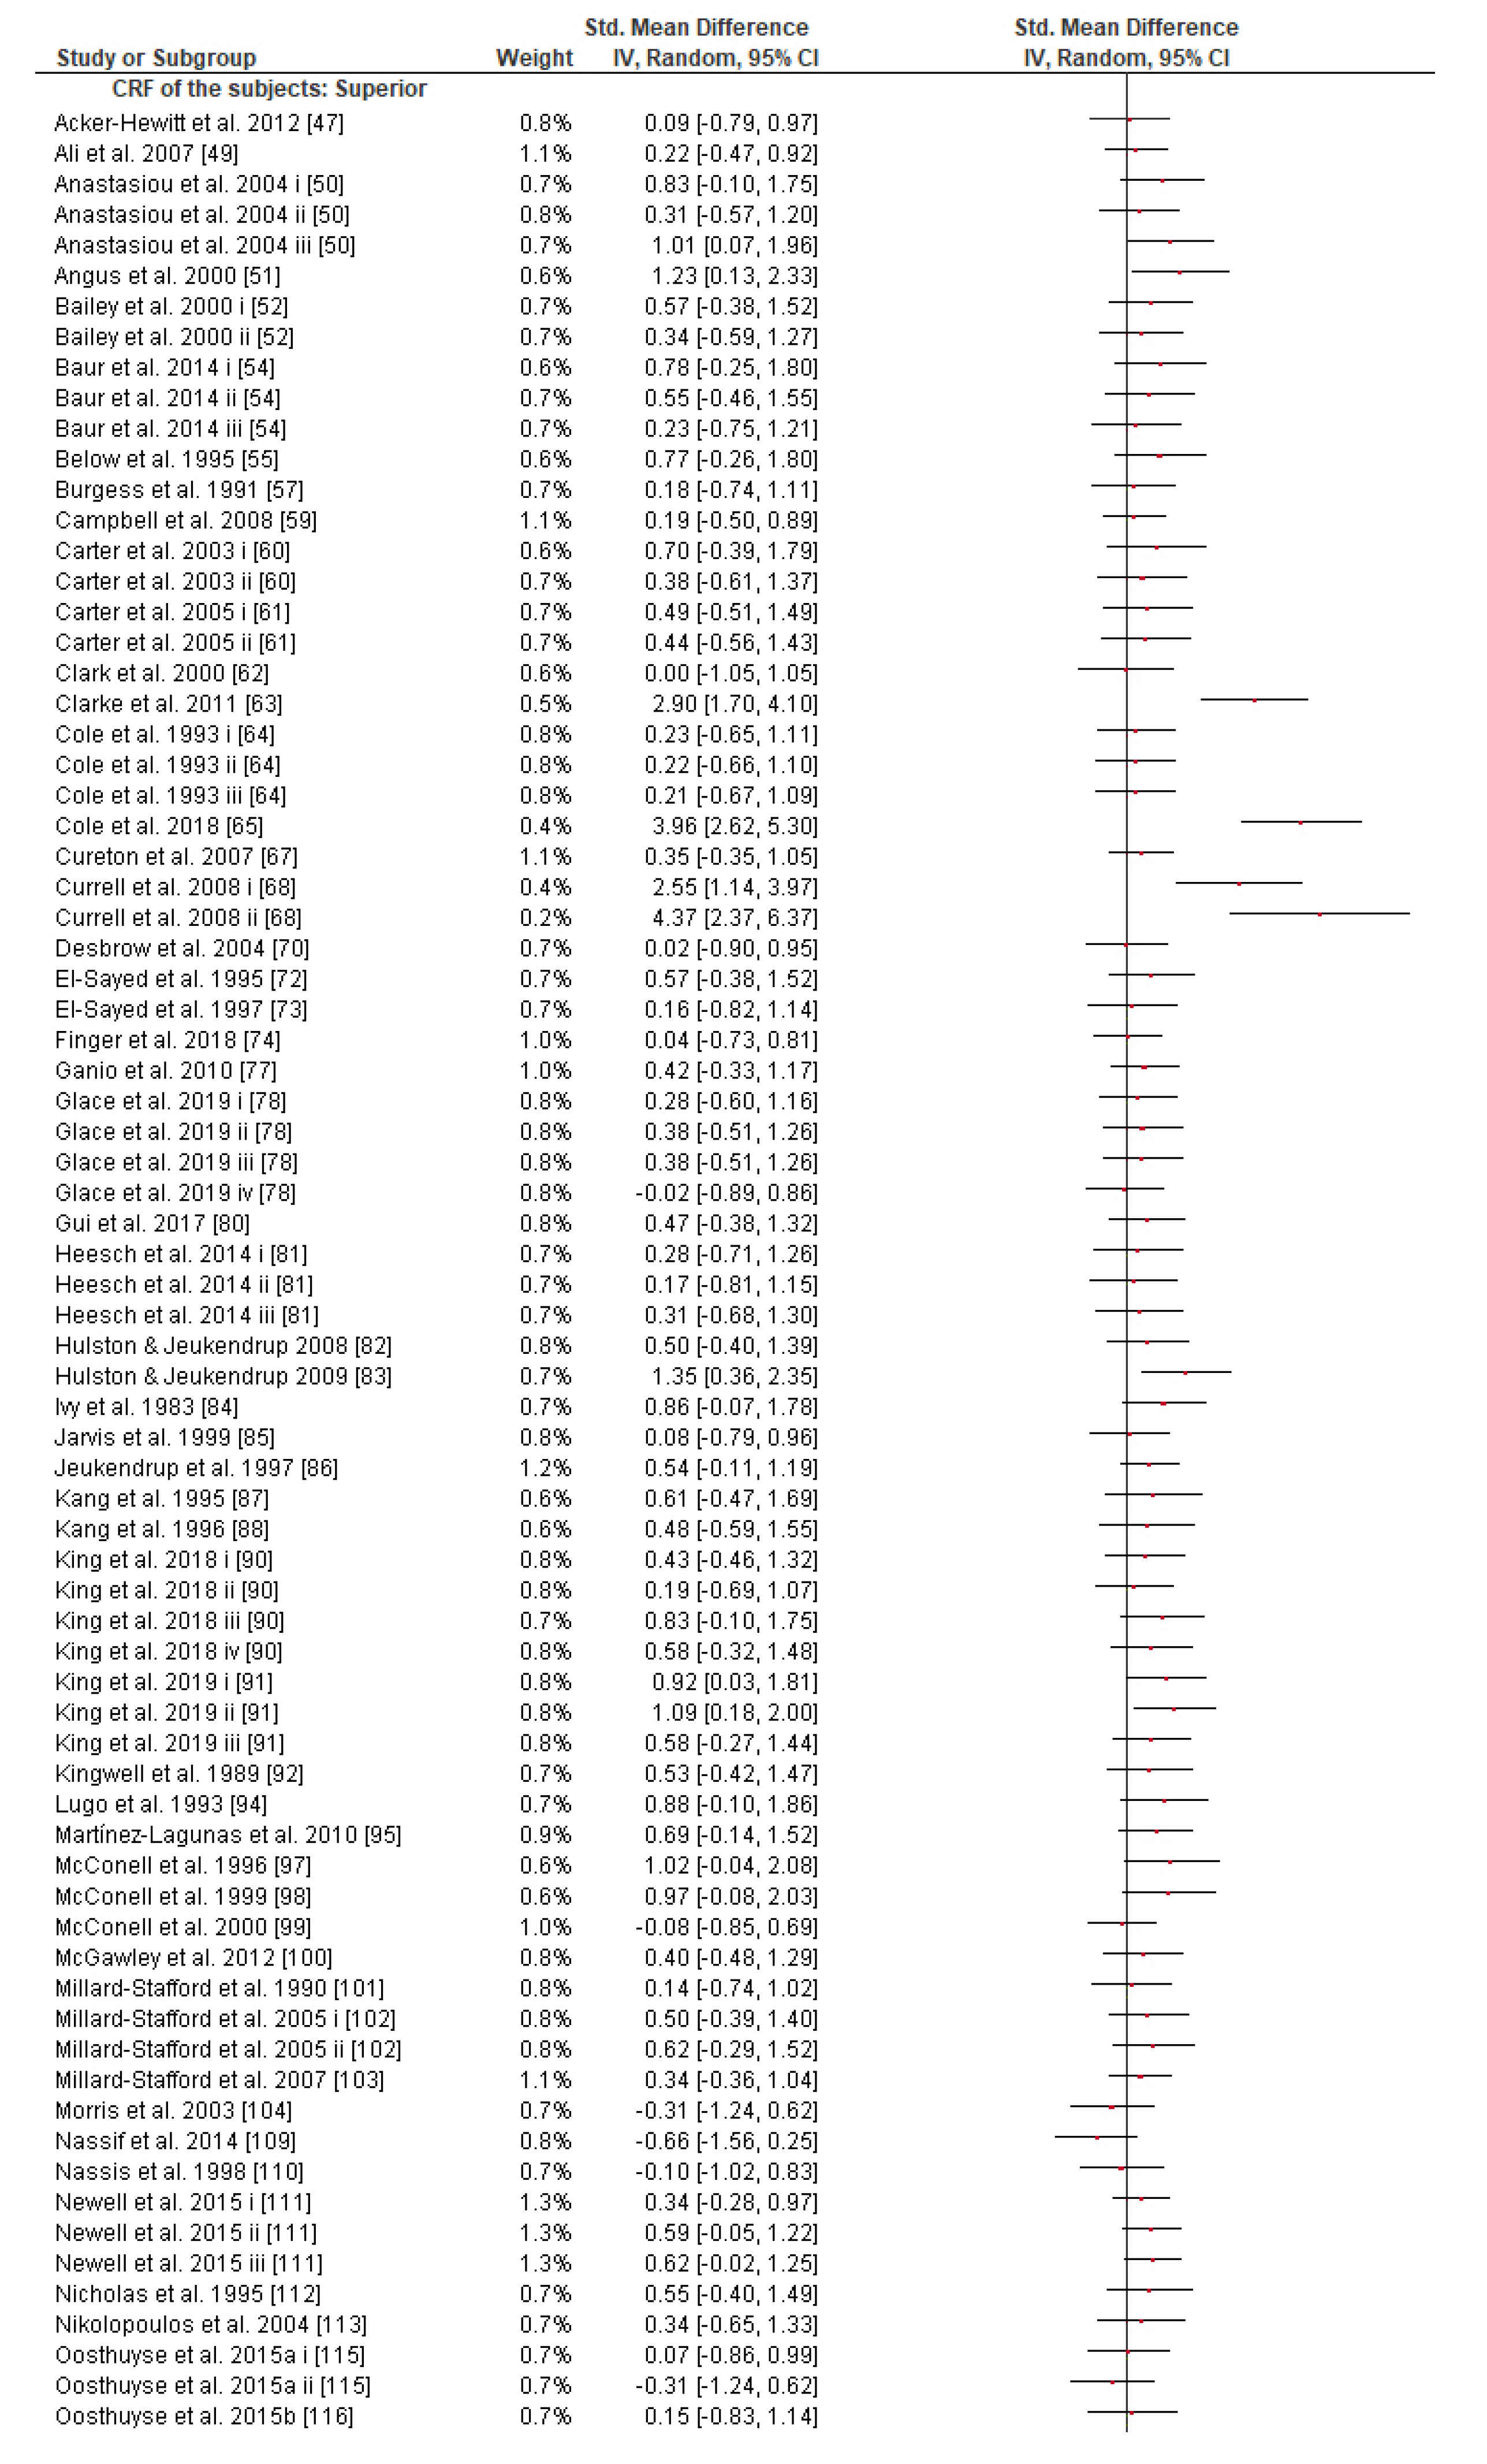
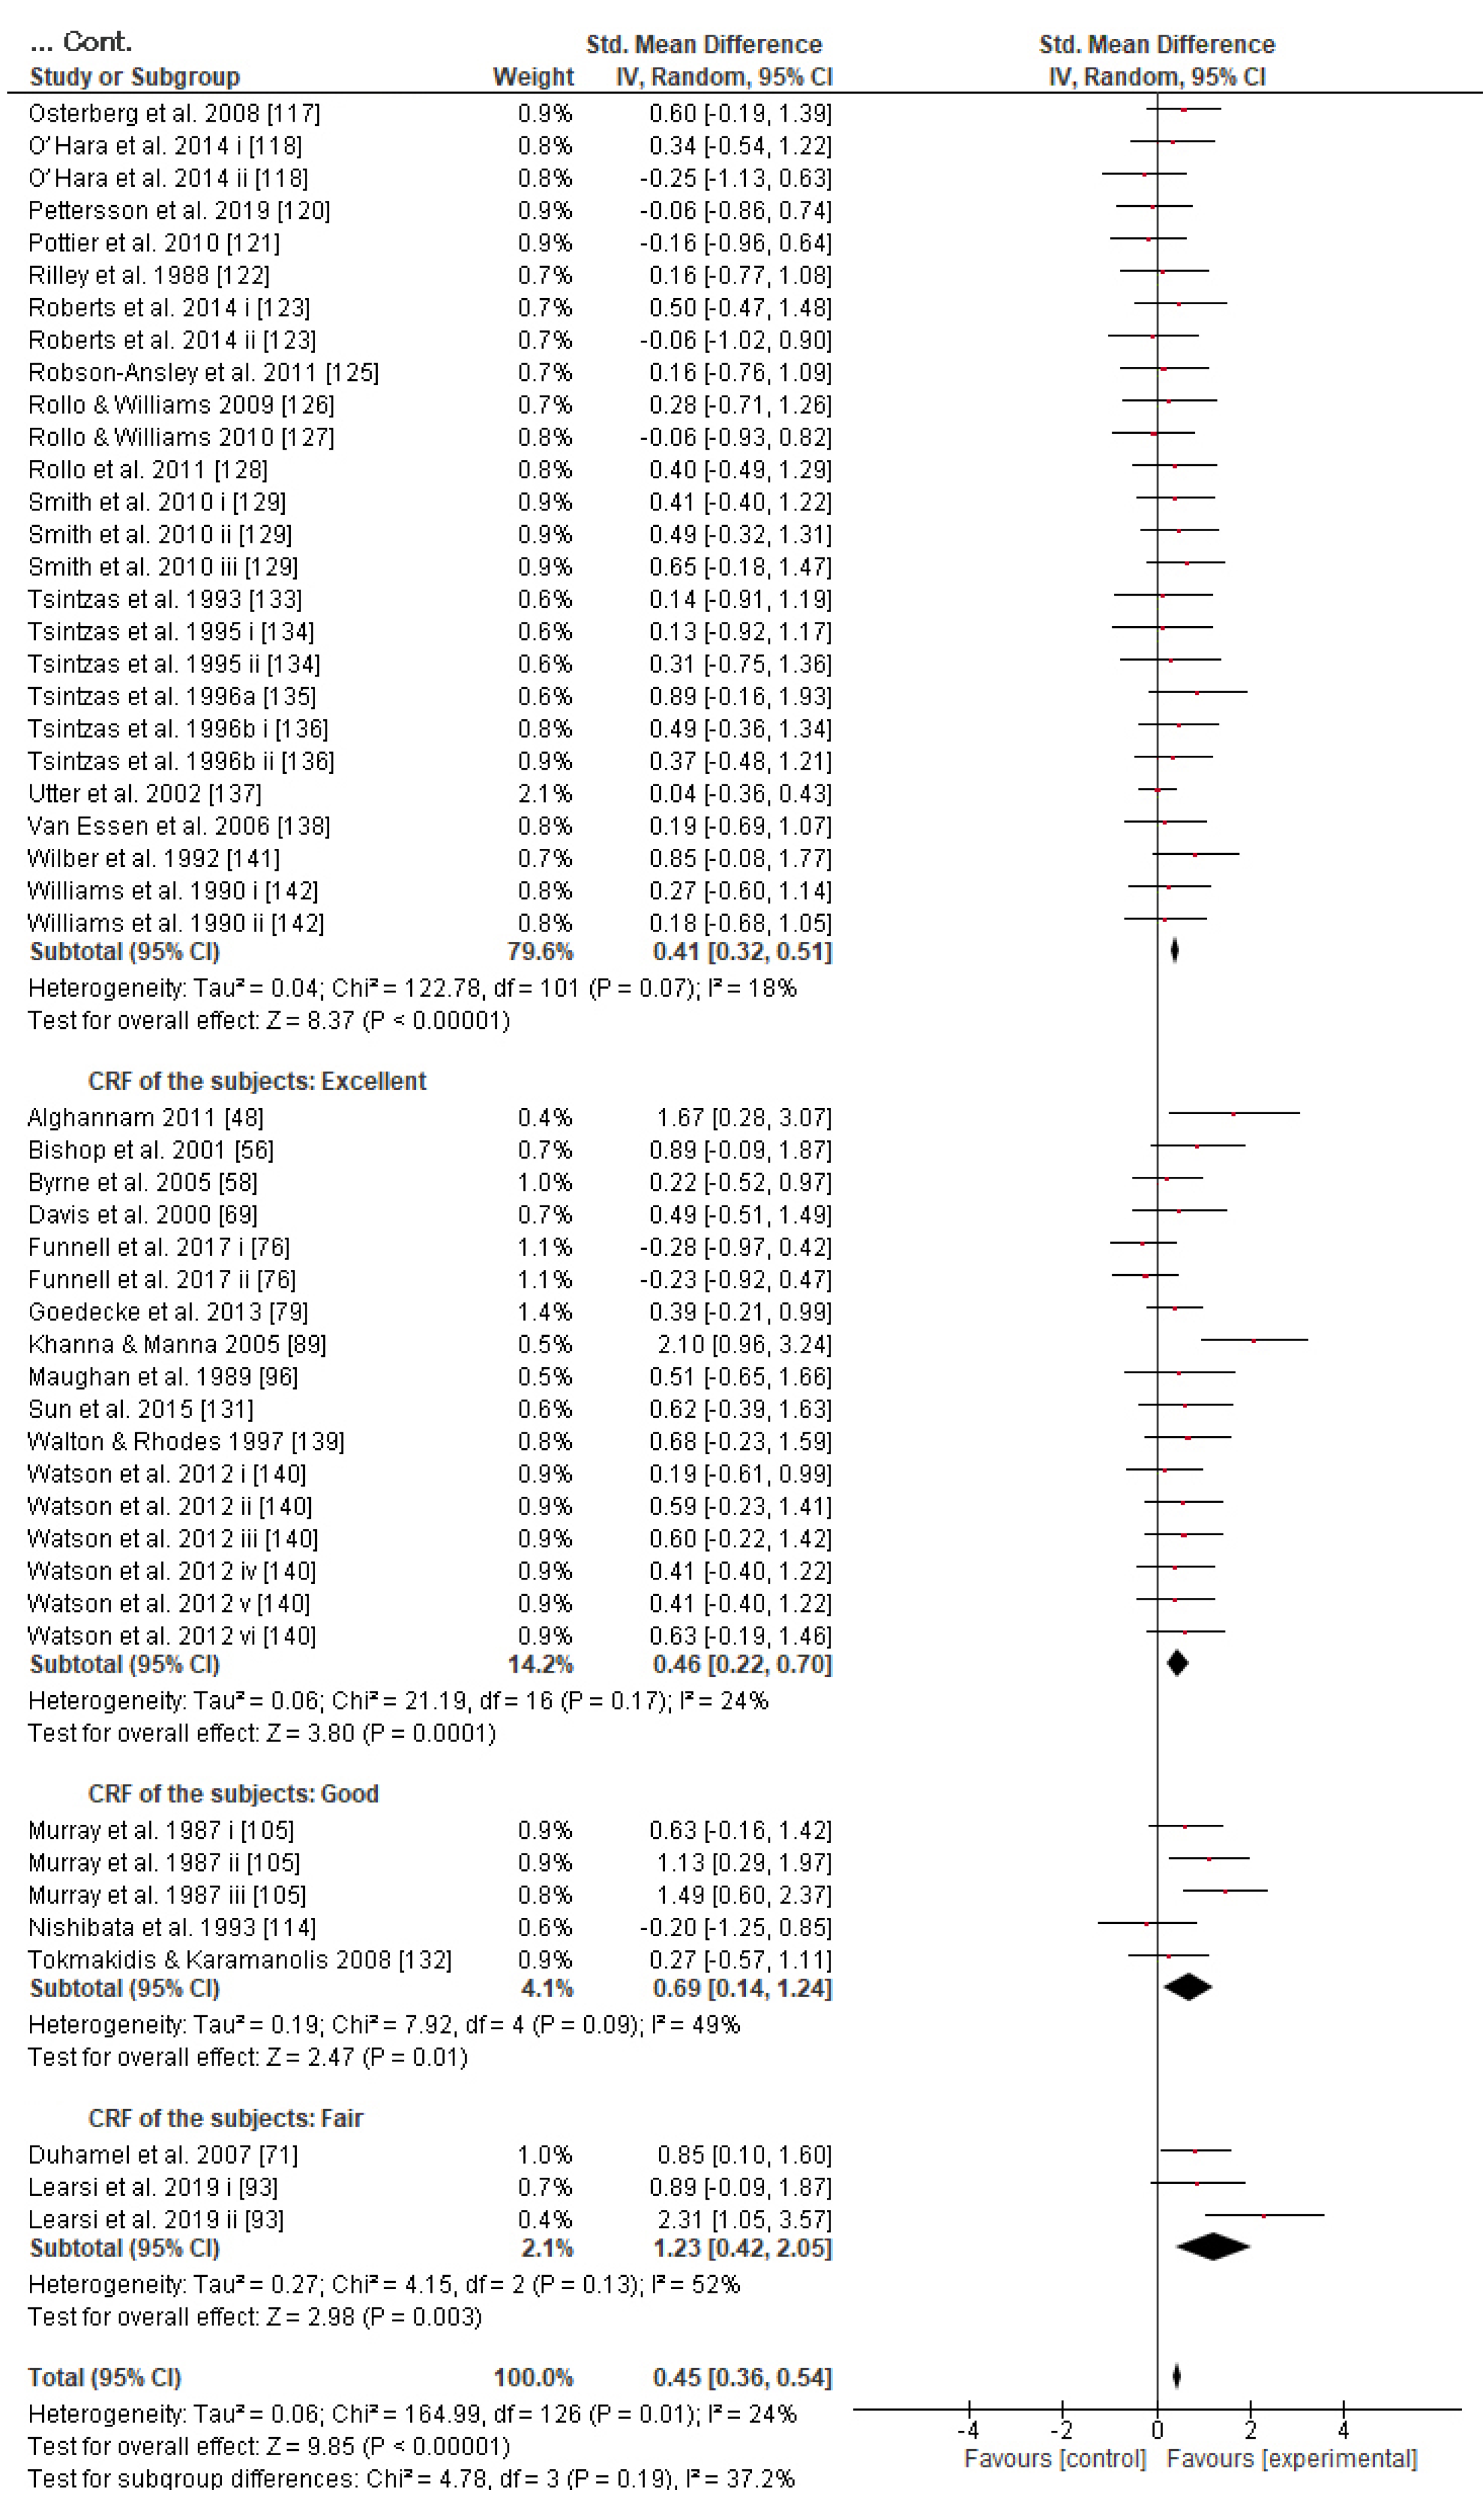
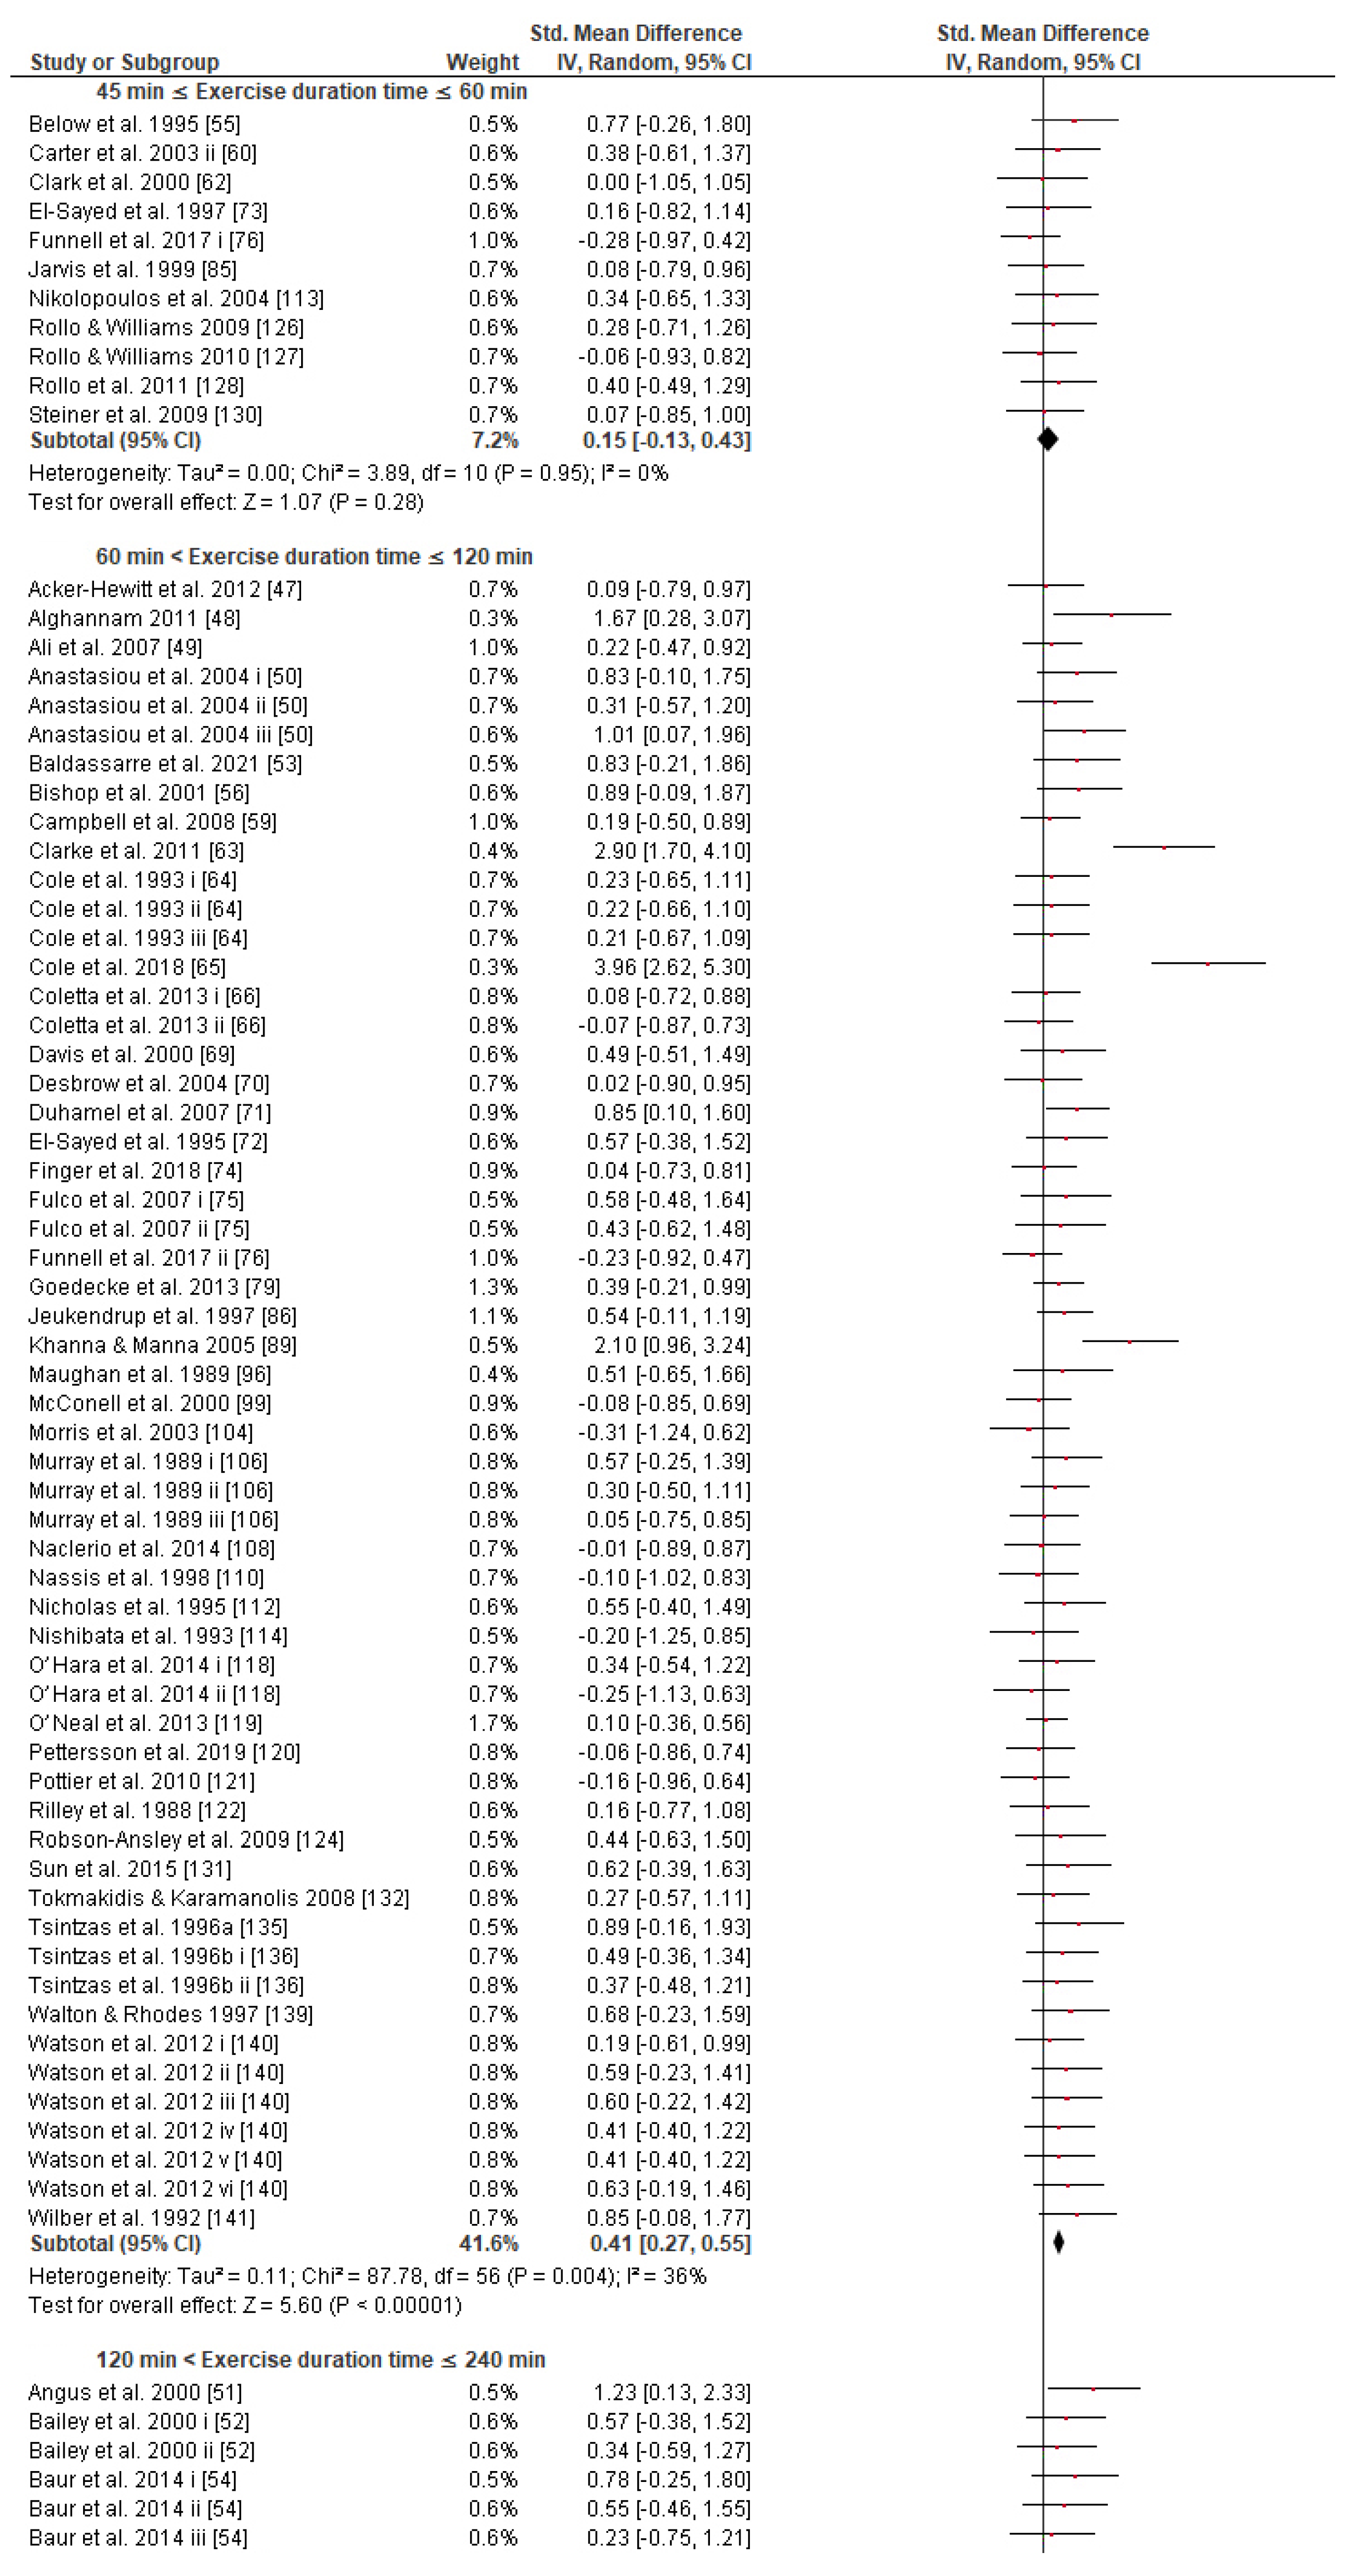
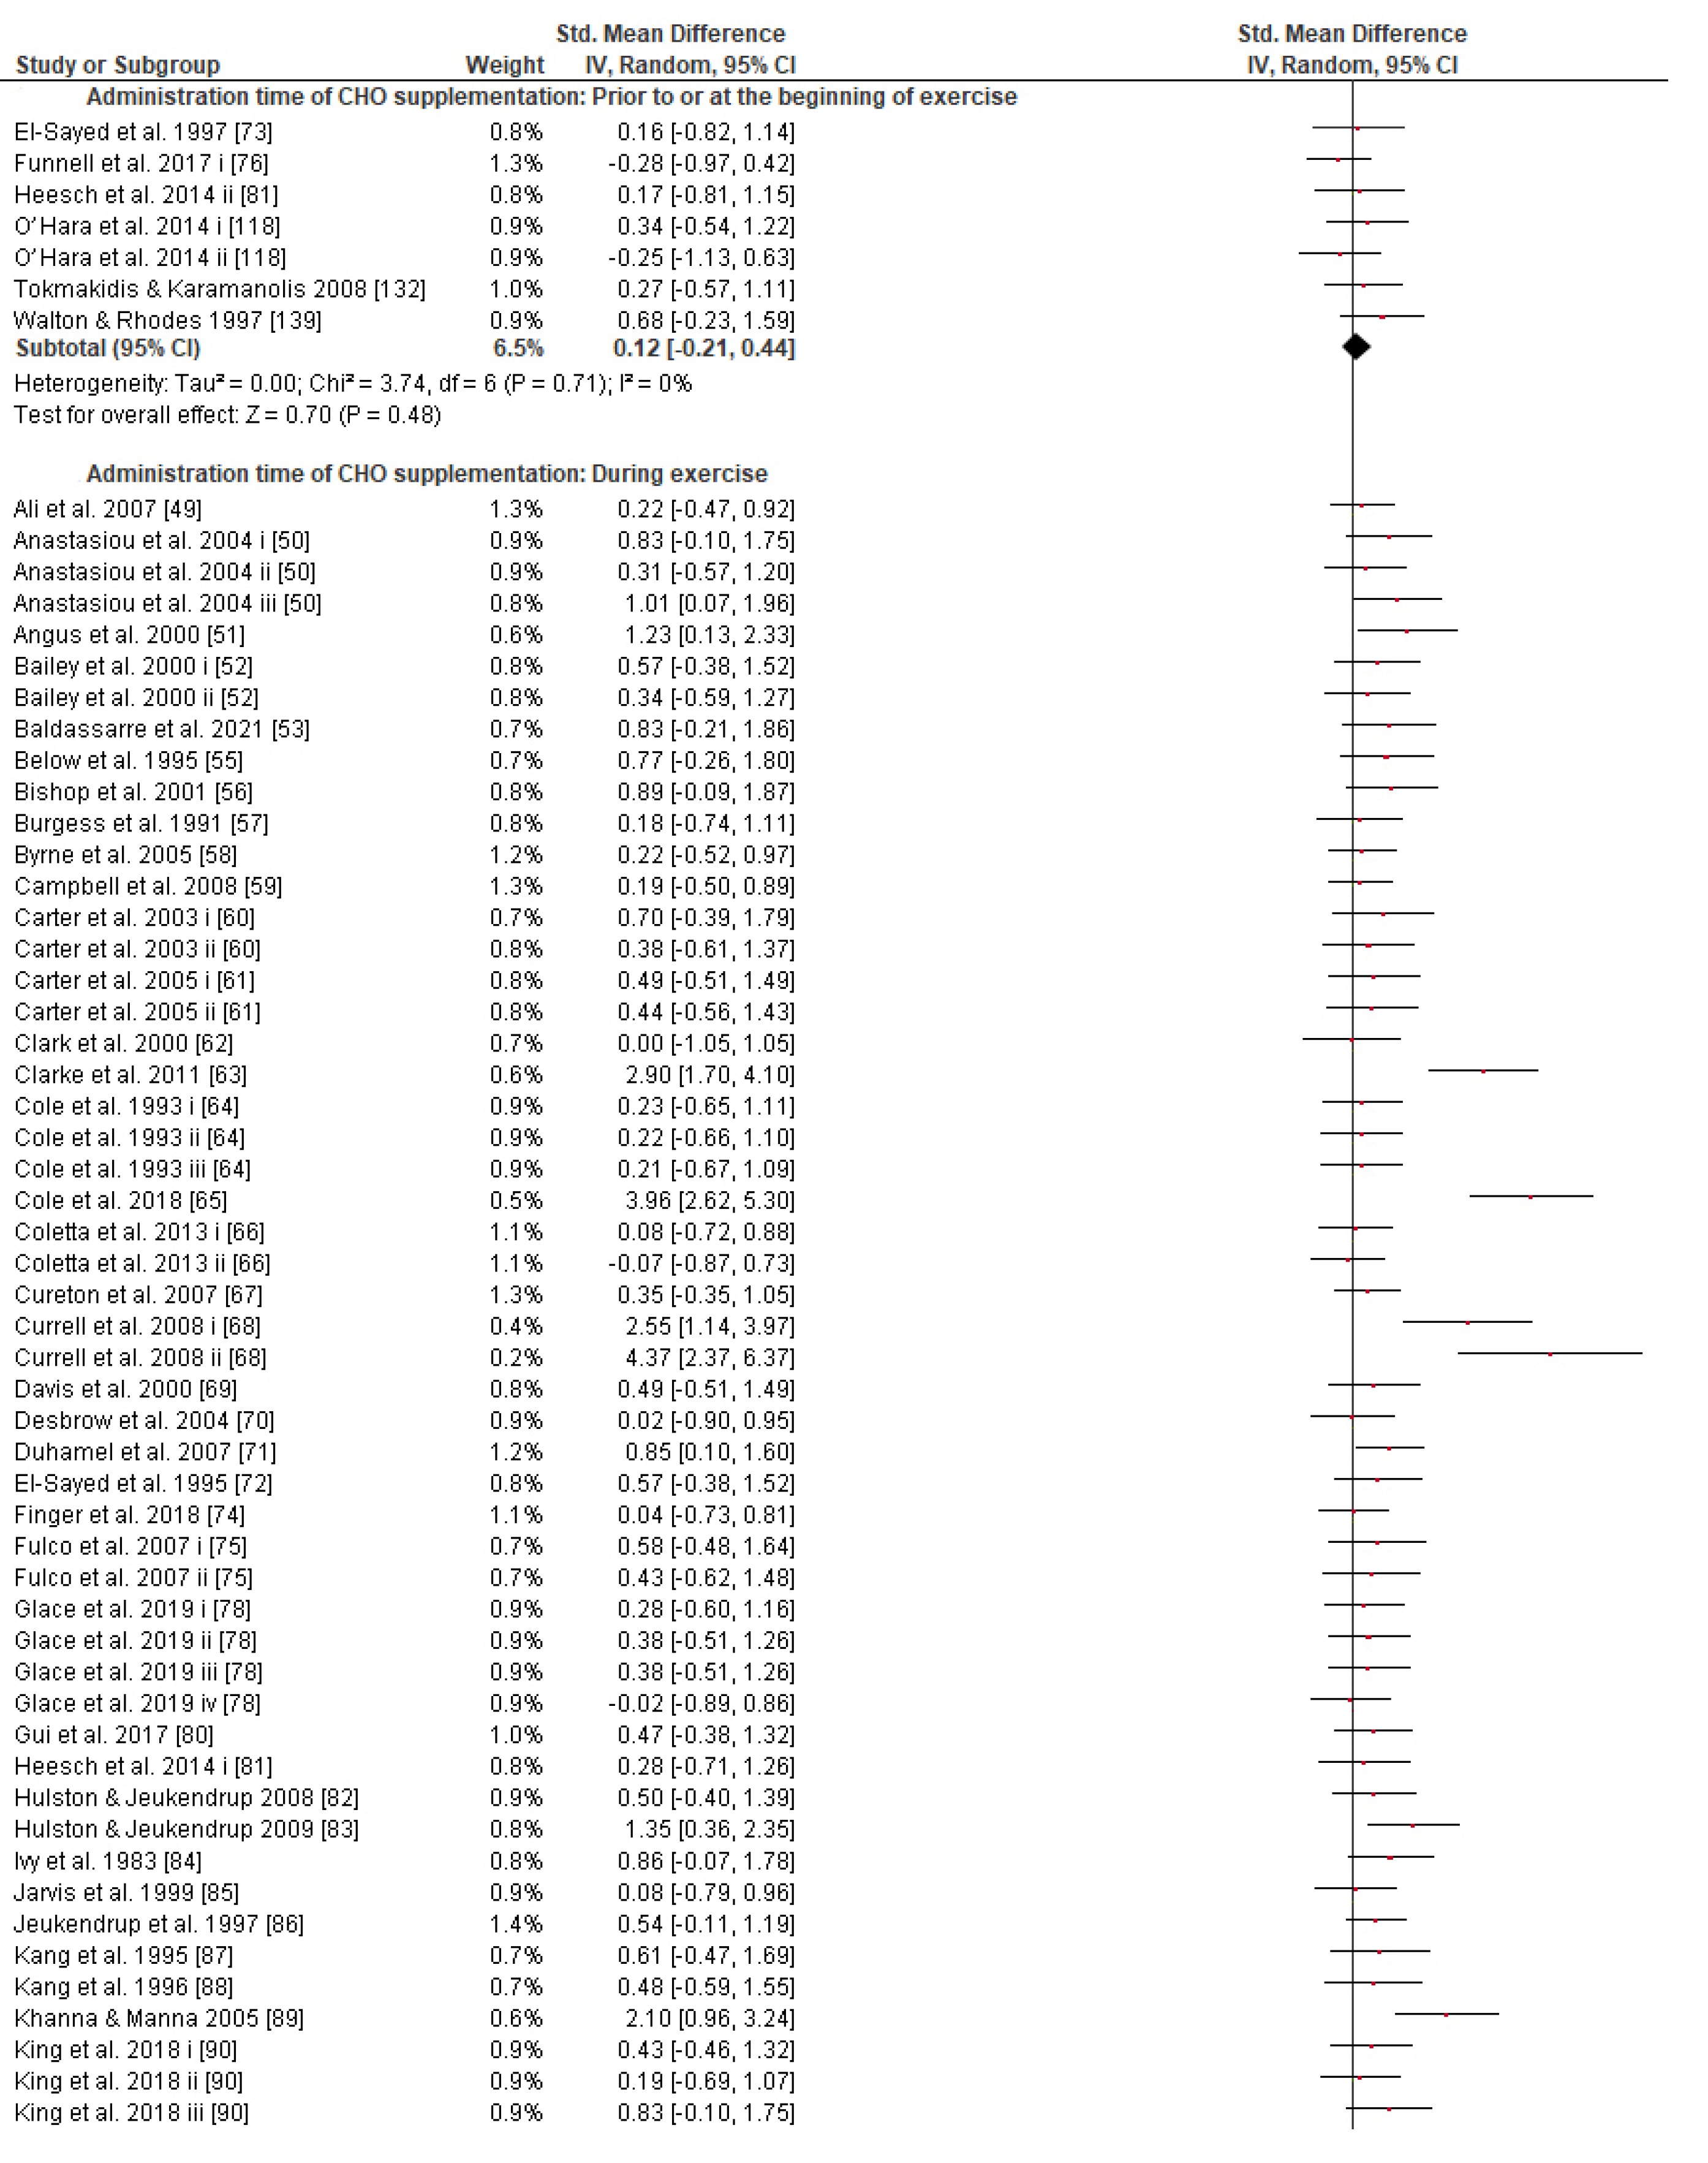
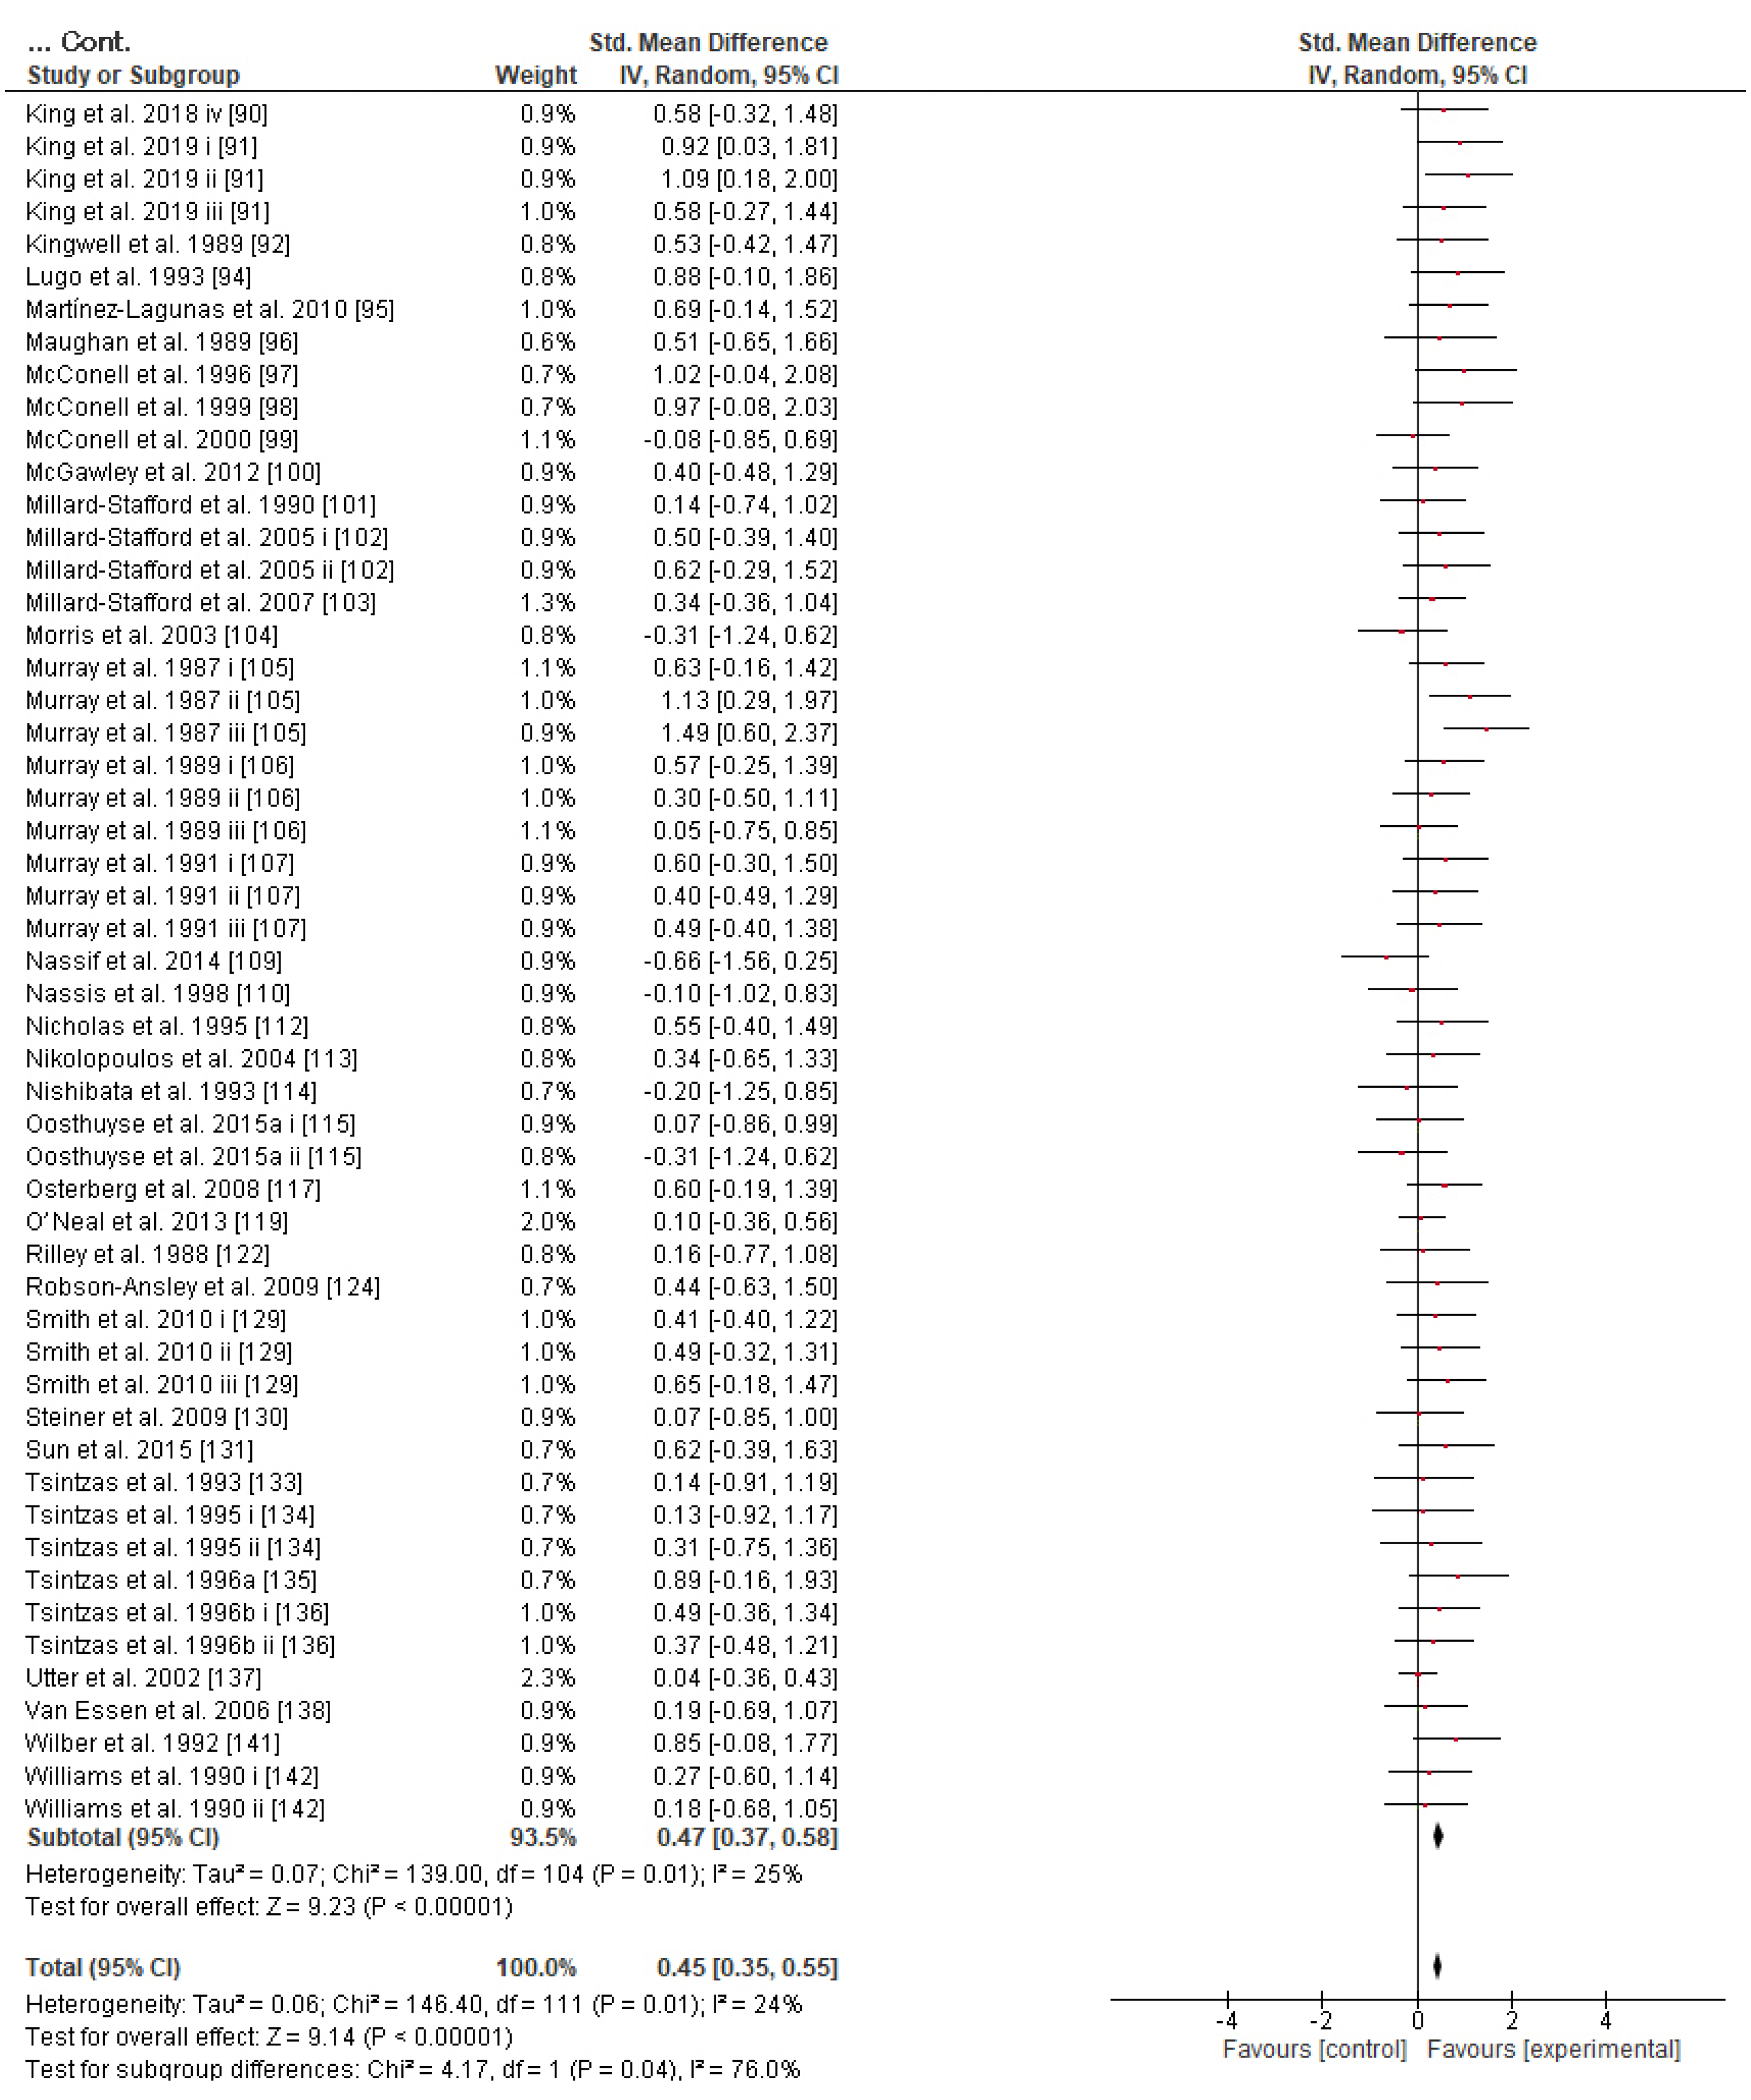
3.2. Effect of Carbohydrate Supplementation
3.3. Risk of Bias
4. Discussion
4.1. Effects of CHO Supplementation on Endurance Exercise and Gastrointestinal Symptoms
4.2. Effects of Mode, Protocol, and Type of Exercise
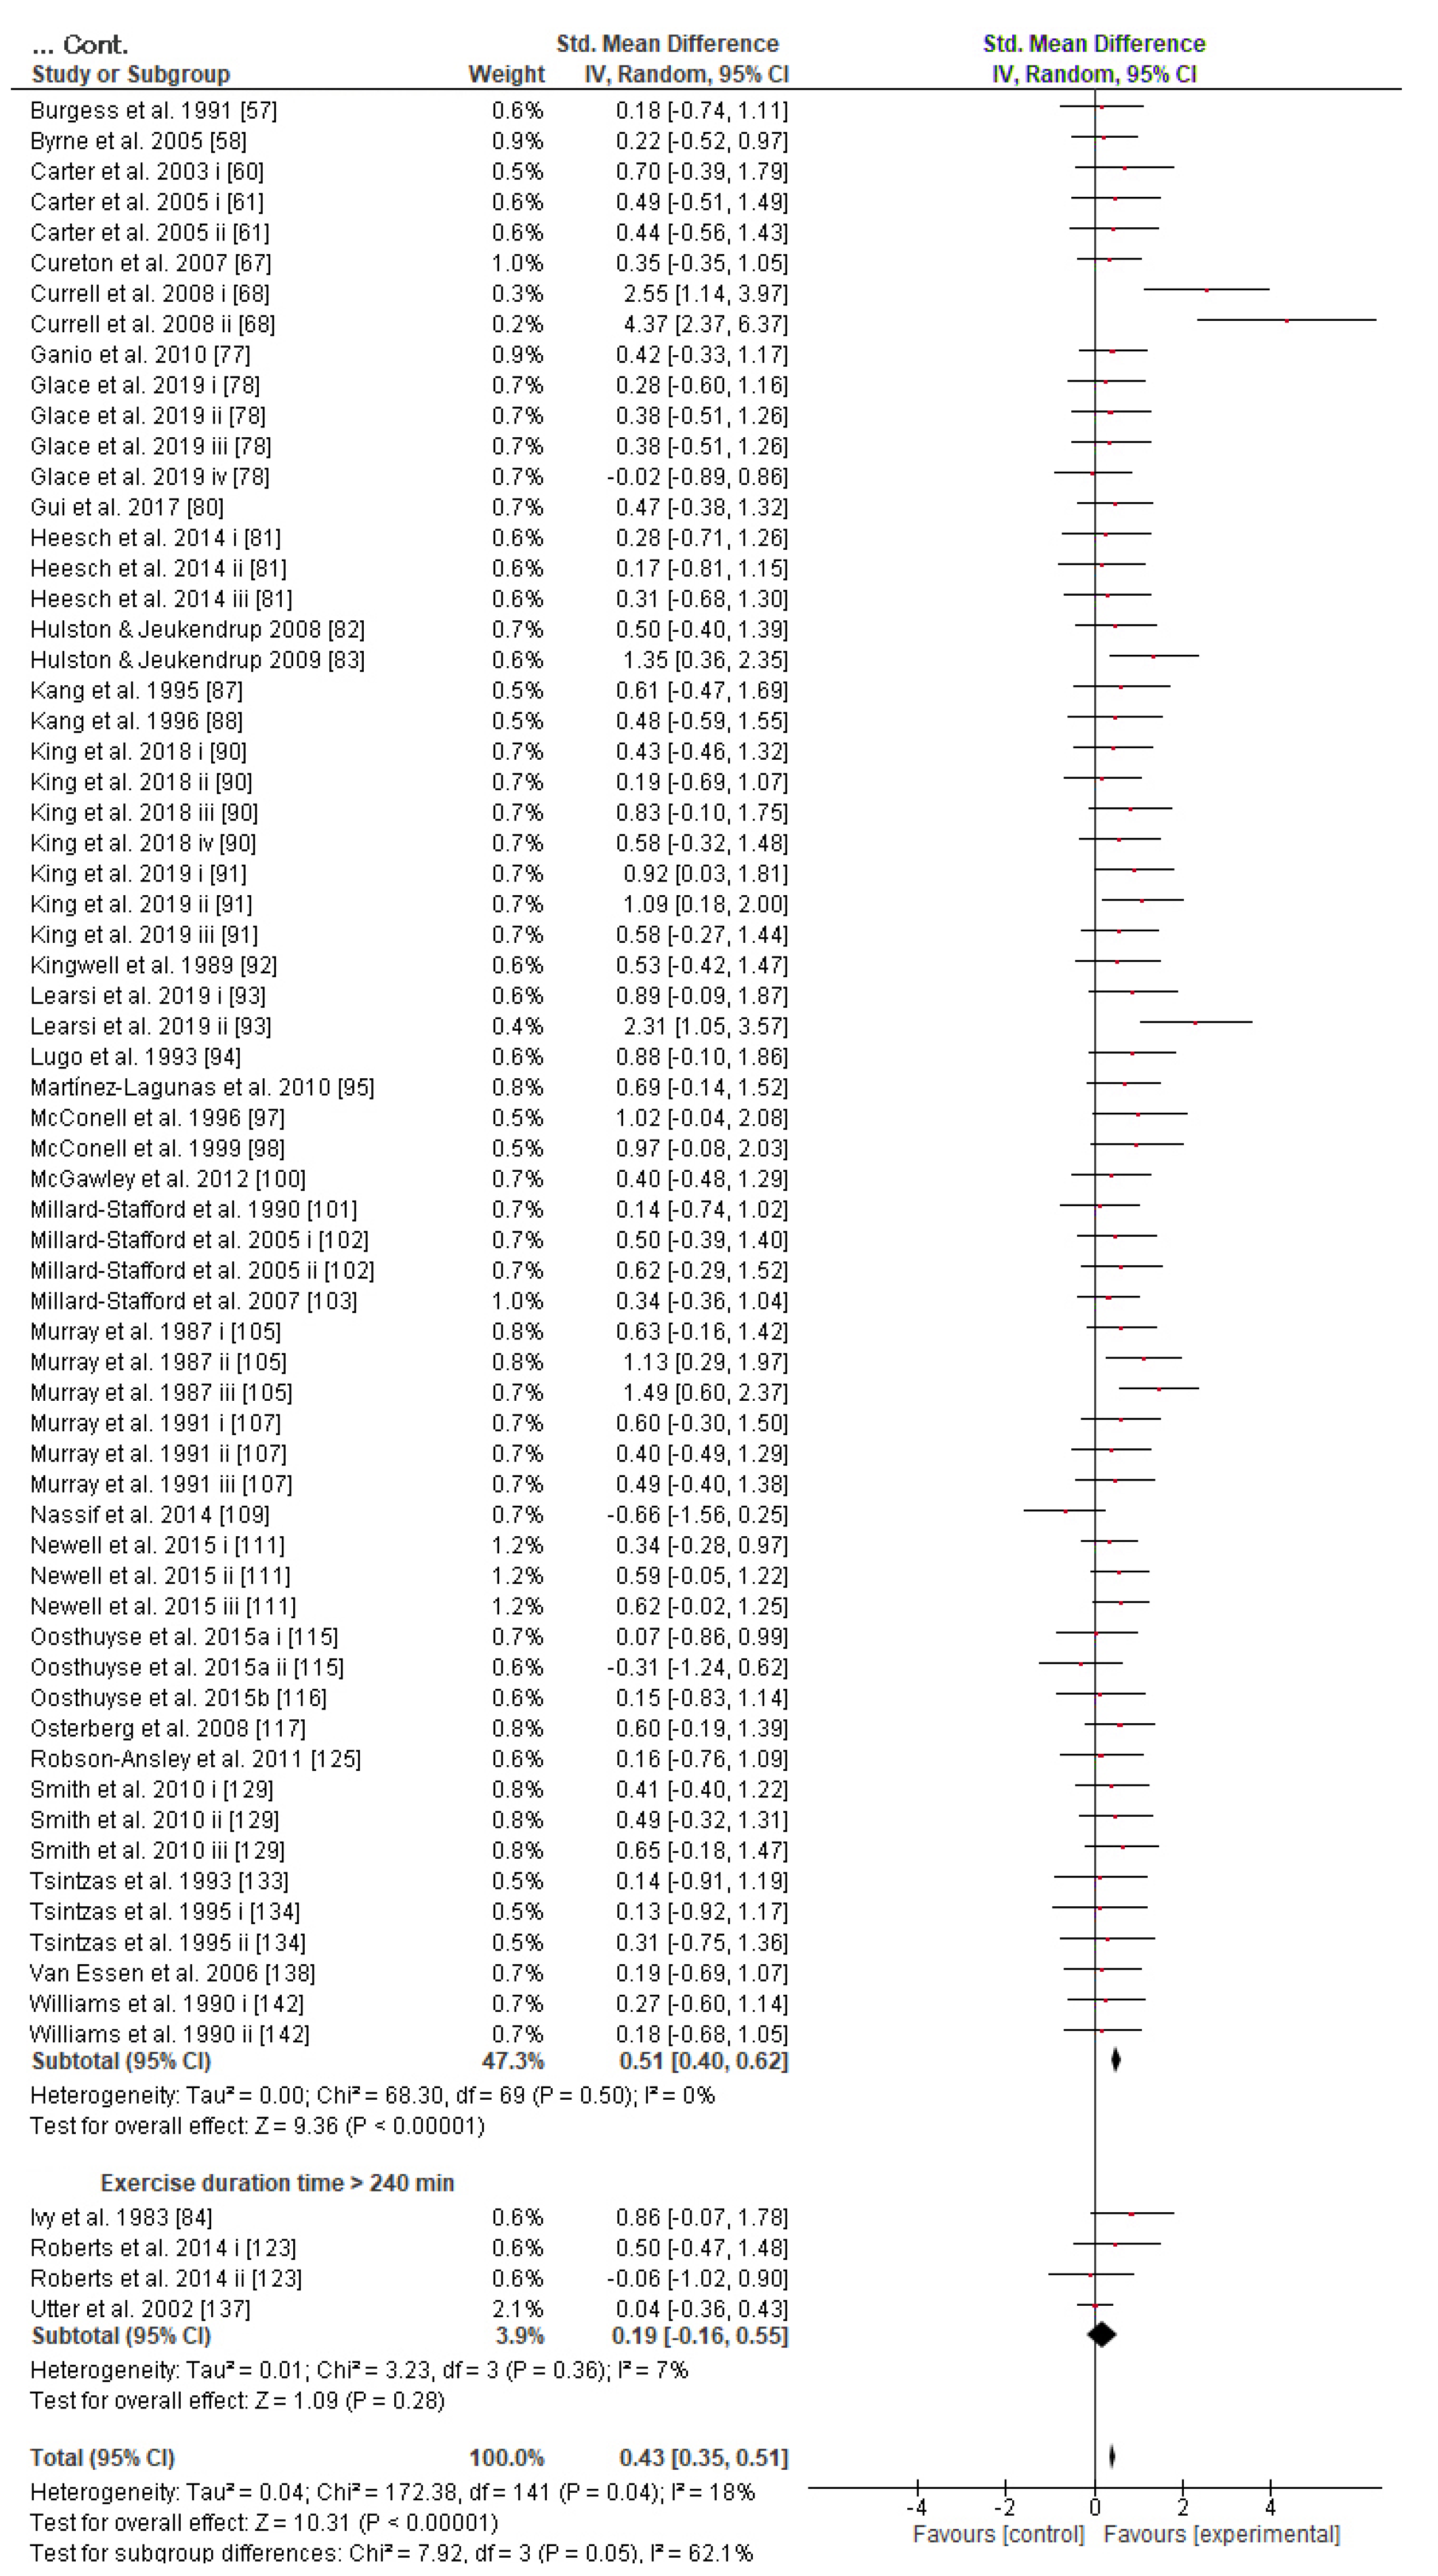
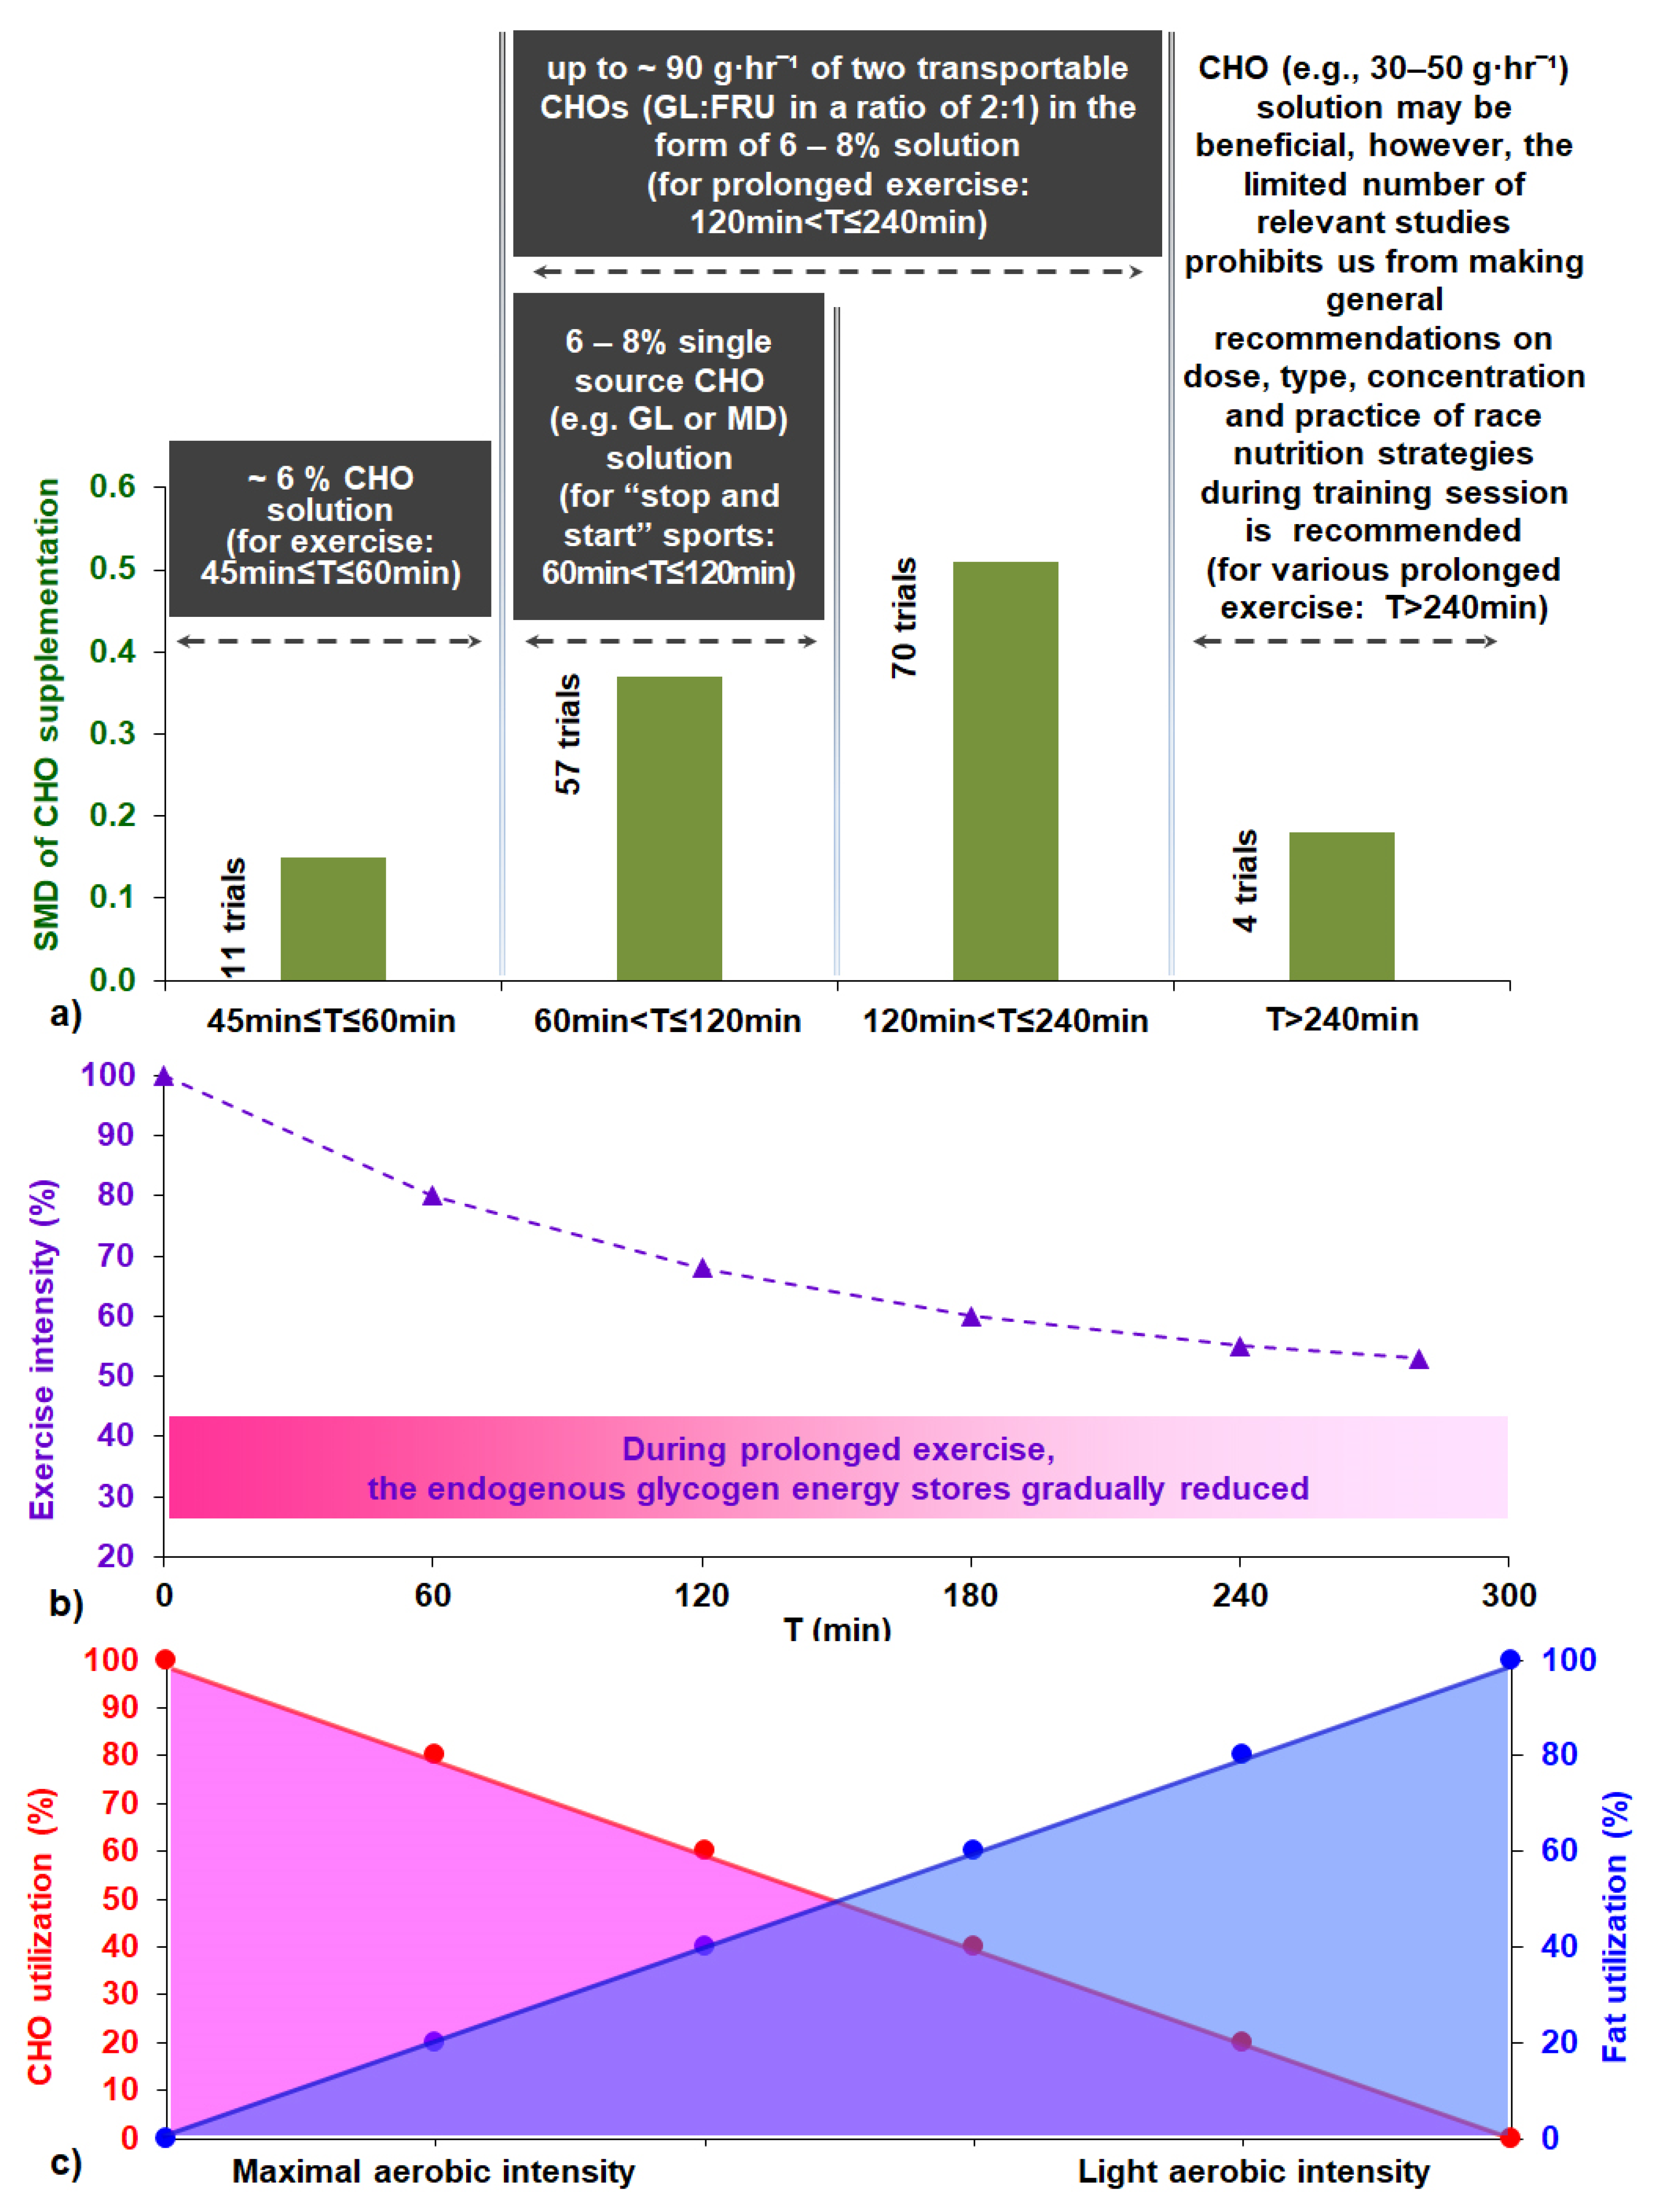
4.3. Effects of CHO Supplementation and Exercise Duration
4.4. Effects of CRF and Gender on CHO Supplementation
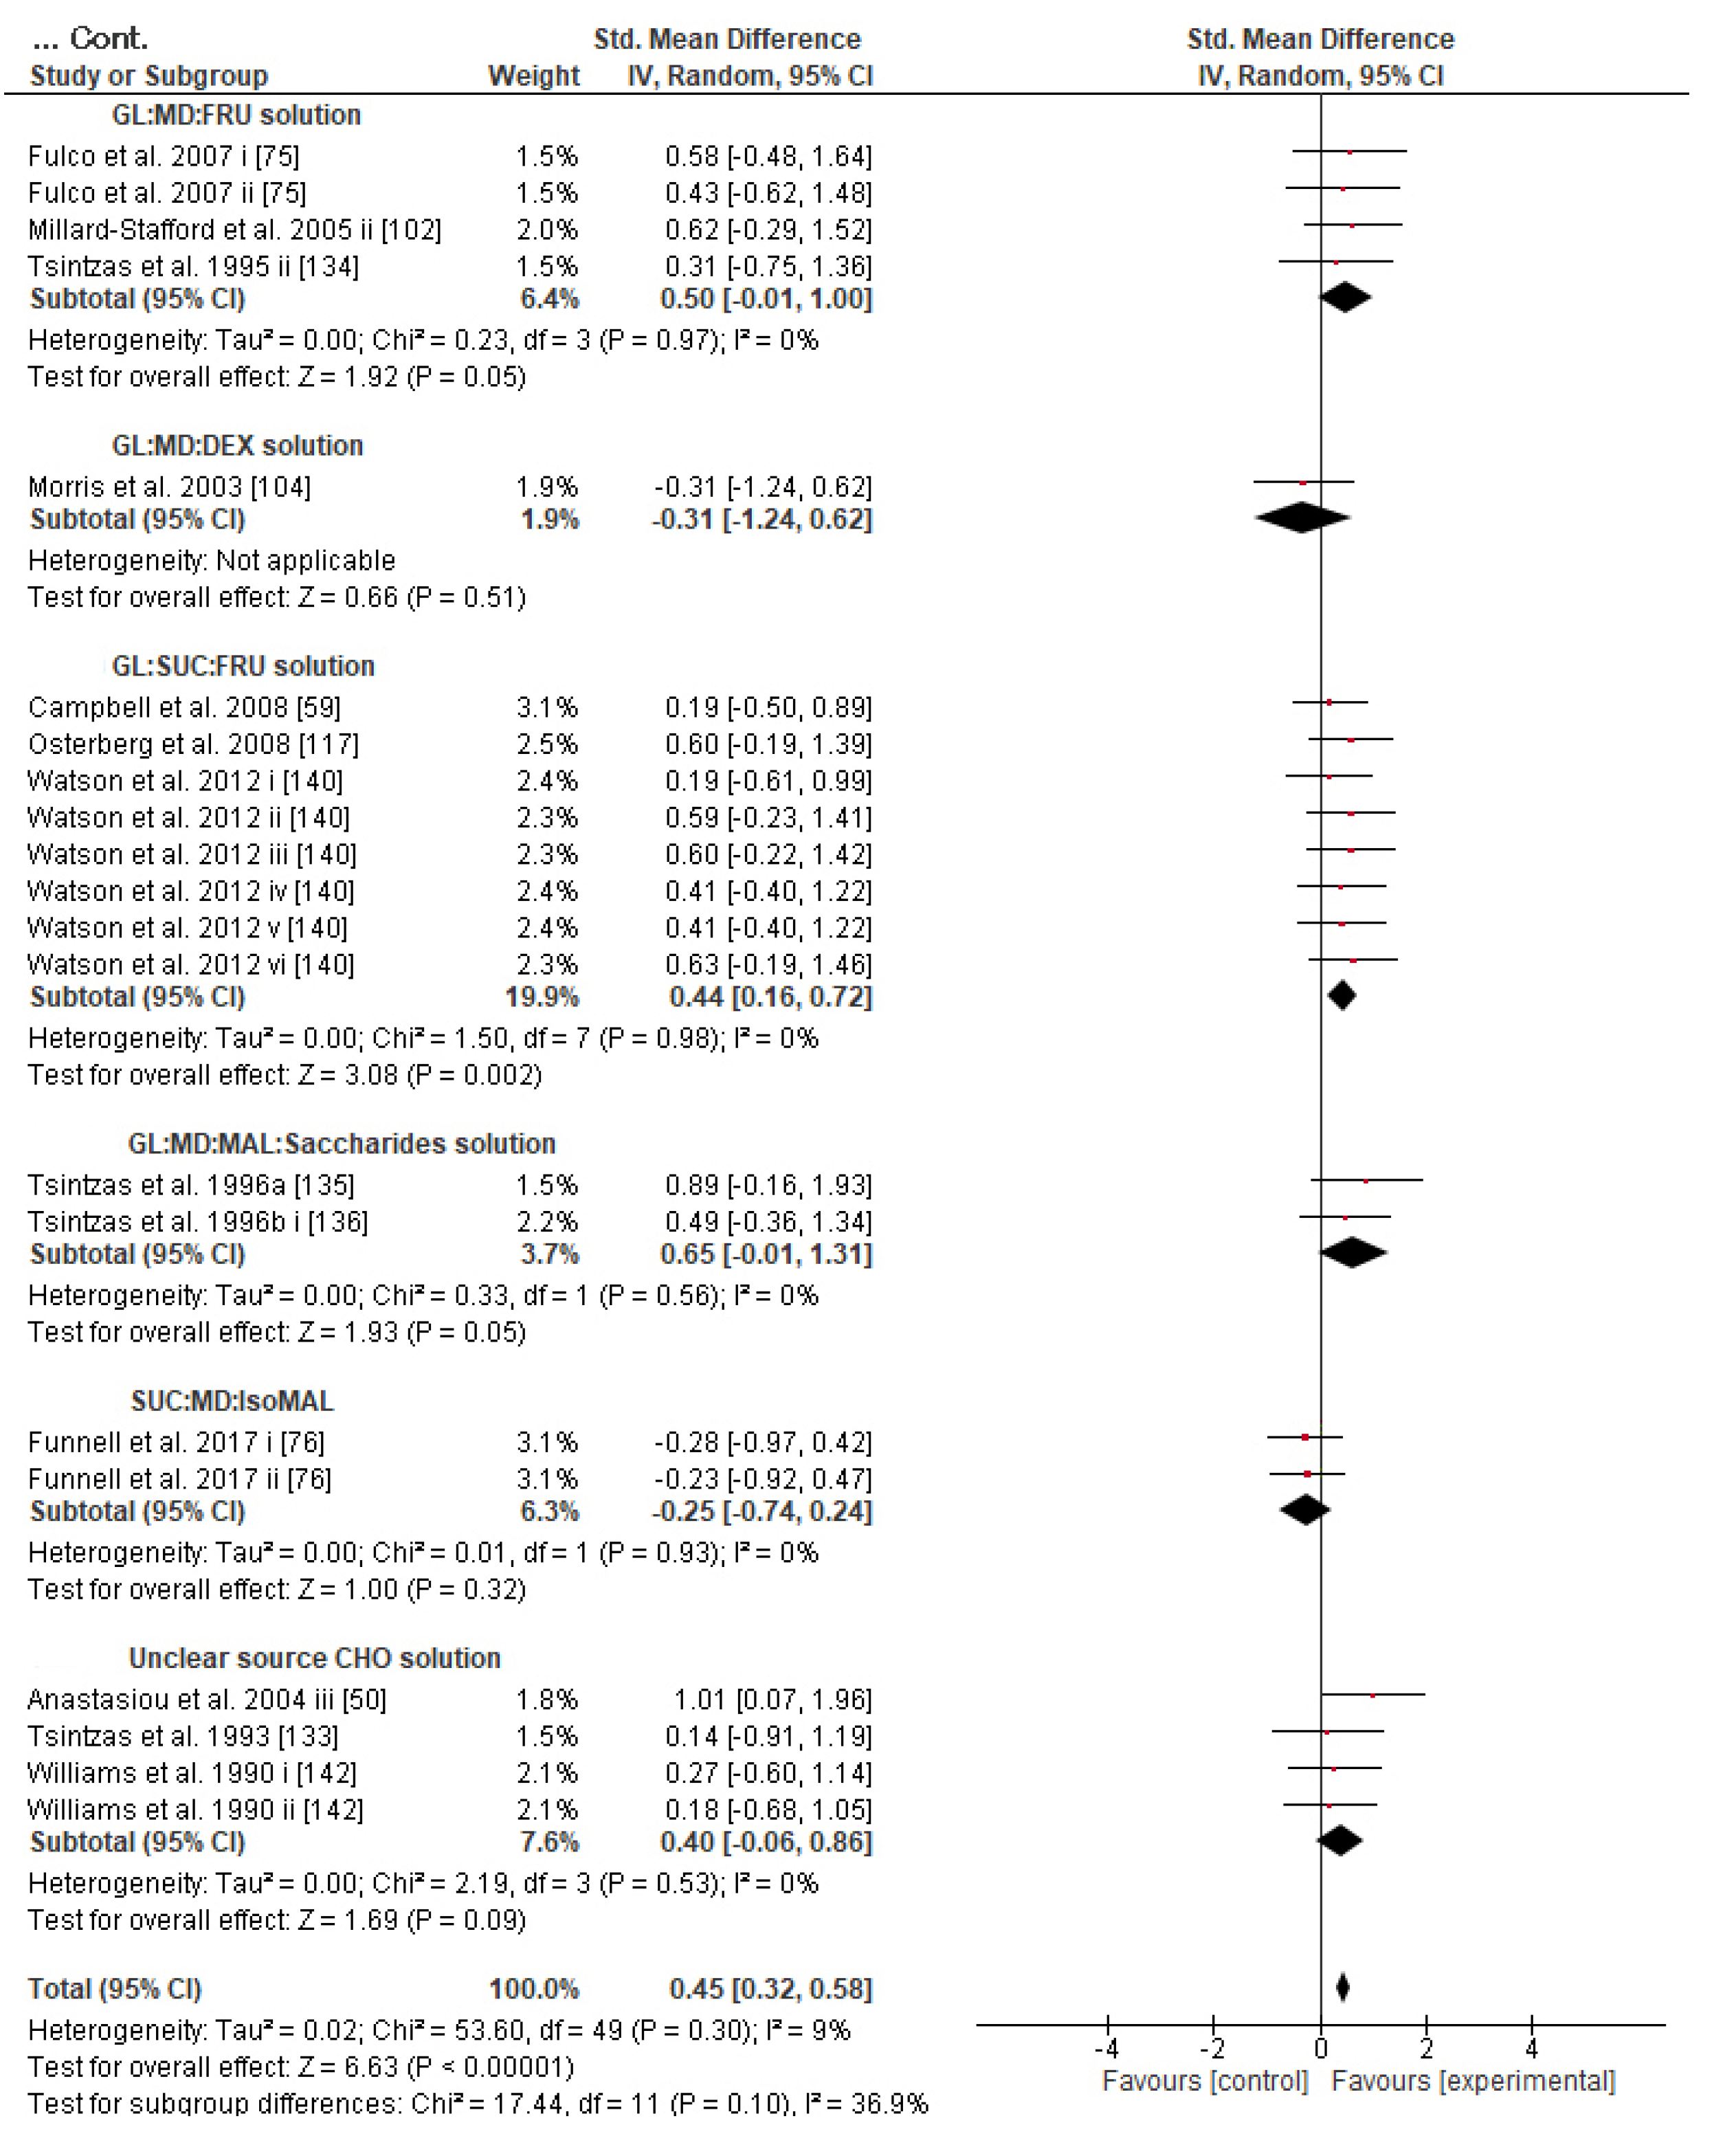
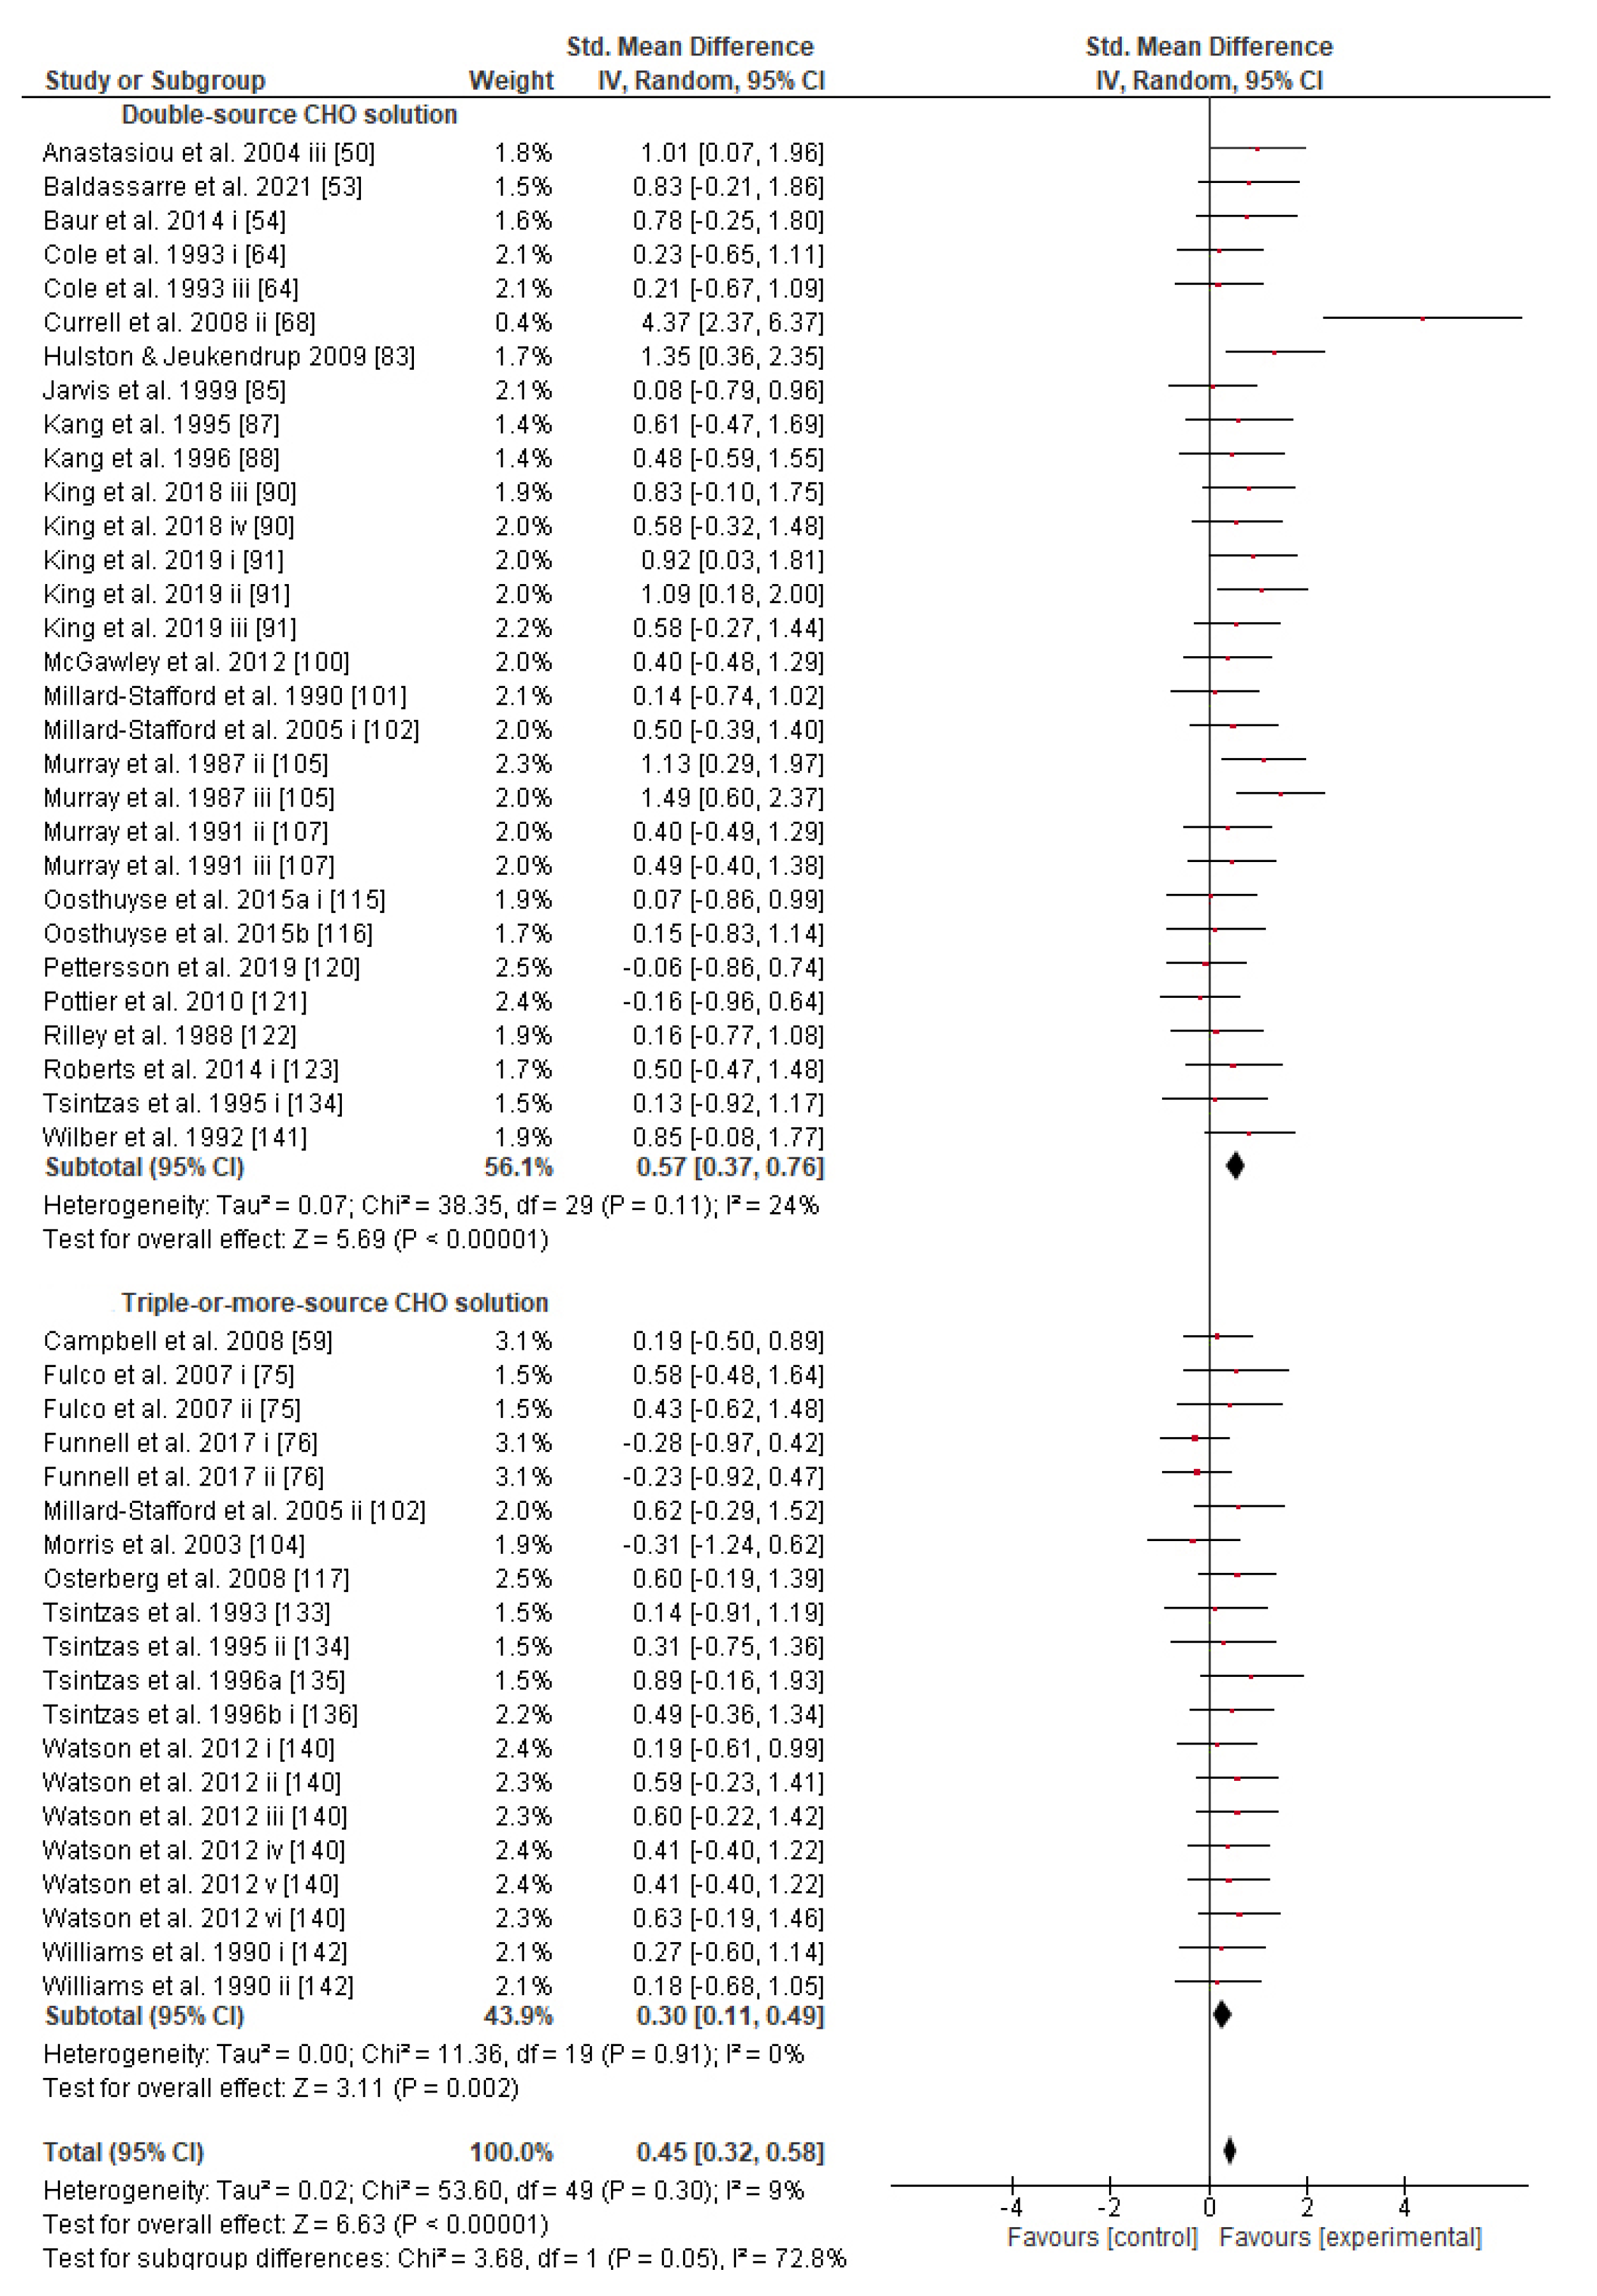
4.5. Effect of Different CHO Supplement Concentrations and CHO Solution Formulations
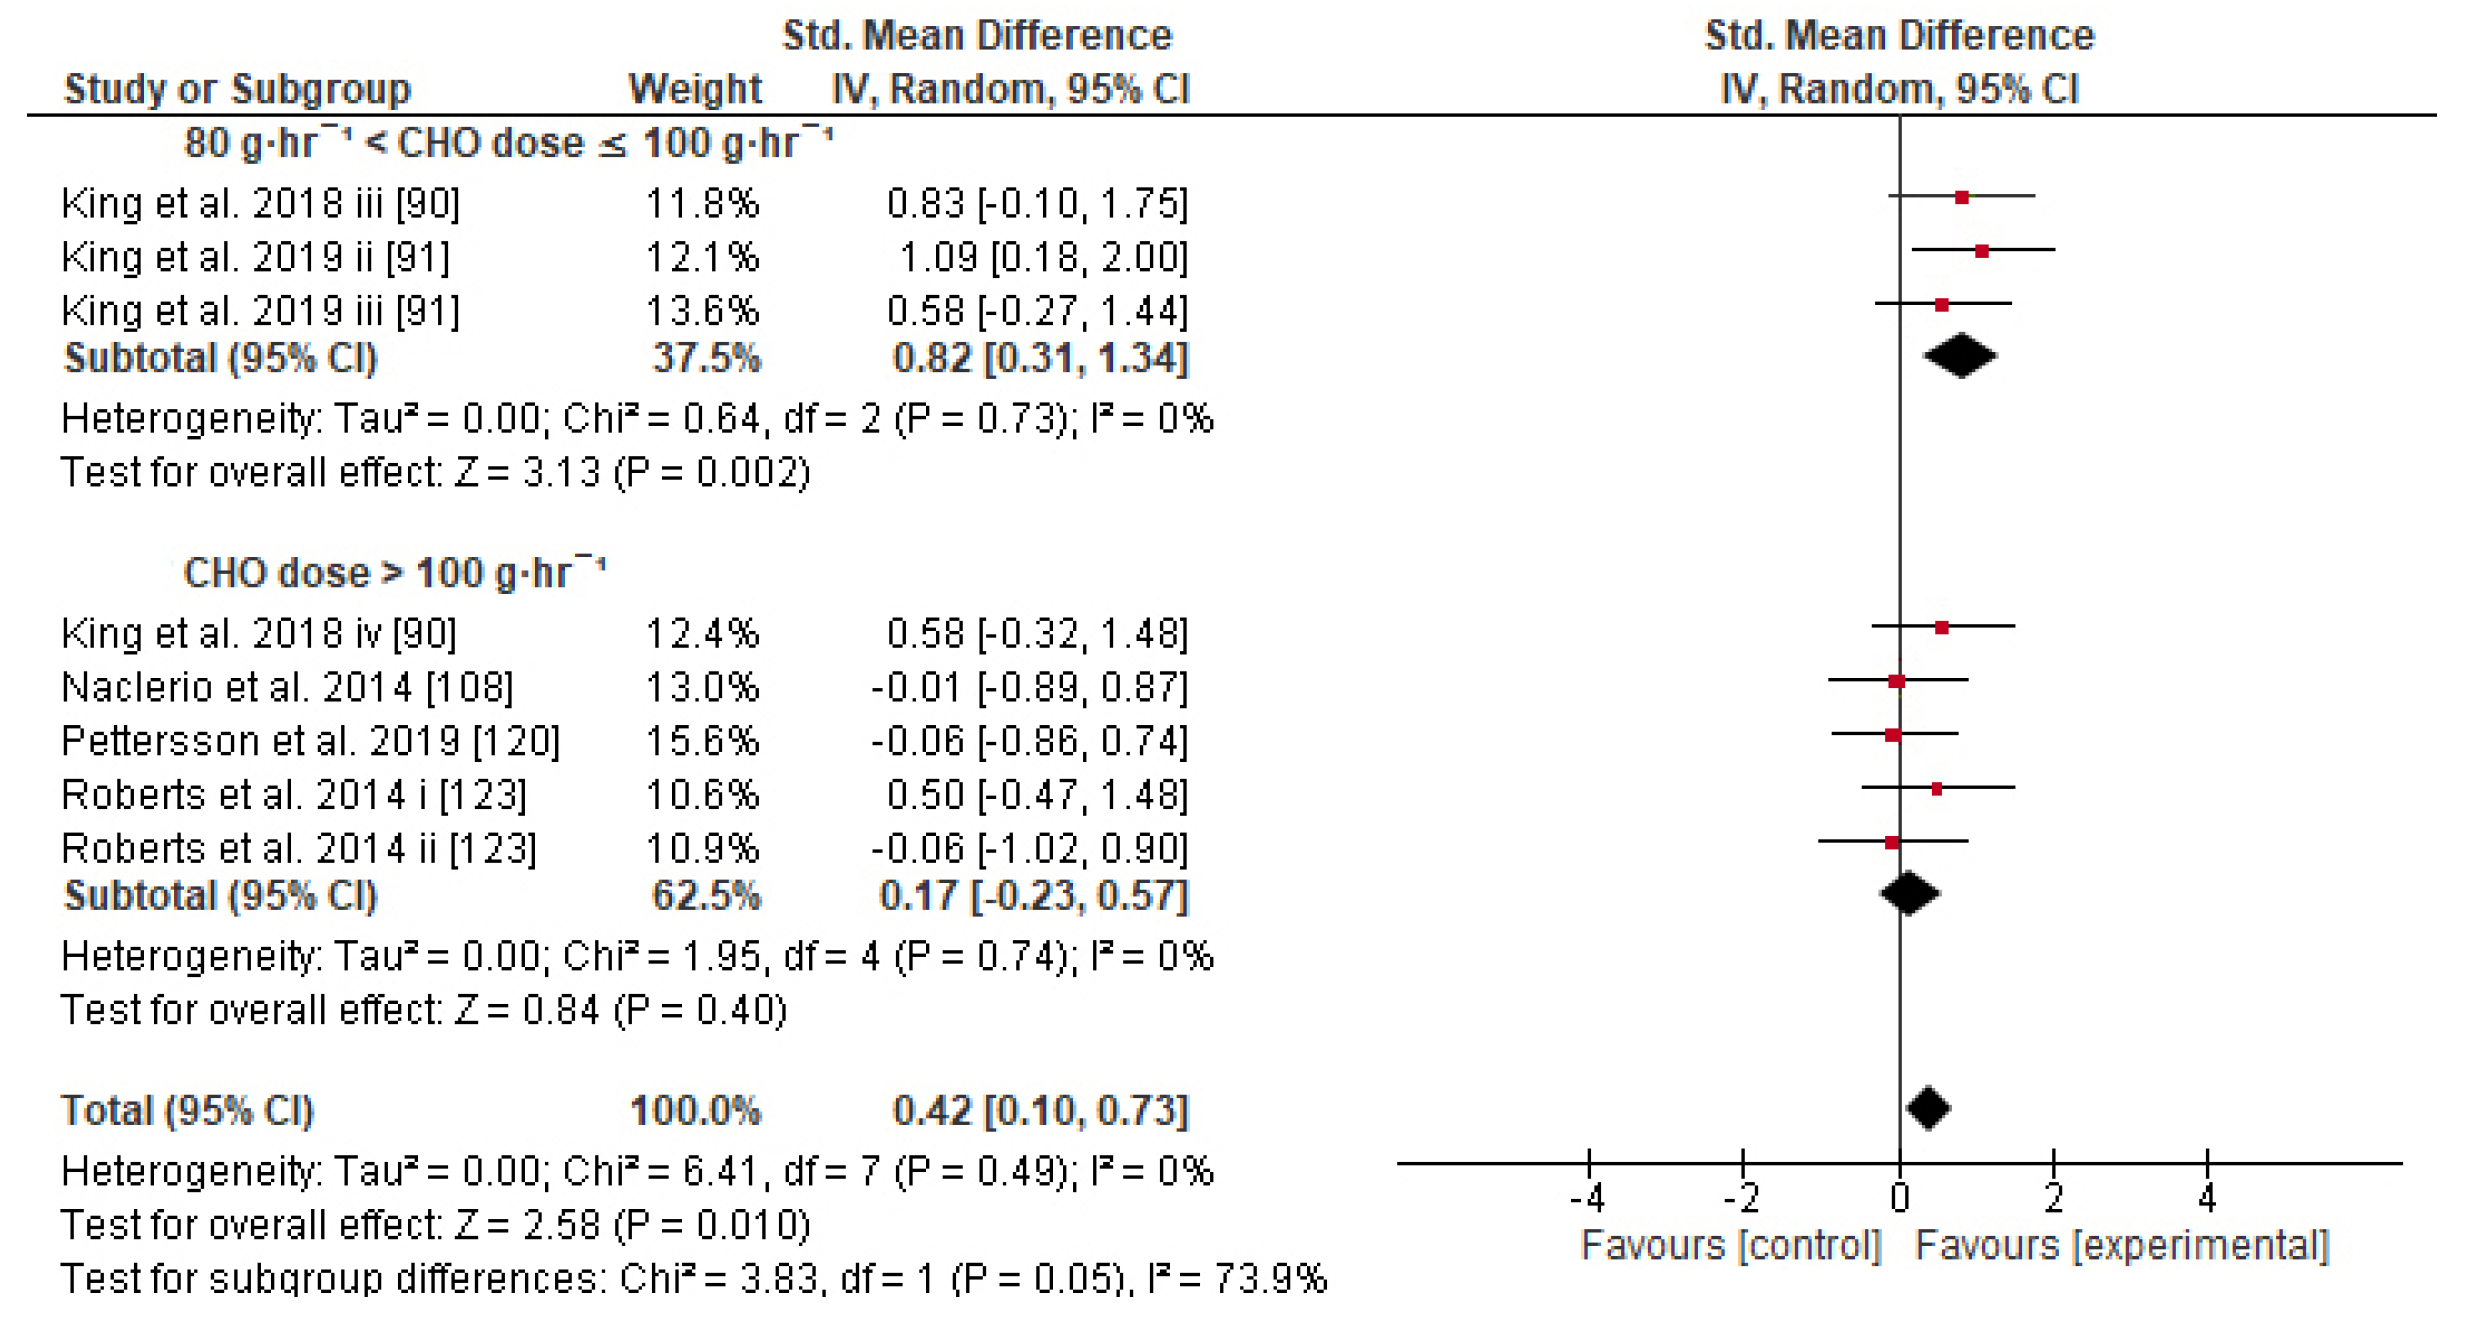
4.6. Effect of CHO Administration Time and Dose
4.7. Methodological Aspects, Strength, Limitations, and Suggestions for Future Research
4.8. Practical Implications and Guidelines for the Athlete
5. Conclusions
Supplementary Materials
Author Contributions
Funding
Institutional Review Board Statement
Informed Consent Statement
Data Availability Statement
Acknowledgments
Conflicts of Interest
References
- Zuntz, N. Ueber die Bedeutung der verschiedenen Nährstoffe als Erzeuger der Muskelkraft. Pflüg. Arch. Gesammte Physiol. Menschen Thiere 1901, 83, 557–571. [Google Scholar] [CrossRef]
- Christensen, E.H.; Hansen, O., II. Untersuchungen über die Verbrennungsvorgänge bei langdauernder, schwerer Muskelarbeit1. Skand. Arch. Physiol. 1939, 81, 152–159. [Google Scholar] [CrossRef]
- Bergström, J.; Hultman, E. Muscle glycogen synthesis after exercise: An enhancing factor localized to the muscle cells in man. Nature 1966, 210, 309–310. [Google Scholar] [CrossRef]
- Bergström, J.; Hultman, E. A study of the glycogen metabolism during exercise in man. Scand. J. Clin. Lab. Investig. 1967, 19, 218–228. [Google Scholar] [CrossRef]
- Brooke, J.D.; Davies, G.J.; Green, L.F. The effects of Normal and Glucose Syrup Work on the Performance of Racing Cyclists. J Sports Med. Phys. Fit. 1975, 15, 257–265. [Google Scholar]
- Coyle, E.F.; Hagberg, J.M.; Hurley, B.F.; Martin, W.H.; Ehsani, A.A.; Holloszy, J.O. Carbohydrate feeding during prolonged strenuous exercise can delay fatigue. J. Appl. Physiol. Respir. Environ. Exerc. Physiol. 1983, 55, 230–235. [Google Scholar] [CrossRef]
- Baker, L.B.; Jeukendrup, A.E. Optimal composition of fluid-replacement beverages. Compr. Physiol. 2014, 4, 575–620. [Google Scholar] [CrossRef]
- Collins, J.; Maughan, R.J.; Gleeson, M.; Bilsborough, J.; Jeukendrup, A.; Morton, J.P.; Phillips, S.M.; Armstrong, L.; Burke, L.M.; Close, G.L.; et al. UEFA expert group statement on nutrition in elite football. Current evidence to inform practical recommendations and guide future research. Br. J. Sports Med. 2020, 55, 416. [Google Scholar] [CrossRef]
- Thomas, D.T.; Erdman, K.A.; Burke, L.M. American College of Sports Medicine Joint Position Statement. Nutrition and Athletic Performance. Med. Sci. Sports Exerc. 2016, 48, 543–568. [Google Scholar] [CrossRef]
- Mata, F.; Valenzuela, P.L.; Gimenez, J.; Tur, C.; Ferreria, D.; Domínguez, R.; Sanchez-Oliver, A.J.; Sanz, J.M.M. Carbohydrate availability and physical performance: Physiological overview and practical recommendations. Nutrients 2019, 11, 1084. [Google Scholar] [CrossRef]
- Brooks, G.A. The precious few grams of glucose during exercise. Int. J. Mol. Sci. 2020, 21, 5733. [Google Scholar] [CrossRef]
- Kerksick, C.M.; Arent, S.; Schoenfeld, B.J.; Stout, J.R.; Campbell, B.; Wilborn, C.D.; Taylor, L.; Kalman, D.; Smith-Ryan, A.E.; Kreider, R.B.; et al. International society of sports nutrition position stand: Nutrient timing. J. Int. Soc. Sports Nutr. 2017, 14, 33. [Google Scholar] [CrossRef]
- Gagnon, D.D.; Perrier, L.; Dorman, S.C.; Oddson, B.; Larivière, C.; Serresse, O. Ambient temperature influences metabolic substrate oxidation curves during running and cycling in healthy men. Eur. J. Sport Sci. 2020, 20, 90–99. [Google Scholar] [CrossRef]
- Maunder, E.D.; Plews, D.J.; Merien, F.; Kilding, A.E. Exercise intensity regulates the effect of heat stress on substrate oxidation rates during exercise. Eur. J. Sport Sci. 2020, 20, 935–943. [Google Scholar] [CrossRef]
- Higgins, J.P.T.; Altman, D.G.; Gøtzsche, P.C.; Jüni, P.; Moher, D.; Oxman, A.D.; Savović, J.; Schulz, K.F.; Weeks, L.; Sterne, J.A.C. The Cochrane Collaboration’s tool for assessing risk of bias in randomised trials. BMJ 2011, 343, d5928. [Google Scholar] [CrossRef]
- Liberati, A.; Altman, D.G.; Tetzlaff, J.; Mulrow, C.; Gøtzsche, P.C.; Ioannidis, J.P.A.; Clarke, M.; Devereaux, P.J.; Kleijnen, J.; Moher, D. The PRISMA statement for reporting systematic reviews and meta-analyses of studies that evaluate health care interventions: Explanation and elaboration. J. Clin. Epidemiol. 2009, 62, e1–e34. [Google Scholar] [CrossRef]
- The Cochrane Collaboration. Cochrane Handbook for Systematic Reviews of Interventions, 2nd ed.; Higgins, J.P.T., Thomas, J., Chandler, J., Cumpston, M., Li, T., Page, M.J., Welch, V.A., Eds.; John Wiley & Sons: Chichester, UK, 2019; ISBN 9781119536628. [Google Scholar]
- Phillips, S.M.; Sproule, J.; Turner, A.P. Carbohydrate ingestion during team games exercise: Current knowledge and areas for future investigation. Sports Med. 2011, 41, 559–585. [Google Scholar] [CrossRef]
- Coyle, E.F. Fluid and fuel intake during exercise. J. Sports Sci. 2004, 22, 39–55. [Google Scholar] [CrossRef]
- Hopewell, S.; Dutton, S.; Yu, L.M.; Chan, A.W.; Altman, D.G. The quality of reports of randomised trials in 2000 and 2006: Comparative study of articles indexed in PubMed. BMJ 2010, 340, c723. [Google Scholar] [CrossRef]
- Deltsidou, A.; Zarikas, V.; Mastrogiannis, D.; Kapreli, E.; Bourdas, D.; Raftopoulos, V.; Noula, M.; Lykeridou, K. Data on advanced glycation end-products concentrations and haemodynamic parameters following caffeine and nicotine consumption in nursing students. Data Brief 2020, 32, 106063. [Google Scholar] [CrossRef]
- Havenetidis, K.; Bourdas, D. Creatine supplementation: Effects on urinary excretion and anaerobic performance. J. Sports Med. Phys. Fit. 2003, 43, 347–355. [Google Scholar]
- Stecker, R.A.; Harty, P.S.; Jagim, A.R.; Candow, D.G.; Kerksick, C.M. Timing of ergogenic aids and micronutrients on muscle and exercise performance. J. Int. Soc. Sports Nutr. 2019, 16, 37. [Google Scholar] [CrossRef]
- Sterne, J.A.C.; Savović, J.; Page, M.J.; Elbers, R.G.; Blencowe, N.S.; Boutron, I.; Cates, C.J.; Cheng, H.Y.; Corbett, M.S.; Eldridge, S.M.; et al. RoB 2: A revised tool for assessing risk of bias in randomised trials. BMJ 2019, 366, l4898. [Google Scholar] [CrossRef]
- Koes, B.W.; Assendelft, W.J.J.; Van der Heijden, G.J.M.G.; Bouter, L.M.; Knipschild, P.G. Spinal manipulation and mobilisation for back and neck pain: A blinded review. Br. Med. J. 1991, 303, 1298–1303. [Google Scholar] [CrossRef]
- Beckerman, H.; De Bie, R.A.; Bouter, L.M.; De Cuyper, H.J.; Oostendorp, R.A.B. The efficacy of laser therapy for musculoskeletal and skin disorders: A criteria-based meta-analysis of randomized clinical trials. Phys. Ther. 1992, 72, 483–491. [Google Scholar] [CrossRef]
- Wood, L.; Egger, M.; Gluud, L.L.; Schulz, K.F.; Jüni, P.; Altman, D.G.; Gluud, C.; Martin, R.M.; Wood, A.J.G.; Sterne, J.A.C. Empirical evidence of bias in treatment effect estimates in controlled trials with different interventions and outcomes: Meta-epidemiological study. BMJ 2008, 336, 601–605. [Google Scholar] [CrossRef]
- Verhagen, A.P.; De Vet, H.C.W.; De Bie, R.A.; Kessels, A.G.H.; Boers, M.; Knipschild, P.G. Taking baths: The efficacy of balneotherapy in patients with arthritis. A systematic review. J. Rheumatol. 1997, 24, 1964–1971. [Google Scholar]
- Schulz, K.F.; Altman, D.G.; Moher, D. CONSORT 2010 Statement: Updated guidelines for reporting parallel group randomised trials. J. Clin. Epidemiol. 2010, 63, 834–840. [Google Scholar] [CrossRef]
- Moher, D.; Hopewell, S.; Schulz, K.F.; Montori, V.; Gøtzsche, P.C.; Devereaux, P.J.; Elbourne, D.; Egger, M.; Altman, D.G. CONSORT 2010 explanation and elaboration: Updated guidelines for reporting parallel group randomised trials. BMJ 2010, 340, c869. [Google Scholar] [CrossRef]
- Current Version of RoB 2. Available online: https://sites.google.com/site/riskofbiastool/welcome/rob-2-0-tool/current-version-of-rob-2 (accessed on 24 November 2021).
- Hopkins, W.G.; Schabort, E.J.; Hawley, J.A. Reliability of power in physical performance tests. Sports Med. 2001, 31, 211–234. [Google Scholar] [CrossRef]
- Hopkins, W.G.; Hawley, J.A.; Burke, L.M. Design and analysis of research on sport performance enhancement. Med. Sci. Sports Exerc. 1999, 31, 472–485. [Google Scholar] [CrossRef] [PubMed]
- Hopkins, W.G. How to Interpret Changes in an Athletic Performance Test. Sportscience 2004, 8, 1–7. [Google Scholar]
- Thomas, J.R.; Nelson, J.K.; Silverman, S.J. Research Methods in Physical Activity, 7th ed.; Human Kinetics Publishers Inc.: Champaign, IL, USA, 2015; ISBN 9781450470445. [Google Scholar]
- Hedges, L.V. Distribution Theory for Glass’s Estimator of Effect size and Related Estimators. J. Educ. Stat. 1981, 6, 107–128. [Google Scholar] [CrossRef]
- Hedges, L.V.; Stock, W. The Effects of Class Size: An Examination of Rival Hypotheses. Am. Educ. Res. J. 1983, 20, 85. [Google Scholar] [CrossRef]
- Deeks, J.; Higgins, J. Statistical Algorithms in Review Manager 5; Cochrane Collaboration: London, UK, 2010; pp. 1–11. [Google Scholar]
- World Health Organization. World Health Statistics 2019: Monitoring Health for the SDGs, Sustainable Development Goals; WHO/DAD/2019.1: Geneva, Switzerland, 2019; ISBN 9789241565707. [Google Scholar]
- Heyward, V.H.; Gibson, A.L. Assessing Cardiorespiratory Fitness. In Advanced Fitness Assessment and Exercise Prescription; Human Kinetics Publishers Inc.: Champaign, IL, USA, 2014; pp. 79–119. ISBN 78-1-4504-6600-4. [Google Scholar]
- Sedgwick, P. Meta-analyses: What is heterogeneity? BMJ 2015, 350, h1435. [Google Scholar] [CrossRef]
- Higgins, J.P.T.; Thompson, S.G.; Deeks, J.J.; Altman, D.G. Measuring inconsistency in meta-analyses. Br. Med. J. 2003, 327, 557–560. [Google Scholar] [CrossRef] [PubMed]
- Higgins, J.P.T.; Thompson, S.G. Quantifying heterogeneity in a meta-analysis. Stat. Med. 2002, 21, 1539–1558. [Google Scholar] [CrossRef]
- Brockwell, S.E.; Gordon, I.R. A comparison of statistical methods for meta-analysis. Stat. Med. 2001, 20, 825–840. [Google Scholar] [CrossRef]
- Rice, K.; Higgins, J.P.T.; Lumley, T. A re-evaluation of fixed-effect(s) meta-analysis. J. R. Stat. Soc. 2018, 181, 205–227. [Google Scholar] [CrossRef]
- Peto, R.; Collins, R.; Gray, R. “Large-scale randomized evidence: Large, simple trials and overviews of trials”: Discussion. A clinician’s perspective on meta-analyses. J. Clin. Epidemiol. 1995, 48, 23–40. [Google Scholar] [CrossRef]
- Acker-Hewitt, T.L.; Shafer, B.M.; Saunders, M.J.; Goh, Q.; Luden, N.D. Independent and combined effects of carbohydrate and caffeine ingestion on aerobic cycling performance in the fed state tiffany. Appl. Physiol. Nutr. Metab. 2012, 37, 276–283. [Google Scholar] [CrossRef] [PubMed]
- Alghannam, A.F. Carbohydrate-protein ingestion improves subsequent running capacity towards the end of a football-specific intermittent exercise. Appl. Physiol. Nutr. Metab. 2011, 36, 748–757. [Google Scholar] [CrossRef] [PubMed]
- Ali, A.; Williams, C.; Nicholas, C.W.; Foskett, A. The influence of carbohydrate-electrolyte ingestion on soccer skill performance. Med. Sci. Sports Exerc. 2007, 39, 1969–1976. [Google Scholar] [CrossRef]
- Anastasiou, C.A.; Kavouras, S.A.; Koutsari, C.; Georgakakis, C.; Skenderi, K.; Beer, M.; Sidossis, L.S. Effect of maltose-containing sports drinks on exercise performance. Int. J. Sport Nutr. Exerc. Metab. 2004, 14, 609–625. [Google Scholar] [CrossRef]
- Angus, D.J.; Hargreaves, M.; Dancey, J.; Febbraio, M.A. Effect of carbohydrate or carbohydrate plus medium-chain triglyceride ingestion on cycling time trial performance. J. Appl. Physiol. 2000, 88, 113–119. [Google Scholar] [CrossRef]
- Bailey, S.P.; Zacher, C.M.; Mittleman, K.D. Effect of menstrual cycle phase on carbohydrate supplementation during prolonged exercise to fatigue. J. Appl. Physiol. 2000, 88, 690–697. [Google Scholar] [CrossRef]
- Baldassarre, R.; Ieno, C.; Bonifazi, M.; Di Castro, A.; Gianfelici, A.; Piacentini, M.F. Carbohydrate supplementation during a simulated 10-km open water swimming race: Effects on physiological, perceptual parameters and performance. Eur. J. Sport Sci. 2021. ahead of print. [Google Scholar] [CrossRef]
- Baur, D.A.; Schroer, A.B.; Luden, N.D.; Womack, C.J.; Smyth, S.A.; Saunders, M.J. Glucose-fructose enhances performance versus isocaloric, but not moderate, glucose. Med. Sci. Sports Exerc. 2014, 46, 1778–1786. [Google Scholar] [CrossRef]
- Below, P.R.; Mora-Rodríguez, R.; José, G.A.; Coyle, E.F. Fluid and carbohydrate ingestion independently improve performance during 1 h of intense exercise. Med. Sci. Sports Exerc. 1995, 27, 200–210. [Google Scholar] [CrossRef]
- Bishop, N.C.; Blannin, A.K.; Walsh, N.P.; Gleeson, M. Carbohydrate beverage ingestion and neutrophil degranulation responses following cycling to fatigue at 75% VO2 max. Int. J. Sports Med. 2001, 22, 226–231. [Google Scholar] [CrossRef]
- Burgess, W.A.; Davis, J.M.; Bartoli, W.P.; Woods, J.A. Failure of low dose carbohydrate feeding to attenuate glucoregulatory hormone responses and improve endurance performance. Int. J. Sport Nutr. 1991, 1, 338–352. [Google Scholar] [CrossRef] [PubMed]
- Byrne, C.; Lin, C.L.; Chew, S.A.N.; Ming, E.T.Y. Water versus Carbohydrate-Electrolyte Fluid Replacement during. Mil. Med. 2005, 170, 715–722. [Google Scholar] [CrossRef]
- Campbell, C.; Prince, D.; Braun, M.; Applegate, E.; Casazza, G.A. Carbohydrate-supplement form and exercise performance. Int. J. Sport Nutr. Exerc. Metab. 2008, 18, 179–190. [Google Scholar] [CrossRef] [PubMed]
- Carter, J.; Jeukendrup, A.E.; Mundel, T.; Jones, D.A. Carbohydrate supplementation improves moderate and high-intensity exercise in the heat. Pflug. Arch. Eur. J. Physiol. 2003, 446, 211–219. [Google Scholar] [CrossRef]
- Carter, J.; Jeukendrup, A.E.; Jones, D.A. The effect of sweetness on the efficacy of carbohydrate supplementation during exercise in the heat. Can. J. Appl. Physiol. 2005, 30, 379–391. [Google Scholar] [CrossRef]
- Clark, V.R.; Hopkins, W.G.; Hawley, J.A.; Burke, L.M. Placebo effect of carbohydrate feedings during a 40-km cycling time trial. Med. Sci. Sports Exerc. 2000, 32, 1642–1647. [Google Scholar] [CrossRef]
- Clarke, N.D.; Maclaren, D.P.M.; Reilly, T.; Drust, B. Carbohydrate ingestion and pre-cooling improves exercise capacity following soccer-specific intermittent exercise performed in the heat. Eur. J. Appl. Physiol. 2011, 111, 1447–1455. [Google Scholar] [CrossRef]
- Cole, K.J.; Grandjean, P.W.; Sobszak, R.J.; Mitchell, J.B. Effect of carbohydrate composition on fluid balance, gastric emptying, and exercise performance. Int. J. Sport Nutr. 1993, 3, 408–417. [Google Scholar] [CrossRef]
- Cole, M.; Hopker, J.G.; Wiles, J.D.; Coleman, D.A. The effects of acute carbohydrate and caffeine feeding strategies on cycling efficiency. J. Sports Sci. 2018, 36, 817–823. [Google Scholar] [CrossRef]
- Coletta, A.; Thompson, D.L.; Raynor, H.A. The influence of commercially-available carbohydrate and carbohydrate-protein supplements on endurance running performance in recreational athletes during a field trial. J. Int. Soc. Sports Nutr. 2013, 10, 17. [Google Scholar] [CrossRef]
- Cureton, K.J.; Warren, G.L.; Millard-Stafford, M.L.; Wingo, J.E.; Trilk, J.; Buyckx, M. Caffeinated sports drink: Ergogenic effects and possible mechanisms. Int. J. Sport Nutr. Exerc. Metab. 2007, 17, 35–55. [Google Scholar] [CrossRef] [PubMed]
- Currell, K.; Jeukendrup, A.E. Superior endurance performance with ingestion of multiple transportable carbohydrates. Med. Sci. Sports Exerc. 2008, 40, 275–281. [Google Scholar] [CrossRef] [PubMed]
- Davis, J.M.; Welsh, R.S.; Alderson, N.A. Effects of carbohydrate and chromium ingestion during intermittent high-intensity exercise to fatigue. Int. J. Sport Nutr. 2000, 10, 476–485. [Google Scholar] [CrossRef] [PubMed]
- Desbrow, B.; Anderson, S.; Barrett, J.; Rao, E.; Hargreaves, M. Carbohydrate-electrolyte feedings and 1h time trial cycling performance. Int. J. Sport Nutr. Exerc. Metab. 2004, 14, 541–549. [Google Scholar] [CrossRef]
- Duhamel, T.A.; Green, H.J.; Stewart, R.D.; Foley, K.P.; Smith, I.C.; Ouyang, J. Muscle metabolic, SR Ca2+-cycling responses to prolonged cycling, with and without glucose supplementation. J. Appl. Physiol. 2007, 103, 1986–1998. [Google Scholar] [CrossRef]
- El-Sayed, M.S.; Rattu, A.J.M.; Roberts, I. Effects of carbohydrate feeding before and during prolonged exercise on subsequent maximal exercise performance capacity. Int. J. Sport Nutr. 1995, 5, 215–224. [Google Scholar] [CrossRef][Green Version]
- El-Sayed, M.S.; Balmer, J.; Rattu, A.J.M. Carbohydrate ingestion improves endurance performance during a 1 h simulated cycling time trial. J. Sports Sci. 1997, 15, 223–230. [Google Scholar] [CrossRef]
- Finger, D.; Farinha, J.B.; Brusco, C.M.; Boeno, F.P.; Cadore, E.L.; Pinto, R.S.; Lanferdini, F.J.; Helal, L. Ingestion of carbohydrate or carbohydrate plus protein does not enhance performance during endurance exercise: A randomized crossover placebo-controlled clinical trial. Appl. Physiol. Nutr. Metab. 2018, 43, 937–944. [Google Scholar] [CrossRef]
- Fulco, C.S.; Zupan, M.; Muza, S.R.; Rock, P.B.; Kambis, K.; Payn, T.; Hannon, M.; Glickman, E.; Cymerman, A. Carbohydrate supplementation and endurance performance of moderate altitude residents at 4300 m. Int. J. Sports Med. 2007, 28, 437–443. [Google Scholar] [CrossRef]
- Funnell, M.P.; Dykes, N.R.; Owen, E.J.; Mears, S.A.; Rollo, I.; James, L.J. Ecologically valid carbohydrate intake during soccer-specific exercise does not affect running performance in a fed state. Nutrients 2017, 9, 39. [Google Scholar] [CrossRef]
- Ganio, M.S.; Klau, J.F.; Lee, E.C.; Yeargin, S.W.; McDermott, B.P.; Buyckx, M.; Maresh, C.M.; Armstrong, L.E. Effect of various carbohydrate-electrolyte fluids on cycling performance and maximal voluntary contraction. Int. J. Sport Nutr. Exerc. Metab. 2010, 20, 104–114. [Google Scholar] [CrossRef]
- Glace, B.W.; Kremenic, I.J.; McHugh, M.P. Effect of carbohydrate beverage ingestion on central versus peripheral fatigue: A placebo-controlled, randomized trial in cyclists. Appl. Physiol. Nutr. Metab. 2019, 44, 139–147. [Google Scholar] [CrossRef]
- Goedecke, J.H.; White, N.J.; Chicktay, W.; Mahomed, H.; Durandt, J.; Lambert, M.I. The effect of carbohydrate ingestion on performance during a simulated soccer match. Nutrients 2013, 5, 5193–5204. [Google Scholar] [CrossRef] [PubMed]
- Gui, Z.; Sun, F.; Si, G.; Chen, Y. Effect of protein and carbohydrate solutions on running performance and cognitive function in female recreational runners. PLoS ONE 2017, 12, e0185982. [Google Scholar] [CrossRef] [PubMed]
- Heesch, M.W.S.; Mieras, M.E.; Slivka, D.R. The performance effect of early versus late carbohydrate feedings during prolonged exercise. Appl. Physiol. Nutr. Metab. 2014, 39, 58–63. [Google Scholar] [CrossRef]
- Hulston, C.J.; Jeukendrup, A.E. Substrate metabolism and exercise performance with caffeine and carbohydrate intake. Med. Sci. Sports Exerc. 2008, 40, 2096–2104. [Google Scholar] [CrossRef] [PubMed]
- Hulston, C.J.; Jeukendrup, A.E. No placebo effect from carbohydrate intake during prolonged exercise. Int. J. Sport Nutr. Exerc. Metab. 2009, 19, 275–284. [Google Scholar] [CrossRef]
- Ivy, J.L.; Miller, W.; Dover, V.; Goodyear, L.G.; Sherman, W.M.; Farrell, S.; Williams, H. Endurance improved by ingestion of a glucose polymer supplement. Med. Sci. Sports Exerc. 1983, 15, 466–471. [Google Scholar] [CrossRef]
- Jarvis, A.T.; Felix, S.D.; Sims, S.; Jones, M.T.; Anne, M.; Headley, S.A. Carbohydrate supplementation fails to improve the sprint performance of female cyclists. JEP Online 1999, 2, 16–23. [Google Scholar]
- Jeukendrup, A.; Brouns, F.; Wagenmakers, A.J.M.; Saris, W.H.M. Carbohydrate-electrolyte feedings improve 1 h time trial cycling performance. Int. J. Sports Med. 1997, 18, 125–129. [Google Scholar] [CrossRef]
- Kang, J.; Robertson, R.J.; Denys, B.G.; DaSilva, S.G.; Visich, P.; Suminski, R.R.; Utter, A.C.; Goss, F.L.; Metz, K.F. Effect of carbohydrate ingestion subsequent to carbohydrate supercompensation on endurance performance. Int. J. Sport Nutr. 1995, 5, 329–343. [Google Scholar] [CrossRef] [PubMed]
- Kang, J.; Robertson, R.J.; Goss, F.L.; DaSilva, S.G.; Visich, P.; Suminski, R.R.; Utter, A.C.; Denys, B.C. Effect of carbohydrate substrate availability on ratings of perceived exertion during prolonged exercise of moderate intensity. Percept. Mot. Ski. 1996, 82, 495–506. [Google Scholar] [CrossRef] [PubMed]
- Khanna, G.L.; Manna, I. Supplementary effect of carbohydrate-electrolyte drink on sports performance, lactate removal & cardiovascular response of athletes. Indian J. Med. Res. 2005, 121, 665–669. [Google Scholar]
- King, A.J.; O’Hara, J.P.; Morrison, D.J.; Preston, T.; King, R.F.G.J. Carbohydrate dose influences liver and muscle glycogen oxidation and performance during prolonged exercise. Physiol. Rep. 2018, 6, e13555. [Google Scholar] [CrossRef]
- King, A.J.; O’Hara, J.P.; Arjomandkhah, N.C.; Rowe, J.; Morrison, D.J.; Preston, T.; King, R.F.G.J. Liver and muscle glycogen oxidation and performance with dose variation of glucose–fructose ingestion during prolonged (3 h) exercise. Eur. J. Appl. Physiol. 2019, 119, 1157–1169. [Google Scholar] [CrossRef]
- Kingwell, B.; McKenna, M.J.; Sandstrom, E.R.; Hargreaves, M. Effect of glucose polymer ingestion on energy and fluid balance during exercise. J. Sports Sci. 1989, 7, 3–8. [Google Scholar] [CrossRef] [PubMed]
- Learsi, S.K.; Ghiarone, T.; Silva-Cavalcante, M.D.; Andrade-Souza, V.A.; Ataide-Silva, T.; Bertuzzi, R.; de Araujo, G.G.; McConell, G.; Lima-Silva, A.E. Cycling time trial performance is improved by carbohydrate ingestion during exercise regardless of a fed or fasted state. Scand. J. Med. Sci. Sports 2019, 29, 651–662. [Google Scholar] [CrossRef]
- Lugo, M.; Sherman, W.M.; Wimer, G.S.; Garleb, K. Metabolic responses when different forms of carbohydrate energy are consumed during cycling. Int. J. Sport Nutr. 1993, 3, 398–407. [Google Scholar] [CrossRef]
- Martínez-Lagunas, V.; Ding, Z.; Bernard, J.R.; Wang, B.; Ivy, J.L. Added Protein Maintains Efficacy of a Low-Carbohydrate Sports Drink. J. Strength Cond. Res. 2010, 24, 48–59. [Google Scholar] [CrossRef]
- Maughan, R.J.; Fenn, C.E.; Leiper, J.B. Effects of fluid, electrolyte and substrate ingestion on endurance capacity. Eur. J. Appl. Physiol. Occup. Physiol. 1989, 58, 481–486. [Google Scholar] [CrossRef]
- McConell, G.; Kloot, K.; Hargreaves, M. Effect of timing of carbohydrate ingestion on endurance exercise performance. Med. Sci. Sports Exerc. 1996, 28, 1300–1304. [Google Scholar] [CrossRef]
- McConell, G.; Snow, R.J.; Proietto, J.; Hargreaves, M. Muscle metabolism during prolonged exercise in humans: Influence of carbohydrate availability. J. Appl. Physiol. 1999, 87, 1083–1086. [Google Scholar] [CrossRef]
- McConell, G.K.; Canny, B.J.; Daddo, M.C.; Nance, M.J.; Snow, R.J. Effect of carbohydrate ingestion on glucose kinetics and muscle metabolism during intense endurance exercise. J. Appl. Physiol. 2000, 89, 1690–1698. [Google Scholar] [CrossRef] [PubMed]
- McGawley, K.; Shannon, O.; Betts, J. Ingesting a high-dose carbohydrate solution during the cycle section of a simulated olympicdistance triathlon improves subsequent run performance. Appl. Physiol. Nutr. Metab. 2012, 37, 664–671. [Google Scholar] [CrossRef] [PubMed]
- Millard-Stafford, M.; Sparling, P.B.; Rosskopf, L.B.; Hinson, B.T.; Dicarlo, L.J. Carbohydrate-electrolyte replacement during a simulated triathlon in the heat. Med. Sci. Sports Exerc. 1990, 22, 621–628. [Google Scholar] [CrossRef] [PubMed]
- Millard-Stafford, M.L.; Sparling, P.B.; Rosskopf, L.B.; Snow, T.K. Should carbohydrate concentration of a sports drink be less than 8% during exercise in the heat? Int. J. Sport Nutr. Exerc. Metab. 2005, 15, 117–130. [Google Scholar] [CrossRef]
- Millard-Stafford, M.L.; Cureton, K.J.; Wingo, J.E.; Trilk, J.; Warren, G.L.; Buyckx, M. Hydration during exercise in warm, humid conditions: Effect of a caffeinated sports drink. Int. J. Sport Nutr. Exerc. Metab. 2007, 17, 163–177. [Google Scholar] [CrossRef]
- Morris, J.G.; Nevill, M.E.; Thompson, D.; Collie, J.; Williams, C. The influence of a 6.5% carbohydrate-electrolyte solution on performance of prolonged intermittent high-intensity running at 30 °C. J. Sports Sci. 2003, 21, 371–381. [Google Scholar] [CrossRef]
- Murray, R.; Eddy, D.E.; Murray, T.W.; Seifert, J.G.; Paul, G.L.; Halaby, G.A. The effect of fluid and carbohydrate feedings during intermittent cycling exercise. Med. Sci. Sports Exerc. 1987, 19, 597–604. [Google Scholar] [CrossRef]
- Murray, R.; Seifert, J.G.; Eddy, D.E.; Paul, G.L.; Halaby, G.A. Carbohydrate feeding and exercise: Effect of beverage carbohydrate content. Eur. J. Appl. Physiol. Occup. Physiol. 1989, 59, 152–158. [Google Scholar] [CrossRef]
- Murray, R.; Paul, G.L.; Seifert, J.G.; Eddy, D.E. Responses to varying rates of carbohydrate ingestion during exercise. Med. Sci. Sports Exerc. 1991, 23, 713–718. [Google Scholar] [CrossRef]
- Naclerio, F.; Larumbe-Zabala, E.; Cooper, R.; Judith, A.; Alkhatib, A.; Baddeley-White, D.; Garcia, S.; Zanotto, T. Effect of a multi-ingredient supplement on intermittent sprint performance, fatigue perception, muscle damage and immunosuppression in recreational athletes. J. Int. Soc. Sports Nutr. 2014, 11, 1151–1158. [Google Scholar] [CrossRef]
- Nassif, C.; Gomes, A.R.; Peixoto, G.H.C.; Chagas, M.H.; Soares, D.D.; Silami-Garcia, E.; Drinkwater, E.J.; Cannon, J.; Marino, F.E. The effect of double—Blind carbohydrate ingestion during 60 km of self-paced exercise in warm ambient conditions. PLoS ONE 2014, 9, e104710. [Google Scholar] [CrossRef] [PubMed]
- Nassis, G.P.; Williams, C.; Chisnall, P. Effect of a carbohydrate-electrolyte drink on endurance capacity during prolonged intermittent high intensity running. Br. J. Sports Med. 1998, 32, 248–252. [Google Scholar] [CrossRef] [PubMed]
- Newell, M.L.; Hunter, A.M.; Lawrence, C.; Tipton, K.D.; Galloway, S.D.R. The ingestion of 39 or 64 g·hr-1 of carbohydrate is equally effective at improving endurance exercise performance in cyclists. Int. J. Sport Nutr. Exerc. Metab. 2015, 25, 285–292. [Google Scholar] [CrossRef]
- Nicholas, C.W.; Williams, C.; Lakomy, H.K.A.; Phillips, G.; Nowitz, A. Influence of ingesting a carbohydrate-electrolyte solution on endurance capacity during intermittent, high-intensity shuttle running. J. Sports Sci. 1995, 13, 283–290. [Google Scholar] [CrossRef] [PubMed]
- Nikolopoulos, V.; Arkinstall, M.J.; Hawley, J.A. Reduced Neuromuscular Activity with Carbohydrate Ingestion during Constant Load Cycling. Int. J. Sport Nutr. Exerc. Metab. 2004, 14, 161–170. [Google Scholar] [CrossRef]
- Nishibata, I.; Sadamoto, T.; Mutoh, Y.; Miyashita, M. Glucose ingestion before and during exercise does not enhance performance of daily repeated endurance exercise. Eur. J. Appl. Physiol. Occup. Physiol. 1993, 66, 65–69. [Google Scholar] [CrossRef]
- Oosthuyse, T.; Carstens, M.; Millen, A.M.E. Ingesting isomaltulose versus fructose-maltodextrin during prolonged moderate-heavy exercise increases fat oxidation but impairs gastrointestinal comfort and cycling performance. Int. J. Sport Nutr. Exerc. Metab. 2015, 25, 427–438. [Google Scholar] [CrossRef]
- Oosthuyse, T.; Carstens, M.; Millen, A.M.E. Whey or Casein Hydrolysate with Carbohydrate for Metabolism and Performance in Cycling. Int. J. Sports Med. 2015, 36, 636–646. [Google Scholar] [CrossRef]
- Osterberg, K.L.; Zachwieja, J.J.; Smith, J.W. Carbohydrate and carbohydrate + protein for cycling time-trial performance. J. Sports Sci. 2008, 26, 227–233. [Google Scholar] [CrossRef] [PubMed]
- O’Hara, J.P.; Carroll, S.; Cooke, C.B.; King, R.F.G.J. The effect of pre-exercise galactose and glucose ingestion on high-intensity endurance cycling. J. Strength Cond. Res. 2014, 28, 2145–2153. [Google Scholar] [CrossRef] [PubMed]
- O’Neal, E.K.; Poulos, S.P.; Wingo, J.E.; Richardson, M.T.; Bishop, P.A. Post-prandial carbohydrate ingestion during 1-h of moderate-intensity, intermittent cycling does not improve mood, perceived exertion, or subsequent power output in recreationally-active exercisers. J. Int. Soc. Sports Nutr. 2013, 10, 4. [Google Scholar] [CrossRef]
- Pettersson, S.; Edin, F.; Bakkman, L.; McGawley, K. Effects of supplementing with an 18% carbohydrate-hydrogel drink in -5 °C with elite cross-country ski athletes: A crossover study. J. Int. Soc. Sports Nutr. 2019, 16, 46. [Google Scholar] [CrossRef] [PubMed]
- Pottier, A.; Bouckaert, J.; Gilis, W.; Roels, T.; Derave, W. Mouth rinse but not ingestion of a carbohydrate solution improves 1-h cycle time trial performance. Scand. J. Med. Sci. Sports 2010, 20, 105–111. [Google Scholar] [CrossRef]
- Riley, M.L.; Israel, R.G.; Holbert, D.; Tapscott, E.B.; Dohm, G.L. Effect of carbohydrate ingestion on exercise endurance and metabolism after a 1-day fast. Int. J. Sports Med. 1988, 9, 320–324. [Google Scholar] [CrossRef] [PubMed]
- Roberts, J.D.; Tarpey, M.D.; Kass, L.S.; Tarpey, R.J.; Roberts, M.G. Assessing a commercially available sports drink on exogenous carbohydrate oxidation, fluid delivery and sustained exercise performance. J. Int. Soc. Sports Nutr. 2014, 11, 8. [Google Scholar] [CrossRef]
- Robson-Ansley, P.; Barwood, M.; Eglin, C.; Ansley, L. The effect of carbohydrate ingestion on the interleukin-6 response to a 90-minute run time trial. Int. J. Sports Physiol. Perform. 2009, 4, 186–194. [Google Scholar] [CrossRef]
- Robson-Ansley, P.; Walshe, I.; Ward, D. The effect of carbohydrate ingestion on plasma interleukin-6, hepcidin and iron concentrations following prolonged exercise. Cytokine 2011, 53, 196–200. [Google Scholar] [CrossRef]
- Rollo, I.; Williams, C. Influence of ingesting a carbohydrate-electrolyte solution before and during a 1-hr running performance test. Int. J. Sport Nutr. Exerc. Metab. 2009, 19, 645–658. [Google Scholar] [CrossRef]
- Rollo, I.; Williams, C. Influence of ingesting a carbohydrate-electrolyte solution before and during a 1-hour run in fed endurance-trained runners. J. Sports Sci. 2010, 28, 593–601. [Google Scholar] [CrossRef]
- Rollo, I.; Williams, C.; Nevill, M. Influence of ingesting versus mouth rinsing a carbohydrate solution during a 1-h Run. Med. Sci. Sports Exerc. 2011, 43, 468–475. [Google Scholar] [CrossRef]
- Smith, J.W.; Zachwieja, J.J.; Péronnet, F.; Passe, D.H.; Massicotte, D.; Lavoie, C.; Pascoe, D.D. Fuel selection and cycling endurance performance with ingestion of [13C]glucose: Evidence for a carbohydrate dose response. J. Appl. Physiol. 2010, 108, 1520–1529. [Google Scholar] [CrossRef] [PubMed]
- Steiner, J.L.; Curmaci, A.; Patrie, J.T.; Gaesser, G.A.; Weltman, A. Effects of carbohydrate supplementation on the RPE-blood lactate relationship. Med. Sci. Sports Exerc. 2009, 41, 1326–1333. [Google Scholar] [CrossRef] [PubMed]
- Sun, F.H.; Wong, S.H.S.; Chen, S.H.; Poon, T.C. Carbohydrate electrolyte solutions enhance endurance capacity in active females. Nutrients 2015, 7, 3739–3750. [Google Scholar] [CrossRef] [PubMed]
- Tokmakidis, S.P.; Karamanolis, I.A. Effects of carbohydrate ingestion 15 min before exercise on endurance running capacity. Appl. Physiol. Nutr. Metab. 2008, 33, 441–449. [Google Scholar] [CrossRef]
- Tsintzas, K.; Liu, R.; Williams, C.; Campbell, I.; Gaitanos, G. The effect of carbohydrate ingestion on performance during a 30-km race. Int. J. Sport Nutr. 1993, 3, 127–139. [Google Scholar] [CrossRef]
- Tsintzas, O.K.; Willia, C.; Singh, R.; Wilson, W.; Burrin, J. Influence of carbohydrate-electrolyte drinks on marathon running performance. Eur. J. Appl. Physiol. Occup. Physiol. 1995, 70, 154–160. [Google Scholar] [CrossRef]
- Tsintzas, O.K.; Williams, C.; Boobis, L.; Greenhaff, P. Carbohydrate ingestion and single muscle fiber glycogen metabolism during prolonged running in men. J. Appl. Physiol. 1996, 81, 801–809. [Google Scholar] [CrossRef]
- Tsintzas, O.K.; Williams, C.; Wilson, W.; Burrin, J. Influence of carbohydrate supplementation early in exercise on endurance running capacity. Med. Sci. Sports Exerc. 1996, 28, 1373–1379. [Google Scholar] [CrossRef]
- Utter, A.C.; Kang, J.; Robertson, R.J.; Nieman, D.C.; Chaloupka, E.C.; Suminski, R.R.; Piccinni, C.R. Effect of carbohydrate ingestion on ratings of perceived exertion during a marathon. Med. Sci. Sports Exerc. 2002, 34, 1779–1784. [Google Scholar] [CrossRef] [PubMed]
- Van Essen, M.; Gibala, M.J. Failure of protein to improve time trial performance when added to a sports drink. Med. Sci. Sports Exerc. 2006, 38, 1476–1483. [Google Scholar] [CrossRef] [PubMed]
- Walton, P.T.; Rhodes, E.C. The effects of solid and liquid carbohydrate ingestion on high-intensity intermittent exercise performance. Biol. Sport 1997, 14, 45–54. [Google Scholar]
- Watson, P.; Shirreffs, S.M.; Maughan, R.J. Effect of dilute CHO beverages on performance in cool and warm environments. Med. Sci. Sports Exerc. 2012, 44, 336–343. [Google Scholar] [CrossRef]
- Wilber, R.L.; Moffatt, R.J. Influence of carbohydrate ingestion on blood glucose and performance in runners. Int. J. Sport Nutr. 1992, 2, 317–327. [Google Scholar] [CrossRef]
- Williams, C.; Nute, M.G.; Broadbank, L.; Vinall, S. Influence of fluid intake on endurance running performance—A comparison between water, glucose and fructose solutions. Eur. J. Appl. Physiol. Occup. Physiol. 1990, 60, 112–119. [Google Scholar] [CrossRef]
- Vandenbogaerde, T.J.; Hopkins, W.G. Effects of acute carbohydrate supplementation on endurance performance: A meta-analysis. Sports Med. 2011, 41, 773–792. [Google Scholar] [CrossRef]
- Temesi, J.; Johnson, N.A.; Raymond, J.; Burdon, C.A.; O’Connor, H.T. Carbohydrate ingestion during endurance exercise improves performance in adults. J. Nutr. 2011, 141, 890–897. [Google Scholar] [CrossRef]
- Stellingwerff, T.; Cox, G.R. Systematic review: Carbohydrate supplementation on exercise performance or capacity of varying durations. Appl. Physiol. Nutr. Metab. 2014, 39, 998–1011. [Google Scholar] [CrossRef]
- Wilson, P.B. Does carbohydrate intake during endurance running improve performance? A critical review. J. Strength Cond. Res. 2016, 30, 3539–3559. [Google Scholar] [CrossRef]
- Mitchell, J.B.; Costill, D.L.; Houmard, J.A.; Fink, W.J.; Robergs, R.A.; Davis, J.A. Gastric emptying influence of prolonged exercise and carbohydrate concentration. Med. Sci. Sports Exerc. 1989, 21, 269–374. [Google Scholar] [PubMed]
- Shi, X.; Summers, R.W.; Schedl, H.P.; Flanagan, S.W.; Chang, R.; Gisolfi, C.V. Effects of carbohydrate type and concentration and solution osmolality on water absorption. Med. Sci. Sports Exerc. 1995, 27, 1607–1615. [Google Scholar] [CrossRef] [PubMed]
- Rehrer, N.J.; Beckers, E.; Brouns, F.; Hoor ten, F.; Saris, W.H. Exercise and training effects on gastric emptying of carbohydrate beverages. Med. Sci. Sports Exerc. 1989, 21, 540–549. [Google Scholar] [CrossRef] [PubMed]
- Brouns, F.; Senden, J.; Beckers, E.J.; Saris, W.H.M. Osmolarity does not affect the gastric emptying rate of oral rehydration solutions. J. Parenter. Enter. Nutr. 1995, 19, 403–406. [Google Scholar] [CrossRef]
- Murray, R.; Bartoli, W.; Stofan, J.; Horn, M.; Eddy, D. A comparison of the gastric emptying characteristics of selected sports drinks. Int. J. Sport Nutr. 1999, 9, 263–274. [Google Scholar] [CrossRef]
- Shi, X.; Horn, M.K.; Osterberg, K.L.; Stofan, J.R.; Zachwieja, J.J.; Horswill, C.A.; Passe, D.H.; Murray, R. Gastrointestinal discomfort during intermittent high-intensity exercise: Effect of carbohydrate-electrolyte beverage. Int. J. Sport Nutr. Exerc. Metab. 2004, 14, 673–683. [Google Scholar] [CrossRef]
- Peters, H.P.; van Schelven, F.W.; Verstappen, P.A.; de Boer, R.W.; Bol, E.; Erich, W.B.; van der Togt, C.R.; de Vries, W.R. Gastrointestinal problems as a function of carbohydrate supplements and mode of exercise. Med. Sci. Sports Exerc. 1993, 25, 1211–1224. [Google Scholar] [CrossRef]
- Peters, H.P.F.; Akkermans, L.M.A.; Bol, E.; Mosterd, W.L. Gastrointestinal Symptoms During Exercise: The Effect of Fluid Supplementation. Sports Med. 1995, 20, 65–76. [Google Scholar] [CrossRef]
- de Oliveira, E.P.; Burini, R.C. Carbohydrate-dependent, exercise-induced gastrointestinal distress. Nutrients 2014, 6, 4191–4199. [Google Scholar] [CrossRef]
- De Oliveira, E.P.; Burini, R.C.; Jeukendrup, A. Gastrointestinal complaints during exercise: Prevalence, etiology, and nutritional recommendations. Sports Med. 2014, 44, 79–85. [Google Scholar] [CrossRef]
- Williams, M.; Rawson, E.; Branch, D. Nutrition for Health, Fitness and Sport, 11th ed.; McGraw-Hill Education: New York, NY, USA, 2017; ISBN 9780078021350. [Google Scholar]
- Stellingwerff, T. Contemporary nutrition approaches to optimize elite marathon performance. Int. J. Sports Physiol. Perform. 2013, 8, 573–578. [Google Scholar] [CrossRef] [PubMed]
- Carlsson, M.; Wahrenberg, V.; Carlsson, M.S.; Andersson, R.; Carlsson, T. Gross and delta efficiencies during uphill running and cycling among elite triathletes. Eur. J. Appl. Physiol. 2020, 120, 961–968. [Google Scholar] [CrossRef] [PubMed]
- Tsintzas, K.; Williams, C. Human muscle glycogen metabolism during exercise. Effect of carbohydrate supplementation. Sports Med. 1998, 25, 7–23. [Google Scholar] [CrossRef] [PubMed]
- Pfeiffer, B.; Stellingwerff, T.; Zaltas, E.; Hodgson, A.B.; Jeukendrup, A.E. Carbohydrate oxidation from a drink during running compared with cycling exercise. Med. Sci. Sports Exerc. 2011, 43, 327–334. [Google Scholar] [CrossRef] [PubMed]
- Coggan, A.R.; Coyle, E.F. Carbohydrate ingestion during prolonged exercise: Effects on metabolism and performance. Exerc. Sport Sci. Rev. 1991, 19, 1–40. [Google Scholar] [CrossRef]
- Coyle, E.F.; Montain, S.J. Carbohydrate and fluid ingestion during exercise: Are there trade-offs? Med. Sci. Sports Exerc 1992, 24, 671–678. [Google Scholar] [CrossRef]
- Coyle, E.F. Carbohydrate feeding during exercise. Int. J. Sports Med. 1992, 13, 126–128. [Google Scholar] [CrossRef]
- Coyle, E.F. Carbohydrate supplementation during exercise. J. Nutr. 1992, 122, 788–795. [Google Scholar] [CrossRef]
- Gollnick, P.D.; Piehl, K.; Saltin, B. Selective glycogen depletion pattern in human muscle fibres after exercise of varying intensity and at varying pedalling rates. J. Physiol. 1974, 241, 45–57. [Google Scholar] [CrossRef]
- Currell, K.; Jeukendrup, A. Validity, Reliability and Sensitivity of Measures of Sporting Performance. Sports Med. 2008, 38, 297–316. [Google Scholar] [CrossRef]
- Williams, C.; Rollo, I. Carbohydrate Nutrition and Team Sport Performance. Sports Med. 2015, 45, 13–22. [Google Scholar] [CrossRef] [PubMed]
- Baker, L.B.; Rollo, I.; Stein, K.W.; Jeukendrup, A.E. Acute effects of carbohydrate supplementation on intermittent sports performance. Nutrients 2015, 7, 5733–5763. [Google Scholar] [CrossRef]
- Berg, J.M.; Stryer, L.; Tymoczko, J.; Gatto, G. Biochemistry, 9th ed.; W.H. Freeman & Co. Ltd.: New York, NY, USA, 2019; ISBN 9781319114657. [Google Scholar]
- Hargreaves, M.; Spriet, L.L. Skeletal muscle energy metabolism during exercise. Nat. Metab. 2020, 2, 817–828. [Google Scholar] [CrossRef] [PubMed]
- Parolin, M.L.; Chesley, A.; Matsos, M.P.; Spriet, L.L.; Jones, N.L.; Heigenhauser, G.J.F. Regulation of skeletal muscle glycogen phosphorylase and PDH during maximal intermittent exercise. Am. J. Physiol.-Endocrinol. Metab. 1999, 277. [Google Scholar] [CrossRef] [PubMed]
- Romijn, J.A.; Coyle, E.F.; Sidossis, L.S.; Gastaldelli, A.; Horowitz, J.F.; Endert, E.; Wolfe, R.R. Regulation of endogenous fat and carbohydrate metabolism in relation to exercise intensity and duration. Am. J. Physiol.-Endocrinol. Metab. 1993, 265, 380–391. [Google Scholar] [CrossRef] [PubMed]
- Ishihara, K.; Uchiyama, N.; Kizaki, S.; Mori, E.; Nonaka, T.; Oneda, H. Application of Continuous Glucose Monitoring for Assessment of Individual Carbohydrate Requirement during Ultramarathon Race. Nutrients 2020, 12, 1121. [Google Scholar] [CrossRef]
- Alfageme, R.J.; López, L.A.; Ayuso, J.M.; Martínez-Sanz, J.M. Analysis of nutritional intake in trail runners during competition. Nutr. Hosp. 2020, 38, 2. [Google Scholar] [CrossRef]
- Costa, R.J.S.; Knechtle, B.; Tarnopolsky, M.; Hoffman, M.D. Nutrition for ultramarathon running: Trail, track, and road. Int. J. Sport Nutr. Exerc. Metab. 2019, 29, 130–140. [Google Scholar] [CrossRef]
- Tiller, N.B.; Roberts, J.D.; Beasley, L.; Chapman, S.; Pinto, J.M.; Smith, L.; Wiffin, M.; Russell, M.; Sparks, S.A.; Duckworth, L.; et al. International Society of Sports Nutrition Position Stand: Nutritional considerations for single-stage ultra-marathon training and racing. J. Int. Soc. Sports Nutr. 2019, 16, 50. [Google Scholar] [CrossRef]
- Martinez, S.; Aguilo, A.; Rodas, L.; Lozano, L.; Moreno, C.; Tauler, P. Energy, macronutrient and water intake during a mountain ultramarathon event: The influence of distance. J. Sports Sci. 2018, 36, 333–339. [Google Scholar] [CrossRef]
- Friedlander, A.L.; Casazza, G.A.; Horning, M.A.; Huie, M.J.; Brooks, G.A. Training-induced alterations of glucose flux in men. J. Appl. Physiol. 1997, 82, 1360–1369. [Google Scholar] [CrossRef] [PubMed]
- Coggan, A.R.; Kohrt, W.M.; Spina, R.J.; Bier, D.M.; Holloszy, J.O. Endurance training decreases plasma glucose turnover and oxidation during moderate-intensity exercise in men. J. Appl. Physiol. 1990, 68, 990–996. [Google Scholar] [CrossRef] [PubMed]
- Bergman, B.C.; Horning, M.A.; Casazza, G.A.; Wolfel, E.E.; Butterfield, G.E.; Brooks, G.A. Endurance training increases gluconeogenesis during rest and exercise in men. Am. J. Physiol.-Endocrinol. Metab. 2000, 278, 244–251. [Google Scholar] [CrossRef] [PubMed]
- Areta, J.L.; Hopkins, W.G. Skeletal Muscle Glycogen Content at Rest and During Endurance Exercise in Humans: A Meta-Analysis. Sports Med. 2018, 48, 2091–2102. [Google Scholar] [CrossRef]
- Bergman, B.C.; Butterfield, G.E.; Wolfel, E.E.; Lopaschuk, G.D.; Casazza, G.A.; Horning, M.A.; Brooks, G.A. Muscle net glucose uptake and glucose kinetics after endurance training in men. Am. J. Physiol.-Endocrinol. Metab. 1999, 277, 81–92. [Google Scholar] [CrossRef]
- Saunders, M.J.; Luden, N.D.; Herrick, J.E. Consumption of an oral carbohydrate-protein gel improves cycling endurance and prevents postexercise muscle damage. J. Strength Cond. Res. 2007, 21, 678–684. [Google Scholar] [CrossRef]
- Devries, M.C. Sex-based differences in endurance exercise muscle metabolism: Impact on exercise and nutritional strategies to optimize health and performance in women. Exp. Physiol. 2016, 101, 243–249. [Google Scholar] [CrossRef]
- Carter, S.L.; Rennie, C.; Tarnopolsky, M.A. Substrate utilization during endurance exercise in men and women after endurance training. Am. J. Physiol.-Endocrinol. Metab. 2001, 280, 898–907. [Google Scholar] [CrossRef]
- Riddell, M.C.; Partington, S.L.; Stupka, N.; Armstrong, D.; Rennie, C.; Tarnopolsky, M.A. Substrate Utilization during Exercise Performed with and Without Glucose Ingestion in Female and Male Endurance-Trained Athletes. Int. J. Sport Nutr. Exerc. Metab. 2003, 13, 407–421. [Google Scholar] [CrossRef]
- Devries, M.C.; Hamadeh, M.J.; Phillips, S.M.; Tarnopolsky, M.A. Menstrual cycle phase and sex influence muscle glycogen utilization and glucose turnover during moderate-intensity endurance exercise. Am. J. Physiol.-Regul. Integr. Comp. Physiol. 2006, 291, 1120–1128. [Google Scholar] [CrossRef]
- Hargreaves, M. Exercise, muscle, and CHO metabolism. Scand. J. Med. Sci. Sports 2015, 25, 29–33. [Google Scholar] [CrossRef] [PubMed]
- Forbes, S.C.; Candow, D.G.; Smith-ryan, A.E.; Hirsch, K.R.; Roberts, M.D.; Vandusseldorp, T.A.; Stratton, M.T.; Kaviani, M.; Little, J.P. Supplements and nutritional interventions to augment high-intensity interval training physiological and performance adaptations—A narrative review. Nutrients 2020, 12, 390. [Google Scholar] [CrossRef]
- Kiens, B. Skeletal muscle lipid metabolism in exercise and insulin resistance. Physiol. Rev. 2006, 86, 205–243. [Google Scholar] [CrossRef] [PubMed]
- Ferraris, R.P.; Diamond, J. Regulation of intestinal sugar transport. Physiol. Rev. 1997, 77, 257–302. [Google Scholar] [CrossRef] [PubMed]
- Kellett, G.L. The facilitated component of intestinal glucose absorption. J. Physiol. 2001, 531, 585–595. [Google Scholar] [CrossRef] [PubMed]
- Meyer, H.; Vitavska, O.; Wieczorek, H. Identification of an animal sucrose transporter. J. Cell Sci. 2011, 124, 1984–1991. [Google Scholar] [CrossRef]
- Koivisto, V.A. Fructose as a Dietary Sweetener in Diabetes Mellitus. Diabetes Care 1978, 1, 241–246. [Google Scholar] [CrossRef]
- Koivisto, V.A.; Karonen, S.L.; Nikkilä, E.A. Carbohydrate ingestion before exercise: Comparison between glucose and fructose. J. Appl. Physiol. Respir. Env. Exerc. Physiol. 1981, 40, 783–787. [Google Scholar] [CrossRef]
- Massicotte, D.; Péronnet, F.; Allah, C.; Hillaire-Marcel, C.; Ledoux, M.; Brisson, G. Metabolic response to [13C] glucose and [13C] fructose ingestion during exercise. J. Appl. Physiol. 1986, 61, 1180–1184. [Google Scholar] [CrossRef]
- Massicotte, D.; Peronnet, F.; Brisson, G.; Bakkouch, K.; Hillaire-Marcel, C. Oxidation of a glucose polymer during exercise: Comparison with glucose and fructose. J. Appl. Physiol. 1989, 66, 179–183. [Google Scholar] [CrossRef]
- Jandrain, B.J.; Pallikarakis, N.; Normand, S.; Pirnay, F.; Lacroix, M.; Mosora, F.; Pachiaudi, C.; Gautier, J.F.; Scheen, A.J.; Riou, J.P.; et al. Fructose utilization during exercise in men: Rapid conversion of ingested fructose to circulating glucose. J. Appl. Physiol. 1993, 74, 2146–2154. [Google Scholar] [CrossRef]
- Adopo, E.; Peronnet, F.; Massicotte, D.; Brisson, G.R.; Hillaire-Marcel, C. Respective oxidation of exogenous glucose and fructose given in the same drink during exercise. J. Appl. Physiol. 1994, 76, 1014–1019. [Google Scholar] [CrossRef] [PubMed]
- Jeukendrup, A.E. Carbohydrate and exercise performance: The role of multiple transportable carbohydrates. Curr. Opin. Clin. Nutr. Metab. Care 2010, 13, 452–457. [Google Scholar] [CrossRef] [PubMed]
- Burelle, Y.; Peronnet, F.; Massicotte, D.; Brison, G.R.; Hillaire-Marcel, C. Oxidation of 13C-glucose and 13C-fructose ingested as a preexercise meal: Effect of carbohydrate ingestion during exercise. Int. J. Sport Nutr. 1997, 7, 117–127. [Google Scholar] [CrossRef] [PubMed]
- Hawley, J.A.; Burke, L.M. Effect of meal frequency and timing on physical performance. Br. J. Nutr. 1997, 77, S91–S103. [Google Scholar] [CrossRef]
- Hawley, J.A.; Dennis, S.C.; Noakes, T.D. Oxidation of Carbohydrate Ingested During Prolonged Endurance Exercise. Sports Med. 1992, 14, 27–42. [Google Scholar] [CrossRef]
- Wagenmakers, A.J.M.; Brouns, F.; Saris, W.H.M.; Halliday, D. Oxidation rates of orally ingested carbohydrates during prolonged exercise in men. J. Appl. Physiol. 1993, 75, 2774–2780. [Google Scholar] [CrossRef] [PubMed]
- Seiple, R.S.; Vivian, V.M.; Fox, L.; Bartels, R.L. Gastric emptying characteristics of two glucose polymer-electrolyte solutions. Med. Sci. Sports Exerc. 1983, 15, 366–369. [Google Scholar] [CrossRef]
- Sole, C.C.; Noakes, T.D. Faster gastric emptying for glucose-polymer and fructose solutions than for glucose in humans. Eur. J. Appl. Physiol. Occup. Physiol. 1989, 58, 605–612. [Google Scholar] [CrossRef]
- Moodley, D.; Noakes, T.D.; Bosch, A.N.; Hawley, J.A.; Schall, R.; Dennis, S.C. Oxidation of exogenous carbohydrate during prolonged exercise: The effects of the carbohydrate type and its concentration. Eur. J. Appl. Physiol. Occup. Physiol. 1992, 64, 328–334. [Google Scholar] [CrossRef]
- Neufer, P.D.; Costill, D.L.; Fink, W.J.; Kirwan, J.P.; Fielding, R.A.; Flynn, M.G. Effects of exercise and carbohydrate composition on gastric emptying. Med. Sci. Sports Exerc. 1986, 18, 658–662. [Google Scholar] [CrossRef]
- Foster, C.; Costill, D.L.; Fink, W.J. Gastric emptying characteristics of glucose and glucose polymer solutions. Res. Q. Exerc. Sport 1980, 51, 299–305. [Google Scholar] [CrossRef]
- Jentjens, R.L.P.G.; Moseley, L.; Waring, R.H.; Harding, L.K.; Jeukendrup, A.E. Oxidation of combined ingestion of glucose and sucrose during exercise. J. Appl. Physiol. 2004, 96, 1277–1284. [Google Scholar] [CrossRef]
- Jeukendrup, A.E. Carbohydrate feeding during exercise. Eur. J. Sport Sci. 2008, 8, 77–86. [Google Scholar] [CrossRef]
- Jeukendrup, A.E.; Moseley, L.; Mainwaring, G.I.; Samuels, S.; Perry, S.; Mann, C.H. Exogenous carbohydrate oxidation during ultraendurance exercise. J. Appl. Physiol. 2006, 100, 1134–1141. [Google Scholar] [CrossRef] [PubMed]
- Rowlands, D.S.; Swift, M.; Ros, M.; Green, J.G. Composite versus single transportable carbohydrate solution enhances race and laboratory cycling performance. Appl. Physiol. Nutr. Metab. 2012, 37, 425–436. [Google Scholar] [CrossRef]
- Triplett, D.; Doyle, J.A.; Rupp, J.C.; Benardot, D. An isocaloric glucose-fructose beverage’s effect on simulated 100-km cycling performance compared with a glucose-only beverage. Int. J. Sport Nutr. Exerc. Metab. 2010, 20, 122–131. [Google Scholar] [CrossRef]
- Rowlands, D.S.; Houltham, S.; Musa-Veloso, K.; Brown, F.; Paulionis, L.; Bailey, D. Fructose–Glucose Composite Carbohydrates and Endurance Performance: Critical Review and Future Perspectives. Sports Med. 2015, 45, 1561–1576. [Google Scholar] [CrossRef] [PubMed]
- Gisolfi, C.V. Use of electrolytes in fluid replacement solutions: What have we learned from intestinal absorption studies? In Fluid Replacement and Heat Stress; Marriott, B.M., Ed.; Institute of Medicine (US) Committee on Military Nutrition Research: Washington, DC, USA, 1994; pp. 11–22. ISBN 0309573459. [Google Scholar]
- Gisolfi, C.V.; Duchman, S.M. Guidelines for optimal replacement beverages for different athletic events. Med. Sci. Sports Exerc. 1992, 24, 679–687. [Google Scholar] [CrossRef] [PubMed]
- Sawka, M.N.; Burke, L.M.; Eichner, E.R.; Maughan, R.J.; Montain, S.J.; Stachenfeld, N.S. Exercise and fluid replacement. Med. Sci. Sports Exerc. 2007, 39, 377–390. [Google Scholar] [CrossRef]
- Burke, L.M.; Jones, A.M.; Jeukendrup, A.E.; Mooses, M. Contemporary nutrition strategies to optimize performance in distance runners and race walkers. Int. J. Sport Nutr. Exerc. Metab. 2019, 29, 117–129. [Google Scholar] [CrossRef] [PubMed]
- Burke, L.M.; Hawley, J.A.; Wong, S.H.S.; Jeukendrup, A.E. Carbohydrates for training and competition. J. Sports Sci. 2011, 29, S17–S27. [Google Scholar] [CrossRef] [PubMed]
- Smith, J.E.W.; Zachwieja, J.J.; Horswill, C.A.; Pascoe, D.D.; Passe, D.; Ruby, B.C.; Stewart, L.K. Evidence of a Carbohydrate Dose and Prolonged Exercise Performance Relationship. Med. Sci. Sports Exerc. 2010, 42, 84. [Google Scholar] [CrossRef]
- Jeukendrup, A. Carbohydrate during exercise: Research of last 10 years turned into new recommendations. Apunt. Educ. Física Deport. 2013, 113, 7–22. [Google Scholar] [CrossRef]
- Smith, J.W.; Pascoe, D.D.; Passe, D.H.; Ruby, B.C.; Stewart, L.K.; Baker, L.B.; Zachwieja, J.J. Curvilinear dose-response relationship of carbohydrate (0–120 g·h-1) and performance. Med. Sci. Sports Exerc. 2013, 45, 336–341. [Google Scholar] [CrossRef]
- Jeukendrup, A.E. Nutrition for endurance sports: Marathon, triathlon, and road cycling. J. Sports Sci. 2011, 29, S91–S99. [Google Scholar] [CrossRef]
- Jentjens, R.L.P.G.; Shaw, C.; Birtles, T.; Waring, R.H.; Harding, L.K.; Jeukendrup, A.E. Oxidation of combined ingestion of glucose and sucrose during exercise. Metabolism 2005, 54, 610–618. [Google Scholar] [CrossRef]
- Currell, K.; Urch, J.; Cerri, E.; Jentjens, R.L.P.; Blannin, A.K.; Jeukendrup, A.E. Plasma deuterium oxide accumulation following ingestion of different carbohydrate beverages. Appl. Physiol. Nutr. Metab. 2008, 33, 1067–1072. [Google Scholar] [CrossRef]
- Jeukendrup, A.E. Periodized Nutrition for Athletes. Sports Med. 2017, 47, 51–63. [Google Scholar] [CrossRef]
- Lavoué, C.; Siracusa, J.; Chalchat, É.; Bourrilhon, C.; Charlot, K. Analysis of food and fluid intake in elite ultra-endurance runners during a 24-h world championship. J. Int. Soc. Sports Nutr. 2020, 17, 36. [Google Scholar] [CrossRef]
- Yeo, S.E.; Jentjens, R.L.P.G.; Wallis, G.A.; Jeukendrup, A.E. Caffeine increases exogenous carbohydrate oxidation during exercise. J. Appl. Physiol. 2005, 99, 844–850. [Google Scholar] [CrossRef] [PubMed]
- Pfeiffer, B.; Stellingwerff, T.; Zaltas, E.; Jeukendrup, A.E. CHO oxidation from a CHO Gel compared with a drink during exercise. Med. Sci. Sports Exerc. 2010, 42, 2038–2045. [Google Scholar] [CrossRef] [PubMed]
- Jentjens, R.L.P.G.; Underwood, K.; Achten, J.; Currell, K.; Mann, C.H.; Jeukendrup, A.E. Exogenous carbohydrate oxidation rates are elevated after combined ingestion of glucose and fructose during exercise in the heat. J. Appl. Physiol. 2006, 100, 807–816. [Google Scholar] [CrossRef]
- Pfeiffer, B.; Stellingwerff, T.; Zaltas, E.; Jeukendrup, A.E. Oxidation of solid versus liquid CHO sources during exercise. Med. Sci. Sports Exerc. 2010, 42, 2030–2037. [Google Scholar] [CrossRef] [PubMed]
- Jeukendrup, A.E. Training the Gut for Athletes. Sports Med. 2017, 47, 101–110. [Google Scholar] [CrossRef]
- Jeukendrup, A.E.; McLaughlin, J. Carbohydrate ingestion during exercise: Effects on performance, training adaptations and trainability of the gut. Nestle Nutr. Inst. Workshop Ser. 2011, 69, 1–17. [Google Scholar] [CrossRef]
- Lesinski, M.; Hortobágyi, T.; Muehlbauer, T.; Gollhofer, A.; Granacher, U. Dose-Response Relationships of Balance Training in Healthy Young Adults: A Systematic Review and Meta-Analysis. Sports Med. 2015, 45, 557–576. [Google Scholar] [CrossRef]
- Goulet, E.D.B.; Hoffman, M.D. Impact of Ad Libitum Versus Programmed Drinking on Endurance Performance: A Systematic Review with Meta-Analysis. Sports Med. 2019, 49, 221–232. [Google Scholar] [CrossRef] [PubMed]
- Pöchmüller, M.; Schwingshackl, L.; Colombani, P.C.; Hoffmann, G. A systematic review and meta-analysis of carbohydrate benefits associated with randomized controlled competition-based performance trials. J. Int. Soc. Sports Nutr. 2016, 13, 27. [Google Scholar] [CrossRef]
- Brietzke, C.; Franco-Alvarenga, P.E.; Coelho-Júnior, H.J.; Silveira, R.; Asano, R.Y.; Pires, F.O. Effects of Carbohydrate Mouth Rinse on Cycling Time Trial Performance: A Systematic Review and Meta-Analysis. Sports Med. 2019, 49, 57–66. [Google Scholar] [CrossRef]
- Thomas, J.R.; French, K.E. The use of meta-analysis in exercise and sport: A tutorial. Res. Q. Exerc. Sport 1986, 57, 196–204. [Google Scholar] [CrossRef]
- Oosthuyse, T.; Bosch, A.N. The Effect of the Menstrual Cycle on Exercise Metabolism. Sports Med. 2010, 40, 207–227. [Google Scholar] [CrossRef] [PubMed]
- Viribay, A.; Arribalzaga, S.; Mielgo-Ayuso, J.; Castañeda-Babarro, A.; Seco-Calvo, J.; Urdampilleta, A. Effects of 120 g/h of carbohydrates intake during a mountain marathon on exercise-induced muscle damage in elite runners. Nutrients 2020, 12, 1367. [Google Scholar] [CrossRef] [PubMed]
- St. Clair Gibson, A.; Baden, D.A.; Lambert, M.I.; Lambert, E.V.; Harley, Y.X.R.; Hampson, D.; Russell, V.A.; Noakes, T.D. The conscious perception of the sensation of fatigue. Sports Med. 2003, 33, 167–176. [Google Scholar] [CrossRef]
- Meeusen, R.; Watson, P.; Hasegawa, H.; Roelands, B.; Piacentini, M.F. Central fatigue: The serotonin hypothesis and beyond. Sports Med. 2006, 36, 881–909. [Google Scholar] [CrossRef] [PubMed]
- Meeusen, R.; Piacentini, M.F. Exercise, fatigue, neurotransmission and the influence of the neuroendocrine axis. In Developments in Tryptophan and Serotonin Metabolism; Allegri, G., Costa, C.V.L., Ragazzi, E., Steinhart, H., Varesio, L., Eds.; Springer: Boston, MA, USA, 2003; Volume 527, pp. 521–525. ISBN 9781461501350. [Google Scholar]
- Nybo, L.; Secher, N.H. Cerebral perturbations provoked by prolonged exercise. Prog. Neurobiol. 2004, 72, 223–261. [Google Scholar] [CrossRef] [PubMed]
- Paris, H.L.; Fulton, T.J.; Chapman, R.F.; Fly, A.D.; Koceja, D.M.; Mickleborough, T.D. Effect of carbohydrate ingestion on central fatigue during prolonged running exercise in moderate hypoxia. J. Appl. Physiol. 2019, 126, 141–151. [Google Scholar] [CrossRef]
- Nybo, L. CNS fatigue and prolonged exercise: Effect of glucose supplementation. Med. Sci. Sports Exerc. 2003, 35, 589–594. [Google Scholar] [CrossRef]
- Nybo, L.; Møller, K.; Pedersen, B.K.; Nielsen, B.; Secher, N.H. Association between fatigue and failure to preserve cerebral energy turnover during prolonged exercise. Acta Physiol. Scand. 2003, 179, 67–74. [Google Scholar] [CrossRef]
- Winnick, J.J.; Davis, J.M.; Welsh, R.S.; Carmichael, M.D.; Murphy, E.A.; Blackmon, J.A. Carbohydrates feedings during team sport exercise preserve physical and CNS function. Med. Sci. Sports Exerc. 2005, 37, 306–315. [Google Scholar] [CrossRef]
- Kong, J.; Shepel, P.N.; Holden, C.P.; Mackiewicz, M.; Pack, A.I.; Geiger, J.D. Brain glycogen decreases with increased periods of wakefulness: Implications for homeostatic drive to sleep. J. Neurosci. 2002, 22, 5581–5587. [Google Scholar] [CrossRef] [PubMed]
- Béquet, F.; Gomez-Merino, D.; Berthelot, M.; Guezennec, C.Y. Evidence that brain glucose availability influences exercise-enhanced extracellular 5-HT level in hippocampus: A microdialysis study in exercising rats. Acta Physiol. Scand. 2002, 176, 65–69. [Google Scholar] [CrossRef] [PubMed]
- Jeffers, R.; Shave, R.; Ross, E.; Stevenson, E.J.; Goodall, S. The effect of a carbohydrate mouth-rinse on neuromuscular fatigue following cycling exercise. Appl. Physiol. Nutr. Metab. 2015, 40, 557–564. [Google Scholar] [CrossRef] [PubMed]
- Khong, T.K.; Selvanayagam, V.S.; Sidhu, S.K.; Yusof, A. Role of carbohydrate in central fatigue: A systematic review. Scand. J. Med. Sci. Sports 2017, 27, 376–384. [Google Scholar] [CrossRef]
- Paris, H.L.; Sinai, E.C.; Shei, R.J.; Keller, A.M.; Mickleborough, T.D. The influence of carbohydrate ingestion on peripheral and central fatigue during exercise in hypoxia: A narrative review. Eur. J. Sport Sci. 2020, 21, 1423–1435. [Google Scholar] [CrossRef]
- Malone, J.J.; Hulton, A.T.; MacLaren, D.P.M. Exogenous carbohydrate and regulation of muscle carbohydrate utilisation during exercise. Eur. J. Appl. Physiol. 2021, 121, 1255–1269. [Google Scholar] [CrossRef]
- Manore, M.M.; Patton-Lopez, M.M.; Meng, Y.; Wong, S.S. Sport nutrition knowledge, behaviors and beliefs of high school soccer players. Nutrients 2017, 9, 350. [Google Scholar] [CrossRef]
- Herriman, M.; Fletcher, L.; Tchaconas, A.; Adesman, A.; Milanaik, R. Dietary supplements and young teens: Misinformation and access provided by retailers. Pediatrics 2017, 139, e20161257. [Google Scholar] [CrossRef]


| Study/Trial † | Study Design | N/ Gender | Age (year) | BMI (kg·m−2) | O2max (mL·kg−1·min−1) | Lab/ Field | Exercise Task (Brief Description) | CHO Supplementation (Brief Description) | SMD IV, Random [95% CI) |
|---|---|---|---|---|---|---|---|---|---|
| Acker-Hewitt et al., 2012 [47] | CS | 10/M | 28.0 | 23.0 | 66.0 | Lab | 20 min of SS cycling [60% PPO (Wmax)] + a simulated 20-km TT, TA: 21.5 °C | 8% solution, 250 mL fluid (CHO, 20 g) administered at: immediately prior to exercise, following the 20-min SS, and 20 min into the TT | 0.09 [−0.79, 0.97] |
| Alghannam 2011 [48] | CS | 6/M | 26.0 | 21.9 | 51.4 * | Lab | 75 min of intermittent football-specific running (interspersed with a 15 min recovery) + run TF at 80% O2peak, TA: 20.6 °C | 6.9% CHO solution [MD, 1 g·kg−1] administered at: 15 min prior to exercise and at 45 min | 1.67 [0.28, 3.07] |
| Ali et al., 2007 [49] | CS | 16/M | 21.3 | 23.0 | 56.0 | Lab | 90 min intermittent high-intensity shuttle running (~66 sprints) protocol [LIST: 15 min block consists of 10–12 repeated cycles of walking, running (at a speed equivalent to 95% O2max), jogging (at a speed equivalent to 55% O2max), and sprinting] | 6.4% CHO-E solution (Lucozade Sport, GlaxoSmithKline, Brentford), 5 mL·kg−1 before and 2 mL·kg−1 every 15 min of exercise | 0.22 [−0.47, 0.92] |
| Anastasiou et al., 2004 i [50] | CS | 10/M | 25.1 | 23.0 | 56.6 * | Lab | cycling time to complete the target amount of work (J) = 0.75 × Wmax × 3600, (~60 min), TA: 27.9 °C | GL-E drink, (0.65 g·kg−1) 15 min prior to exercise ~600 mL and during at 15-min intervals ~200 mL of GL-E drink (0.2 g·kg−1) | 0.83 [−0.10, 1.75] |
| Anastasiou et al., 2004 ii [50] | CS | 10/M | 25.1 | 23.0 | 56.6 * | Lab | cycling time to complete the target amount of work (J) = 0.75 × Wmax × 3600, (~60 min), TA: 27.9 °C | MAL-E drink, (0.65 g·kg−1) 15 min prior to exercise ~600 mL and during at 15-min intervals ~200 mL of MAL-E drink (0.2 g·kg−1) | 0.31 [−0.57, 1.20] |
| Anastasiou et al., 2004 iii [50] | CS | 10/M | 25.1 | 23.0 | 56.6 * | Lab | cycling time to complete the target amount of work (J) = 0.75 × Wmax × 3600, (~60 min), TA: 27.9 °C | CHO-mix-E drink, (0.65 g·kg−1) 15 min prior to exercise ~600 mL and during at 15-min intervals ~200 mL of CHO-mix-E drink (0.2 g·kg−1) | 1.01 [0.07, 1.96] |
| Angus et al., 2000 [51] | CS | 8/M | 22.0 | 23.0 | 65.4 * | Lab | cycling time to complete “as quickly as possible” 35 kJ·kg−1, TA: 20.0–22.0 °C | 6% CHO solution (Gatorade, Quaker Oats Co.), 250 mL at 15-min intervals | 1.23 [0.13, 2.33] |
| Bailey et al., 2000 i [52] | CS | 9/F | 27.0 | 21.5 | 49.6 * | Lab | TE cycling at 70% O2peak, during follicular phase of the menstrual cycle, TA: 22.7 °C | 6% CHO solution (Gatorade, Quaker Oats Co.), CHO 0.6 g·kg−1·h−1, (5 mL·kg−1 every 30 min beginning at min 30 of exercise) | 0.57 [−0.38, 1.52] |
| Bailey et al., 2000 ii [52] | CS | 9/F | 27.0 | 21.5 | 49.6 * | Lab | TE cycling at 70% O2peak, during luteal phase of the menstrual cycle, TA: 22.7 °C | 6% CHO solution (Gatorade, Quaker Oats Co.), CHO 0.6 g·kg−1·h−1, (5 mL·kg−1 every 30 min beginning at min 30 of exercise) | 0.34 [−0.59, 1.27] |
| Baldassarre et al., 2021 [53] | CS | 8/5 M 3 F | 23.0 | 23.0 | # | Lab | 3 × 30 min (20 s interval) swimming at a pre-set pace (corresponding to 10-km) + a TE at 100% O2peak, TA: 27 °C | 8% CHO solution, 45 g GL:FRU in ratio of 1:1 in 550 mL of water (Enervitene Sport Cheerpack, Enervit©) during each of the two intervals (total 60 g·h−1 of CHO) | 0.83 [−0.21, 1.86] |
| Baur et al., 2014 i [54] | CS | 8/M | 25.0 | 23.8 | 62.0 | Lab | 120 min of constant-load cycling at 55% Wmax + a simulated 30 km TT | 12% CHO-E beverage (GL:FRU in a ratio of 2:1: Tate and Lyle, Decatur, IL), 600 mL prior to exercise, 150 mL bolus every 15 min during the constant-load part of the trial (total: 1200 mL) and at three points during the 30-km TT (7.5, 15, and 22.5 km; total: 450 mL) | 0.78 [−0.25, 1.80] |
| Baur et al., 2014 ii [54] | CS | 8/M | 25.0 | 23.8 | 62.0 | Lab | 120 min of constant-load cycling at 55% Wmax + a simulated 30 km TT | 8% CHO-E beverage (moderate-GL beverage), 600 mL prior to exercise, 150 mL bolus every 15 min during the constant-load part of the trial (total: 1200 mL) and at three points during the 30-km TT (7.5, 15, and 22.5 km; total: 450 mL) | 0.55 [−0.46, 1.55] |
| Baur et al., 2014 iii [54] | CS | 8/M | 25.0 | 23.8 | 62.0 | Lab | 120 min of constant-load cycling at 55% Wmax + a simulated 30 km TT | 12% CHO-E beverage (high-GL beverage), 600 mL prior to exercise, 150 mL bolus every 15 min during the constant-load part of the trial (total: 1200 mL) and at three points during the 30-km TT (7.5, 15, and 22.5 km; total: 450 mL) | 0.23 [−0.75, 1.21] |
| Below et al., 1995 [55] | CS | 8/M | 23.0 | 22.0 | 62.9 | Lab | 50 min of cycling at 80 ± 1% O2max (± SEM) + ~10 min performance test: time to complete amount of work at intensity maintained a O2 of 10% above his LT, TA: 31.2 °C | 6% CHO-E solution (Gatorade, Quaker Oats Co.) during exercise, (1330 ± 60 mL) | 0.77 [−0.26, 1.80] |
| Bishop et al., 2001 [56] | CS | 9/M | 21.0 | 25.3 | 53.1 | Lab | TF cycling at 75% O2max, TA: 19.3 °C | 5% CHO-E (GL) beverage, before (5 mL·kg−1) and at 15-min intervals (2 mL·kg−1) during exercise | 0.89 [−0.09, 1.87] |
| Burgess et al., 1991 [57] | CS | 9/M | 24.0−30.0 | # | 59.9 * | Lab | 165 min of cycling at 70% O2max + TE at 80% O2max, TA: 22.0 °C | 1.8% CHO-E solution (SUC 18 g·L−1), 3.5 mL·kg−1 at the 20th min and every 20 min in a total of 160 min of exercise | 0.18 [−0.74, 1.11] |
| Byrne et al., 2005 [58] | CS | 14/M | 20.7 | 22.1 | 53.0 | Lab | 3 × 60 min cycles of loaded marching at 4.4 km·h−1 and 5% gradient, separated by 15 min rest, TA: 35.0 °C | 5.8% CHO-E fluid (5.8 g·100 mL−1: Gatorade Quaker, Chicago, IL, USA), 5 mL·kg−1 prior to exercise, followed by 3 mL·kg−1 every 15 min during exercise and rest periods | 0.22 [−0.52, 0.97] |
| Campbell et al., 2008 [59] | CS | 16/8 M 8 F | 35.8 M and 32.4 F | 23.6 M and 22.2 F | 59.3 * M and 50.2 * F | Lab | 80 min of cycling at 75% O2peak + a 10 km TT, TA: 19.0–23.0 °C | 5.9% CHO-E drink, {per 8-oz serving or 0.6 g·kg−1·h−1, [(SUC:GL-FRU mix), 14 g]} | 0.19 [−0.50, 0.89] |
| Carter et al., 2003 i [60] | CS | 7/M | 22.6 | 23.3 | 59.5 | Lab | TF cycling at 60% O2max, TA: 35.0 °C | 6.4% CHO-E solution, MD 0.51 g·kg−1 (8 mL·kg−1, 5 min prior to exercise) and at 15-min intervals (3 mL·kg−1) during exercise | 0.70 [−0.39, 1.79] |
| Carter et al., 2003 ii [60] | CS | 8/M | 22.6 | 23.3 | 59.5 | Lab | TF cycling at 73% O2max, TA: 35.0 °C | 6.4% CHO-E solution, MD 0.51 g·kg−1 (8 mL·kg−1, 5 min prior to exercise) and at 15-min intervals (3 mL·kg−1) during exercise | 0.38 [−0.61, 1.37] |
| Carter et al., 2005 i [61] | CS | 8/M | 24.0 | 23.2 | 60.5 | Lab | TE cycling at 60% O2max, TA: 35.0 °C | 6.4% CHO solution (sweetened, MD), 8 mL·kg−1 5 min prior to exercise and at 15-min intervals 3 mL·kg−1 during exercise | 0.49 [−0.51, 1.49] |
| Carter et al., 2005 ii [61] | CS | 8/M | 24.0 | 23.2 | 60.5 | Lab | TE cycling at 60% O2max, TA: 35.0 °C | 6.4% CHO solution (non-sweetened, MD), 8 mL·kg−1 5 min prior to exercise and at 15-min intervals 3 mL·kg−1 during exercise | 0.44 [−0.56, 1.43] |
| Clark et al., 2000 [62] | PS | 7/#M #F | 23.0−26.0 | 24.3 | 64.0 * | Lab | km cycling TT | 7.6% CHO solution (GL-polymer), 8 mL·kg−1 30 min before, 2 mL·kg−1 2 min before and at 10, 20, and 30 km of the TT | 0.00 [−1.05, 1.05] |
| Clarke et al., 2011 [63] | CS | 12/M | 25.0 | 22.8 | 61.3 | Lab | 2 × 45 min of various soccer-specific running intensities on a motorized treadmill, +3 min self-chosen pace test and test of high-intensity exercise capacity (Cunningham and Faulkner test), TA: 30.5 °C | 6.6 % CHO-E solution (Still Lucozade Sport, GlaxoSmithKline, Gloucestershire, UK) at 0, 15, 30, 45, 60, and 75 min of exercise (223 ± 7 mL at each time point) | 2.90 [1.70, 4.10] |
| Cole et al., 1993 i [64] | CS | 10/M | 28.0 | 24.0 | 59.6 | Lab | 105 min of cycling at 70% O2max + 15 min all out ride performance, TA: 23.1 °C | 6% CHO-E solution (G:SUC) at 15-min intervals (9.75 mL·kg−1·h−1) | 0.23 [−0.65, 1.11] |
| Cole et al., 1993 ii [64] | CS | 10/M | 28.0 | 24.0 | 59.6 | Lab | 5 min of cycling at 70% O2max + 15 min all out ride performance, TA: 23.1 °C | 8.3% CHO-E syrup (high FRU corn) at 15-min intervals (9.75 mL·kg−1·h−1) | 0.22 [−0.66, 1.10] |
| Cole et al., 1993 iii [64] | CS | 10/M | 28.0 | 24.0 | 59.6 | Lab | 105 min of cycling at 70% O2max + 15 min all out ride performance, TA: 23.1 °C | 8.3% CHO-E solution (6% high FRU corn syrup + 2.3% GL-polymer) at 15-min intervals (9.75 mL·kg−1·h−1) | 0.21 [−0.67, 1.09] |
| Cole et al., 2018 [65] | CS | 14/M | 42.6 | 23.7 | 57.6 | Lab | 120 min of cycling at a submaximal exercise intensity (60% Maximal Minute Power), TA: 19.6 °C | 6% CHO solution (MD 18 g·300 mL−1 of water: Blackburn Distributions, Blackburn, UK) every 30 min during exercise | 3.96 [2.62, 5.30] |
| Coletta et al., 2013 i [66] | CS | 12/M | 18.0−55.0 | 22.7 | 59.7 | Field | 19.2 km run at a race pace + 1.92 km sprint to the finish | 6% CHO (Gatorade, Inc., Chicago, IL, USA) of 120 mL servings 5 min before the start, and every 4 km throughout the run (total: 600 mL) | 0.08 [−0.72, 0.88] |
| Coletta et al., 2013 ii [66] | CS | 12/M | 18.0−55.0 | 22.7 | 59.7 | Field | 19.2 km run at a race pace + 1.92 km sprint to the finish | 7.4% CHO (Gatorade, Inc., Chicago, IL, USA) of 120 mL servings 5 min before the start, and every 4 km throughout the run (total: 600 mL) | −0.07 [−0.87, 0.73] |
| Cureton et al., 2007 [67] | CS | 16/M | 27.5 | 23.2 | 60.5 | Lab | 120 min of cycling at intensity between 60% and 75% O2max every 15 min + 15 min all out ride performance, TA: 28.5 °C | 6% CHO-E fluid (Gatorade®, Quaker Oats Co., Barrington, IL, USA), 6 mL·kg−1 (10 min before and immediately) prior to exercise and 3 mL·kg−1 every 15 min intervals over the first 105 min of exercise | 0.35 [−0.35, 1.05] |
| Currell et al., 2008 i [68] | CS | 8/M | 32.0 | # | 64.7 | Lab | 120 min of cycling exercise at 55% Wmax + a TT to complete a set amount of work as quickly as possible (~60 min), TA: 20.0–23.0 °C | 14.4% GL beverage (1.8 g·min−1), 600 mL prior to exercise and 150 mL every 15 min throughout the SS period and at 25, 50, and 75% of the TT | 2.55 [1.14, 3.97] |
| Currell et al., 2008 ii [68] | CS | 8/M | 32.0 | # | 64.7 | Lab | 120 min of cycling exercise at 55% Wmax + a TT to complete a set amount of work as quickly as possible (~60 min), TA: 20.0–23.0 °C | 14.4% GL:FRU beverage in a ratio of 2:1 (1.8 g·min−1), 600 mL prior to exercise and 150 mL every 15 min throughout the SS period and at 25, 50, and 75% of the TT | 4.37 [2.37, 6.37] |
| Davis et al., 2000 [69] | CS | 8/M | 27.1 | # | 55.0 * | Lab | 10 min warm up, 5 × 15 min bouts of intermittent shuttle running (at 95 and 55% of O2max separated by 3 min rest) + 1 bout of intermittent shuttle running to fatigue | 6% CHO-E drink (5 mL·kg−1, CHO 60 g·L−1) 10 min prior to exercise and at 15-min intervals | 0.49 [−0.51, 1.49] |
| Desbrow et al., 2004 [70] | CS | 9/M | 30.0 | # | 65.1 * | Lab | amount of cycling work (14 kJ·kg−1) as fast as possible (equal to ~60 min at ~75% Wmax), TA: 22.0 °C | 6% CHO-E drink (Gatorade, Quaker Oats Co.), 8 mL·kg−1 prior to exercise and 2 mL·kg−1 between 20–30%, 50–60%, 70–80% of the total amount of work | 0.02 [−0.90, 0.95] |
| Duhamel et al., 2007 [71] | CS | 15/14 M 1 F | 19.3 | 24.5 | 44.0 * | Lab | TF cycling at ~60% O2peak, TA: 20.0 °C | 6% CHO-E solution (CHO > 1 g·kg−1, 100–300 mL) after 30 min of exercise and every 15 min thereafter, served at 20.0 °C | 0.85 [0.10, 1.60] |
| El-Sayed et al., 1995 [72] | CS | 9/M | 23.8 | 22.2 | 60.7 | Lab | 60 min of continuous cycling at the external workload predicted to elicit 70% O2max + a 10 min self-paced, all-out effort performance ride, TA: 22.0 °C | 7.5% GL solution (3 mL·kg−1) at 15 min prior to exercise and at 20-min intervals (3 mL·kg−1) during the submaximal exercise | 0.57 [−0.38, 1.52] |
| El-Sayed et al., 1997 [73] | CS | 8/M | 24.0 | 21.9 | 66.5 * | Lab | 60 min of simulated cycling TT at a self-selected maximal pace, TA: 22.0 °C | 8% GL solution (4.5 mL·kg−1) prior to exercise | 0.16 [−0.82, 1.14] |
| Finger et al., 2018 [74] | CS | 13/M | 29.7 | 23.1 | 62.2 | Field | running 10 km + cycling 40 km + 5 km running (TT 5 km) at a self-selected pace, TA: 18.0–22.0 °C | 75 g of MD diluted in 450 mL of cold water, doses of 150 mL at kilometers 5, 20, and 35 of the cycling section | 0.04 [−0.73, 0.81] |
| Fulco et al., 2007 i [75] | PS | 9/#M #F | 30.0−30.7 | 23.5 | 43.4 * | Lab | amount of cycling work (720 kJ) as fast as possible (~60 min of cycling at 4300 m altitude while living at the same altitude for 1 days and acclimatization ~2 years at 2000 m) | 10% CHO solution [(mass/volume, 9%) MD + 2% GL + 1% FRU: Ergo Drink. U.S. Army Soldier Systems Command, Natick, MA)] at the start of the exercise every 15 min thereafter (0.175 g·kg−1) | 0.58 [−0.48, 1.64] |
| Fulco et al., 2007 ii [75] | PS | 9/#M #F | 30.0−30.7 | 23.5 | 43.4 * | Lab | amount of cycling work (720 kJ) as fast as possible (~60 min of cycling at 4300 m altitude while living at the same altitude for 3 days acclimatization ~2 years at 2000 m) | 10% CHO solution [(mass/volume, 9%) MD + 2% GL + 1% FRU: Ergo Drink. U.S. Army Soldier Systems Comm, Natick, MA, USA)] at the start of the exercise every 15 min thereafter (0.175 g·kg−1) | 0.43 [−0.62, 1.48] |
| Funnell et al., 2017 i [76] | CS | 16/M | 23.0 | 23.5 | 54.2 | Lab | 3 blocks of the LIST (simulated soccer performance, totaling 45 min), each block (15 min) consisted of ~11 repeated cycles of walking (three shuttles at 1.5 m·s−1), sprinting (15 m), rest (4 s), jogging (three shuttles at 55% predicted O2max) cruising (three shuttles at 95% predicted O2max), 3rd block was “self-selected” intensity distance was recorded | 12% CHO-E solution (SUC:MD:IsoMAL), 250 mL before the LIST | −0.28 [−0.97, 0.42] |
| Funnell et al., 2017 ii [76] | CS | 16/M | 23.0 | 23.5 | 54.2 | Lab | 6 blocks of the LIST (simulated soccer performance, totaling 90 min), each block (15 min) consisted of ~11 repeated cycles of walking (three shuttles at 1.5 m·s−1), sprinting (15 m), rest (4 s), jogging (three shuttles at 55% predicted O2max) cruising (three shuttles at 95% predicted O2max), sixth block was “self-selected” intensity distance was recorded | 12% CHO-E solution (SUC:MD:IsoMAL), 250 mL before at half-time of the LIST | −0.23 [−0.92, 0.47] |
| Ganio et al., 2010 [77] | CS | 14/M | 27.0 | 22.8 | 60.4 | Lab | 120 min of submaximal cycling (alternating 61 ± 5% 75 ± 5% O2max) + a 15-min maximal effort cycling (pedal revolutions increased linearly), TA: 28.7 °C | 6% CHO-E solution (Gatorade, Quaker Oats Co., Barrington, IL, USA) before (6 mL·kg−1) every 15 min during exercise (3 mL·kg−1) | 0.42 [−0.33, 1.17] |
| Glace et al., 2019 i [78] | CS | 10/M | 35.0 | # | 60.3 * | Lab | 120 min of cycling at VT with interspersed higher-intensity intervals + a 3 km TT | 5.9% CHO-E (Gatorade, PepsiCo, Purchase, NY, USA) at a rate of 1% of BM each h (male subjects) | 0.28 [−0.60, 1.16] |
| Glace et al., 2019 ii [78] | CS | 10/F | 42.0 | # | 46.5 * | Lab | 120 min of cycling at VT with interspersed higher-intensity intervals + a 3 km TT | 5.9% CHO-E (Gatorade, PepsiCo, Purchase, NY, USA) at a rate of 1% of BM each h (female subjects) | 0.38 [−0.51, 1.26] |
| Glace et al., 2019 iii [78] | CS | 10/M | 35.0 | # | 60.3 * | Lab | 120 min of cycling at VT with interspersed higher-intensity intervals + a 3 km TT + a ride to exhaustion at RCT | 5.9% CHO-E (Gatorade, PepsiCo, Purchase, NY, USA) at a rate of 1% of BM each h (male subjects) | 0.38 [−0.51, 1.26] |
| Glace et al., 2019 iv [78] | CS | 10/F | 42.0 | # | 46.5 * | Lab | 120 min of cycling at VT with interspersed higher-intensity intervals + a 3 km TT + a ride to exhaustion at RCT | 5.9% CHO-E (Gatorade, PepsiCo, Purchase, NY, USA) at a rate of 1% of BM each h (female subjects) | −0.02 [−0.89, 0.86] |
| Goedecke et al., 2013 [79] | CS | 22/M | 24.0 | 25.0 | 51.8 | Lab | (2 × Illinois agility run) + SSM (LIST ~90 min) + Illinois agility run + timed run to fatigue (20 m runs at progressively increasing speeds at the point where two consecutive shuttles could not be completed) | 7% CHO-E drink (SUC: Energade, Tiger Consumer Br&s Ltd., Bryanston, Johannesburg, South Africa), 250 mL prior to the warm-up and following the 3rd 15-min exercise bout and 50 mL during the 90 sec-break separating each 15-min exercise bout (total: 700 mL, CHO 49 g) | 0.39 [−0.21, 0.99] |
| Gui et al., 2017 [80] | CS | 11/F | 32.4 | 21.0 | 49.0 | Lab | 5 km at 70% O2max + 16 km performance run, TA: 22.0 °C | 6% CHO-E (SUC: Coca-Cola, HK), 150 mL at 0 km and every 2.5 km (CHO ingestion rate ~36 g·h−1) | 0.47 [−0.38, 1.32] |
| Heesch et al., 2014 i [81] | CS | 8/M | 34.5 | 24.8 | 56.8 | Lab | cycling at 60% of the Wmax for 120 min + a 10 km cycling performance trial, TA: 21.5 °C | 3% CHO solution (MD), 250 mL every 15 min during the 2-hr cycling bout | 0.28 [−0.71, 1.26] |
| Heesch et al., 2014 ii [81] | CS | 8/M | 34.5 | 24.8 | 56.8 | Lab | cycling at 60% of the Wmax for 120 min + a 10 km cycling performance trial, TA: 21.5 °C | 6% CHO solution (MD), 250 mL every 15 min during the 1st h, followed by 250 mL of an artificially sweetened placebo beverage every 15 min during the 2nd h of cycling | 0.17 [−0.81, 1.15] |
| Heesch et al., 2014 iii [81] | CS | 8/M | 34.5 | 24.8 | 56.8 | Lab | cycling at 60% of the Wmax for 120 min + a 10 km cycling performance trial, TA: 21.5 °C | artificially sweetened placebo beverage of a 250 mL every 15 min during the 1st h, followed by 250 mL of an 6% CHO solution (MD) every 15 min during the 2nd h of cycling | 0.31 [−0.68, 1.30] |
| Hulston & Jeukendrup 2008 [82] | CS | 10/M | 27.0 | # | 65.7 | Lab | 105 min of SS cycling at 62% O2max followed by a TT to complete a set amount of work (688 ± 56 kJ) as fast as possible | 6.4% CHO solution (GL), 5.5 mL·kg−1 at the onset of exercise and 2 mL·kg−1 at subsequent 15-min intervals until completion of the SS exercise | 0.50 [−0.40, 1.39] |
| Hulston & Jeukendrup 2009 [83] | CS | 10/M | 28.0 | # | 61.7 | Lab | 120 min of SS cycling at 61% O2max followed by a TT to complete a set amount of work (847 ± 78 kJ) as fast as possible | 6% CHO-E solution (GL:FRU in a ratio of 2:1), 600 mL at the onset of exercise and 150 mL every 15 min thereafter | 1.35 [0.36, 2.35] |
| Ivy et al., 1983 [84] | CS | 10/M | 23.8 | 23.3 | 60.4 | Lab | TE walking at 45% O2max | 20% GL-polymer solution (Polycose, Ross Laboratories, Columbus, OH), (2 kcal·mL−1), in four equally divided dosages 60, 90, 120, and 150 min following the start of exercise, (total: GL-polymer 120 g), served at 4.0 °C | 0.86 [−0.07, 1.78] |
| Jarvis et al., 1999 [85] | CS | 10/F | 30.4 | 22.4 | 47.1 | Lab | 50 min of cycle ergometry at 80% O2max + WAT | 7% CHO solution (GL-polymer containing MD: Exceed), 2 mL·kg−1 BM at 10, 20, 30, and 40-min intervals throughout the 50 min of exercise | 0.08 [−0.79, 0.96] |
| Jeukendrup et al., 1997 [86] | CS | 19/17Μ 2 F | 23.0 M and 21.0 F | 31.3 M and 18.8 F | 72.9 M and 64.2 F | Lab | amount of cycling work (0.75 × Wmax × 3600) as fast as possible (~60 min), TA: 20.0 °C | 7.6% CHO-E solution (Isostar, Sandoz Nutrition, Switzerl&), 8 mL·kg−1 at the 5-min warm-up period and 2 mL·kg−1 upon achievement of 25%, 50% and 75% of the work set | 0.54 [−0.11, 1.19] |
| Kang et al., 1995 [87] | CS | 7/M | 23.0 | 23.3 | 61.6 * | Lab | TE cycling at 71 ± 1% O2max | 6% GL-SUC solution (Gatorade, Quaker Oats Co.) every 20 min at a rate of 0.6 g·kg−1·h−1 | 0.61 [−0.47, 1.69] |
| Kang et al., 1996 [88] | CS | 7/M | 23.0 | 23.3 | 61.2 * | Lab | TE cycling at 70% O2max | 6% GL-SUC solution (Gatorade, Quaker Oats Co.) every 20 min at a rate of 0.6 g·kg−1·h−1 | 0.48 [−0.59, 1.55] |
| Khanna & Manna 2005 [89] | CS | 10/M | 25.8 | 21.0 | 54.4 | Lab | TE running at 70% O2max, TA: 25.0 °C | 5% CHO-E solution, 100 mL at 15-min intervals until completion of the exercise | 2.10 [0.96, 3.24] |
| King et al., 2018 i [90] | CS | 10/M | 30.7 | # | 61.6 | Lab | 120 min of cycling at 77% O2max + a 30-min self-paced TT | CHO-E, CHO ingestion rate 60 g·h−1, (D-GL; Thornton & Ross Ltd., Huddersfield, UK), 250 mL solution every 15 min, starting at 15-min into the exercise protocol | 0.43 [−0.46, 1.32] |
| King et al., 2018 ii [90] | CS | 10/M | 30.7 | # | 61.6 | Lab | 120 min of cycling at 77% O2max + a 30-min self-paced TT | CHO-E, CHO ingestion rate 75 g·h−1, (D-GL; Thornton & Ross Ltd., Huddersfield, UK), 250 mL solution every 15 min, starting at 15 min into the exercise protocol | 0.19 [−0.69, 1.07] |
| King et al., 2018 iii [90] | CS | 10/M | 30.7 | # | 61.6 | Lab | 120 min of cycling at 77% O2max + a 30-min self-paced TT | CHO-E, CHO ingestion rate 90 g·h−1, GL:FRU in a ratio of 2:1 (GL:D-GL; Thornton & Ross Ltd., Huddersfield, UK & FRU: Danisco, Kettering, UK), 250 mL solution every 15 min, starting at 15 min into the exercise protocol | 0.83 [−0.10, 1.75] |
| King et al., 2018 iv [90] | CS | 10/M | 30.7 | # | 61.6 | Lab | 120 min of cycling at 77% O2max + a 30-min self-paced TT | CHO-E, GL:FRU in a ratio of 2:1, CHO ingestion rate 112.5 g·h−1 (GL:D-GL; Thornton & Ross Ltd., Huddersfield, UK & FRU: Danisco, Kettering, UK), 250 mL solution every 15 min, starting at 15 min into the exercise protocol | 0.58 [−0.32, 1.48] |
| King et al., 2019 i [91] | CS | 11/M | 30.3 | 24.2 | 60.0 | Lab | 180 min of cycling at 60% O2max + a 30-min self-paced TT | CHO-E, GL:FRU in a ratio of 2:1, CHO ingestion rate 80 g·h−1 (GL:D-GL; Thornton & Ross Ltd., Huddersfield, UK & FRU: Danisco, Kettering, UK), 250 mL solution every 15 min, starting at 15 min into the exercise protocol | 0.92 [0.03, 1.81] |
| King et al., 2019 ii [91] | CS | 11/M | 30.3 | 24.2 | 60.0 | Lab | 180 min of cycling at 60% O2max + a 30-min self-paced TT | CHO-E, GL:FRU in a ratio of 2:1, CHO ingestion rate 90 g·h−1 (GL:D-GL; Thornton & Ross Ltd., Huddersfield, UK & FRU: Danisco, Kettering, UK), 250 mL solution every 15 min, starting at 15 min into the exercise protocol | 1.09 [0.18, 2.00] |
| King et al., 2019 iii [91] | CS | 11/M | 30.3 | 24.2 | 60.0 | Lab | 180 min of cycling at 60% O2max + a 30-min self-paced TT | CHO-E, GL:FRU in a ratio of 2:1, CHO ingestion rate 100 g·h−1 (GL:D-GL; Thornton & Ross Ltd., Huddersfield, UK & FRU: Danisco, Kettering, UK), 250 mL solution every 15 min, starting at 15 min into the exercise protocol | 0.58 [−0.27, 1.44] |
| Kingwell et al., 1989 [92] | CS | 9/M | 23.0 | # | 74.1 | Lab | 160 min of cycling at 65% O2max + 5 min rest + TE at 110% O2max, TA: 20.0–22.0 °C | 10% GL-polymer solution (Polycose), 200 mL at the start of exercise and at 20-min intervals thereafter | 0.53 [−0.42, 1.47] |
| Learsi et al., 2019 i [93] | CS | 9/M | 28.0 | 24.9 | 41.2 | Lab | 105 min of constant-load cycling (50% of the difference between the 1st and 2nd LT) + a 10 km TT, TA: 21.0 °C | 8% CHO beverage (MD, 2 mL·kg−1 of BM: Neonutri, Poços de Caldas, Brazil) immediately prior to exercise, every 15 min throughout the constant-load exercise and at the 5th km point during the 10-km TT | 0.89 [−0.09, 1.87] |
| Learsi et al., 2019 ii [93] | CS | 9/M | 28.0 | 24.9 | 41.2 | Lab | 105 min of constant-load cycling (50% of the difference between the 1st and 2nd LT) + a 10 km TT, TA: 21.0 °C | 8% CHO beverage (MD, 2 mL·kg−1 of BM: Neonutri, Poços de Caldas, Brazil) immediately prior to exercise, every 15 min throughout the constant-load exercise and at the 5th km point during the 10-km TT (overnight fast trial) | 2.31 [1.05, 3.57] |
| Lugo et al., 1993 [94] | CS | 9/M | 23.0 | # | 63.7 * | Lab | 120 min of cycling at 70% O2peak + 5 min rest + TT distance (calculated as the distance traveled if 80% O2peak was maintained for 30 min), TA: 22.0 °C | 7% CHO-E solution (Fluid Replacement Energy Drinks, Ross Laboratories, Columbus, OH), 0.4 g·kg−1 at 0 min and every 30 min until the 120th min | 0.88 [−0.10, 1.86] |
| Martínez-Lagunas et al., 2010 [95] | CS | 12/7 M 5 F | 28.3 | 22.1 | 63.2 M and 49.2 F | Lab | cycling at varied intensities, 55–75% O2max for 150 min + at 80% O2max until fatigued, TA: 21.0–23.0 °C | 6% CHO-E solution, 0.7 g·kg−1·h−1, every 20 min (255.4 ± 9.1 mL) | 0.69 [−0.14, 1.52] |
| Maughan et al., 1989 [96] | CS | 6/M | 29.0 | 22.3 | 53.0 | Lab | TE cycling at 70% O2max | 4% CHO solution (GL-E: Dioralyte, Rorer Health Care Ltd., Eastbourne, UK), 100 mL at 0-min and at 10-min intervals | 0.51 [−0.65, 1.66] |
| McConell et al., 1996 [97] | CS | 8/M | 23.0 | # | 69.2 * | Lab | 120 min of cycling at 70 ± 1% O2peak, + 15 min all out performance, TA: 20.0–22.0 °C | 7% CHO-E drink (Sport Plus, Cadbury Schweppes Pty. Ltd., Melbourne, Australia), 250 mL at 0 min and at 15-min intervals until the 120th min | 1.02 [−0.04, 2.08] |
| McConell et al., 1999 [98] | CS | 8/M | 22.0 | # | 66.9 * | Lab | TE cycling at 69 ± 1% O2peak | 8% CHO solution, 250 mL immediately prior to exercise and at 15-min intervals thereafter | 0.97 [−0.08, 2.03] |
| McConell et al., 2000 [99] | CS | 13/M | 24.0 | 23.0 | 65.7 | Lab | TE cycling at 83 ± 1% O2peak, TA: 19.0–22.0 °C | 6% CHO (D-GL) solution, 7 mL·kg−1 immediately prior to exercise and 3.5 mL·kg−1 at 15-min intervals thereafter | −0.08 [−0.85, 0.69] |
| McGawley et al., 2012 [100] | CS | 10/6 M 4 F | 25.0 M and 26.0 F | # | 62.9 * M and 61.9 * F | Lab | simulated Olympic-distance triathlon with 3-min transition period between sections (1500 m swimming + 40 km cycling at 75% of MAP were of fixed intensity while the 10 km run section was completed as a TT), TA: 15.9 °C | 14.4% CHO-E solution (MD:FRU in a ratio of 2:1: EnergySource Fresh Citrus flavor, H5 Ltd., Leicestershire, UK), 202 ± 20 mL 2 min prior to completing every quarter of the cycle section | 0.40 [−0.48, 1.29] |
| Millard-Stafford et al., 1990 [101] | CS | 10/M | 29.6 | 24.3 | 67.0 | Lab | simulated triathlon: 1.5 km swimming + 40 km cycling + 10 km running, TA: 30.0 °C | 7% CHO-E solution (5% GL-polymer + 2% FRU: Exceed, Ross Laboratories, Columbus, OH), 2 mL·kg−1 following the swim, at 8-km intervals during cycling, and at 3.2-km intervals during running | 0.14 [−0.74, 1.02] |
| Millard-Stafford et al., 2005 i [102] | CS | 10/M | 23.7 | 21.2 | 76.9 | Field | the final 5 km of a 32-km run at 25.6 °C | 6% CHO-E beverage (SUC:GL: Gatorade, The Quaker Oats Co., Chicago, IL, USA), 400 mL 15 min prior to exercise and 250 mL every 5 km thereafter | 0.50 [−0.39, 1.40] |
| Millard-Stafford et al., 2005 ii [102] | CS | 10/M | 23.7 | 21.2 | 76.9 | Field | the final 5 km of a 32-km run at 25.6 °C | 8% CHO-E beverage (3.5% FRU + 2.5%GL + 2% MD: PowerAde, The Coca-Cola Co., Atlanta, GA), 400 mL 15 min prior to exercise and 250 mL every 5 km thereafter | 0.62 [−0.29, 1.52] |
| Millard-Stafford et al., 2007 [103] | CS | 16/M | 27.5 | 23.2 | 60.5 | Lab | 120 min of cycling at fixed intensities alternating between 60% and 75% O2max every 15 min + 15 min ride as hard as possible, TA: 28.5 °C | 6% CHO-E beverage (Gatorade, Quaker Oats Co, Barrington, IL, USA), 6 mL·kg−1 10 min before, 6 mL·kg−1 at onset of exercise and 3 mL·kg−1 at 15-min intervals | 0.34 [−0.36, 1.04] |
| Morris et al., 2003 [104] | CS | 9/M | 23.3 | 24.7 | 57.3 | Field | 5 × 15 min set (walking and variable speed running) each separated by 4 min rest + 60 s run and 60 s rest until exhaustion, TA: 30.0 °C | 6.5% CHO-E solution (DEX:MD:GL: Lucozade Sport, SmithKline Beecham), 6.5 mL·kg−1 prior to exercise and 4.5 mL·kg−1 during every exercise set and rest period (19 min) | −0.31 [−1.24, 0.62] |
| Murray et al., 1987 i [105] | CS | 13/M | 30.6 | 24.6 | 45.1 | Lab | intermittent SS cycling (at 55 and 65% O2max) interspersed with 5 rest periods (3–15 min) and 2 brief, high-intensity performance rides (timed 240 and 480 revolution cycling task), TA: 33.0 °C | 5% CHO drink (GL-polymer), 2 mL·kg−1 during each of the five rest periods | 0.63 [−0.16, 1.42] |
| Murray et al., 1987 ii [105] | CS | 13/M | 30.6 | 24.6 | 45.1 | Lab | intermittent SS cycling (at 55 and 65% O2max) interspersed with 5 rest periods (3–15 min) and 2 brief, high-intensity performance rides (timed 240 and 480 revolution cycling task), TA: 33.0 °C | 6% CHO-E drink (4.0% SUC + 2.0% GL), 2 mL·kg−1 during each of the five rest periods | 1.13 [0.29, 1.97] |
| Murray et al., 1987 iii [105] | CS | 13/M | 30.6 | 24.6 | 45.1 | Lab | intermittent SS cycling (at 55 and 65% O2max) interspersed with 5 rest periods (3–15 min) and 2 brief, high-intensity performance rides (timed 240 and 480 revolution cycling task), TA: 33.0 °C | 7% CHO-E drink (5.0% GL-polymer + 2.0% FRU), 2 mL·kg−1 during each of the five rest periods | 1.49 [0.60, 2.37] |
| Murray et al., 1989 i [106] | CS | 12/7 M 5 F | 30.7 | 23.1 | 42.8 | Lab | 3 × 20 min of cycling at 65% O2max each separated by 5 min rest between each bout + time to complete 1200 pedal revolutions as fast as possible (workload: 65% O2max at 60 rpm), TA: 33.4 °C | 6% CHO-E drink (SUC), 2.5 mL·kg−1 prior to exercise and during each of the three rest periods, served at 8.0 °C | 0.57 [−0.25, 1.39] |
| Murray et al., 1989 ii [106] | CS | 12/7 M 5 F | 30.7 | 23.1 | 42.8 | Lab | 3 × 20 min of cycling at 65% O2max each separated by 5 min rest between each bout + time to complete 1200 pedal revolutions as fast as possible (workload: 65% O2max at 60 rpm), TA: 33.4 °C | 8% CHO-E drink (SUC), 2.5 mL·kg−1 prior to exercise and during each of the three rest periods, served at 8.0 °C | 0.30 [−0.50, 1.11] |
| Murray et al., 1989 iii [106] | CS | 12/7 M 5 F | 30.7 | 23.1 | 42.8 | Lab | 3 × 20 min of cycling at 65% O2max each separated by 5 min rest between each bout + time to complete 1200 pedal revolutions as fast as possible (workload: 65% O2max at 60 rpm), TA: 33.4 °C | 10% CHO-E drink (SUC), 2.5 mL·kg−1 prior to exercise and during each of the three rest periods, served at 8.0 °C | 0.05 [−0.75, 0.85] |
| Murray et al., 1991 i [107] | CS | 10/8 M 2 F | 32.5 | # | 48.3 | Lab | 120 min of cycling at various intensities (65–75% O2max) + 4.8 km performance, TA: 10.0 °C | 6% CHO solution (GL, ingestion rate 26 g·h−1: Grain Processing Corp., Muscatine, IA) at the 12 th min and every 15 min thereafter, served at 10.0 °C | 0.60 [−0.30, 1.50] |
| Murray et al., 1991 ii [107] | CS | 10/8 M 2 F | 32.5 | # | 48.3 | Lab | 120 min of cycling at various intensities (65–75% O2max) + 4.8 km performance, TA: 10.0 °C | 12% CHO solution (8% MD + 4% DEX, CHO ingestion rate 52 g·h−1: Grain Processing Corp., Muscatine, IA) at the 12th min and every 15 min thereafter, served at 10.0 °C | 0.40 [−0.49, 1.29] |
| Murray et al., 1991 iii [107] | CS | 10/8 M 2 F | 32.5 | # | 48.3 | Lab | 120 min of cycling at various intensities (65–75% O2max) + 4.8 km performance, TA: 10.0 °C | 18% CHO solution (15% MD + 3% DEX, CHO ingestion rate 78 g·h−1: Grain Processing Corp., Muscatine, IA) at the 12th min and every 15 min thereafter, served at 10.0 °C | 0.49 [−0.40, 1.38] |
| Naclerio et al., 2014 [108] | CS | 10/M | 25.0 | 24.0 | # | Lab | 90 min of intermittent repeated running sprint test involving 4 blocks of 11 sets of 3 repetitions of 60 m at 60%, 80%, and 60% maximal aerobic speed plus 15 m sprint (IRST) | 13.9% CHO solution, 500 mL containing 69.5 g of CHO (MD), immediately prior to the 1st, 2nd, 3rd, and 4th blocks of the IRST | −0.01 [−0.89, 0.87] |
| Nassif et al., 2014 [109] | CS | 10/M | 26.0 | 22.3 | 70.7 | Lab | 60 km cycling TT punctuated by 1-km sprints (14, 29, 44, 59 km), TA: 32.0 °C | 6% CHO solution (4 mL·kg−1 of BM) at 5 km, after each sprint (15, 30, 45 km) and at 55 km, served at 4.0 °C | −0.66 [−1.56, 0.25] |
| Nassis et al., 1998 [110] | CS | 9/8 M 1 F | 25.0 | 23.5 | 65.1 | Lab | 15 s bouts of fast running (at 80% O2max for the 1st 60 min, at 85% O2max from 60 to 100 min of exercise and finally at 90% O2max from 100 min of exercise until exhaustion) separated by 10 s of slow running (at 45% O2max), TA: 21.6 °C | 6.9% CHO-E solution served at 8.0–9.0 °C (Lucozade-Sport, SmithKline Beecham Coleford, Glos, UK) immediately before the run (3 mL·kg−1) and every 20 min thereafter (2 mL·kg−1) | −0.10 [−1.02, 0.83] |
| Newell et al., 2015 i [111] | CS | 20/M | 34.0 | 23.5 | 62.0 | Lab | 120 min of constant-load ride at 95% of LT (185 ± 25 W) + a work-matched TT task (~30 min at 70% of PPO), TA: 19.0 °C | 2.0% CHO-E drink (GL-monomers-polymers) at a rate of 1 L·h−1 (240 mL 2 min prior to exercise, subsequently 220 mL every 15 min with the final drink provided at the 120th min of exercise), served at 10.0 °C | 0.34 [−0.28, 0.97] |
| Newell et al., 2015 ii [111] | CS | 20/M | 34.0 | 23.5 | 62.0 | Lab | 120 min of constant-load ride at 95% of LT (185 ± 25 W) + a work-matched TT task (~30 min at 70% of PPO), TA: 19.0 °C | 3.9% CHO-E drink (GL-monomers-polymers) at a rate of 1 l·h−1 (240 mL 2 min prior to exercise, subsequently 220 mL every 15 min with the final drink provided at the 120th min of exercise), served at 10.0 °C | 0.59 [−0.05, 1.22] |
| Newell et al., 2015 iii [111] | CS | 20/M | 34.0 | 23.5 | 62.0 | Lab | 120 min of constant-load ride at 95% of LT (185 ± 25 W) + a work-matched TT task (~30 min at 70% of PPO), TA: 19.0 °C | 6.4% CHO-E drink (GL-monomers-polymers) at a rate of 1 L·h−1 (240 mL 2 min prior to exercise, subsequently 220 mL every 15 min with the final drink provided at the 120th min of exercise), served at 10.0 °C | 0.62 [−0.02, 1.25] |
| Nicholas et al., 1995 [112] | CS | 9/M | 24.8 | 24.9 | 56.3 | Field | 5 × 15 min periods of intermittent running, consisting of sprinting, interspersed with periods of jogging and walking + intermittent running to fatigue (corresponding to 55 and 95% O2max, alternating every 20 m), TA: 20.0 °C | 6.9% CHO-E solution (Lucozade-Sport, SmithKline Beecham, Brentford, UK) immediately prior to exercise (5 mL·kg−1) and every 15 min thereafter (2 mL·kg−1) | 0.55 [−0.40, 1.49] |
| Nikolopoulos et al., 2004 [113] | CS | 8/M | 25.0 | # | 66.0 | Lab | TE cycling at 84 ± 1% O2max | 6.4% CHO-E solution, 10 min prior to exercise (8 mL·kg−1) and every 15 min thereafter (2 mL·kg−1) | 0.34 [−0.65, 1.33] |
| Nishibata et al., 1993 [114] | CS | 7/M | 27.0 | 22.5 | 50.3 | Lab | TE cycling at 73.4 ± 7.7% O2max | 10% GL-drink 15 min prior to exercise and at the 15th min and 45th min of exercise equal amounts, chilled with ice (total: GL 43.1 ± 4.2 g) | −0.20 [−1.25, 0.85] |
| Oosthuyse et al., 2015a i [115] | CS | 9/M | 38.0 | 24.2 | 60.8 | Lab | 120 min of SS cycling (60% Wmax) + a 16 km TT, TA: 17.0–19.0 °C | 7% CHO-E solution equal to 900 mL·h−1 and CHO ingestion rate 63 g·h−1 of 0.8:1 FRU:MD (Krystar 300 crystalline FRU, Tate & Lyle, Decatur, IL, USA & Glucidex 12, Roquette Frères, Lestrem Cedex, France) | 0.07 [−0.86, 0.99] |
| Oosthuyse et al., 2015a ii [115] | CS | 9/M | 38.0 | 24.2 | 60.8 | Lab | 120 min of SS cycling (60% Wmax) + a 16 km TT, TA: 17.0–19.0 °C | 7% CHO-E solution equal to 900 mL·h−1 and CHO ingestion rate 63 g·h−1 of IsoMAL (Palatinose, Beneo-Palatinit GmbH, Mannheim, Germany) | −0.31 [−1.24, 0.62] |
| Oosthuyse et al., 2015b [116] | CS | 8/M | 38.9 | 24.3 | 60.9 | Lab | 120 min of SS cycling (60% Wmax) + a 16 km TT, TA: 19.2 °C | 7% CHO-E solution equal to 900 mL·h−1 and CHO ingestion rate 63 g·h−1 at a ratio of 0.8:1 FRU:MD (Krystar 300 crystalline FRU, Tate & Lyle, Decatur, IL, USA & Glucidex 12, Roquette Frères, Lestrem Cedex, France), 400 mL before commencing exercise, 200 mL at every 15 min | 0.15 [−0.83, 1.14] |
| Osterberg et al., 2008 [117] | CS | 13/M | 31.2 | 22.6 | 56.0 * | Lab | 120 min of constant-load cycling at a workload 5% below OBLA followed by a TT to complete a set amount of work (7 kJ·kg−1) as quickly as possible, TA: 23.0 °C | 6% CHO-E beverage (2% SUC + 2% GL + 2% FRU: Gatorade Thirst Quencher, The Gatorade Company, Chicago, IL, USA), 250 mL every 15 min during the constant-load ride | 0.60 [−0.19, 1.39] |
| O’Hara et al., 2014 i [118] | CS | 10/M | 31.0 | # | 58.1 | Lab | 4 × 5 min of continuous progressive workload increments corresponding to 70, 75, 80, and 85% Wmax + 10 × 90 s sprints at 90% Wmax separated by 180 s recovery at 55% Wmax + cycling to volitional exhaustion at 90% Wmax, TA: 18.0 °C | 4% CHO solution, 40 g of GAL (D-GAL: Inalco, Milan, Italy) as 1 l formulation | 0.34 [−0.54, 1.22] |
| O’Hara et al., 2014 ii [118] | CS | 10/M | 31.0 | # | 58.1 | Lab | 4 × 5 min of continuous progressive workload increments corresponding to 70, 75, 80, and 85% Wmax + 10 × 90 s sprints at 90% Wmax separated by 180 s recovery at 55% Wmax + cycling to volitional exhaustion at 90% Wmax, TA: 18.0 °C | 4% CHO solution, 40 g of GL (D-GL: Cargill, Manchester, UK) as 1 l formulation | −0.25 [−1.13, 0.63] |
| O’Neal et al., 2013 [119] | CS | 36/23M 13 F | 23.0 | 23.8 | # | Lab | 50 min of stationary cycling at ~60–65% of heart rate reserve (146 ± 4 bpm) interspersed with 5 rest periods of 2 min each + 3 × 30 s WAT with 2.5 min rest between tests, TA: 25.0 °C | 6% CHO-E beverage in 3 equal aliquots, at minutes 0, 20, and 40 during the 60-min submaximal cycling bout (mean total beverage 847 ± 368 mL: equivalent to participant’s sweat losses), served chilled | 0.10 [−0.36, 0.56] |
| Pettersson et al., 2019 [120] | CS | 12/6 M 6 F | 25.6 M and 24.8 F | # | 69.1 * M and 59.9 * F | Lab | 120 min of submaximal diagonal-style roller-skiing (69.3 ± 2.9% of O2peak) at a constant incline of 5° (treadmill speed, males: 9.7 ± 0.2 km·h−1, females: 8.5 ± 0.3 km·h−1) + final 2000 m for females or 2400 m for males TT, TA: −5.0 °C | 18% CHO-E solution (MD:FRU, in a ratio of 1:0.8) with additional gelling polysaccharides (Maurten AB, Gothenburg, Sweden), ~220 mL before the onset of exercise, subsequently, 220 mL every 20 min, CHO ingestion rate 132 g·h−1 | −0.06 [−0.86, 0.74] |
| Pottier et al., 2010 [121] | CS | 12/# | 30.2 | # | 61.7 | Lab | amount of cycling work (0.75 × Wmax × 3600) as fast as possible (~60 min of cycling), TA: 19.0–21.0 °C | 5.86% CHO-E solution (5.4% SUC + 0.46% GL: Gatorade), before and after warm-up, 2 and 1.5 mL·kg−1 BM respectively and after reaching each 12.5% of the total amount of work; subjects also received 1.5 mL·kg−1 BM | −0.16 [−0.96, 0.64] |
| Rilley et al., 1988 [122] | CS | 9/M | 30.0 | 22.9 | 65.0 | Lab | TE cycling at 70–75% O2max | 7% CHO drink (5% GL-polymer + 2% FRU: Exceed, Ross Laboratories, Columbus, OH) at 20-min intervals beginning 20 min prior to exercise (14 g CHO each treatment) | 0.16 [−0.77, 1.08] |
| Roberts et al., 2014 i [123] | CS | 14/M | 31.8 | 23.0 | 60.4 | Lab | 150 min of continuous cycling at 50% Wmax (176.71 ± 25.92 W) + a 60 km cycling TT, TA: 22.4 °C | 10% CHO-E beverage (High 5 Ltd.), MD 1.1 g·min−1 + FRU 0.6 g·min−1, 270 mL doses at the start and every 15 min (until completion of the performance trial) | 0.50 [−0.47, 1.48] |
| Roberts et al., 2014 ii [123] | CS | 14/M | 31.8 | 23.0 | 60.4 | Lab | 150 min of continuous cycling at 50% Wmax (176.71 ± 25.92 W) + a 60 km cycling TT, TA: 22.4 °C | 10% CHO-E beverage (High 5 Ltd.), MD 1.7 g·min−1, 270 mL doses at the start and every 15 min (until completion of the performance trial) | −0.06 [−1.02, 0.90] |
| Robson-Ansley et al., 2009 [124] | CS | 7/M | 24.0 | 23.1 | # | Lab | 90 min run of self-paced TT on a motorized treadmill | 8% CHO fluid, 8 mL·kg−1 5 min prior to exercise and 2 mL·kg−1 every 20 min thereafter | 0.44 [−0.63, 1.50] |
| Robson-Ansley et al., 2011 [125] | CS | 9/M | 26.0 | 22.4 | 58.0 | Lab | 120 min of continuous running at velocity ~60% O2max followed by a 5 km TT, TA: 20.0 °C | 8% CHO solution immediately before and at 20-min intervals during the preload bout (2 mL·kg−1 BM) | 0.16 [−0.76, 1.09] |
| Rollo and Williams 2009 [126] | CS | 8/M | 31.0 | 23.1 | 62.0 * | Lab | 60 min performance run, TA: 16 °C | 6.4% CHO-E solution (Lucozade Sport, Brentford, UK), 30 min before the 1-hr run (8 mL·kg−1 BM) and at 15-min intervals during the run 2 mL·kg−1 BM (total: CHO ingestion rate ~60 g·h−1) | 0.28 [−0.71, 1.26] |
| Rollo and Williams 2010 [127] | CS | 10/M | 34.0 | 23.0 | 62.0 * | Lab | 60 min run as far as possible on an automated treadmill that allowed changes in running speed without manual input, TA: 16.0 °C | 6.4% CHO-E solution (8 mL·kg−1 BM, Lucozade Sport, Brentford, UK), 30 min before and 2 mL·kg−1 BM at 15-min intervals | −0.06 [−0.93, 0.82] |
| Rollo et al., 2011 [128] | CS | 10/M | 26.0 | 22.6 | 65.0 * | Lab | 60 min performance run, TA: 20 °C | 6.4% CHO-E solution (Lucozade Sport, Brentford, UK), 30 min before the 1-hr run (8 mL·kg−1 BM) and at 15-min intervals during the run 2 mL·kg−1 BM (total: CHO ingestion rate ~60 g·h−1) | 0.40 [−0.49, 1.29] |
| Smith et al., 2010 i [129] | CS | 12/M | 31.7 | 23.4 | 55.3 * | Lab | 120 min of constant-load ride (77% O2peak) + a 20 km TT, TA: 23.0 °C | 1.5% CHO-E solution (GL, ingestion rate 15 g·h−1), 2000 mL (250 mL every 15 min, starting at min 15 and ending at min 120) | 0.41 [−0.40, 1.22] |
| Smith et al., 2010 ii [129] | CS | 12/M | 31.7 | 23.4 | 55.3 * | Lab | 120 min of constant-load ride (77% O2peak) + a 20 km TT, TA: 23.0 °C | 3.0% CHO-E solution (GL, ingestion rate 30 g·h−1), 2000 mL (250 mL every 15 min, starting at min 15 and ending at min 120) | 0.49 [−0.32, 1.31] |
| Smith et al., 2010 iii [129] | CS | 12/M | 31.7 | 23.4 | 55.3 * | Lab | 120 min of constant-load ride (77% O2peak) + a 20 km TT, TA: 23.0 °C | 6.0% CHO-E solution (GL, ingestion rate 60 g·h−1), 2000 mL (250 mL every 15 min, starting at min 15 and ending at min 120) | 0.65 [−0.18, 1.47] |
| Steiner et al., 2009 [130] | CS | 9/6 M 3 F | 28.2 M 21.5 F | 22.6 | 45.7 * | Lab | cycling 45 min production trial consisting of a 5-min warm-up at 50 W + by 45 min of self-selected PO at an RPE of 16 (at 70–80 rpm) | 6% CHO-E solution (Gatorade Sports Science Institute, Barrington, IL, USA), 240 mL just prior to exercise and every 15 min during the production trial | 0.07 [−0.85, 1.00] |
| Sun et al., 2015 [131] | CS | 8/F | 28.3 | 19.8 | 48.3 | Lab | running to exhaustion at 70% O2max on a treadmill, TA: 20.3–21.3 °C | 6% CHO-E solution (3 mL·kg−1 BM) every 20 min during exercise | 0.62 [−0.39, 1.63] |
| Tokmakidis & Karamanolis 2008 [132] | CS | 11/10 M 1 F | 25.3 | 24.5 | 49.0 | Lab | running at 60% O2max for 5 min, at 70% for 45 min + at 80% O2max until exhaustion | ~18.5% CHO solution (GL, 1 g·kg−1, 400 g), 15 min prior to exercise | 0.27 [−0.57, 1.11] |
| Tsintzas et al., 1993 [133] | CS | 7/4 M 3 F | 32.6 | 22.4 | 61.9 | Field | 30 km race running | 5% CHO solution (1.8% GL-polymer + 2% FRU + 1.2% other CHO: Replay, Bass Ltd.), 250 mL at onset of exercise and 150 mL every 5 km thereafter | 0.14 [−0.91, 1.19] |
| Tsintzas et al., 1995 i [134] | CS | 7/M | 44.0 | 21.3 | 58.4 | Lab | marathon-race running, TA: 20.0 °C | 6.9% CHO-E drink (3.1% MD + 3.8% SUC), 3 mL·kg−1 prior to exercise and 2 mL·kg−1 every 5 km thereafter | 0.13 [−0.92, 1.17] |
| Tsintzas et al., 1995 ii [134] | CS | 7/M | 44.0 | 21.3 | 58.4 | Lab | marathon-race running, TA: 20.0 °C | 5.5% CHO-E drink (2.7% MD + 1.7% GL-syrup + 1.1% FRU-syrup), 3 mL·kg−1 prior to exercise and 2 mL·kg−1 every 5 km thereafter | 0.31 [−0.75, 1.36] |
| Tsintzas et al., 1996a [135] | CS | 8/M | 29.7 | 23.4 | 61.8 | Lab | TE running at 70% O2max, TA: 19.8 °C | 5.5% CHO-E solution (1.7% GL + 1.1% FRU + 0.6% MAL + 2.1% saccharides), 8 mL·kg−1 prior to exercise and 2 mL·kg−1 every 20 min thereafter | 0.89 [−0.16, 1.93] |
| Tsintzas et al., 1996b i [136] | CS | 11/M | 27.0 | 23.3 | 61.7 | Lab | TE running at 70% O2max, TA: 19.5 °C | 5.5% CHO-E solution (1.7% GL + 1.1% FRU + 0.6% MAL + 2.1% saccharides), 8 mL·kg−1 prior to exercise and 2 mL·kg−1 every 20 min thereafter | 0.49 [−0.36, 1.34] |
| Tsintzas et al., 1996b ii [136] | CS | 11/M | 27.0 | 23.3 | 61.7 | Lab | TE running at 70% O2max, TA: 19.5 °C | 6.9% CHO-E drink (Lucozade Sport, SmithKline Beecham, UK), 8 mL·kg−1 prior to exercise and 2 mL·kg−1 every 20 min thereafter | 0.37 [−0.48, 1.21] |
| Utter et al., 2002 [137] | PS | 48/#M #F | 41.2−42.7 | 23.5 | 49.7 | Field | marathon-race running, TA: 19.1 °C | 6% CHO-E beverage (Gatorade Sports Science Institute, Barrington, IL, USA), 650 mL ~30 min before the start of the race and 1000 mL every 60 min thereafter | 0.04 [−0.36, 0.43] |
| Van Essen et al., 2006 [138] | CS | 10/M | 24.0 | 22.9 | 63.0 * | Lab | 80 km cycling TT, TA: 20.0–23.0 °C | 6% CHO-E beverage (SUC), 250 mL every 15 min | 0.19 [−0.69, 1.07] |
| Walton & Rhodes 1997 [139] | CS | 10/F | 21.9 | 22.7 | 45.8 | Lab | 2 × 19 min periods of high-intensity intermittent running separated by a 10 min break, at 5 min post-exercise + performance trial (repeated 10-sec sprints at 120% O2max, in a 1:1 work-to-rest ratio, until exhaustion) | 12.5% CHO solution, 400 mL at the start of the trial | 0.68 [−0.23, 1.59] |
| Watson et al., 2012 i [140] | CS | 12/M | 22.0 | 22.4 | 54.4 | Lab | cycling to volitional exhaustion at 70% O2max, TA: 10 °C | 2% CHO-E solutions (SUC:GL:FRU in a ratio of 50:25:25: Tesco, Ltd., Cheshunt, UK) immediately prior to exercise and every 10 min during exercise, served at 21.0 °C | 0.19 [−0.61, 0.99] |
| Watson et al., 2012 ii [140] | CS | 12/M | 22.0 | 22.4 | 54.4 | Lab | cycling to volitional exhaustion at 70% O2max, TA: 10 °C | 4% CHO-E solutions (SUC:GL:FRU in a ratio of 50:25:25: Tesco, Ltd., Cheshunt, UK) immediately prior to exercise and every 10 min during exercise, served at 21.0 °C | 0.59 [−0.23, 1.41] |
| Watson et al., 2012 iii [140] | CS | 12/M | 22.0 | 22.4 | 54.4 | Lab | cycling to volitional exhaustion at 70% O2max, TA: 10 °C | 6% CHO-E solutions (SUC:GL:FRU in a ratio of 50:25:25: Tesco, Ltd., Cheshunt, UK) immediately prior to exercise and every 10 min during exercise, served at 21.0 °C | 0.60 [−0.22, 1.42] |
| Watson et al., 2012 iv [140] | CS | 12/M | 21.0 | 25.0 | 52.4 | Lab | cycling to volitional exhaustion at 60% O2max, TA: 30 °C | 2% CHO-E solutions (SUC:GL:FRU in a ratio of 50:25:25: Tesco, Ltd., Cheshunt, UK) immediately prior to exercise and every 10 min during exercise, served at 21.0 °C | 0.41 [−0.40, 1.22] |
| Watson et al., 2012 v [140] | CS | 12/M | 21.0 | 25.0 | 52.4 | Lab | cycling to volitional exhaustion at 60% O2max, TA: 30 °C | 4% CHO-E solutions (SUC:GL:FRU in a ratio of 50:25:25: Tesco, Ltd., Cheshunt, UK) immediately prior to exercise and every 10 min during exercise, served at 21.0 °C | 0.41 [−0.40, 1.22] |
| Watson et al., 2012 vi [140] | CS | 12/M | 21.0 | 25.0 | 52.4 | Lab | cycling to volitional exhaustion at 60% O2max, TA: 30 °C | 6% CHO-E solutions (SUC:GL:FRU in a ratio of 50:25:25: Tesco, Ltd., Cheshunt, UK) immediately prior to exercise and every 10 min during exercise, served at 21.0 °C | 0.63 [−0.19, 1.46] |
| Wilber et al., 1992 [141] | CS | 10/M | 30.0 | 20.9 | 64.9 | Lab | TE running at 80% O2max, TA: 22.0 °C | 7% CHO solution (85% GL-polymer + 15% SUC: Exceed, Ross Laboratories, Columbus, OH), 5 min prior to exercise (250 mL) and at 15-min intervals during exercise (150 mL), served at 5.0 °C | 0.85 [−0.08, 1.77] |
| Williams et al., 1990 i [142] | CS | 12/M | 30.8 | 21.6 | 63.4 | Lab | 30 km-race running, TA: 20.2 °C | 5% CHO-E solution (2% GL-polymer + 2% free-GL + 1% other CHO), 5 min prior to exercise 250 mL and every 5 km 150 mL | 0.27 [−0.60, 1.14] |
| Williams et al., 1990 ii [142] | CS | 12/M | 30.8 | 21.6 | 63.4 | Lab | 30 km-race running, TA: 20.2 °C | 5% CHO-E solution (2% GL-polymer + 2% FRU + 1% other CHO), 5 min prior to exercise 250 mL and every 5 km 150 mL | 0.18 [−0.68, 1.05] |
Publisher’s Note: MDPI stays neutral with regard to jurisdictional claims in published maps and institutional affiliations. |
© 2021 by the authors. Licensee MDPI, Basel, Switzerland. This article is an open access article distributed under the terms and conditions of the Creative Commons Attribution (CC BY) license (https://creativecommons.org/licenses/by/4.0/).
Share and Cite
Bourdas, D.I.; Souglis, A.; Zacharakis, E.D.; Geladas, N.D.; Travlos, A.K. Meta-Analysis of Carbohydrate Solution Intake during Prolonged Exercise in Adults: From the Last 45+ Years’ Perspective. Nutrients 2021, 13, 4223. https://doi.org/10.3390/nu13124223
Bourdas DI, Souglis A, Zacharakis ED, Geladas ND, Travlos AK. Meta-Analysis of Carbohydrate Solution Intake during Prolonged Exercise in Adults: From the Last 45+ Years’ Perspective. Nutrients. 2021; 13(12):4223. https://doi.org/10.3390/nu13124223
Chicago/Turabian StyleBourdas, Dimitrios I., Athanasios Souglis, Emmanouil D. Zacharakis, Nickos D. Geladas, and Antonios K. Travlos. 2021. "Meta-Analysis of Carbohydrate Solution Intake during Prolonged Exercise in Adults: From the Last 45+ Years’ Perspective" Nutrients 13, no. 12: 4223. https://doi.org/10.3390/nu13124223
APA StyleBourdas, D. I., Souglis, A., Zacharakis, E. D., Geladas, N. D., & Travlos, A. K. (2021). Meta-Analysis of Carbohydrate Solution Intake during Prolonged Exercise in Adults: From the Last 45+ Years’ Perspective. Nutrients, 13(12), 4223. https://doi.org/10.3390/nu13124223