
Daily Vinegar Ingestion Improves Depression Scores and Alters the Metabolome in Healthy Adults: A Randomized Controlled Trial

 ,
,  ,
, 
Abstract

1. Introduction
2. Materials and Methods
2.1. Reagents
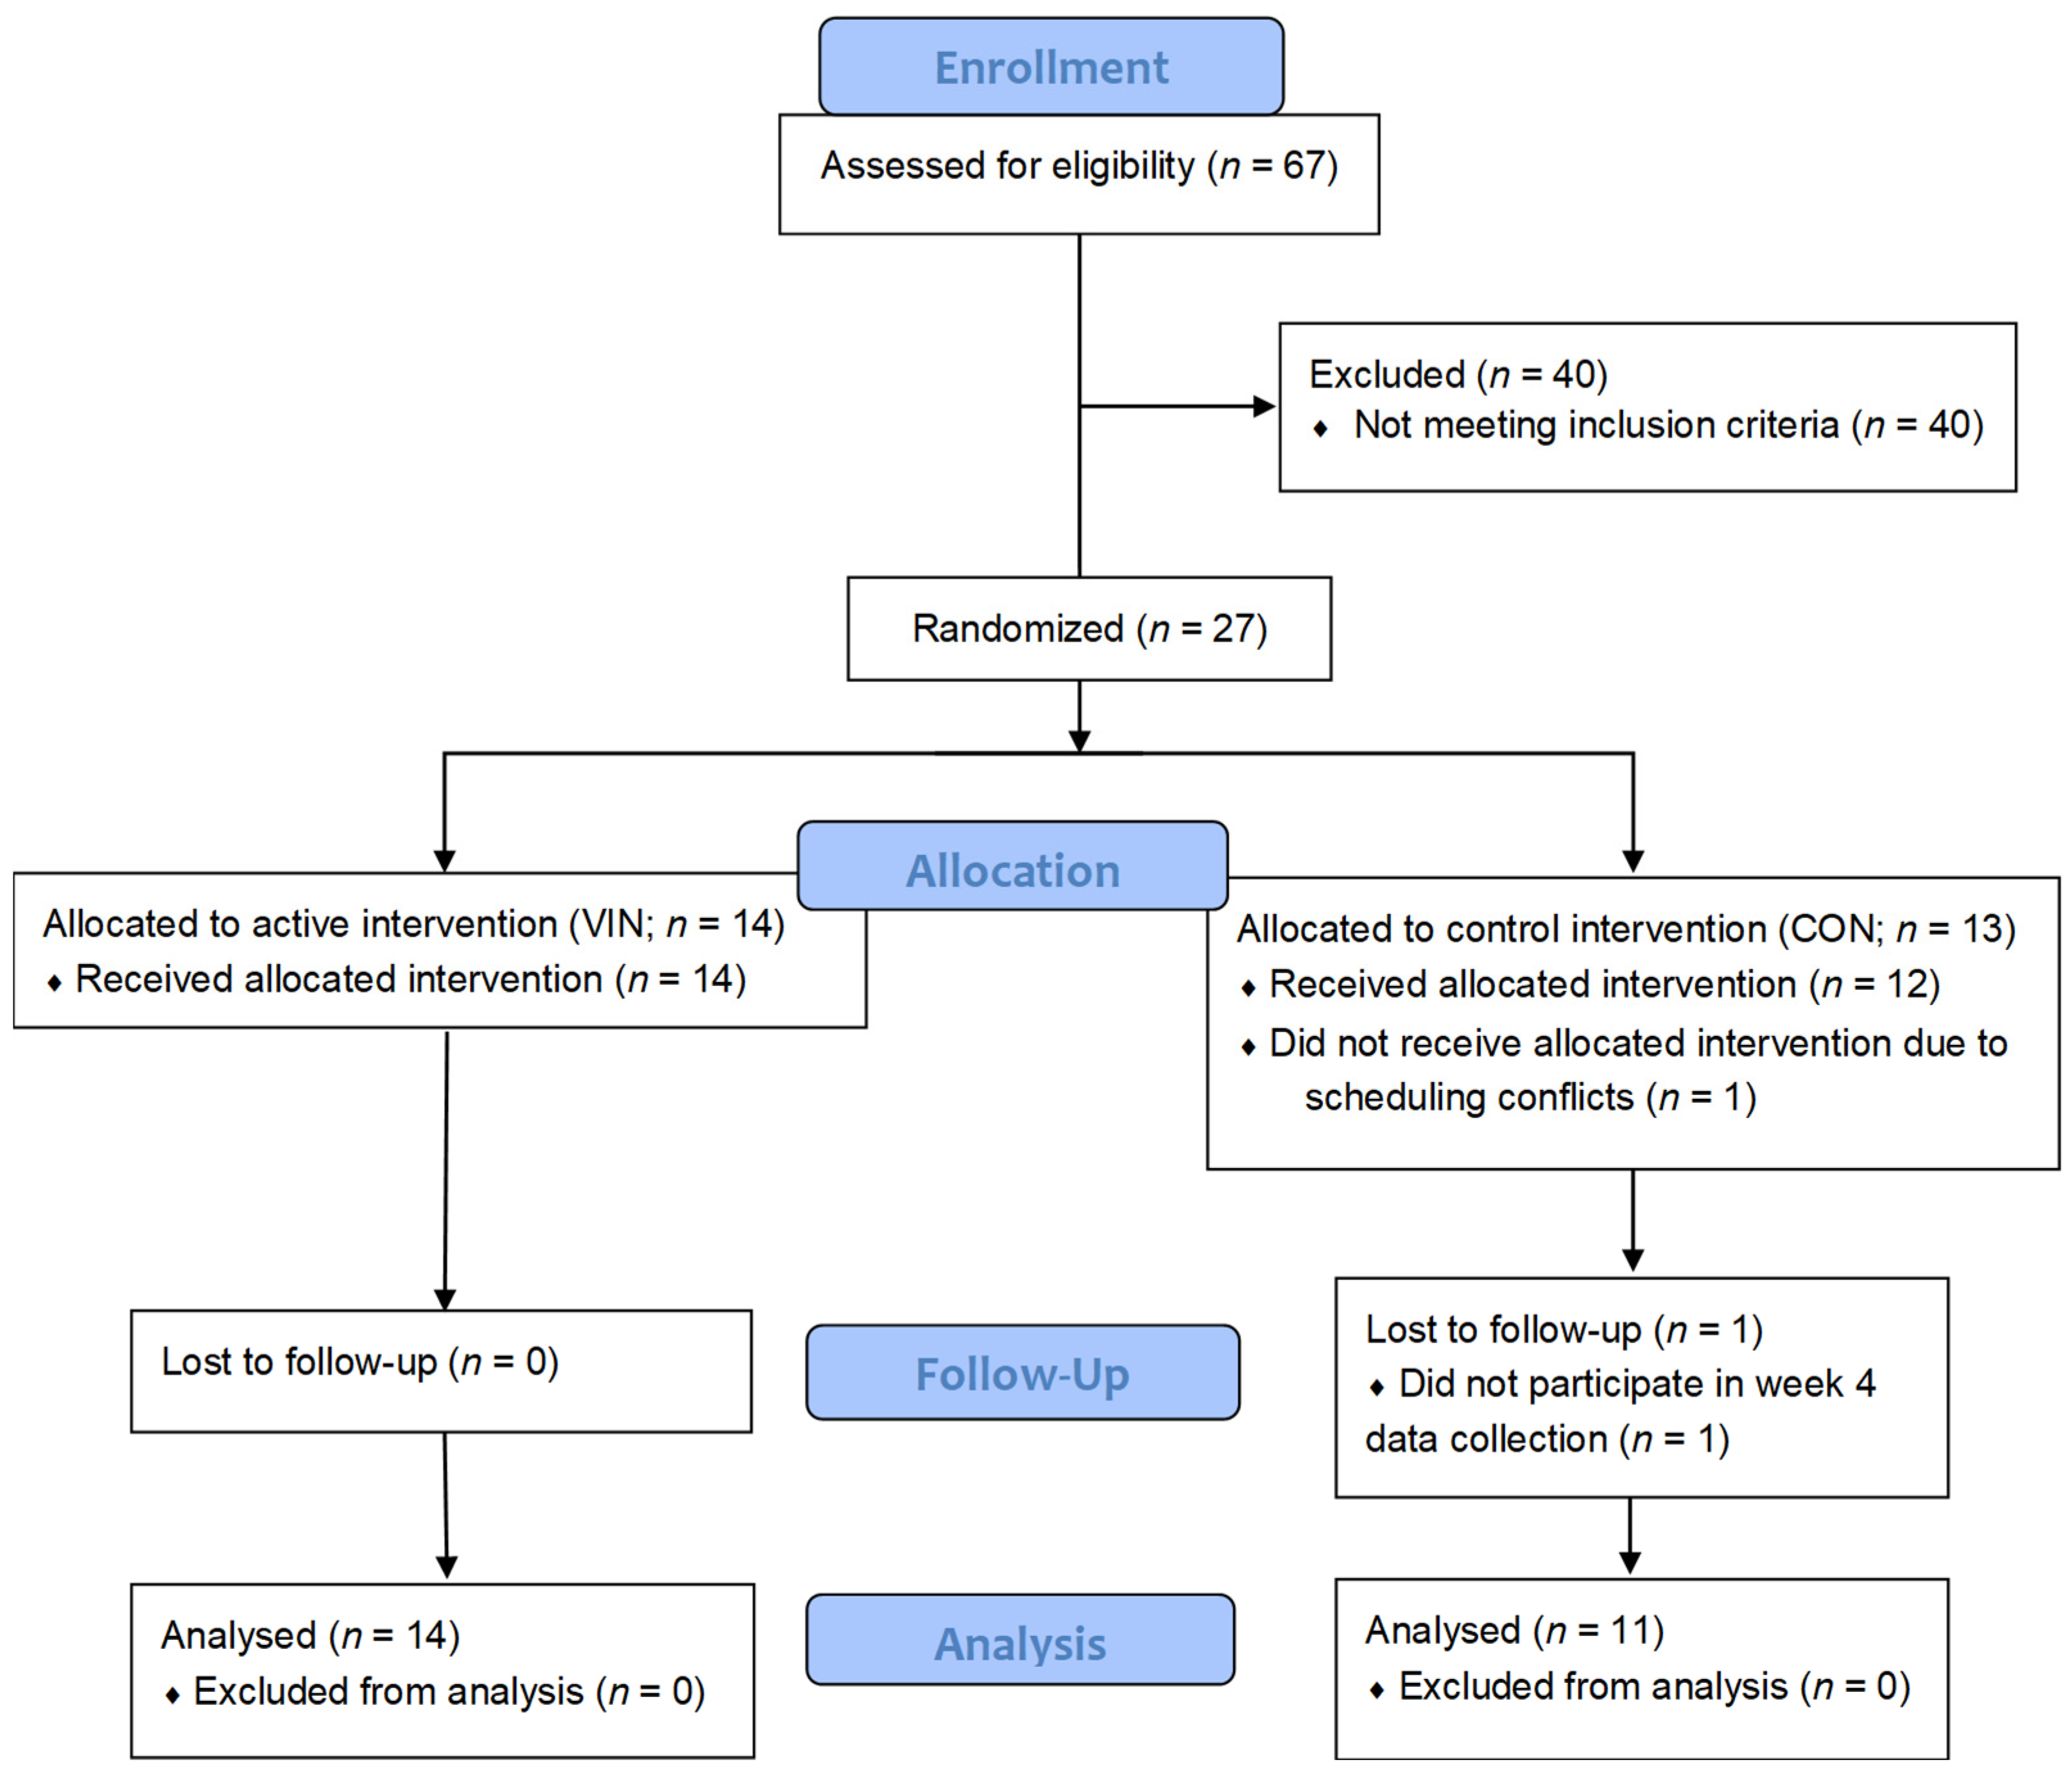
2.2. Participants
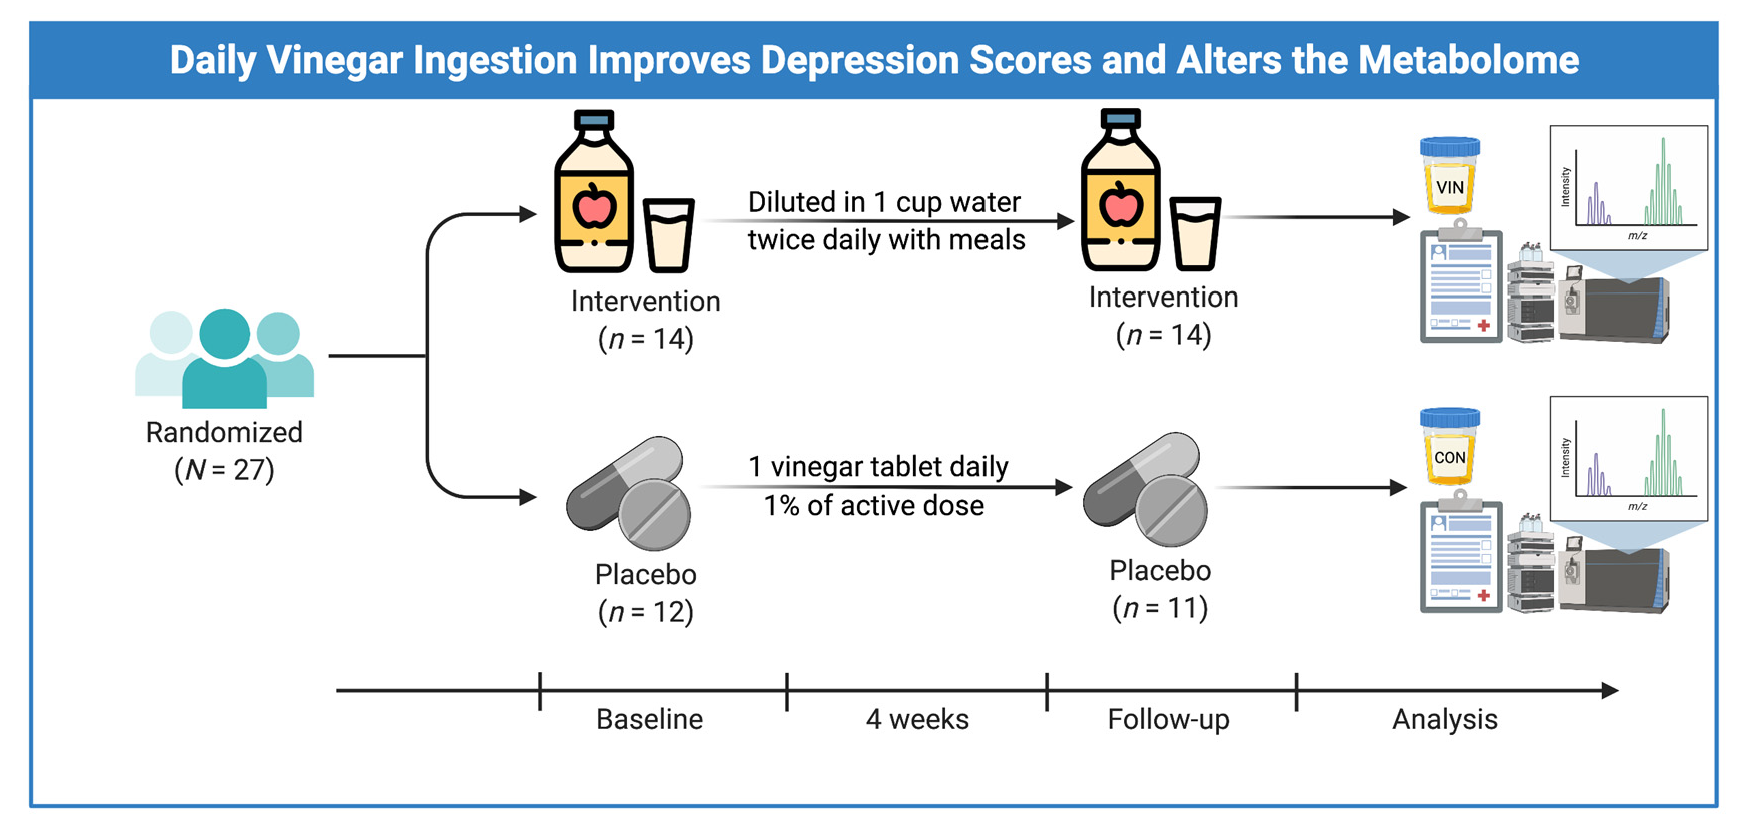
2.3. Study Protocol
2.4. Questionnaires
2.5. Urine Metabolomics Analyses
2.6. Statistical Analysis
3. Results
3.1. Psychological Data
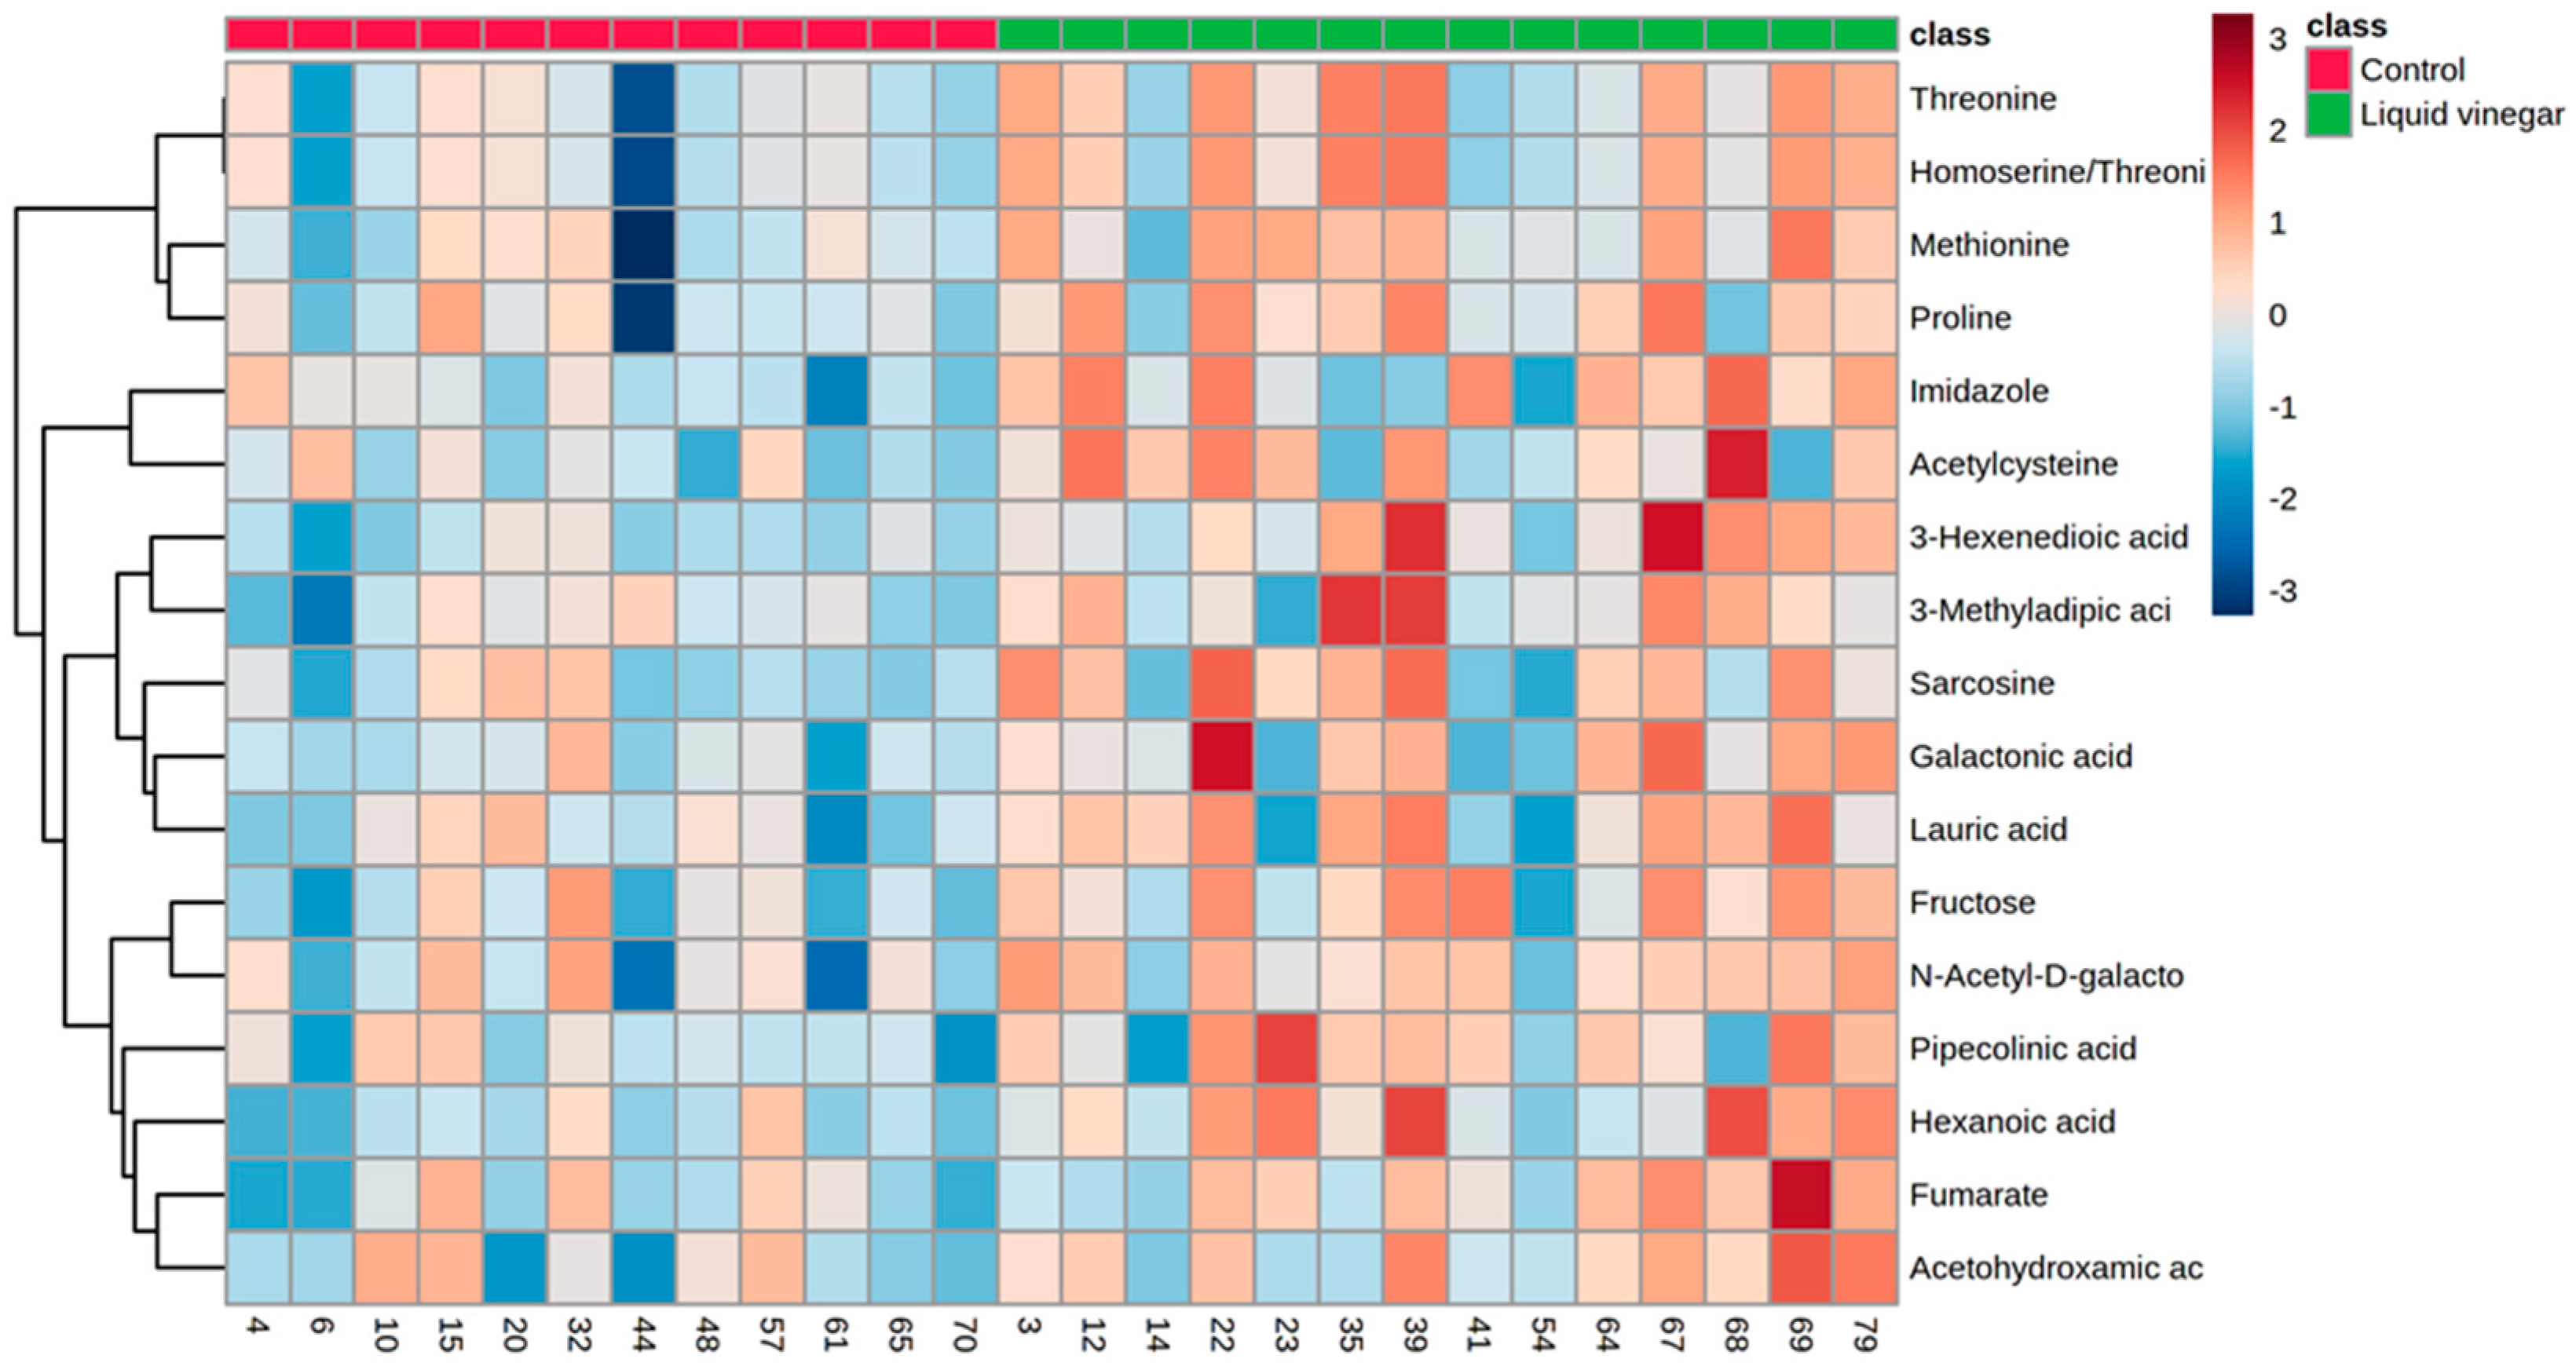
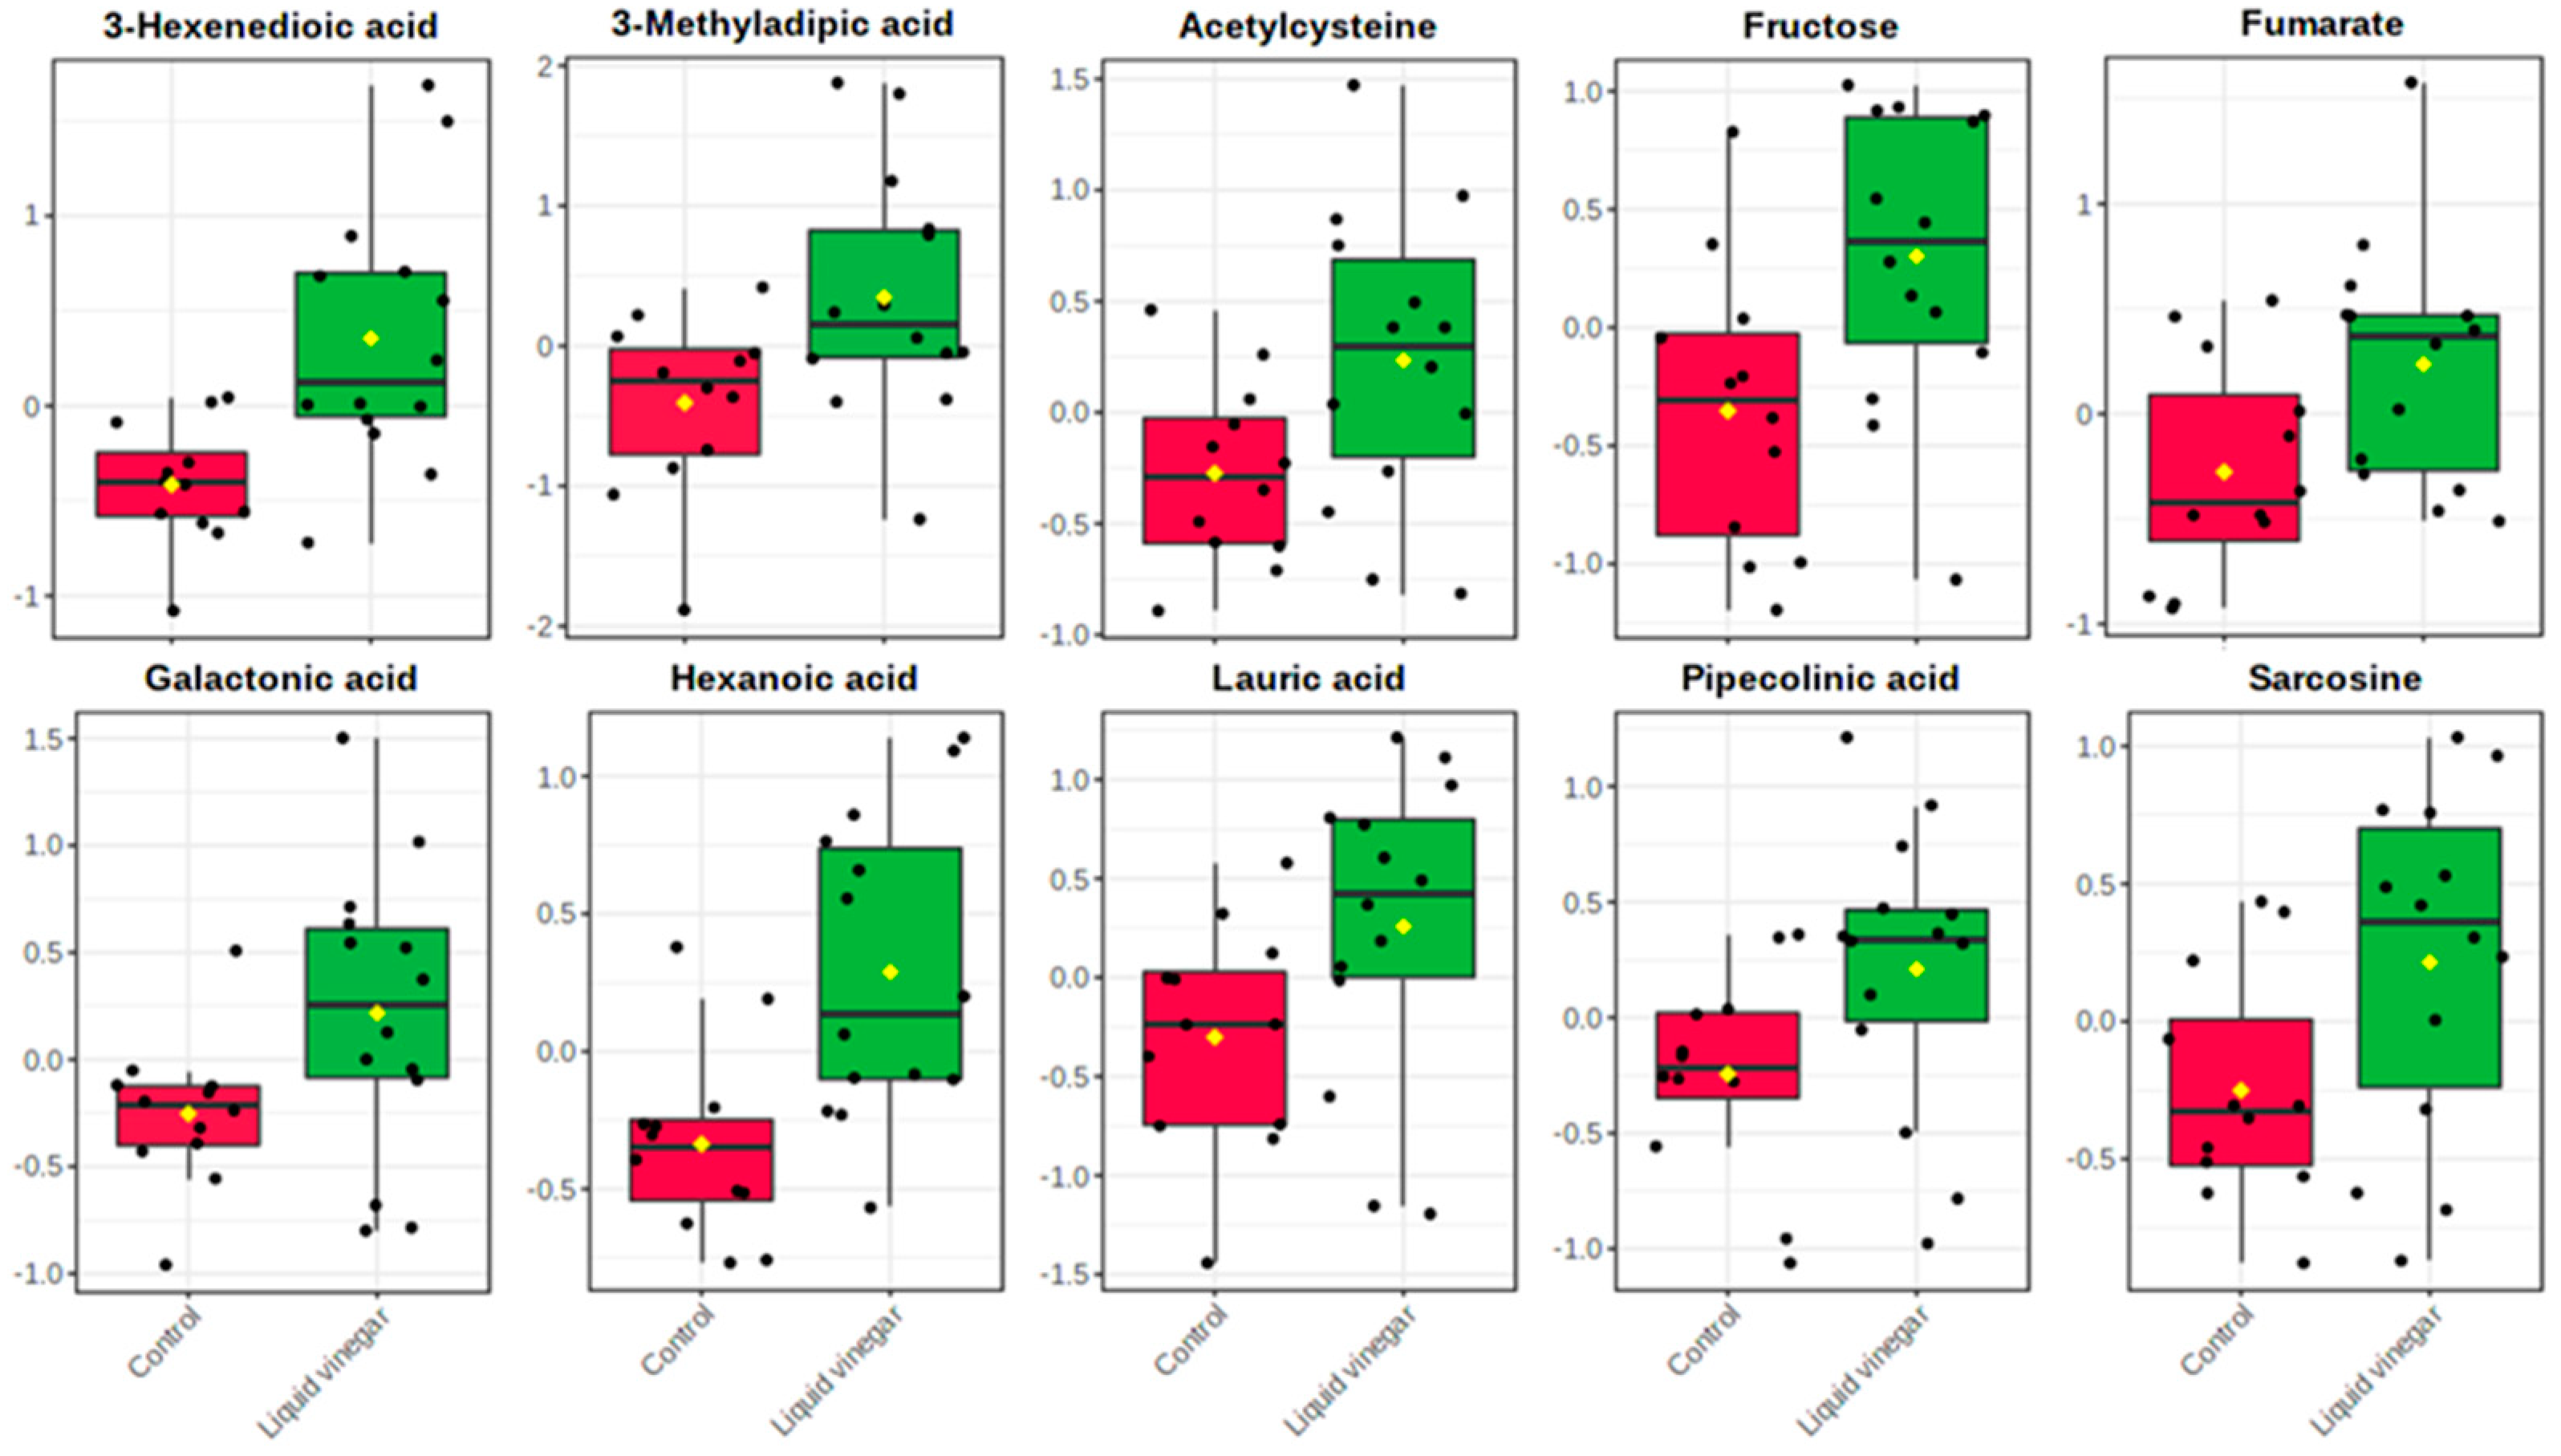
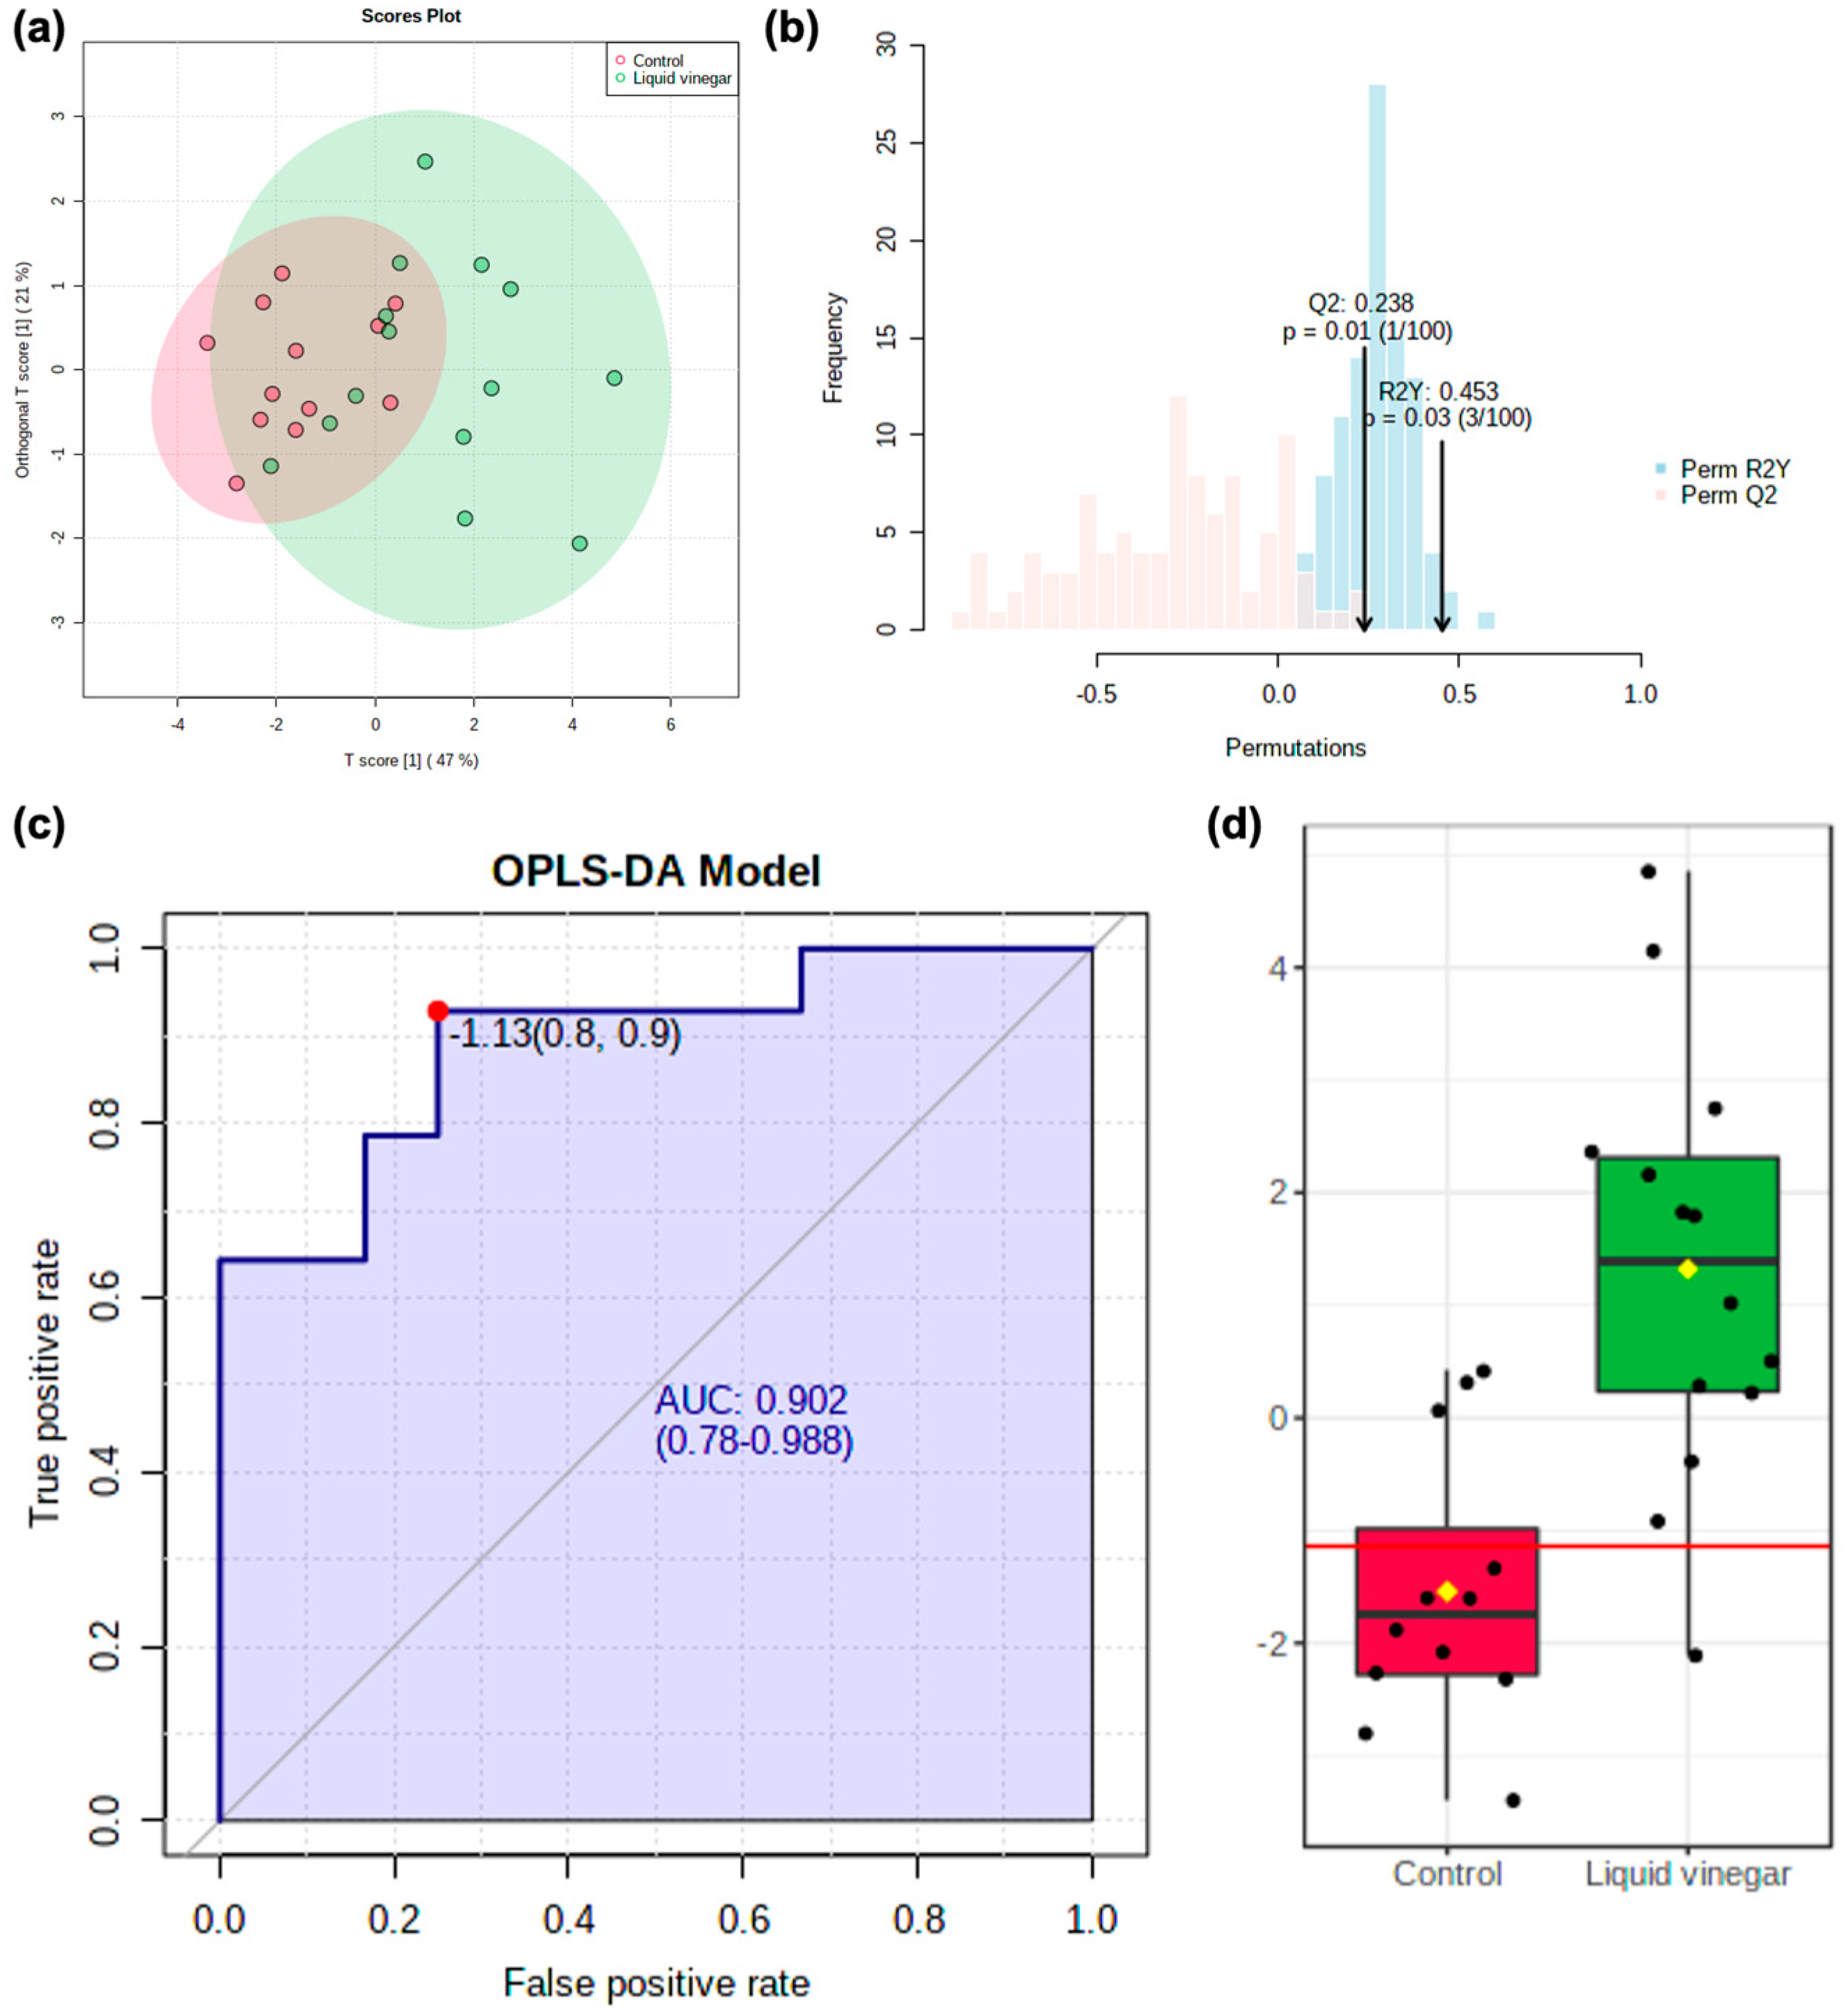
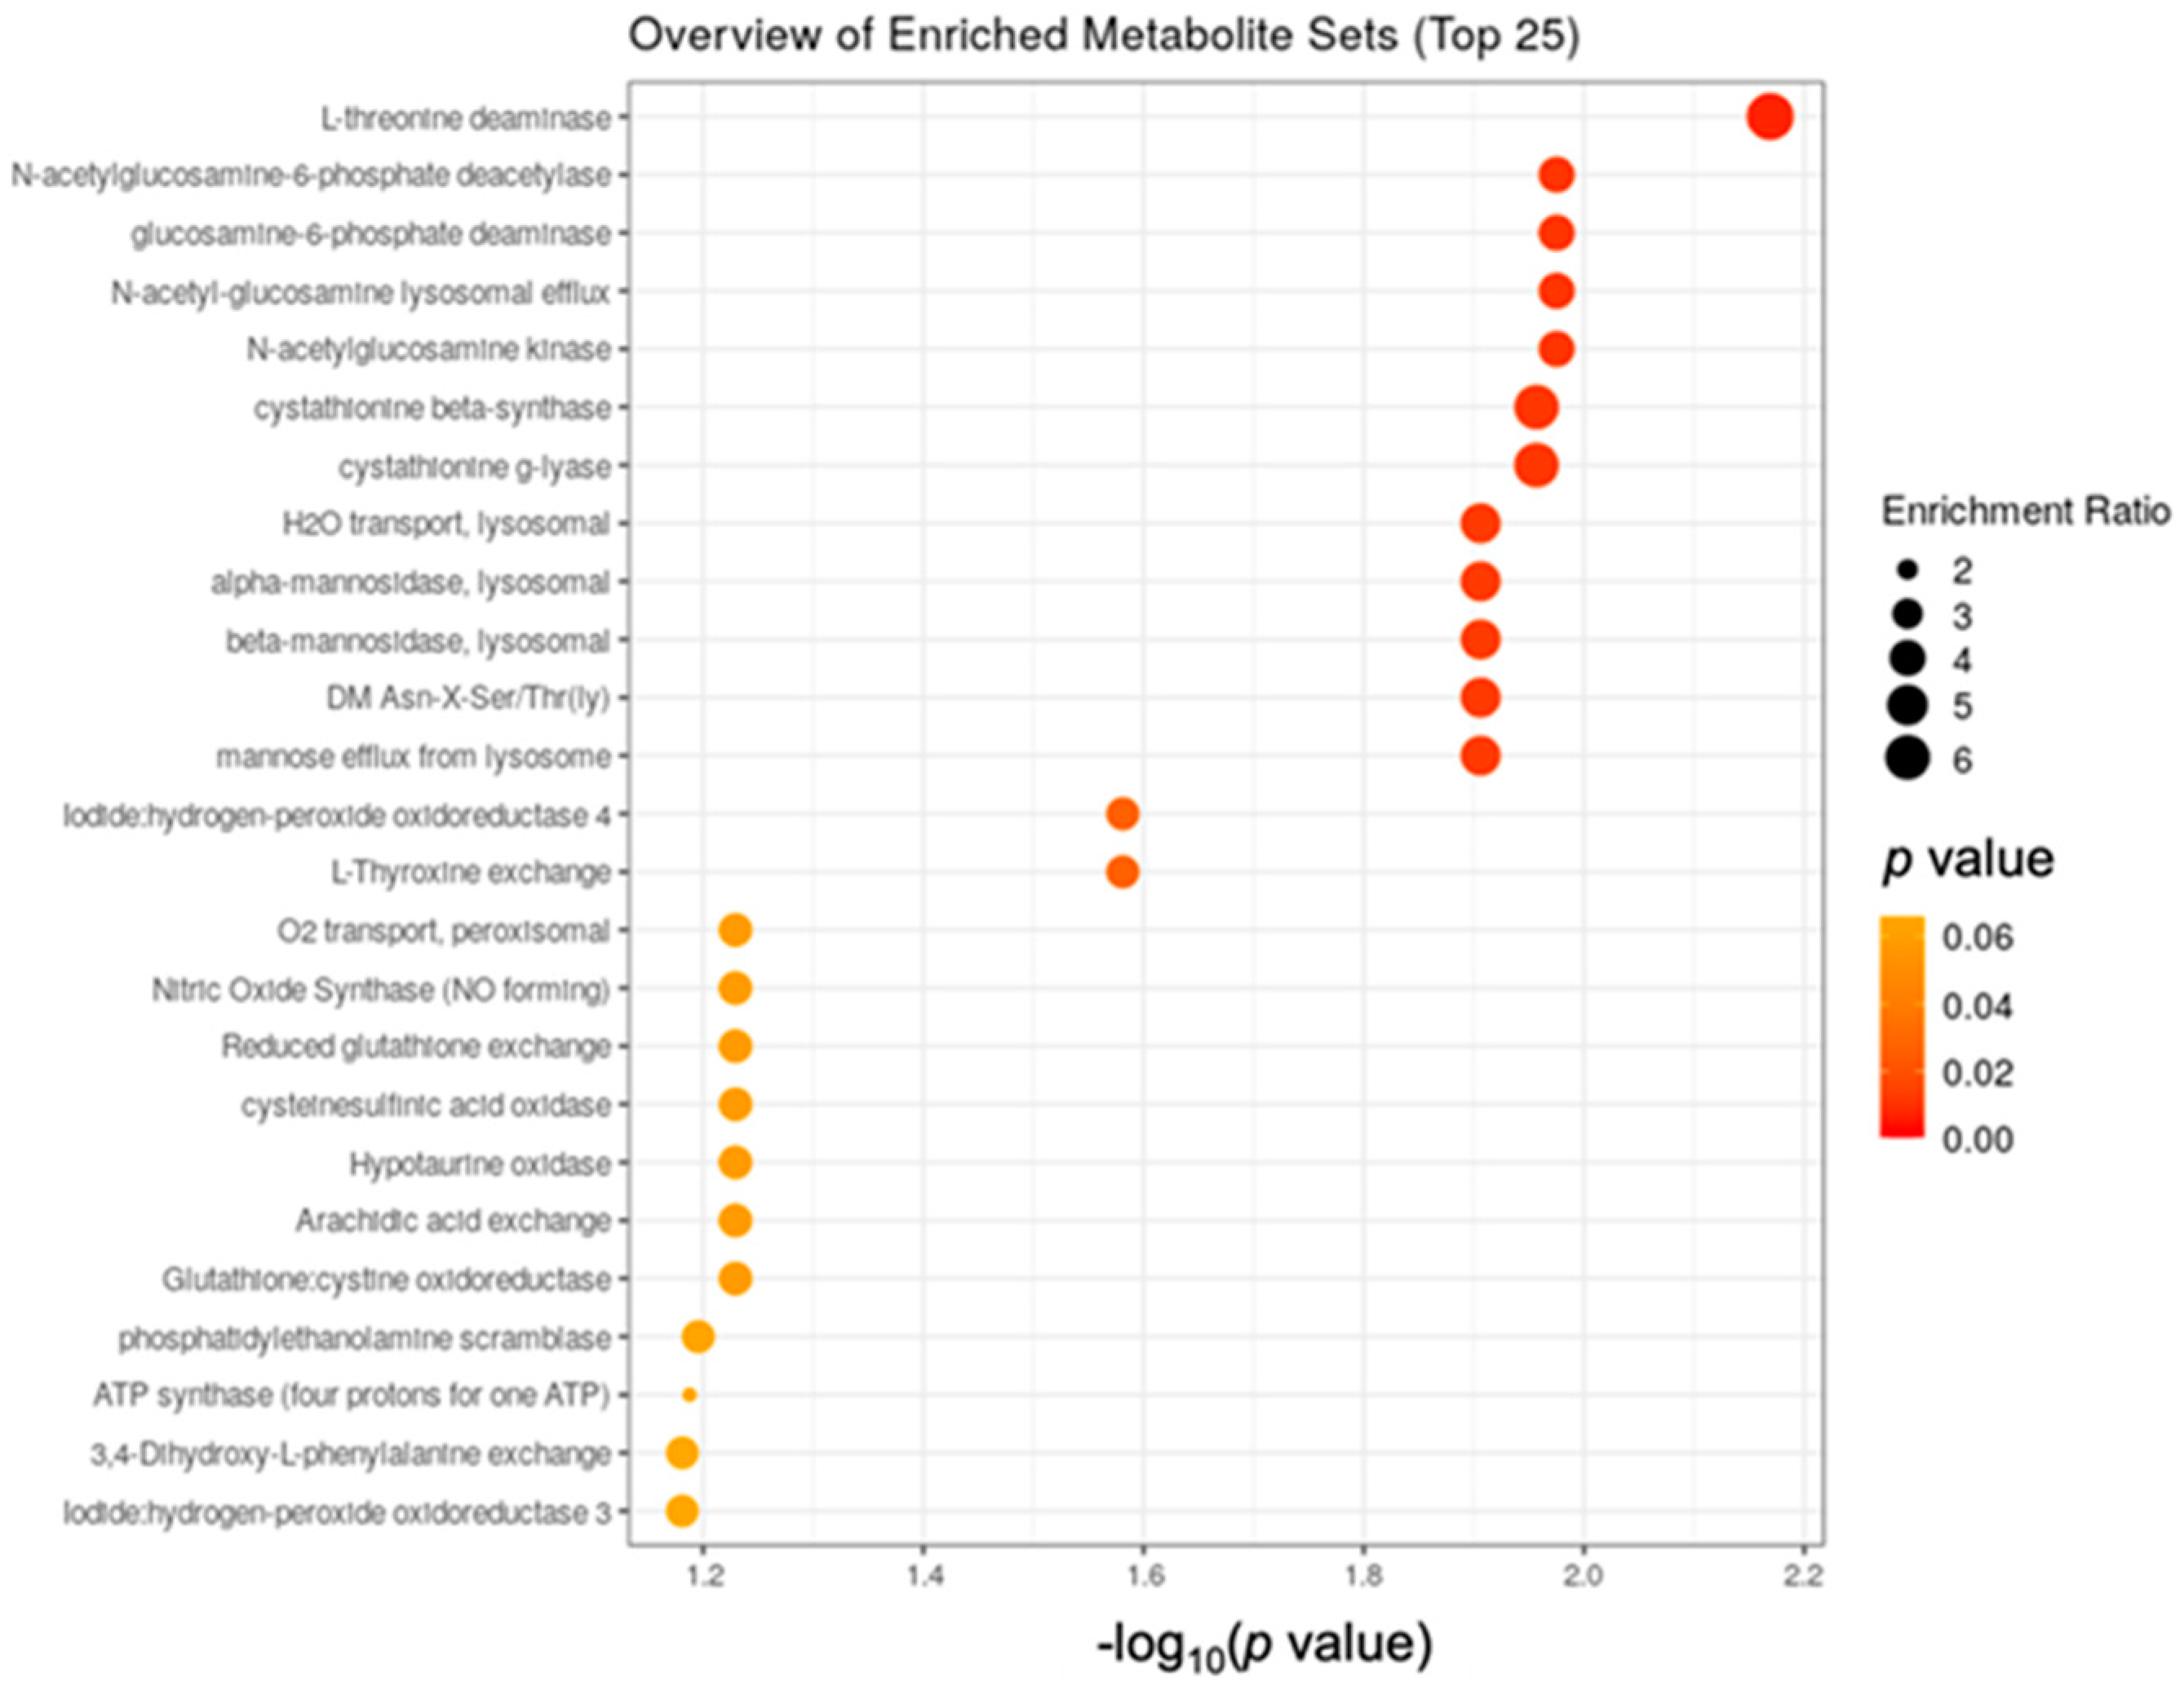
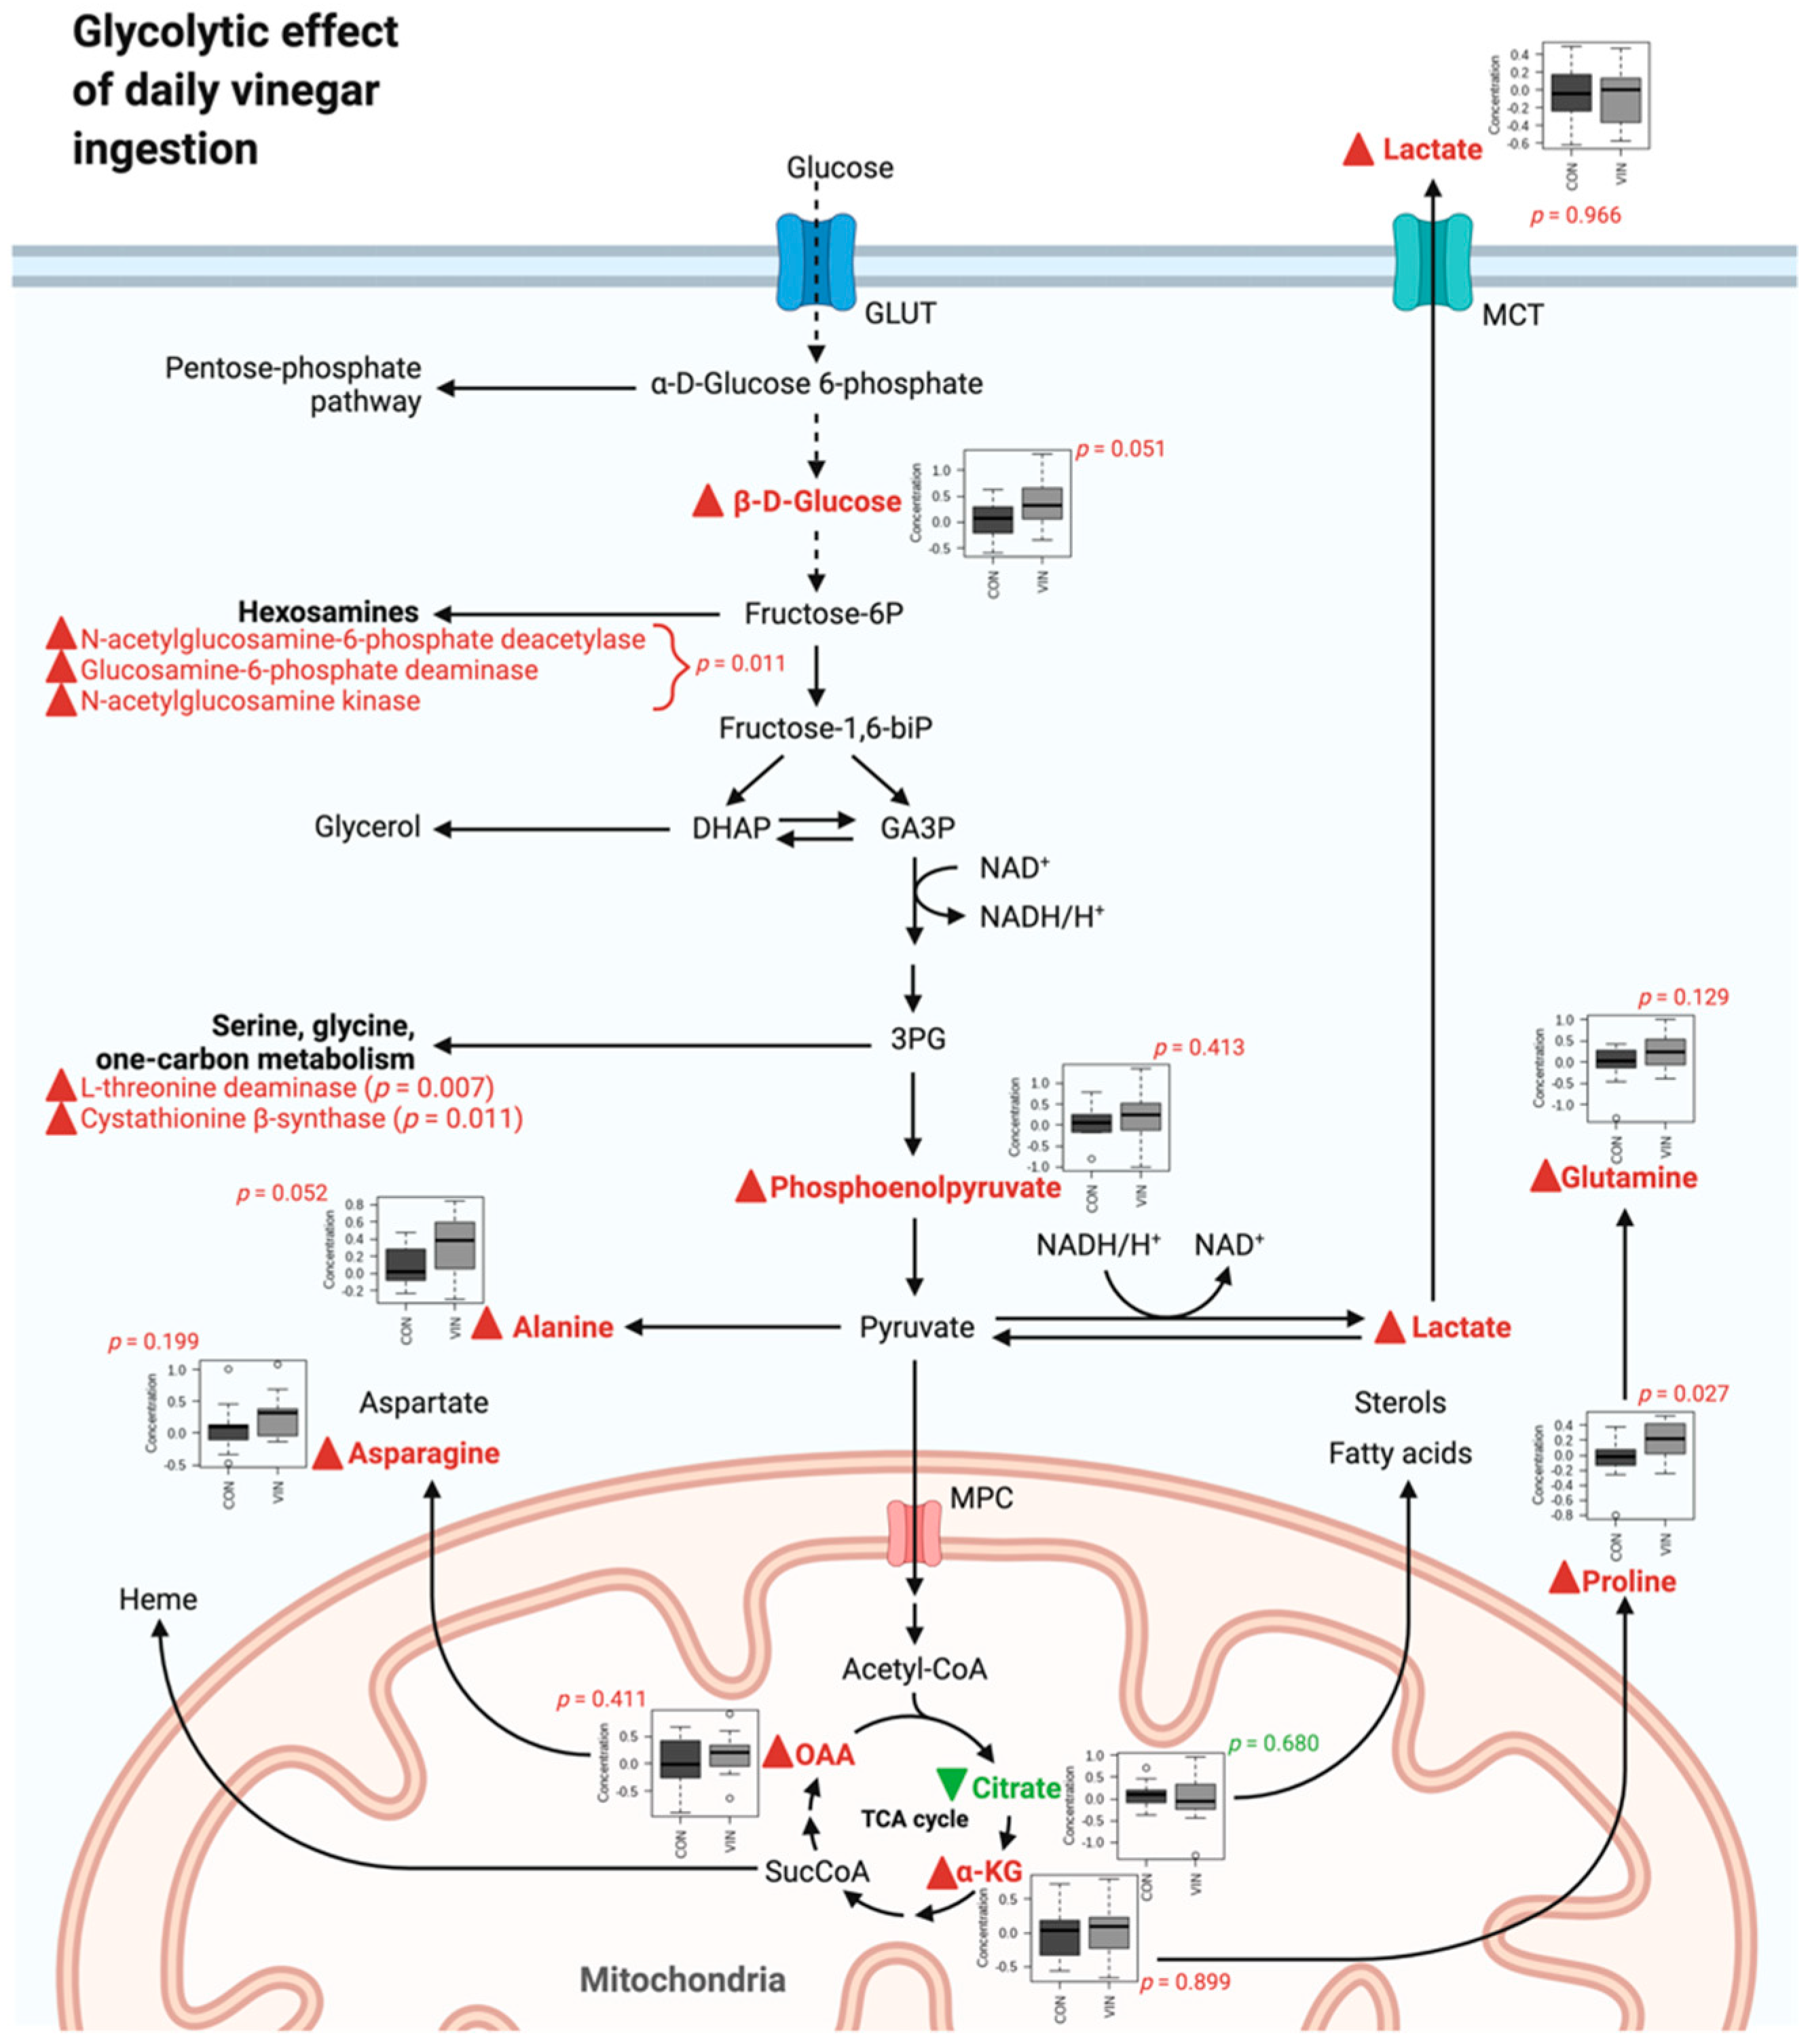
3.2. Metabolomics Data
4. Discussion
Supplementary Materials
Author Contributions
Funding
Institutional Review Board Statement
Informed Consent Statement
Data Availability Statement
Conflicts of Interest
References
- Valdes, D.S.; So, D.; Gill, P.A.; Kellow, N.J. Effect of Dietary Acetic Acid Supplementation on Plasma Glucose, Lipid Profiles, and Body Mass Index in Human Adults: A Systematic Review and Meta-analysis. J. Acad. Nutr. Diet. 2021, 121, 895–914, Correction in 2021, 121, 1402–1403. [Google Scholar] [CrossRef]
- Cheng, L.J.; Jiang, Y.; Wu, V.X.; Wang, W. A systematic review and meta-analysis: Vinegar consumption on glycaemic control in adults with type 2 diabetes mellitus. J. Adv. Nurs. 2020, 76, 459–474. [Google Scholar] [CrossRef] [PubMed]
- Johnston, C.S.; White, A.M.; Kent, S.M. Preliminary evidence that regular vinegar ingestion favorably influences hemoglobin A1c values in individuals with type 2 diabetes mellitus. Diabetes Res. Clin. Pract. 2009, 84, e15–e17. [Google Scholar] [CrossRef]
- Mitrou, P.; Petsiou, E.; Papakonstantinou, E.; Maratou, E.; Lambadiari, V.; Dimitriadis, P.; Spanoudi, F.; Raptis, S.A.; Dimitriadis, G. Vinegar Consumption Increases Insulin-Stimulated Glucose Uptake by the Forearm Muscle in Humans with Type 2 Diabetes. J. Diabetes Res. 2015, 2015, 175204. [Google Scholar] [CrossRef] [PubMed]
- Kondo, T.; Kishi, M.; Fushimi, T.; Ugajin, S.; Kaga, T. Vinegar intake reduces body weight, body fat mass, and serum triglyceride levels in obese Japanese subjects. Biosci. Biotechnol. Biochem. 2009, 73, 1837–1843. [Google Scholar] [CrossRef] [PubMed]
- Caligiani, A.; Acquotti, D.; Palla, G.; Bocchi, V. Identification and quantification of the main organic components of vinegars by high resolution 1H NMR spectroscopy. Anal. Chim. Acta 2007, 585, 110–119. [Google Scholar] [CrossRef] [PubMed]
- Ogawa, N.; Satsu, H.; Watanabe, H.; Fukaya, M.; Tsukamoto, Y.; Miyamoto, Y.; Shimizu, M. Acetic acid suppresses the increase in disaccharidase activity that occurs during culture of caco-2 cells. J. Nutr. 2000, 130, 507–513. [Google Scholar] [CrossRef]
- Mitrou, P.; Petsiou, E.; Papakonstantinou, E.; Maratou, E.; Lambadiari, V.; Dimitriadis, P.; Spanoudi, F.; Raptis, S.A.; Dimitriadis, G. The role of acetic acid on glucose uptake and blood flow rates in the skeletal muscle in humans with impaired glucose tolerance. Eur. J. Clin. Nutr. 2015, 69, 734–739. [Google Scholar] [CrossRef]
- Yuan, R.; Sun, G.; Gao, J.; Yu, Z.; Wang, C.; Sun, J.; Li, H.; Chen, J. Schisandra Fruit Vinegar Lowers Lipid Profile in High-Fat Diet Rats. Evid Based Complement Alternat. Med. 2020, 2020, 7083415. [Google Scholar] [CrossRef]
- Li, G.; Tan, X.; Zhang, B.; Guan, L.; Zhang, Y.; Yin, L.; Gao, M.; Zhu, S.; Xu, L. Hengshun Aromatic Vinegar Improves Glycolipid Metabolism in Type 2 Diabetes Mellitus via Regulating PGC-1α/PGC-1β Pathway. Front. Pharmacol. 2021, 12, 641829. [Google Scholar] [CrossRef]
- Jasbi, P.; Baker, O.; Shi, X.; Gonzales, L.A.; Wang, S.; Anderson, S.; Xi, B.; Gu, H.; Johnston, C.S. Daily red wine vinegar ingestion for eight weeks improves glucose homeostasis and affects the metabolome but does not reduce adiposity in adults. Food Funct. 2019, 10, 7343–7355. [Google Scholar] [CrossRef]
- Brain, J.D.; Hsu, Y.H.; Vasanthakumar, A.; Kim, J.; Mitchell, R.; Chang-Sheng, M.; Iinomi, M.; Akatsuka, K.; Molina, R.M. Effects of a vinegar-based multi-micronutrient supplement in rats: A multi-pronged assessment of dietary impact. J. Funct. Foods 2018, 42, 371–378. [Google Scholar] [CrossRef] [PubMed]
- Ferrari, R.; Pugini, S.M.; Arce, A.I.; Costa, E.J.; de Melo, M.P. Metabolite of tryptophan promoting changes in EEG signal and the oxidative status of the brain. Cell Biochem. Funct. 2014, 32, 496–501. [Google Scholar] [CrossRef]
- Ji, Y.; Yin, W.; Liang, Y.; Sun, L.; Yin, Y.; Zhang, W. Anti-Inflammatory and Anti-Oxidative Activity of Indole-3-Acetic Acid Involves Induction of HO-1 and Neutralization of Free Radicals in RAW264.7 Cells. Int. J. Mol Sci. 2020, 21, 1579. [Google Scholar] [CrossRef]
- Höglund, E.; Øverli, Ø.; Winberg, S. Tryptophan Metabolic Pathways and Brain Serotonergic Activity: A Comparative Review. Front. Endocrinol. 2019, 10, 158. [Google Scholar] [CrossRef] [PubMed]
- Zheng, H.; Xu, P.; Jiang, Q.; Xu, Q.; Zheng, Y.; Yan, J.; Ji, H.; Ning, J.; Zhang, X.; Li, C.; et al. Depletion of acetate-producing bacteria from the gut microbiota facilitates cognitive impairment through the gut-brain neural mechanism in diabetic mice. Microbiome 2021, 9, 145. [Google Scholar] [CrossRef] [PubMed]
- Opie, R.S.; O’Neil, A.; Jacka, F.N.; Pizzinga, J.; Itsiopoulos, C. A modified Mediterranean dietary intervention for adults with major depression: Dietary protocol and feasibility data from the SMILES trial. Nutr. Neurosci. 2018, 21, 487–501. [Google Scholar] [CrossRef]
- Feise, N.K.; Johnston, C.S. Commercial Vinegar Tablets Do Not Display the Same Physiological Benefits for Managing Postprandial Glucose Concentrations as Liquid Vinegar. J. Nutr. Metab. 2020, 2020, 9098739. [Google Scholar] [CrossRef]
- McNair, D.M.; Lorr, M.; Droppleman, L.F. EdITS Manual for the Profile of Mood States, Revised; EdITS/Educational and Industrial Testing Service: San Diego, CA, USA, 1992. [Google Scholar]
- Radloff, L.S. The CES-D Scale: A Self-Report Depression Scale for Research in the General Population. Appl. Psychol. Meas. 1977, 1, 385–401. [Google Scholar] [CrossRef]
- Wallace, M.K.; Jeanblanc, A.B.; Musil, C.M. Incidental findings: A practical protocol for reporting elevated depressive symptoms in behavioral health research. Arch. Psychiatr. Nurs. 2020, 34, 6–99. [Google Scholar] [CrossRef]
- Wang, X.; Gu, H.; Palma-Duran, S.A.; Fierro, A.; Jasbi, P.; Shi, X.; Bresette, W.; Tasevska, N. Influence of Storage Conditions and Preservatives on Metabolite Fingerprints in Urine. Metabolites 2019, 9, 203. [Google Scholar] [CrossRef]
- Jasbi, P.; Mitchell, N.M.; Shi, X.; Grys, T.E.; Wei, Y.; Liu, L.; Lake, D.F.; Gu, D. Coccidioidomycosis Detection Using Targeted Plasma and Urine Metabolic Profiling. J. Proteome. Res. 2019, 18, 2791–2802. [Google Scholar] [CrossRef] [PubMed]
- Jasbi, P.; Shi, X.; Chu, P.; Elliott, N.; Hudson, H.; Jones, D.; Serrano, G.; Chow, B.; Beach, T.G.; Liu, L.; et al. Metabolic Profiling of Neocortical Tissue Discriminates Alzheimer’s Disease from Mild Cognitive Impairment, High Pathology Controls, and Normal Controls. J. Proteome Res. 2021, 20, 4303–4317. [Google Scholar] [CrossRef] [PubMed]
- Parillo, M.; Riccardi, G.; Pacioni, D.; Iovine, C.; Contaldo, F.; Isernia, A.C.; De Marco, F.; Oerrotti, N.; Rivellese, A. Metabolic consequences of feeding a high-carbohydrate, high-fiber diet to diabetic patients with chronic kidney failure. Am. J. Clin. Nutr. 1988, 48, 255–259. [Google Scholar] [CrossRef] [PubMed]
- Remer, T.; Pietrzik, K.; Manz, F. The short-term effect of dietary pectin on plasma levels and renal excretion of dehydroepiandrosterone sulfate. Z. Ernahrungswiss. 1996, 35, 32–38. [Google Scholar] [CrossRef]
- Adedeji, A.O.; Pourmohamad, T.; Chen, Y.; Burkey, J.; Betts, C.J.; Bickerton, S.J.; Sonee, M.; McDuffie, J.E. Investigating the Value of Urine Volume, Creatinine, and Cystatin C for Urinary Biomarkers Normalization for Drug Development Studies. Int. J. Toxicol. 2019, 38, 12–22. [Google Scholar] [CrossRef]
- Pang, Z.; Chong, J.; Zhou, G.; de Lima Morais, D.A.; Chang, L.; Barrette, M.; Gauthier, C.; Jacques, P.-É.; Li, S.; Xia, J. MetaboAnalyst 5.0: Narrowing the gap between raw spectra and functional insights. Nucleic Acids Res. 2021, 49, W388–W396. [Google Scholar] [CrossRef]
- Sugiyama, S.; Fushimi, T.; Kishi, M.; Irie, S.; Tsuji, S.; Hosokawa, N.; Kaga, T. Bioavailability of acetate from two vinegar supplements: Capsule and drink. J. Nutr. Sci. Vitaminol. 2010, 56, 266–269. [Google Scholar] [CrossRef][Green Version]
- Shi, L.; Tu, B.P. Acetyl-CoA and the regulation of metabolism: Mechanisms and consequences. Curr. Opin. Cell Biol. 2015, 33, 125–131. [Google Scholar] [CrossRef] [PubMed]
- Xie, T.; Jin, F.; Jia, X.; Mao, H.; Xu, Y.; Zhang, S. High cellulose diet promotes intestinal motility through regulating intestinal immune homeostasis and serotonin biosynthesis. Biol. Chem. 2021, 000010151520210216. [Google Scholar] [CrossRef]
- Wells, L.; Vosseller, K.; Hart, G.W. Glycosylation of nucleocytoplasmic proteins: Signal transduction and O-GlcNAc. Science 2001, 291, 2376–2378. [Google Scholar] [CrossRef] [PubMed]
- Zachara, N.E. Critical observations that shaped our understanding of the function(s) of intracellular glycosylation (O-GlcNAc). FEBS Lett. 2018, 592, 3950–3975. [Google Scholar] [CrossRef] [PubMed]
- Sharma, V.; Freeze, H.H. Mannose efflux from the cells: A potential source of mannose in blood. J. Biol. Chem. 2011, 286, 10193–10200. [Google Scholar] [CrossRef] [PubMed]
- Teo, C.F.; Wollaston-Hayden, E.E.; Wells, L. Hexosamine flux, the O-GlcNAc modification, and the development of insulin resistance in adipocytes. Mol. Cell. Endocrinol. 2010, 318, 44–53. [Google Scholar] [CrossRef]
- Stewart, L.T.; Abiraman, K.; Chatham, J.C.; McMahon, L.L. Increased O-GlcNAcylation rapidly decreases GABAAR currents in hippocampus but depresses neuronal output. Sci. Rep. 2020, 10, 7494. [Google Scholar] [CrossRef] [PubMed]
- Hwang, H.; Rhim, H. Acutely elevated O-GlcNAcylation suppresses hippocampal activity by modulating both intrinsic and synaptic excitability factors. Sci. Rep. 2019, 9, 7287. [Google Scholar] [CrossRef]
- Murtas, G.; Marcone, G.L.; Sacchi, S.; Pollegioni, L. L-serine synthesis via the phosphorylated pathway in humans. Cell Mol. Life Sci. 2020, 77, 5131–5148. [Google Scholar] [CrossRef]
- Furuya, S.; Tabata, T.; Mitoma, J.; Yamada, K.; Yamasak, M.; Makino, A.; Yamamoto, T.; Watanabe, M.; Kano, M.; Hirabayashi, Y. L-serine and glycine serve as major astroglia-derived trophic factors for cerebellar Purkinje neurons. Proc. Natl. Acad. Sci. USA 2000, 97, 11528–11533. [Google Scholar] [CrossRef]
- Hirabayashi, Y.; Furuya, S. Roles of l-serine and sphingolipid synthesis in brain development and neuronal survival. Prog. Lipid Res. 2008, 47, 188–203. [Google Scholar] [CrossRef]
- Jun, B.K.; Chandra, A.; Kuljis, D.; Schmidt, B.P.; Eichler, F.S. Substrate Availability of Mutant SPT Alters Neuronal Branching and Growth Cone Dynamics in Dorsal Root Ganglia. J. Neurosci. 2015, 35, 13713–13719. [Google Scholar] [CrossRef]
- Liu, Q.; Tang, G.Y.; Zhao, C.N.; Gan, R.Y.; Li, H.B. Antioxidant Activities, Phenolic Profiles, and Organic Acid Contents of Fruit Vinegars. Antioxidants 2019, 8, 78. [Google Scholar] [CrossRef] [PubMed]
- Natera, R.; Castro, R.; de Valme García-Moreno, M.; Hernández, M.J.; García-Barroso, C. Chemometric studies of vinegars from different raw materials and processes of production. J. Agric. Food Chem. 2003, 51, 3345–3351. [Google Scholar] [CrossRef]
- Arvaniti, O.S.; Mitsonis, P.; Siorokos, I.; Dermishaj, E.; Samaras, Y. The physicochemical properties and antioxidant capacities of commercial and homemade Greek vinegars. Acta Sci. Pol. Technol. Aliment. 2019, 18, 225–234. [Google Scholar] [PubMed]
- Gostner, J.M.; Geisler, S.; Stonig, M.; Mair, L.; Sperner-Unterweger, B.; Fuchs, D. Tryptophan Metabolism and Related Pathways in Psychoneuroimmunology: The Impact of Nutrition and Lifestyle. Neuropsychobiology 2020, 79, 89–99. [Google Scholar] [CrossRef] [PubMed]
- Jacobs, D.M.; Fuhrmann, J.C.; van Dorsten, F.A.; Rein, D.; Peters, S.; van Velzen, E.J.J.; Hollebrands, B.; Draijer, R.; van Duynhoven, J.; Garczarek, U. Impact of short-term intake of red wine and grape polyphenol extract on the human metabolome. J. Agric. Food Chem. 2012, 60, 3078–3085. [Google Scholar] [CrossRef]
- McDougall, G.J.; Stewart, D. The inhibitory effects of berry polyphenols on digestive enzymes. Biofactors 2005, 23, 189–195. [Google Scholar] [CrossRef]
- Duffy, M.E.; Twenge, J.M.; Joiner, T.E. Trends in Mood and Anxiety Symptoms and Suicide-Related Outcomes Among U.S. Undergraduates, 2007–2018: Evidence from Two National Surveys. J. Adolesc. Health 2019, 65, 590–598. [Google Scholar] [CrossRef]


| VIN | CON | p | |
|---|---|---|---|
| Age, year | 21.00 ± 2.18 | 19.55 ± 1.37 | 0.051 |
| Female/Male | 10/4 | 7/4 | 1.000 |
| Height, in | 65.96 ± 4.48 | 67.82 ± 3.06 | 0.183 |
| Weight, lbs. | 150.07 ± 23.92 | 147.55 ± 44.82 | 0.403 |
| BMI, kg/m2 | 24.17 ± 2.41 | 22.53 ± 6.59 | 0.066 |
| Pre | Post | Change | p | ||
|---|---|---|---|---|---|
| CES-D | VIN | 12.9 ± 6.4 | 8.5 ± 6.8 | −4.4 ± 4.0 | 0.002 |
| CON | 13.1 ± 6.9 | 16.2 ± 8.2 | 3.1 ± 6.9 | ||
| POMS | VIN | 67.8 ± 5.4 | 49.8 ± 4.3 | −18.0 ± 4.2 | 0.085 |
| CON | 68.9 ± 5.4 | 75.6 ± 10.4 | 6.6 ± 11.5 | ||
| Tension | VIN | 18.4 ± 1.0 | 13.6 ± 1.0 | −4.8 ± 1.2 | 0.134 |
| CON | 18.6 ± 1.8 | 19.4 ± 2.4 | 0.8 ± 2.4 | ||
| Anger | VIN | 18.6 ± 1.0 | 16.6 ± 1.0 | −2.0 ± 1.1 | 0.291 |
| CON | 16.9±1.2 | 18.2 ± 1.9 | 1.3 ± 2.4 | ||
| Fatigue | VIN | 16.0 ± 1.2 | 13.0 ± 1.2 | −3.0 ± 0.7 | 0.134 |
| CON | 15.9 ± 1.3 | 15.9 ± 1.9 | 0.0 ± 1.6 | ||
| Depression | VIN | 25.2 ± 1.9 | 20.1 ± 1.1 | −5.1 ± 1.2 | 0.006 |
| CON | 23.7 ± 2.3 | 26.6 ± 3.0 | 2.8 ± 2.6 | ||
| Vigor | VIN | 23.3 ± 1.2 | 25.6 ± 1.2 | 2.4 ± 1.0 | 0.051 |
| CON | 20.9 ± 1.9 | 19.6 ± 1.7 | −1.3 ± 2.9 | ||
| Confusion | VIN | 12.8 ± 1.0 | 12.1 ± 0.9 | −0.7 ± 0.8 | 0.403 |
| CON | 14.7 ± 1.3 | 15.2 ± 1.4 | 0.5 ± 1.6 |
Publisher’s Note: MDPI stays neutral with regard to jurisdictional claims in published maps and institutional affiliations. |
© 2021 by the authors. Licensee MDPI, Basel, Switzerland. This article is an open access article distributed under the terms and conditions of the Creative Commons Attribution (CC BY) license (https://creativecommons.org/licenses/by/4.0/).
Share and Cite
Johnston, C.S.; Jasbi, P.; Jin, Y.; Bauer, S.; Williams, S.; Fessler, S.N.; Gu, H. Daily Vinegar Ingestion Improves Depression Scores and Alters the Metabolome in Healthy Adults: A Randomized Controlled Trial. Nutrients 2021, 13, 4020. https://doi.org/10.3390/nu13114020
Johnston CS, Jasbi P, Jin Y, Bauer S, Williams S, Fessler SN, Gu H. Daily Vinegar Ingestion Improves Depression Scores and Alters the Metabolome in Healthy Adults: A Randomized Controlled Trial. Nutrients. 2021; 13(11):4020. https://doi.org/10.3390/nu13114020
Chicago/Turabian StyleJohnston, Carol S., Paniz Jasbi, Yan Jin, Shayna Bauer, Susanna Williams, Samantha N. Fessler, and Haiwei Gu. 2021. "Daily Vinegar Ingestion Improves Depression Scores and Alters the Metabolome in Healthy Adults: A Randomized Controlled Trial" Nutrients 13, no. 11: 4020. https://doi.org/10.3390/nu13114020
APA StyleJohnston, C. S., Jasbi, P., Jin, Y., Bauer, S., Williams, S., Fessler, S. N., & Gu, H. (2021). Daily Vinegar Ingestion Improves Depression Scores and Alters the Metabolome in Healthy Adults: A Randomized Controlled Trial. Nutrients, 13(11), 4020. https://doi.org/10.3390/nu13114020