
Anabolic Bone Stimulus Requires a Pre-Exercise Meal and 45-Minute Walking Impulse of Suprathreshold Speed-Enhanced Momentum to Prevent or Mitigate Postmenopausal Osteoporosis within Circadian Constraints


Abstract
:1. Introduction
- (1)
- A 20-min exercise impulse of suprathreshold walking-speed-enhanced momentum, performed an hour after a meal, will be as anabolic as a 40-min exercise impulse; and two 20-min exercise bouts spaced 7 h apart would double the anabolic response to a single one;
- (2)
- Anabolic outcome of early morning (08:00 h) exercise performed an hour after eating will be as effective as a mid-day (15:00 h) post-meal exercise;
- (3)
- 40-min exercise at 08:00 h and 20-min exercise at 08:00 and 15:00 h will be equally osteogenic whether performed uphill or downhill.
2. Materials and Methods
2.1. Subjects
2.2. General Experimental Protocol
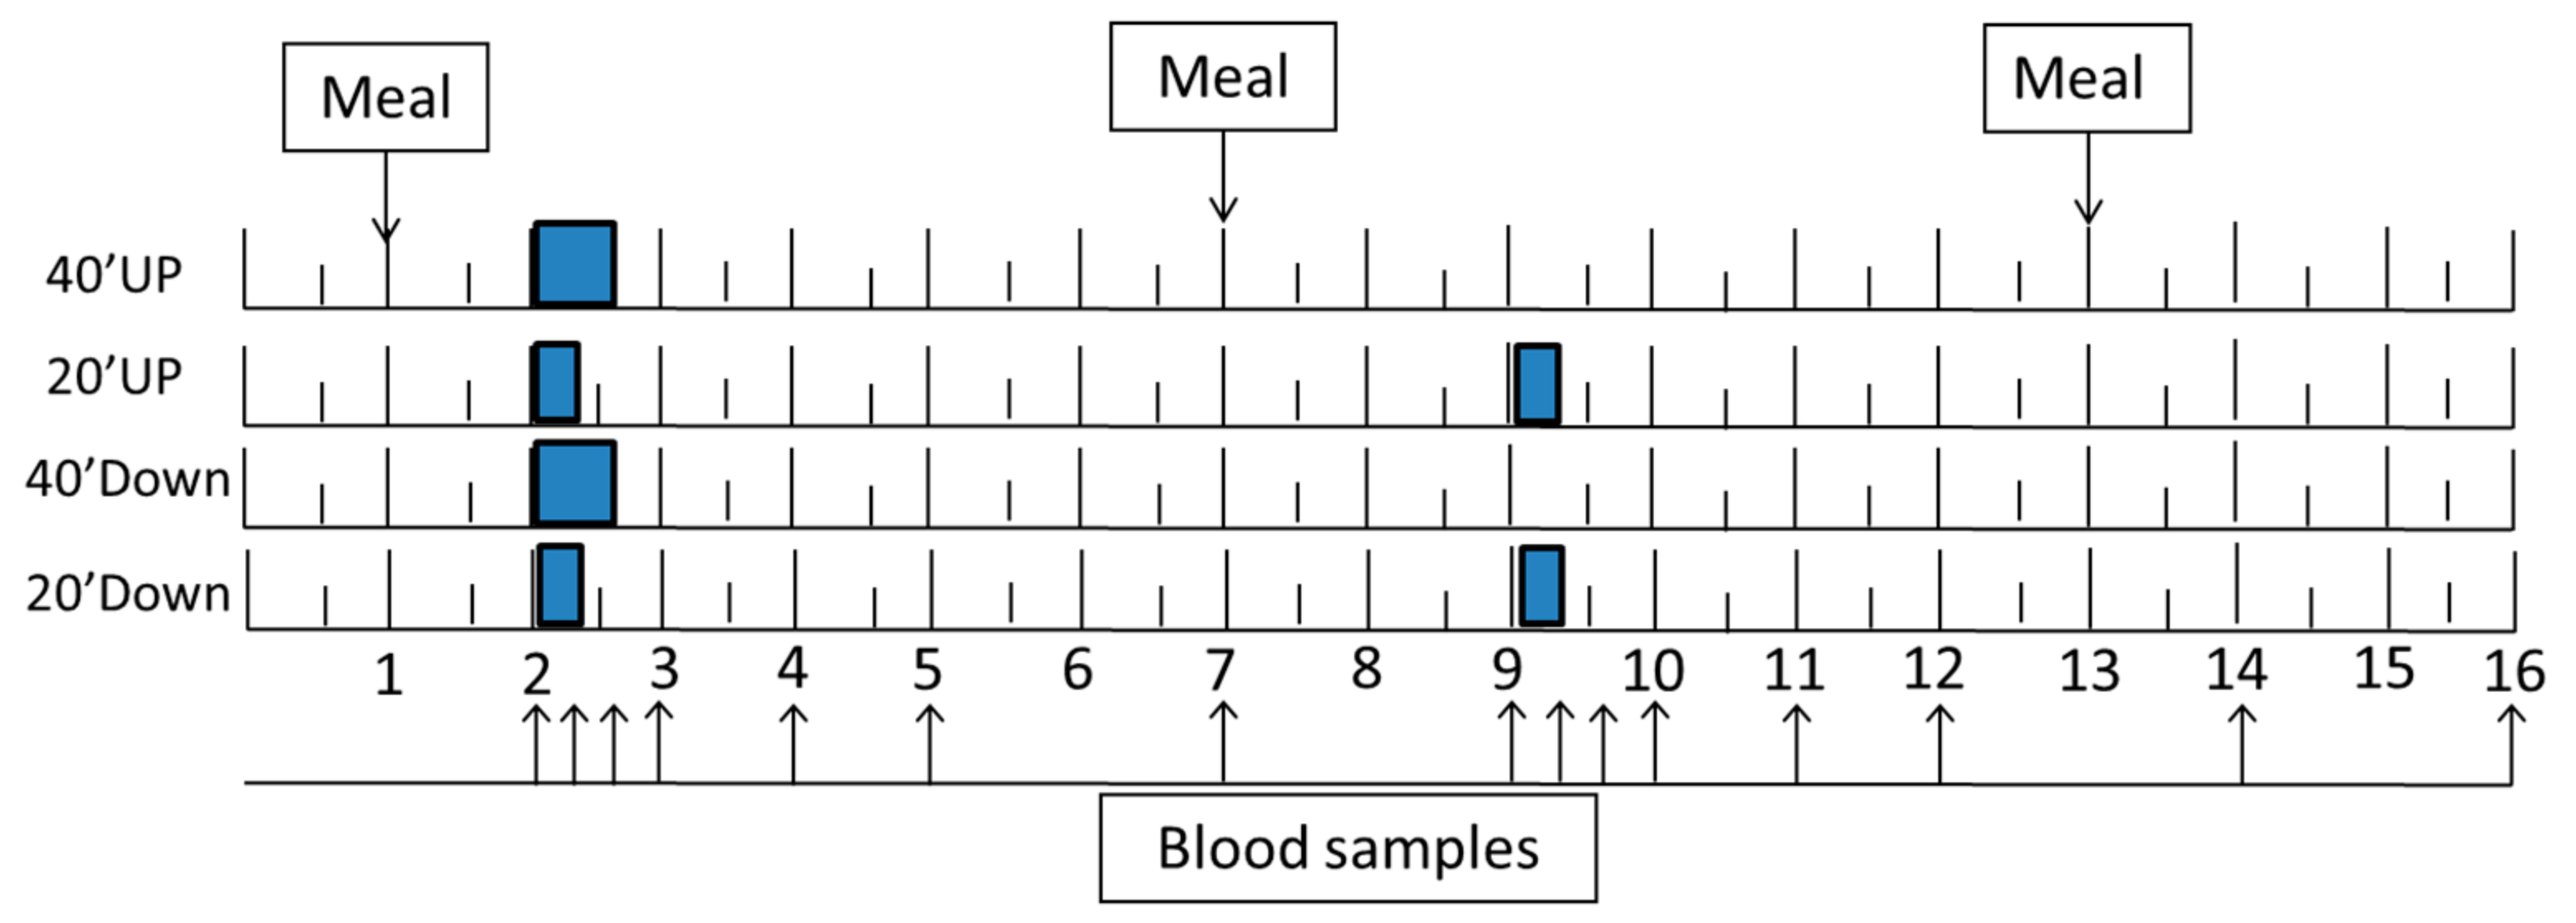
2.3. Study Design
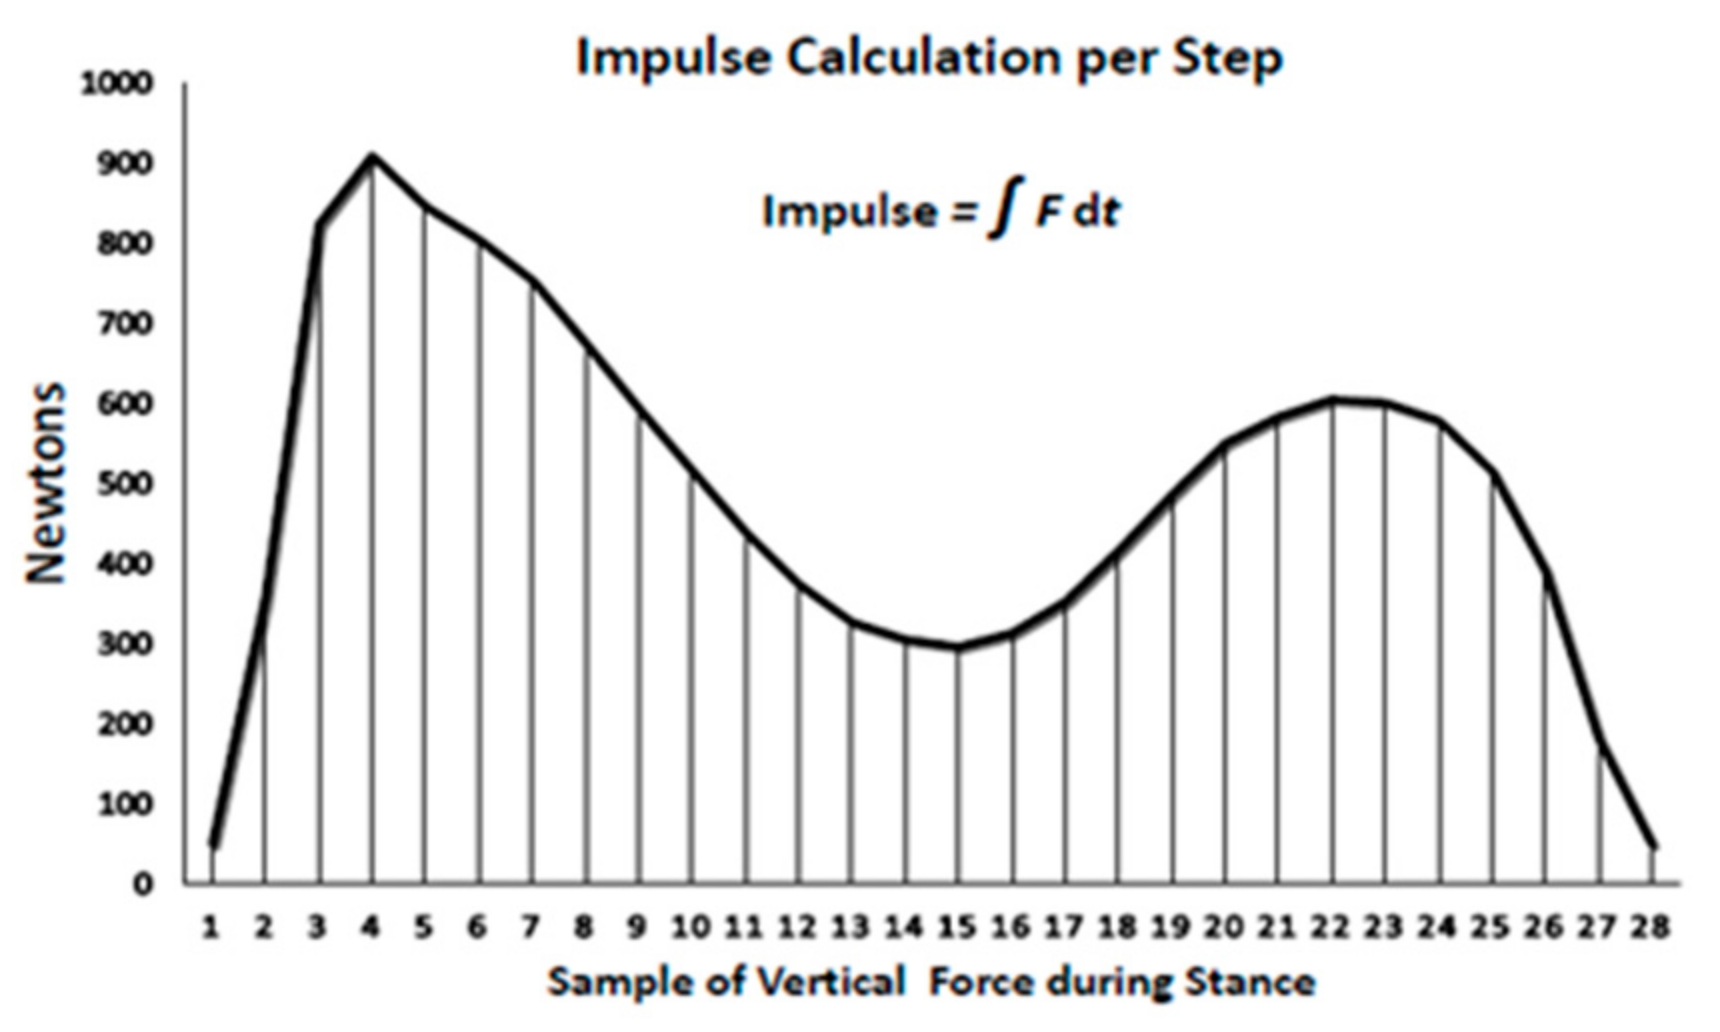
2.4. GRF Manipulation and Measurements
2.5. Exercise Intensity
2.6. Meals
2.7. DXA Measurements
2.8. Blood Collection
2.9. Markers of Bone Formation and Resorption
2.10. Hormone and Calcium Measurements and Endocrine and Circadian Considerations
2.11. Statistical Analyses and Calculations of Mechanical Loading
3. Results
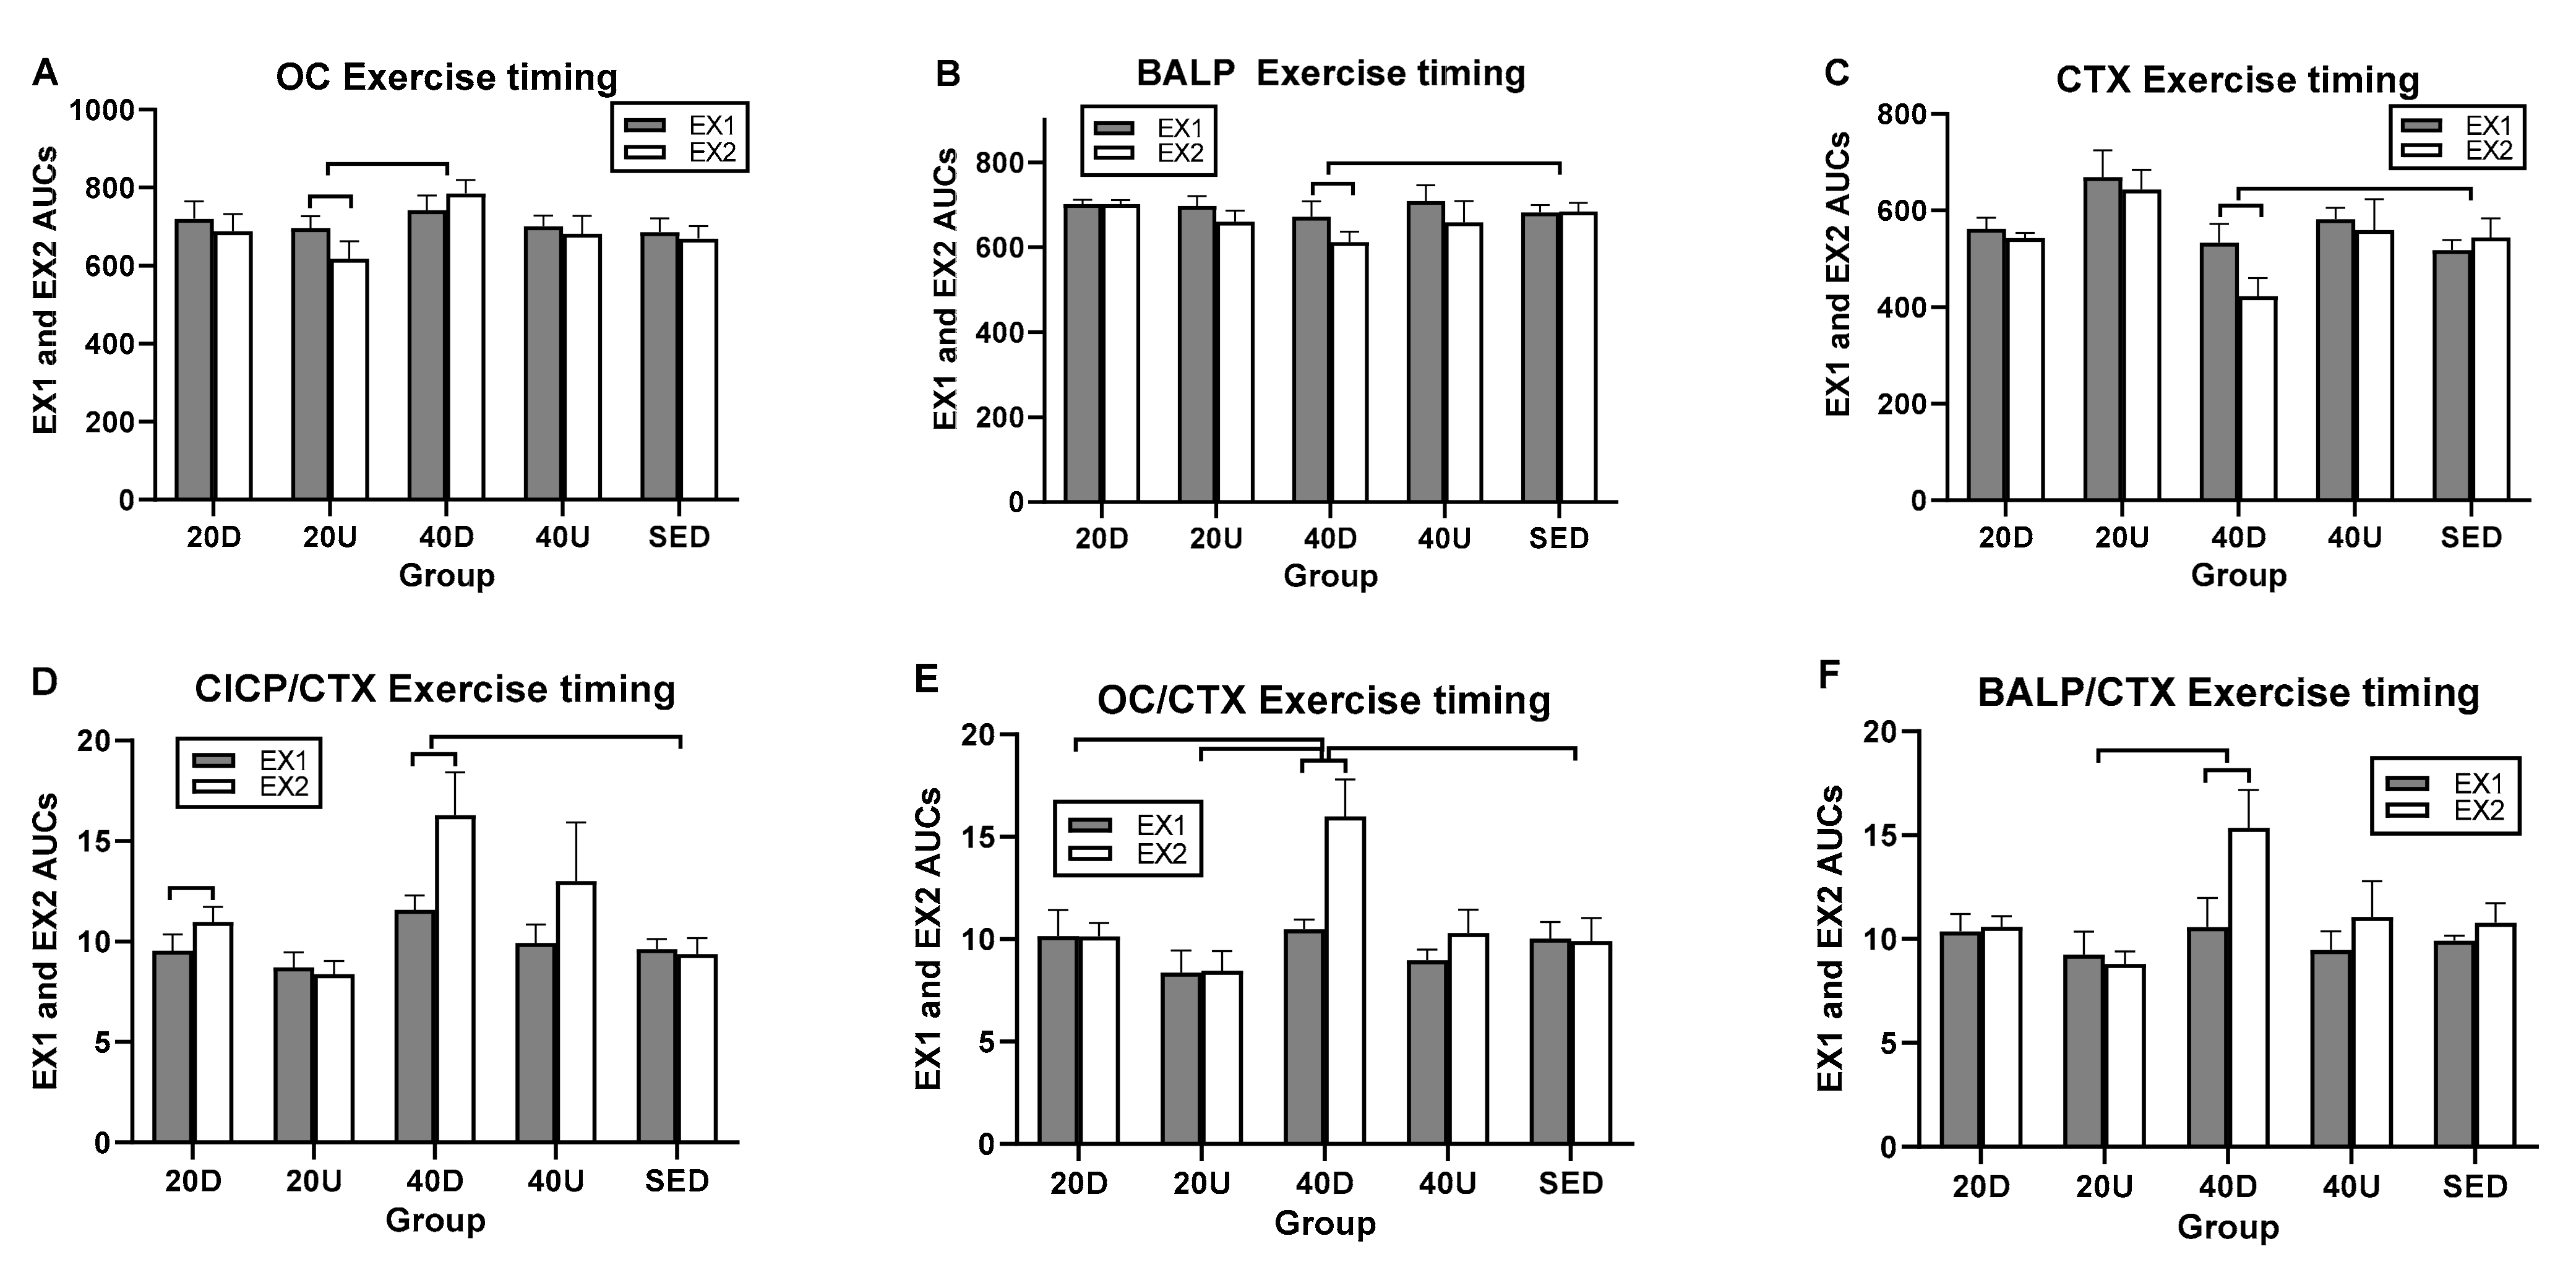
3.1. Exercise Outcome
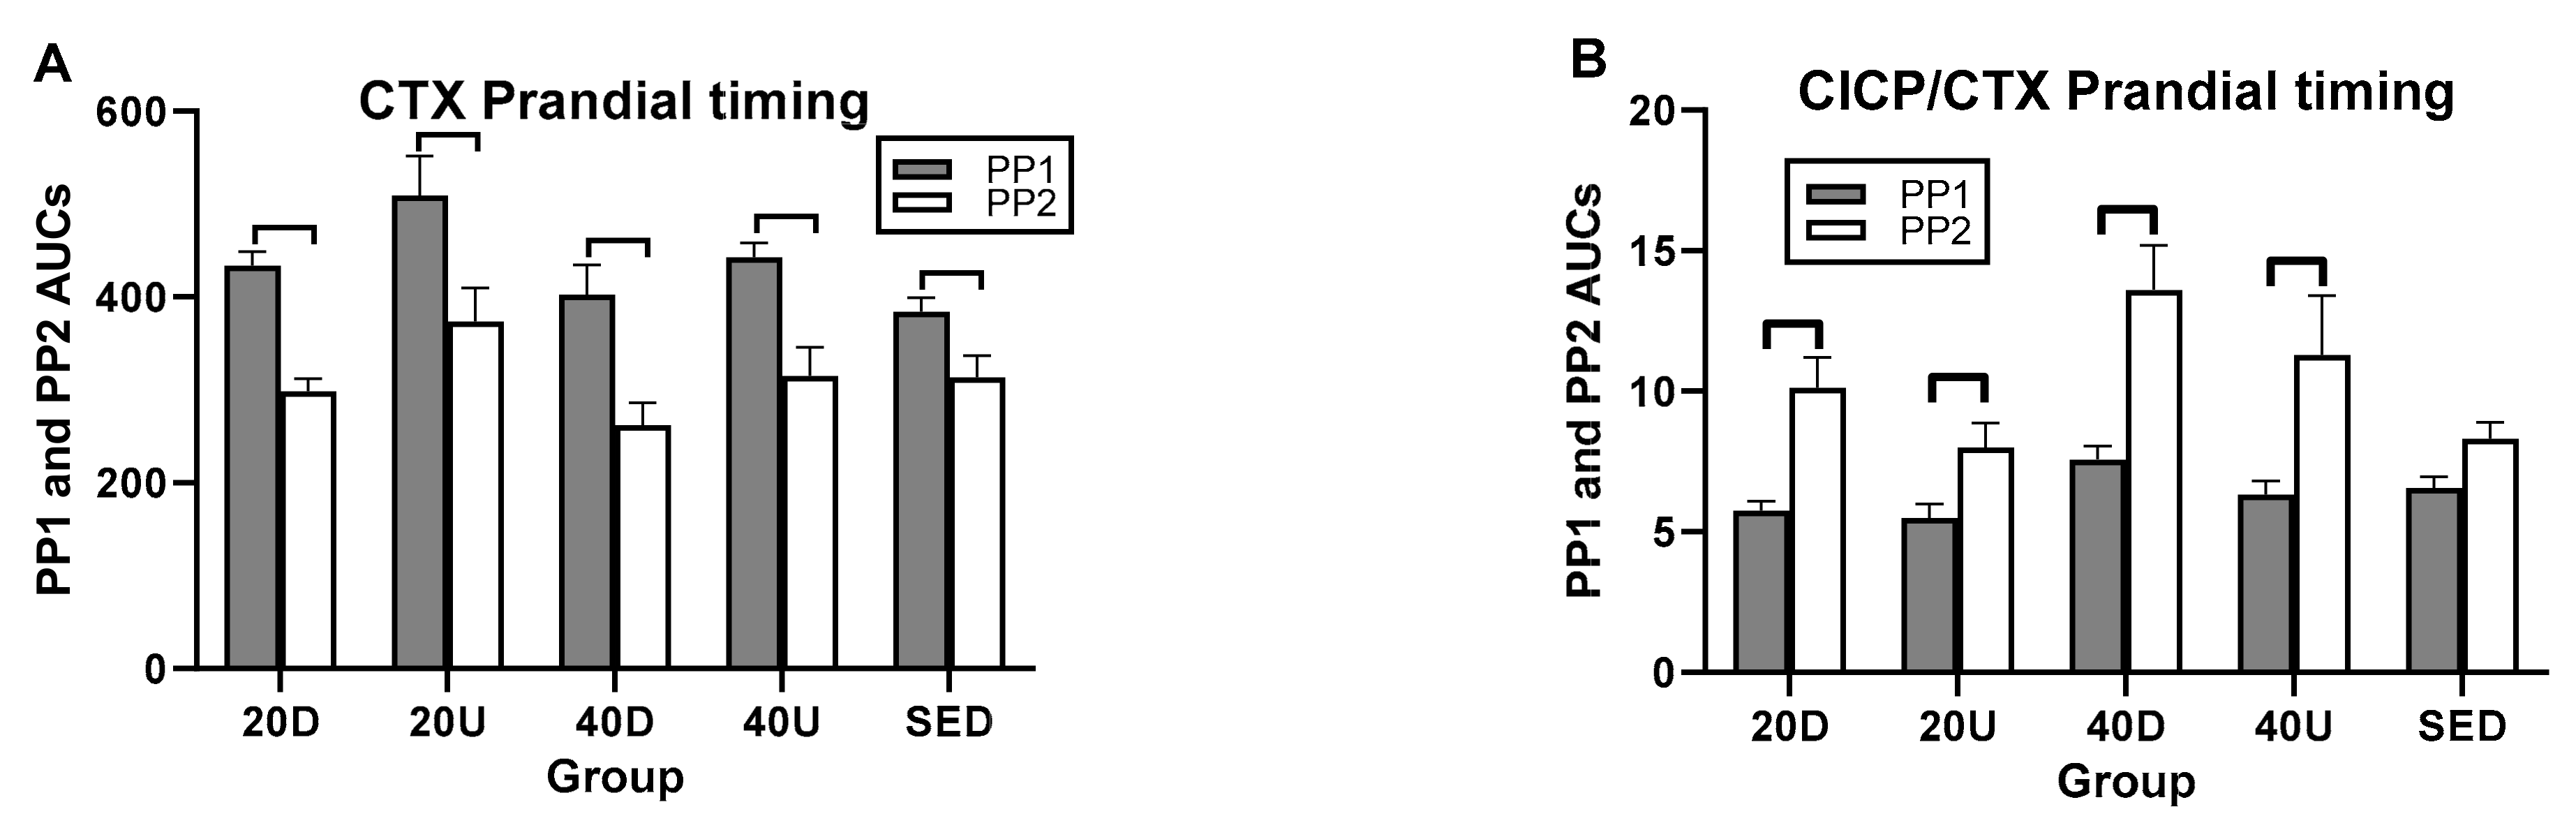
3.2. Bone Marker Responses to Timing of Exercise and Meals
3.3. Changes in the Ratios of Markers of Bone Formation and Marker of Bone Resorption to Timing of Exercise and Meals
3.4. Effects of Timing of EX1 and EX2 Exercise AUCs, and of PP1 and PP2 Postprandial AUCs on Markers of Bone Formation, the Marker of Bone Resorption, and Their Ratios
3.5. Hormone and Calcium Measurements
4. Discussion
4.1. Testing of Hypothesis 1: The Importance of Exercise Impulse for Osteogenic Response
4.2. Testing of Hypothesis 2: The Importance of Pre-Exercise Meals
4.3. Testing of Hypothesis 3: A Case for Circadian Interference in Bone Anabolism
5. Study Limitations
6. Conclusions
Author Contributions
Funding
Institutional Review Board Statement
Informed Consent Statement
Data Availability Statement
Acknowledgments
Conflicts of Interest
References
- Riggs, B.L.; Khosla, S.; Melton, L.J., III. A unitary model for involutional osteoporosis, Estrogen deficiency causes both type I and type II osteoporosis in postmenopausal women and contributes to bone loss in aging men. J. Bone Miner. Res. 1998, 13, 763–773. [Google Scholar]
- Schemitsch, E.H.; Sprague, S.; Heetveld, M.J.; Bzovsky, S.; Heels-Ansdell, D.; Zhou, Q.; Swiontkowski, M.; Bhandari, M. Loss of Independence After Operative Management of Femoral Neck Fractures. J. Orthop. Trauma 2019, 33, 292–300. [Google Scholar] [CrossRef]
- Lewiecki, E.M.; Ortendahl, J.D.; Vanderpuye-Orgle, J.; Grauer, A.; Arellano, J.; Lemay, J.; Harmon, A.L.; Broder, M.S.; Singer, A.J. Healthcare policy changes in osteoporosis can improve outcomes and reduce costs in the United States. JBMR Plus 2019, 3, e10192. [Google Scholar]
- Khosla, S.; Hofbauer, L.C. Osteoporosis treatment: Recent developments and ongoing challenges. Lancet Diabetes Endocrinol. 2017, 5, 898–907. [Google Scholar] [CrossRef] [Green Version]
- Tella, S.H.; Gallagher, J.C. Prevention and treatment of postmenopausal osteoporosis. J. Steroid Biochem. Mol. Biol. 2013, 142, 155–170. [Google Scholar] [CrossRef] [Green Version]
- Yang, Z.; Hu, Y.; Zhang, J.; Xu, L.; Zeng, R.; Kang, D. Estradiol therapy and breast cancer risk in perimenopausal and postmenopausal women: A systematic review and meta-analysis. Gynecol. Endocrinol. 2016, 33, 87–92. [Google Scholar] [CrossRef]
- Zhang, R.; Li, J.; Assaker, G.; Camirand, A.; Sabri, S.; Karaplis, A.C.; Kremer, R. Parathyroid Hormone-Related Protein (PTHrP): An Emerging Target in Cancer Progression and Metastasis. Adv. Exp. Med. Biol. 2019, 1164, 161–178. [Google Scholar] [CrossRef]
- Vargas-Franco, J.W.; Castaneda, B.; Rédiní, F.; Gómez, D.F.; Heymann, D.; Lézot, F. Paradoxical side effects of bisphosphonates on the skeleton: What do we know and what can we do? J. Cell. Physiol. 2018, 233, 5696–5715. [Google Scholar] [CrossRef]
- Lamy, O.; Stoll, D.; Aubry-Rozier, B.; Gonzalez Rodriguez, E. Stopping Denosumab. Curr. Osteoporos. Rep. 2019, 17, 8–15. [Google Scholar]
- McClung, M.R.; Brown, J.P.; Diez-Perez, A.; Resch, H.; Caminis, J.; Meisner, P.; Bolognese, M.A.; Goemaere, S.; Bone, H.G.; Zanchetta, J.R.; et al. Effects of 24 Months of Treatment with Romosozumab Followed by 12 Months of Denosumab or Placebo in Postmenopausal Women with Low Bone Mineral Density: A Randomized, Double-Blind, Phase 2, Parallel Group Study. J. Bone Miner. Res. 2018, 33, 1397–1406. [Google Scholar] [CrossRef]
- Kim, B.-J.; Koh, J.-M. Coupling factors involved in preserving bone balance. Cell. Mol. Life Sci. 2018, 76, 1243–1253. [Google Scholar] [CrossRef]
- Howe, T.E.; Shea, B.; Dawson, L.J.; Downie, F.; Murray, A.; Ross, C.; Harbour, R.T.; Caldwell, L.M.; Creed, G. Exercise for preventing and treating osteoporosis in postmenopausal women. Cochrane Database Syst. Rev. 2011, 6, CD000333. [Google Scholar] [CrossRef]
- Ireland, A.; Rittweger, J.J. Exercise for osteoporosis: How to navigate between overeagerness and defeatism. J. Musculoskelet. Neuronal Interact. 2017, 17, 155–161. [Google Scholar]
- Watson, S.; Weeks, B.; Weis, L.J.; Horan, S.; Beck, B.R. Heavy resistance training is safe and improves bone, function, and stature in postmenopausal women with low to very low bone mass: Novel early findings from the LIFTMOR trial. Osteoporos. Int. 2015, 26, 2889–2894. [Google Scholar] [CrossRef]
- Heinonen, A.; Kannus, P.; Sievänen, H.; Oja, P.; Pasanen, M.; Rinne, M.; Uusi-Rasi, K.; Vuori, I. Randomised controlled trial of effect of high-impact exercise on selected risk factors for osteoporotic fractures. Lancet 1996, 348, 1343–1347. [Google Scholar] [CrossRef]
- Kontulainen, S.; Sievänen, H.; Kannus, P.; Pasanen, M.; Vuori, I. Effect of Long-Term Impact-Loading on Mass, Size, and Estimated Strength of Humerus and Radius of Female Racquet-Sports Players: A Peripheral Quantitative Computed Tomography Study Between Young and Old Starters and Controls. J. Bone Miner. Res. 2002, 17, 2281–2289. [Google Scholar] [CrossRef]
- Watson, S.; Weeks, B.K.; Weis, L.J.; Harding, A.; Horan, S.A.; Beck, B.R. High-Intensity Resistance and Impact Training Improves Bone Mineral Density and Physical Function in Postmenopausal Women With Osteopenia and Osteoporosis: The LIFTMOR Randomized Controlled Trial. J. Bone Miner. Res. 2018, 33, 211–220. [Google Scholar] [CrossRef]
- Borer, K.T.; Fogleman, K.; Gross, M.; La New, J.M.; Dengel, D. Walking intensity for postmenopausal bone mineral preservation and accrual. Bone 2007, 41, 713–721. [Google Scholar] [CrossRef]
- Borer, K.T.; Zheng, Q.; Jafari, A.; Javadi, S.; Kernozek, T. Nutrient Intake Prior to Exercise Is Necessary for Increased Osteogenic Marker Response in Diabetic Postmenopausal Women. Nutrients 2019, 11, 1494. [Google Scholar] [CrossRef] [Green Version]
- Samvelyan, H.J.; Mathers, J.C.; Skerry, T.M. Feeding intervention potentiates the effect of mechanical loading to induce new bone formation in mice. FASEB J. 2021, 35, e21792. [Google Scholar] [CrossRef]
- Burr, D.B.; Robling, A.G.; Turner, C.H. Effects of biomechanical stress on bones in animals. Bone 2002, 30, 781–786. [Google Scholar]
- Umemura, Y.; Ishiko, T.; Yamauchi, T.; Kurono, M.; Mashiko, S. Five Jumps per Day Increase Bone Mass and Breaking Force in Rats. J. Bone Miner. Res. 1997, 12, 1480–1485. [Google Scholar] [CrossRef]
- Robling, A.G.; Hinant, F.M.; Burr, D.B.; Turner, C.H. Improved Bone Structure and Strength After Long-Term Mechanical Loading Is Greatest if Loading Is Separated Into Short Bouts. J. Bone Miner. Res. 2002, 17, 1545–1554. [Google Scholar] [CrossRef]
- Robling, A.G.; Burr, D.B.; Turner, C.H. Recovery periods restore mechanosensitivity to dynamically loaded bone. J. Exp. Biol. 2001, 204, 3389–3399. [Google Scholar] [CrossRef]
- Borer, K.T.; Wuorinen, E.; Ku, K.; Burant, C. Appetite Responds to Changes in Meal Content, Whereas Ghrelin, Leptin, and Insulin Track Changes in Energy Availability. J. Clin. Endocrinol. Metab. 2009, 94, 2290–2298. [Google Scholar] [CrossRef] [Green Version]
- Bouassida, A.; Latiri, I.; Bouassida, S.; Zalleg, D.; Zaouali, M.; Feki, Y.; Gharbi, N.; Zbidi, A.; Tabka, Z. Parathyroid hormone and physical exercise: A brief review. J. Sports Sci. Med. 2006, 5, 367–374. [Google Scholar]
- Kanaley, J.A. Growth hormone, arginine and exercise. Curr. Opin. Clin. Nutr. Metab. Care 2008, 11, 50–54. [Google Scholar] [CrossRef]
- Brandenberger, G.; Follenius, M. Influence of timing and intensity of musuclar exercise on temporal patterns of plasma cortisol levels. J. Clin. Endocrinol. Metab. 1975, 40, 845–849. [Google Scholar]
- Lakatos, P.; Szili, B.; Bakos, B.; Takacs, I.; Putz, Z.; Istenes, I. Thyroid Hormones, Glucocorticoids, Insulin, and Bone. Physiol. Pharmacol. Bone 2019, 93–120. [Google Scholar] [CrossRef]
- Reid, I.R.; Baldock, P.A.; Cornish, J. Effects of Leptin on the Skeleton. Endocr. Rev. 2018, 39, 938–959. [Google Scholar] [CrossRef]
- Lotinun, S.; Sibonga, J.D.; Turner, R.T. Differential Effects of Intermittent and Continuous Administration of Parathyroid Hormone on Bone Histomorphometry and Gene Expression. Endocrine 2002, 17, 29–36. [Google Scholar] [CrossRef]
- Svensson, J. The Importance of Growth Hormone (GH) and GH Secretagogues for Bone Mass and Density. Curr. Pharm. Des. 2002, 8, 2023–2032. [Google Scholar] [CrossRef]
- Ebeling, P.R.; Erbas, B.; Hopper, J.L.; Wark, J.D.; Rubinfeld, A.R. Bone mineral density and bone turnover in asthmatics treated with long-term inhaled or oral glucocorticoids. J. Bone Miner. Res. 1998, 13, 1283–1289. [Google Scholar]
- Gottschall, J.S.; Kram, R. Ground reaction forces during downhill and uphill running. J. Biomech. 2005, 38, 445–452. [Google Scholar] [CrossRef]
- Williams, N. The Borg Rating of Perceived Exertion (RPE) scale. Occup. Med. 2017, 67, 404–405. [Google Scholar] [CrossRef] [Green Version]
- Ritter, N.M.; Farach-Carson, M.C.; Butler, W.T. Evidence for the formation of a complex between osteopontin and osteocalcin. J. Bone Miner. Res. 1992, 7, 877–885. [Google Scholar] [CrossRef]
- Tripathi, T.; Gupta, P.; Sharma, J.; Rai, P.; Gupta, V.K.; Singh, N. Bone-specific alkaline phosphatase—a potential biomarker for skeletal growth assessment. J. Orthod. 2018, 45, 4–10. [Google Scholar] [CrossRef]
- Murray, M.P.; Drought, A.B.; Kory, R.C. Walking patterns of normal men. J. Bone Jt. Surg. 1964, 46-A, 335–360. [Google Scholar]
- Münkler, P.; Kröger, S.; Liosis, S.; Abdin, A.; Lyan, E.; Eitel, C.; Eitel, I.; Meyer, C.; Willems, S.; Heeger, C.-H.; et al. Ablation Index for Catheter Ablation of Atrial Fibrillation—Clinical Applicability and Comparison with Force-Time Integral. Circ. J. 2018, 82, 2722–2727. [Google Scholar] [CrossRef] [Green Version]
- Rencken, M.L.; Chesnut, C.H., III; Drinkwater, B.L. Bone density at multiple skeletal sites in amenorrheic athletes. JAMA 1996, 276, 238–240. [Google Scholar]
- Jensen, L.B.; Quaade, F.; Sørensen, O.H. Bone loss accompanying voluntary weight loss in obese humans. J. Bone Miner. Res. 1994, 9, 459–463. [Google Scholar] [CrossRef]
- Bjarnason, N.; Henriksen, E.; Alexandersen, P.; Christgau, S.; Henriksen, D.; Christiansen, C. Mechanism of circadian variation in bone resorption. Bone 2002, 30, 307–313. [Google Scholar] [CrossRef]
- Christgau, S.; Bitsch-Jensen, O.; Bjarnason, N.H.; Henriksen, E.G.; Qvist, P.; Alexandersen, P.; Henriksen, D.B. Serum CrossLaps for monitoring the response in individuals undergoing antiresorptive therapy. Bone 2000, 26, 505–511. [Google Scholar] [CrossRef]
- Ramsey, W.; Isales, C.M. Intestinal Incretins and the Regulation of Bone Physiology. Adv. Exp. Med. Biol. 2017, 1033, 13–33. [Google Scholar] [CrossRef]
- Henriksen, D.B.; Alexandersen, P.; Byrjalsen, I.; Hartmann, B.; Bone, H.G.; Christiansen, C.; Holst, J.J. Reduction of nocturnal rise in bone resorption by subcutaneous GLP-2. Bone 2004, 34, 140–147. [Google Scholar] [CrossRef]
- Clowes, J.; Hannon, R.; Yap, T.; Hoyle, N.; Blumsohn, A.; Eastell, R. Effect of feeding on bone turnover markers and its impact on biological variability of measurements. Bone 2002, 30, 886–890. [Google Scholar] [CrossRef]
- Henriksen, D.B.; Alexandersen, P.; Bjarnason, B.H.; Vilsbøll, T.; Hartmann, B.; Henriksen, E.E.G.; Byrjalsen, I.; Krarup, Y.; Holst, J.J.; Chritiansen, C. Role of gastrointestinal homones in postprandial reduction of bone resorption. J. Bone Miner. Res. 2003, 18, 2180–2189. [Google Scholar]
- Aoshima, H.; Kushida, K.; Takahashi, M.; Ohishi, T.; Hoshino, H.; Suzuki, M.; Inoue, T. Circadian Variation of Urinary Type I Collagen Crosslinked C-Telopeptide and Free and Peptide-Bound Forms of Pyridinium Crosslinks. Bone 1998, 22, 73–78. [Google Scholar] [CrossRef]
- Qvist, P.; Christgau, C.; Pedersen, B.J.; Schlemmer, A.; Christiansen, C. Circadian variation in the serum concentration of C-terminal telopeptide of type I collagen (serum CTX): Effects of gender, age, menopausal status, posture, daylight, serum cortisol, and fasting. Bone 2002, 31, 57–61. [Google Scholar]
- Wichers, M.; Schmidt, E.; Bidlingmaier, F.; Klingmüller, D. Diurnal rhythm of CrossLaps in human serum. Clin. Chem. 1999, 45, 1858–1860. [Google Scholar]
- Drucker, D.J. Biological actions and therapeutic potential of the glucagon-like peptides. Gastroenterology 2002, 122, 531–544. [Google Scholar] [CrossRef] [Green Version]
- Wuorinen, E.C.; Borer, K.T. Circadian and ultradian components of hunger in human non-homeostatic meal-to-meal eating. Physiol. Behav. 2013, 122, 8–16. [Google Scholar] [CrossRef]
- Hygum, K.; Starup-Linde, J.; Harsløf, T.; Jørgensen, N.R.; Hartmann, B.; Holst, J.J.; Langdahl, B.L. The diurnal variation of bone formation is attenuated in adult patients with type 2 diabetes. Eur. J. Endocrinol. 2019, 181, 221–231. [Google Scholar] [CrossRef]
- Jilka, R.L. Molecular and cellular mechanisms of the anabolic effect of intermittent PTH. Bone 2007, 40, 1434–1446. [Google Scholar]
- Seeman, E.; Delmas, P.D. Reconstructing the skeleton with intermittent parathyroid hormone. Trends Endocrinol. Metab. 2001, 12, 281–283. [Google Scholar] [CrossRef]
- Bellido, T.; Ali, A.A.; Plotkin, L.I.; Fu, Q.; Gubrij, I.; Roberson, P.K.; Weinstein, R.S.; O’Brien, C.A.; Manolagas, S.C.; Jilka, R.L. Proteasomal Degradation of Runx2 Shortens Parathyroid Hormone-induced Anti-apoptotic Signaling in Osteoblasts. J. Biol. Chem. 2003, 278, 50259–50272. [Google Scholar] [CrossRef] [Green Version]
- Kim, C.H.; Takai, E.; Zhou, H.; Von Stechow, D.; Müller, R.; Dempster, D.W.; Guo, X.E. Trabecular Bone Response to Mechanical and Parathyroid Hormone Stimulation: The Role of Mechanical Microenvironment. J. Bone Miner. Res. 2003, 18, 2116–2125. [Google Scholar] [CrossRef]
- Li, J.; Duncan, R.L.; Burr, D.B.; Gattone, V.H.; Turner, C.H. Parathyroid Hormone Enhances Mechanically Induced Bone Formation, Possibly Involving L-Type Voltage-Sensitive Calcium Channels. Endocrinology 2003, 144, 1226–1233. [Google Scholar] [CrossRef] [Green Version]
- Ma, Y.; Jee, W.S.S.; Yuan, Z.; Wei, W.; Chen, H.; Pun, S.; Liang, H.; Lin, C. Parathyroid Hormone and Mechanical Usage Have a Synergistic Effect in Rat Tibial Diaphyseal Cortical Bone. J. Bone Miner. Res. 1999, 14, 439–448. [Google Scholar] [CrossRef]
- Sugiyama, T.; Saxon, L.K.; Zaman, G.; Moustafa, A.; Sunters, A.; Price, J.S.; Lanyon, L.E. Mechanical loading enhances the anabolic effects of intermittent parathyroid hormone (1–34) on trabecular and cortical bone in mice. Bone 2008, 43, 238–248. [Google Scholar] [CrossRef]
- Jepsen, D.B.; Ryg, J.; Hansen, S.; Jørgensen, N.R.; Gram, J.; Masud, T. The combined effect of parathyroid hormone (1-34) and whole-body vibration exercise in the treatment of postmenopausal osteoporosis (PAVOS study): A randomized controlled study. Osteoporosis Int. 2019, 30, 1827–1836. [Google Scholar]
- Shibamoto, A.; Ogawa, T.; Duyck, J.; Vandamme, K.; Naert, I.; Sasaki, K. Effect of high-frequency loading and parathyroid hormone administration on peri-implant bone healing and osseointegration. Int. J. Oral Sci. 2018, 10, 1–7. [Google Scholar] [CrossRef]
- Luchavova, M.; Zikan, V.; Michalska, D.; Raska, I.; Kubena, A.A.; Stepan, J.J. The effect of timing of teriparatide treatment on the circadian rhythm of bone turnover in postmenopausal osteoporosis. Eur. J. Endocrinol. 2011, 164, 643–648. [Google Scholar]
- Michalská, D.; Luchavova, M.; Zikan, V.; Raska, I.; Kubena, A.A.; Stepan, J. Effects of morning vs. evening teriparatide injection on bone mineral density and bone turnover markers in postmenopausal osteoporosis. Osteoporos. Int. 2012, 23, 2885–2891. [Google Scholar] [CrossRef]
- US Department of Agriculture and US Department of Health and Human Services. Dietary Guidelines to Ameicans, 7th ed.; U.S. Government Printing Office: Washington, DC, USA, 2010.
- Lin, P.-J.; Borer, K.T. Third Exposure to a Reduced Carbohydrate Meal Lowers Evening Postprandial Insulin and GIP Responses and HOMA-IR Estimate of Insulin Resistance. PLoS ONE 2016, 11, e0165378. [Google Scholar] [CrossRef]


| Breakfast 7:00 am, 25% of Calories for a 2000-Cal Daily Intake | |||||
| Menu item | Amount | cals | pro | fat | carb |
| Cheerios | 17 gm box | 60 | 2 | 1 | 13 |
| 2% milk | 8 oz carton | 120 | 8 | 5 | 11 |
| Cranberry muffin | One | 164 | 4 | 6 | 27 |
| Margarine | 1 tub | 36 | 0 | 4.1 | 0 |
| Orange juice | two 4 oz boxes | 120 | 0 | 0 | 28 |
| total | 500 | 14 | 16.1 | 79 | |
| Lunch 1:00 pm, 35% of Calories | |||||
| Menu item | Amount | cals | pro | fat | carb |
| Spaghetti cooked | 100 gm | 141 | 4.7 | 0.6 | 28 |
| Ragu sauce | 125 gm | 80 | 2 | 3 | 10 |
| Parmesan cheese | 8 gm | 34.4 | 3 | 2.3 | 0.3 |
| Meat balls | 40 gm | 99 | 7 | 7 | 2.8 |
| Green beans | 91 gm | 25 | 1 | 0 | 6 |
| Tossed salad | 45 gm | 6 | 0.6 | 0 | 1 |
| Sysco Italian dressing | 12 gm | 45 | 80 | 4.5 | 1 |
| Wheat roll | 30 gm | 77 | 42.7 | 1.2 | 13.8 |
| Margarine | 1 tub | 36 | 0 | 4.1 | 0 |
| Sherbet | 4 oz container | 90 | 0 | 0 | 15 |
| Sprite | 255 gm | 100 | 0 | 0 | 26 |
| total | 733.4 | 21 | 22.7 | 103.9 | |
| goal | 700 | 26 | 19 | 105 | |
| Dinner 7:00 pm, 40% of Calories | |||||
| Menu item | Amount | cals | pro | fat | carb |
| Chicken breast | 75 gm | 118 | 22.5 | 2.7 | 0 |
| Rice | 120 gm | 133 | 2.4 | 0 | 29 |
| Herbed au jus | 2 T | 25 | 1 | 1 | 3 |
| Carrots | 86 gm | 31 | 1 | 0 | 7 |
| White roll | 30 gm | 71 | 1.9 | 1.4 | 12.8 |
| Margarine | 1 tub | 36 | 0 | 4.1 | 0 |
| Berry applesauce | 1 container | 90 | 0 | 0 | 23 |
| Cheese Danish | One (2.25 oz) | 231 | 3 | 15 | 21 |
| Apple juice | 180 gm | 91 | 0 | 0 | 22.5 |
| total | 826 | 31.8 | 24.2 | 118.3 | |
| goal | 800 | 30 | 22 | 120 | |
| Variable | Sedentary | Uphill 20/20 min | Downhill 20/20 min | Uphill 40 min | Downhill 40 min | F(df = 4,35); p |
|---|---|---|---|---|---|---|
| Subjects | N = 8 | N = 8 (1 AA) | N = 8 (1 A) | N = 8 | N = 8 | |
| Age (years) | 57.4 ± 1.7 | 58.4 ± 1.0 | 58.1 ± 1.5 | 59.9 ± 6.4 | 55.1 ± 1.0 | 1.82; 0.147 |
| Menopause (y) | 11.5 ± 2.7 | 6.6 ± 2.6 | 5.4 ± 1.6 | 12.8 ± 2.7 | 5.1 ± 1.1 | 2.453; 0.064 |
| Weight (kg) | 73.6 ± 3.8 | 74.6 ± 3.6 | 69.8 ± 2.9 | 67.8 ± 7.8 | 63.6 ± 5.3 | 0.8698; 0.4917 |
| LBM (kg) | 40.4 ± 1.8 | 42.1 ± 1.0 | 39.8 ± 1.3 | 38.8 ± 4.5 | 36.9 ± 3.1 | 0.0744; 0.9284 |
| Body fat (%) | 42.0 ± 2.3 | 40.0 ± 2.8 | 39.8 ± 2.0 | 39.4 ± 4.5 | 35.1 ± 3.0 | 0.2473; 0.9094 |
| BMI (kg/m2) | 26.2 ± 1.0 | 27.7 ± 1.0 | 27.1 ± 1.2 | 26.0 ± 2.9 | 23.9 ± 2.1 | 0.5956; 0.6682 |
| BMD, body (g/cm2) | 1.2 ± 0.0 | 1.1 ± 0.0 | 1.1 ± 0.0 | 1.1 ± 0.1 | 1.2 ± 0.0 | 0.7530; 0.5628 |
| BMC, body (kg) | 2.6 ± 0.1 | 2.7 ± 0.1 | 2.5 ± 0.1 | 2.4 ± 0.3 | 2.2 ± 0.2 | 0.620; 0.5434 |
| Z score, body | 0.7 ± 0.3 | 1.0 ± 0.3 | 0.5 ± 0.5 | 0.9 ± 0.2 | 1.0 ± 0.2 | 0.4921; 0.7415 |
| BMD spine (g/cm2) | 1.1 ± 0.1 | 1.1 ± 0.1 | 1.1 ± 0.1 | 0.9 ± 0.1 | 1.1 ± 0.0 | 1.034; 0.4037 |
| BMC spine L1–L4 (g) | 67.4 ± 7.1 | 58.1 ± 2.3 | 57.8 ± 1.4 | 51.7 ± 6.4 | 52.8 ± 5.3 | 0.8883; 0.4811 |
| Z score spine | 0.3 ± 0.6 | 0.2 ± 0.4 | −0.2 ± 0.6 | 0.1 ± 0.2 | 0.1 ± 0.1 | 0.2038; 0.9346 |
| BMD hip (g/cm2) | 0.9 ± 0.0 | 0.9 ± 0.1 | 0.9 ± 0.0 | 0.9 ± 0.1 | 1.0 ± 0.0 | 2.024; 0.1124 |
| BMC hip (g) | 28.6 ± 1.1 | 31.4 ± 0.9 | 28.6 ± 1.1 | 28.2 ± 3.4 | 27.8 ± 2.4 | 1.225; 0.3053 |
| Z score hip | −0.1 ± 0.2 | 0.1 ± 0.4 | 0.0 ± 0.4 | 0.3 ± 0.2 | 0.4 ± 0.3 | 0.8705; 0.4457 |
| ṼO2 max (mL O2/min) | 1847.2 ± 178.0 | 2087 ± 197.6 | 1793.0 ± 112.2 | 1646.4 ± 162.0 | 1891.9 ± 179.2 | 1.072; 0.3851 |
| ṼO2 max (mL O2/(kg*min)) | 25.8 ± 1.8 | 28.2 ± 3.3 | 26.8 ± 2.1 | 23.7 ± 3.3 | 24.4 ± 2.4 | 0.6611; 0.6231 |
| Basal serum PTH (ng/mL) | 42.6 ± 1.5 | 44.6 ± 4.2 | 49.9 ± 6.0 | 39.5 ± 4.1 | 57.6 ± 7.6 | 1.557; 0.2073 |
| Basal serum TSH (ng/mL) | 2.3 ± 0.4 | 2.3 ± 0.3 | 3.1 ± 0.3 | 1.9 ± 0.2 | 2.8 ± 0.6 | 1.953; 0.1235 |
| Variable | Uphill 20/20 min | Downhill 20/20 min | Uphill 40 min | Downhill 40 min | F(df = 3,28); p |
|---|---|---|---|---|---|
| Subjects | N = 8 | N = 8 | N = 8 | N = 8 | |
| Treadmill slope (degrees) | 7.9 ± 1.4 | −6.0 ± 0.0 | 8.8 ± 1.4 | −6.0 ± 0.0 | 48.32; <0.0001 |
| Walking speed (kph) | 4.4 ± 0.4 | 7.0 ± 0.4 | 4.9 ± 0.5 | 6.4 ± 0.1 | 20.25; <0.0001 |
| Walking speed (m/s) | 1.3 ± 0.0 | 1.9 ± 0.1 | 1.2 ± 0.2 | 1.8 ± 0.0 | 20.28; <0.0001 |
| Distance walked (km) | 2.9 ± 0.3 | 4.6 ± 0.3 | 3.2 ± 0.0 | 4.3 ± 0.1 | 20.29; <0.0001 |
| Relative effort (%ṼO2 max) | 76.9 ± 2.5 | 46.5 ± 2.9 | 67.3 ± 5.9 | 46.7 ± 3.2 | 27.7; <0.0001 |
| Heart rate (bpm) | 135.6 ± 2.2 | 118.4 ± 3.3 | 121.7 ± 10.5 | 119.3 ± 3.7 | 10.33; <0.0001 |
| RPE | 12.2 ± 1.4 | 12.0 ± 1.0 | 11.2 ± 1.0 | 11.4 ± 0.7 | 0.1739; 0.9138 |
| Steps in 40 min | 4103.7 ± 350.9 | 5196.9 ± 70.1 | 4568.1 ± 82.4 | 5209 ± 100.3 | 20.38; <0.0001 |
| Peak pressure (KPa) | 265.6 ± 17.3 | 364.2 ± 20.7 | 242.6 ± 20.8 | 296.0 ± 11.0 | 8.282; 0.0004 |
| Relative peak pressure (KPa/kg) | 3.6 ± 0.3 | 5.3 ± 0.4 | 4.0 ± 0.4 | 4.3 ± 0.4 | 5.813; 0.0032 |
| Peak GRF (N) | 839.9 ± 30.8 | 1017.1 ± 48.7 | 780.1 ± 44.0 | 1109.5 ± 46.2 | 14.36; <0.0001 |
| Relative GRF (N/kg) | 1.1 ± 0.1 | 1.6 ± 0.1 | 1.3 ± 0.1 | 1.4 ± 0.1 | 7.417; 0.0008 |
| Momentum ((kg*m)/s) | 100.1 ± 4.6 | 134.6 ± 9.0 | 92.9 ± 4.1 | 127.4 ± 4.6 | 10.94; <0.0001 |
| Impulse or force–time integral (N*s) | 1,007,880 ± 36,960 | 1,220,520 ± 58,440 | 1,872,240 ± 105,600 | 2,662,800 ± 110,880 | 33.0; p < 0.0001 |
| Markers or Their Ratio | Treatment | Time | Interaction | Slices (Times) Significant at >0.05 |
|---|---|---|---|---|
| CICP | F(df = 4,35) = 3.57, p = 0.00153 | F(df = 14,490) = 3.97, p < 0.0001 | F(df = 56,490) = 1.37, p = 0.046 | 8:40, 9:00, 10:00; 15:00, 15:20, 17:00, 18:00, and 20:00 h. |
| OC | NS | NS | NS | |
| BALP | NS | NS | NS | |
| CTX | F(df = 4,35) = 4.81, p = 0.0034 | F(df = 14,490) = 48.51, p < 0.0001 | NS | 8:40, 9:00, 10:00 h;18:00, 20:00, 22:00 h |
| CICP/CTX | F(df = 4,35) = 3.74, p = 0.0123 | F(df = 14,490) = 3.74, p = 0.0123 | F(df = 56,490) = 1.83, p = 0.0004 | 15:20, 15:40, 16:00, 17:00, 18:00 h |
| OC/CTX | F(df = 4,35) = 4.39, p = 0.0056 | F(df = 14,490) = 38.65, p < 0.0001 | F(df = 56,490) = 2.12, p < 0.0001 | 15:20, 15:40, 16:00, 17:00, 18:00 h |
| BALP/CTX | NS | F(df = 14,280) = 31.75, p < 0.0001 | F(df = 56,280) = 1.63, p = 0.0057 | 15:20, 15:40, 16:00, 17:00, 18:00 h |
| Markers/Ratios | Overall Timing Effect | Between-Group Difference (95% CIs) | Within Group Difference t(df = 7) *l(p) |
|---|---|---|---|
| CICP | F(df = 4) = 3.16, p = 0.0257 | 20 D > 20 U (0.0308, 0.444) | NS |
| OC | F(df = 4) = 3.30, p = 0.0213 | 40 D > 20 U (0.038, 0.341) | EX1 > EX2 for 20 U (2.98–0.02) |
| BALP | F(df = 4) = 3.19, p = 0.0353 | 40 D > S (0.187, 0.0004) | EX1 > EX2 for 40 D (5.40–0.006) |
| CTX | F(df = 4) = 2.44, p = 0.0653 | 40 D > S (0.5953, 0.0293) | EX1 > EX2 for 40 D (2.46–0.04) |
| CICP/CTX | NS | 40 D > S (0.0045, 0.6565) | EX2 > EX1 for 40 D (2.70–0.03) |
| OC/CTX | NS | 40 D > S (1223, 0.7126) 40 D > 20 D (0.058, 0.648) 40 D > 20 U (0.07, 0.661) | EX2 > EX1 for 40 D (4.1–0.005) |
| BALP/CTX | NS | 40 D > 20 U(0.0127, 0.78) | EX2 > EX1 for 40 D (3.68–0.021) |
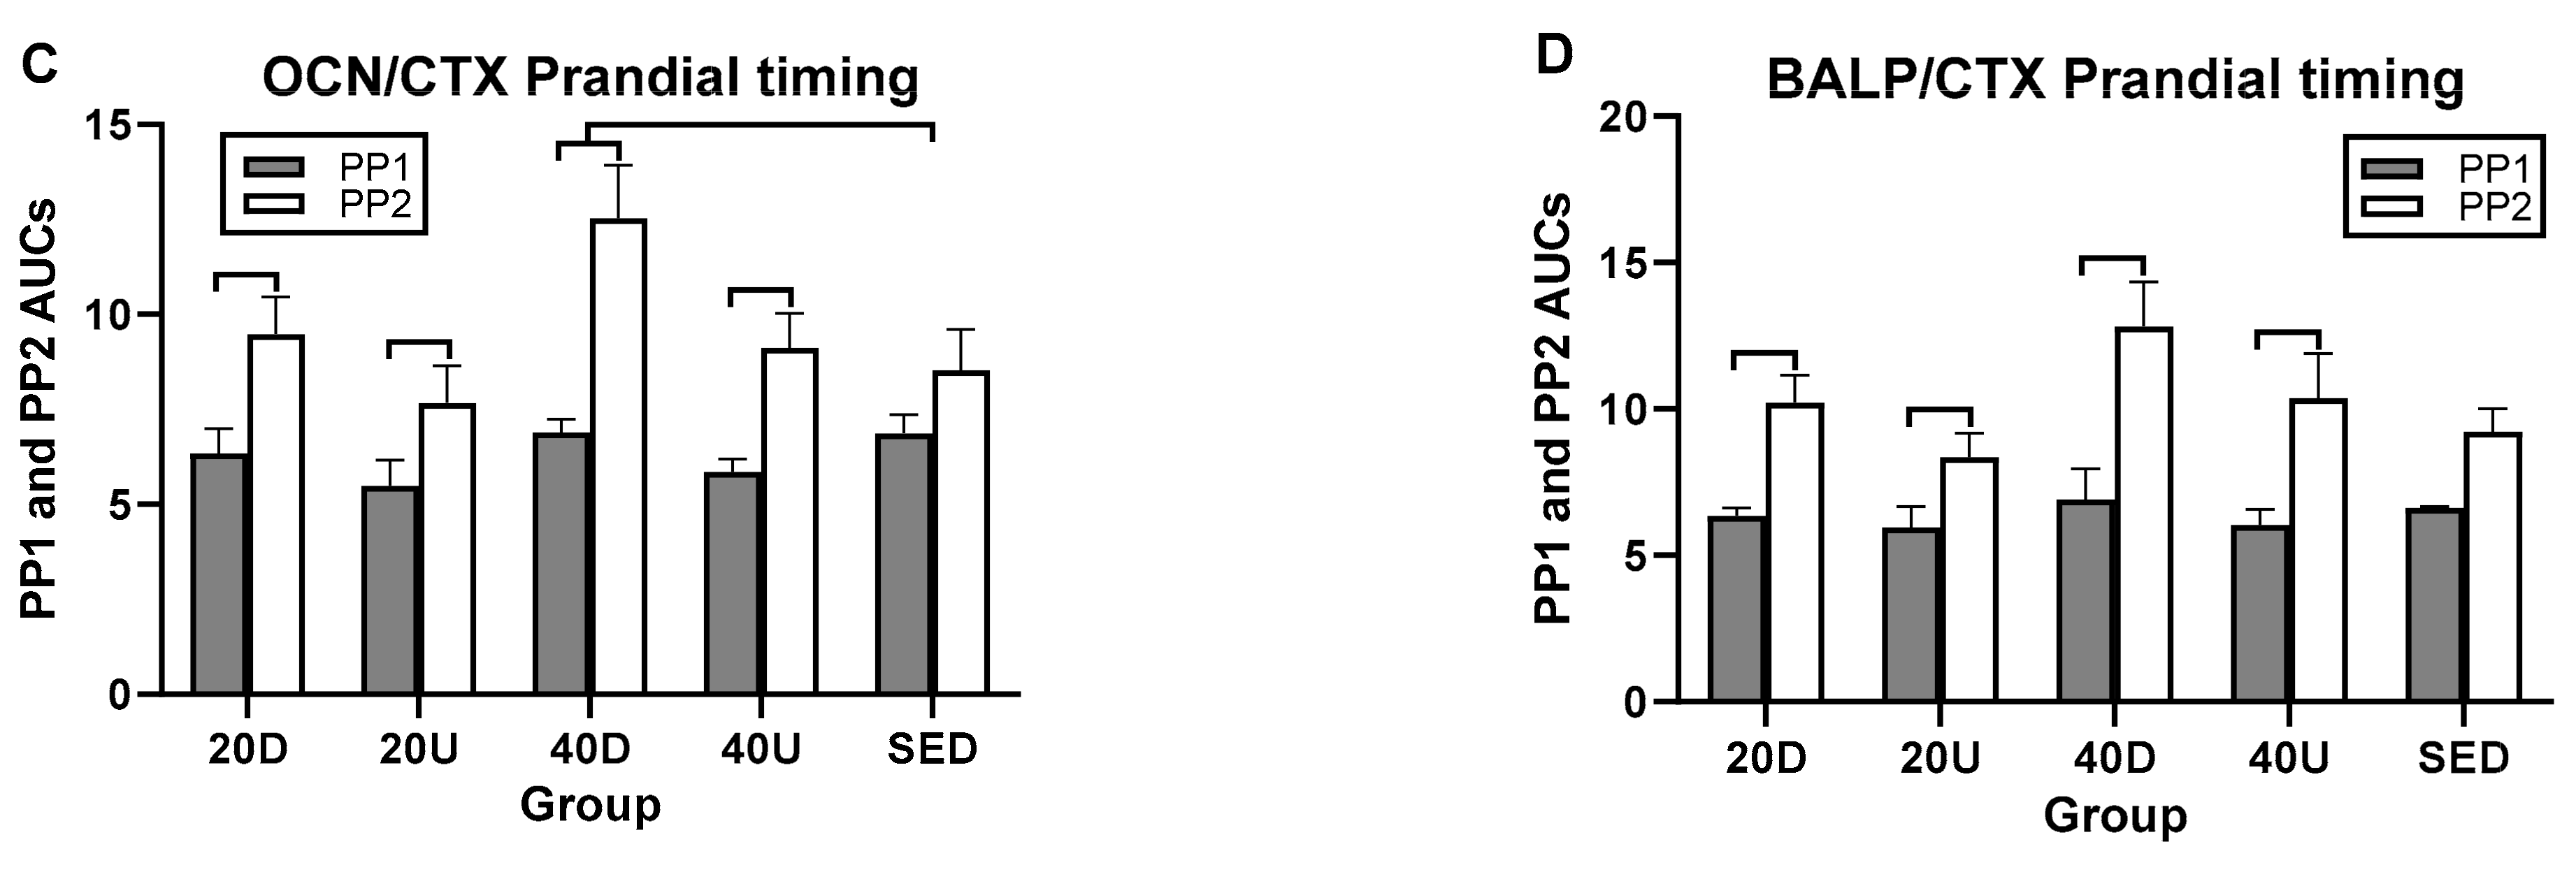
| Markers/Ratios | Overall Timing Effect | Between-Group Difference (95% CIs) | Within Group Difference t(df = 7) * p |
|---|---|---|---|
| CTX | NS | NS | PP1 > PP2 for all (t(df = 7) 4.26 to 8.53– p = 0.004 to 0.0001) |
| CICP/CTX | NS | NS | PP2 > PP1 # PP2 > PP1 # PP2 > PP1 # |
| OC/CTX | NS | 40D > S (0.021,0.75) | |
| BALP/CTX | NS | NS |
| Hormones | Treatment | Time | Interaction | Slices (Times) Significant at >0.05 |
|---|---|---|---|---|
| PTH | F(df = 4,35) = 3.13, p = 0.0267 | F(df = 14,490) = 19.02, p < 0.0001 | F(df = 56,490) = 2.12, p < 0.0001 | 09:00, 10:00; 11:00; 13:00; 17:00; 20:00 h. |
| GH | NS | F(df = 14,488) = 13.07, p < 0.0001 | F(df = 56,490) = 3.10 p < 0.0001 | 08:20; 08:40; 9:00; 15:20; 15:40; 16:00 h. |
| Leptin | NS | F(df = 14,490) = 3.65, p = 0.0036 | NS | 17:00; 20:00 h |
| Insulin | NS | F(df = 14,490) =162.5, p < 0.0001 | F(df = 56,490) = 3.17, p < 0.0001 | 09:00; 15:00 h; 20:00; 22:00 h |
| Cortisol | NS | F(df = 14,490) = 29.13, p < 0.0001 | F(df = 56,490) = 1.50, p = 0.0137 | 08:20; 08:40; 9:00; 17:00; 20:00; 22:00 h. |
| Calcium, total (percent) | NS | F(df = 14,490) = 14.10, p < 0.0001 | F(df =56,490) = 2.06, p < 0.0001 | 08:20, 10:00; 15:20 h. |
| Hormones | Overall Exercise Timing Effect | Between-Group Difference (95% CIs) | Within-Group Difference t(df = 7)-p |
|---|---|---|---|
| PTH | NS | 20D−40U (0.00113–0.485) | EX2 > EX1 for 20D (4.68–0.0023) EX2 > EX1 for 40D (4.77–0.002) EX2 > EX1 for 40U (5.16–0.013) EX2 > EX1 for S (3.52–0.0098) |
| Insulin | F(df = 4) = 9.67, p = 0.0001 | 20D−40D (0.0194,0.30431) 20D−40U (0.0436, 0.329) 20D-S (0.0917,0.3772) 20D-U (0.1472,0.4327) | EX2 > EX1 for 20D (13.58–0.0001) EX2 > EX1 for 40D (4.35–0.0034) EX2 > EX1 for 40U (3.08–0.0179) EX2 > EX1 for S (4.17–0.0042) |
| Cortisol | NS | 40D−40U (0.0128–0.894) | EX1 > EX2 for 20D (6.16–0.0005) EX1 > EX2 for 20U (4.14–0.0043) EX1 > EX2 for 40U (7.48–0.0001) EX1 > EX2 for S (4.09–0.0046) |
| Overall Postprandial Timing Effect | |||
| PTH | NS | NS | PP2 > PP1 for 20D (4.61–0.0025) |
| Insulin | F(df = 4) = 21.77, p = 0.0001 | 20U−40U (0.2904,0.5581) 20U−20D (0.172,0.4625 20U-S (0.7685.0.3674 20D−40D (003452,0.3251 40U−40D (0.153,0.44352) 40U-S (0.0683,0.35884) | PP2 > PP1 1 for 20D (4.27–0.0037) PP2 > PP1 for 20U (5.64–0.0008) PP2 > PP1 for 40U (5.44–0.0001) PP2 > PP1 for S (3.08–0.0178) F(df = 7) = 3.08, p = 0.0179 F(df = 7) = 4.17, p = 0.0042 |
| Cortisol | NS | NS | PP1 > PP2 for 40U (5.44–0.001) PP1 > PP2 for S (3.12–0.0169) |
Publisher’s Note: MDPI stays neutral with regard to jurisdictional claims in published maps and institutional affiliations. |
© 2021 by the authors. Licensee MDPI, Basel, Switzerland. This article is an open access article distributed under the terms and conditions of the Creative Commons Attribution (CC BY) license (https://creativecommons.org/licenses/by/4.0/).
Share and Cite
Zheng, Q.; Kernozek, T.; Daoud-Gray, A.; Borer, K.T. Anabolic Bone Stimulus Requires a Pre-Exercise Meal and 45-Minute Walking Impulse of Suprathreshold Speed-Enhanced Momentum to Prevent or Mitigate Postmenopausal Osteoporosis within Circadian Constraints. Nutrients 2021, 13, 3727. https://doi.org/10.3390/nu13113727
Zheng Q, Kernozek T, Daoud-Gray A, Borer KT. Anabolic Bone Stimulus Requires a Pre-Exercise Meal and 45-Minute Walking Impulse of Suprathreshold Speed-Enhanced Momentum to Prevent or Mitigate Postmenopausal Osteoporosis within Circadian Constraints. Nutrients. 2021; 13(11):3727. https://doi.org/10.3390/nu13113727
Chicago/Turabian StyleZheng, Qingyun, Thomas Kernozek, Adam Daoud-Gray, and Katarina T. Borer. 2021. "Anabolic Bone Stimulus Requires a Pre-Exercise Meal and 45-Minute Walking Impulse of Suprathreshold Speed-Enhanced Momentum to Prevent or Mitigate Postmenopausal Osteoporosis within Circadian Constraints" Nutrients 13, no. 11: 3727. https://doi.org/10.3390/nu13113727