
Positive Effects of Exercise Intervention without Weight Loss and Dietary Changes in NAFLD-Related Clinical Parameters: A Systematic Review and Meta-Analysis

 , , ,
, , , 
Abstract
:1. Introduction
2. Materials and Methods
2.1. Protocol and Registration
2.2. Data Sources and Search Strategy
2.3. Inclusion and Exclusion Criteria
2.4. Data Extraction and Quality Assessment
2.5. Data Analyses
2.5.1. Data Preparation
2.5.2. Statistical Analysis
2.5.3. Meta-Analysis
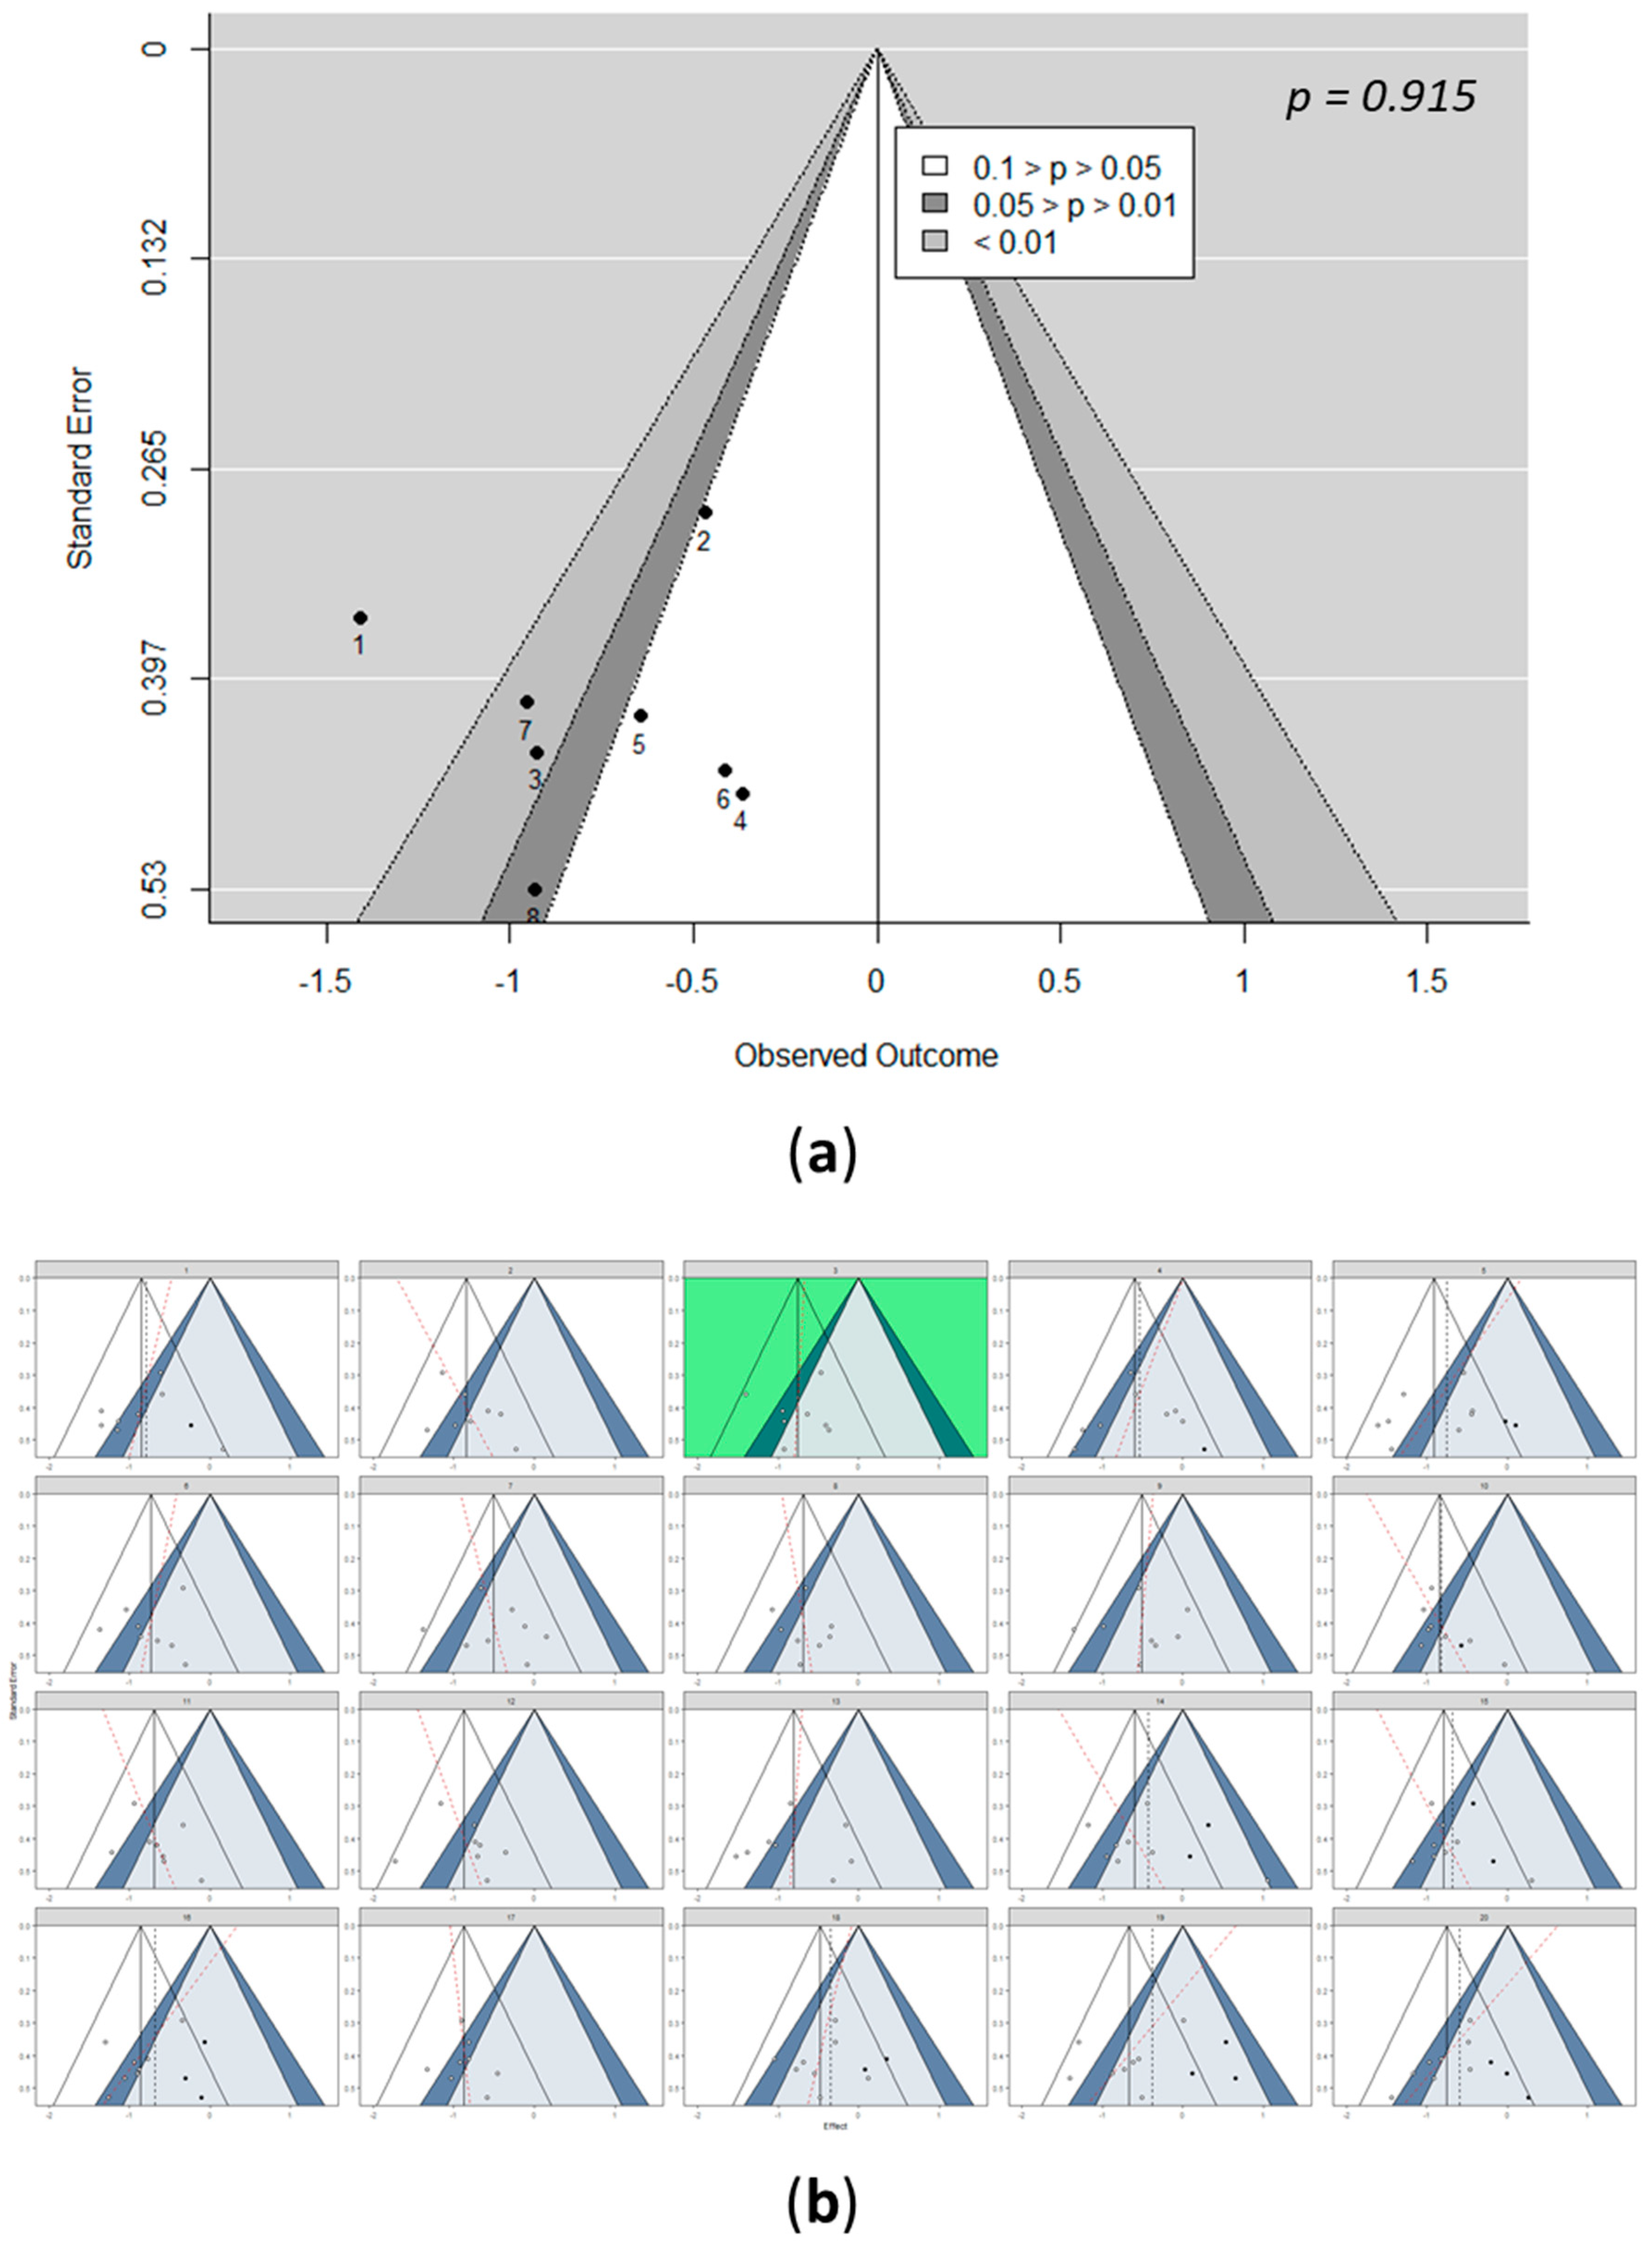
2.5.4. Detection of Bias
2.5.5. Outlier Detection
2.5.6. Influence Analysis
3. Results
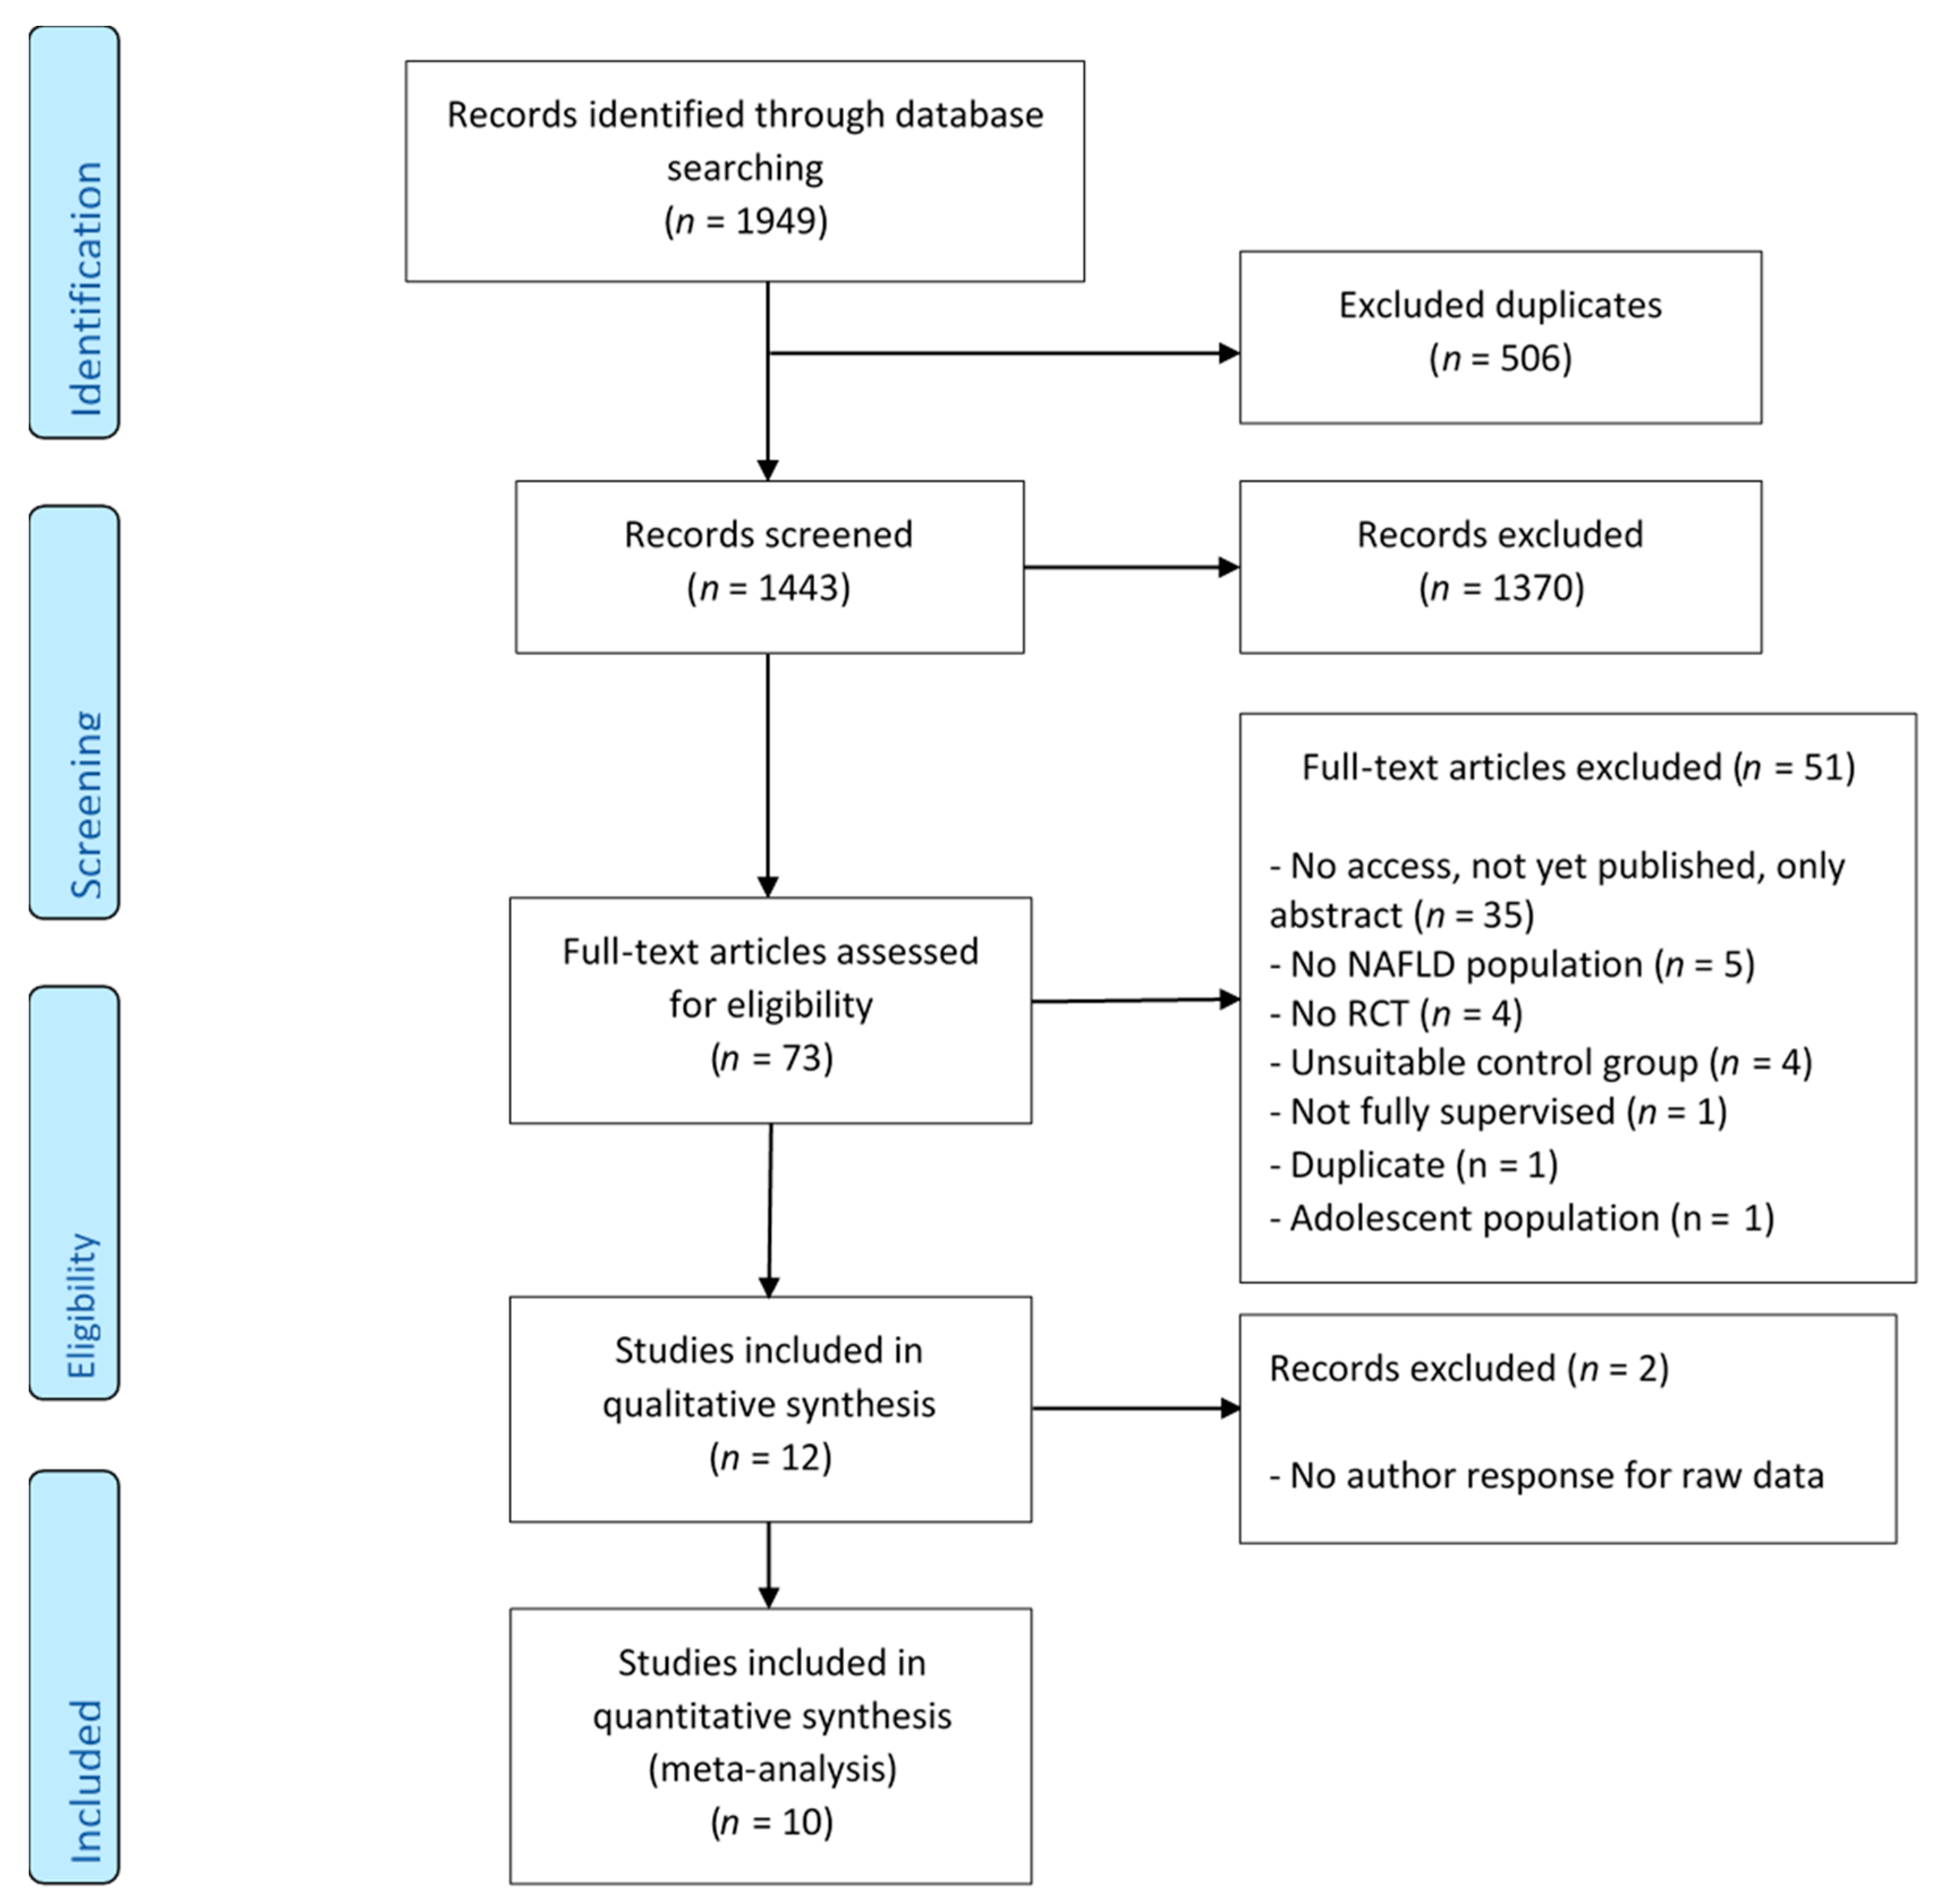
3.1. Search Results
3.2. Meta-Analysis
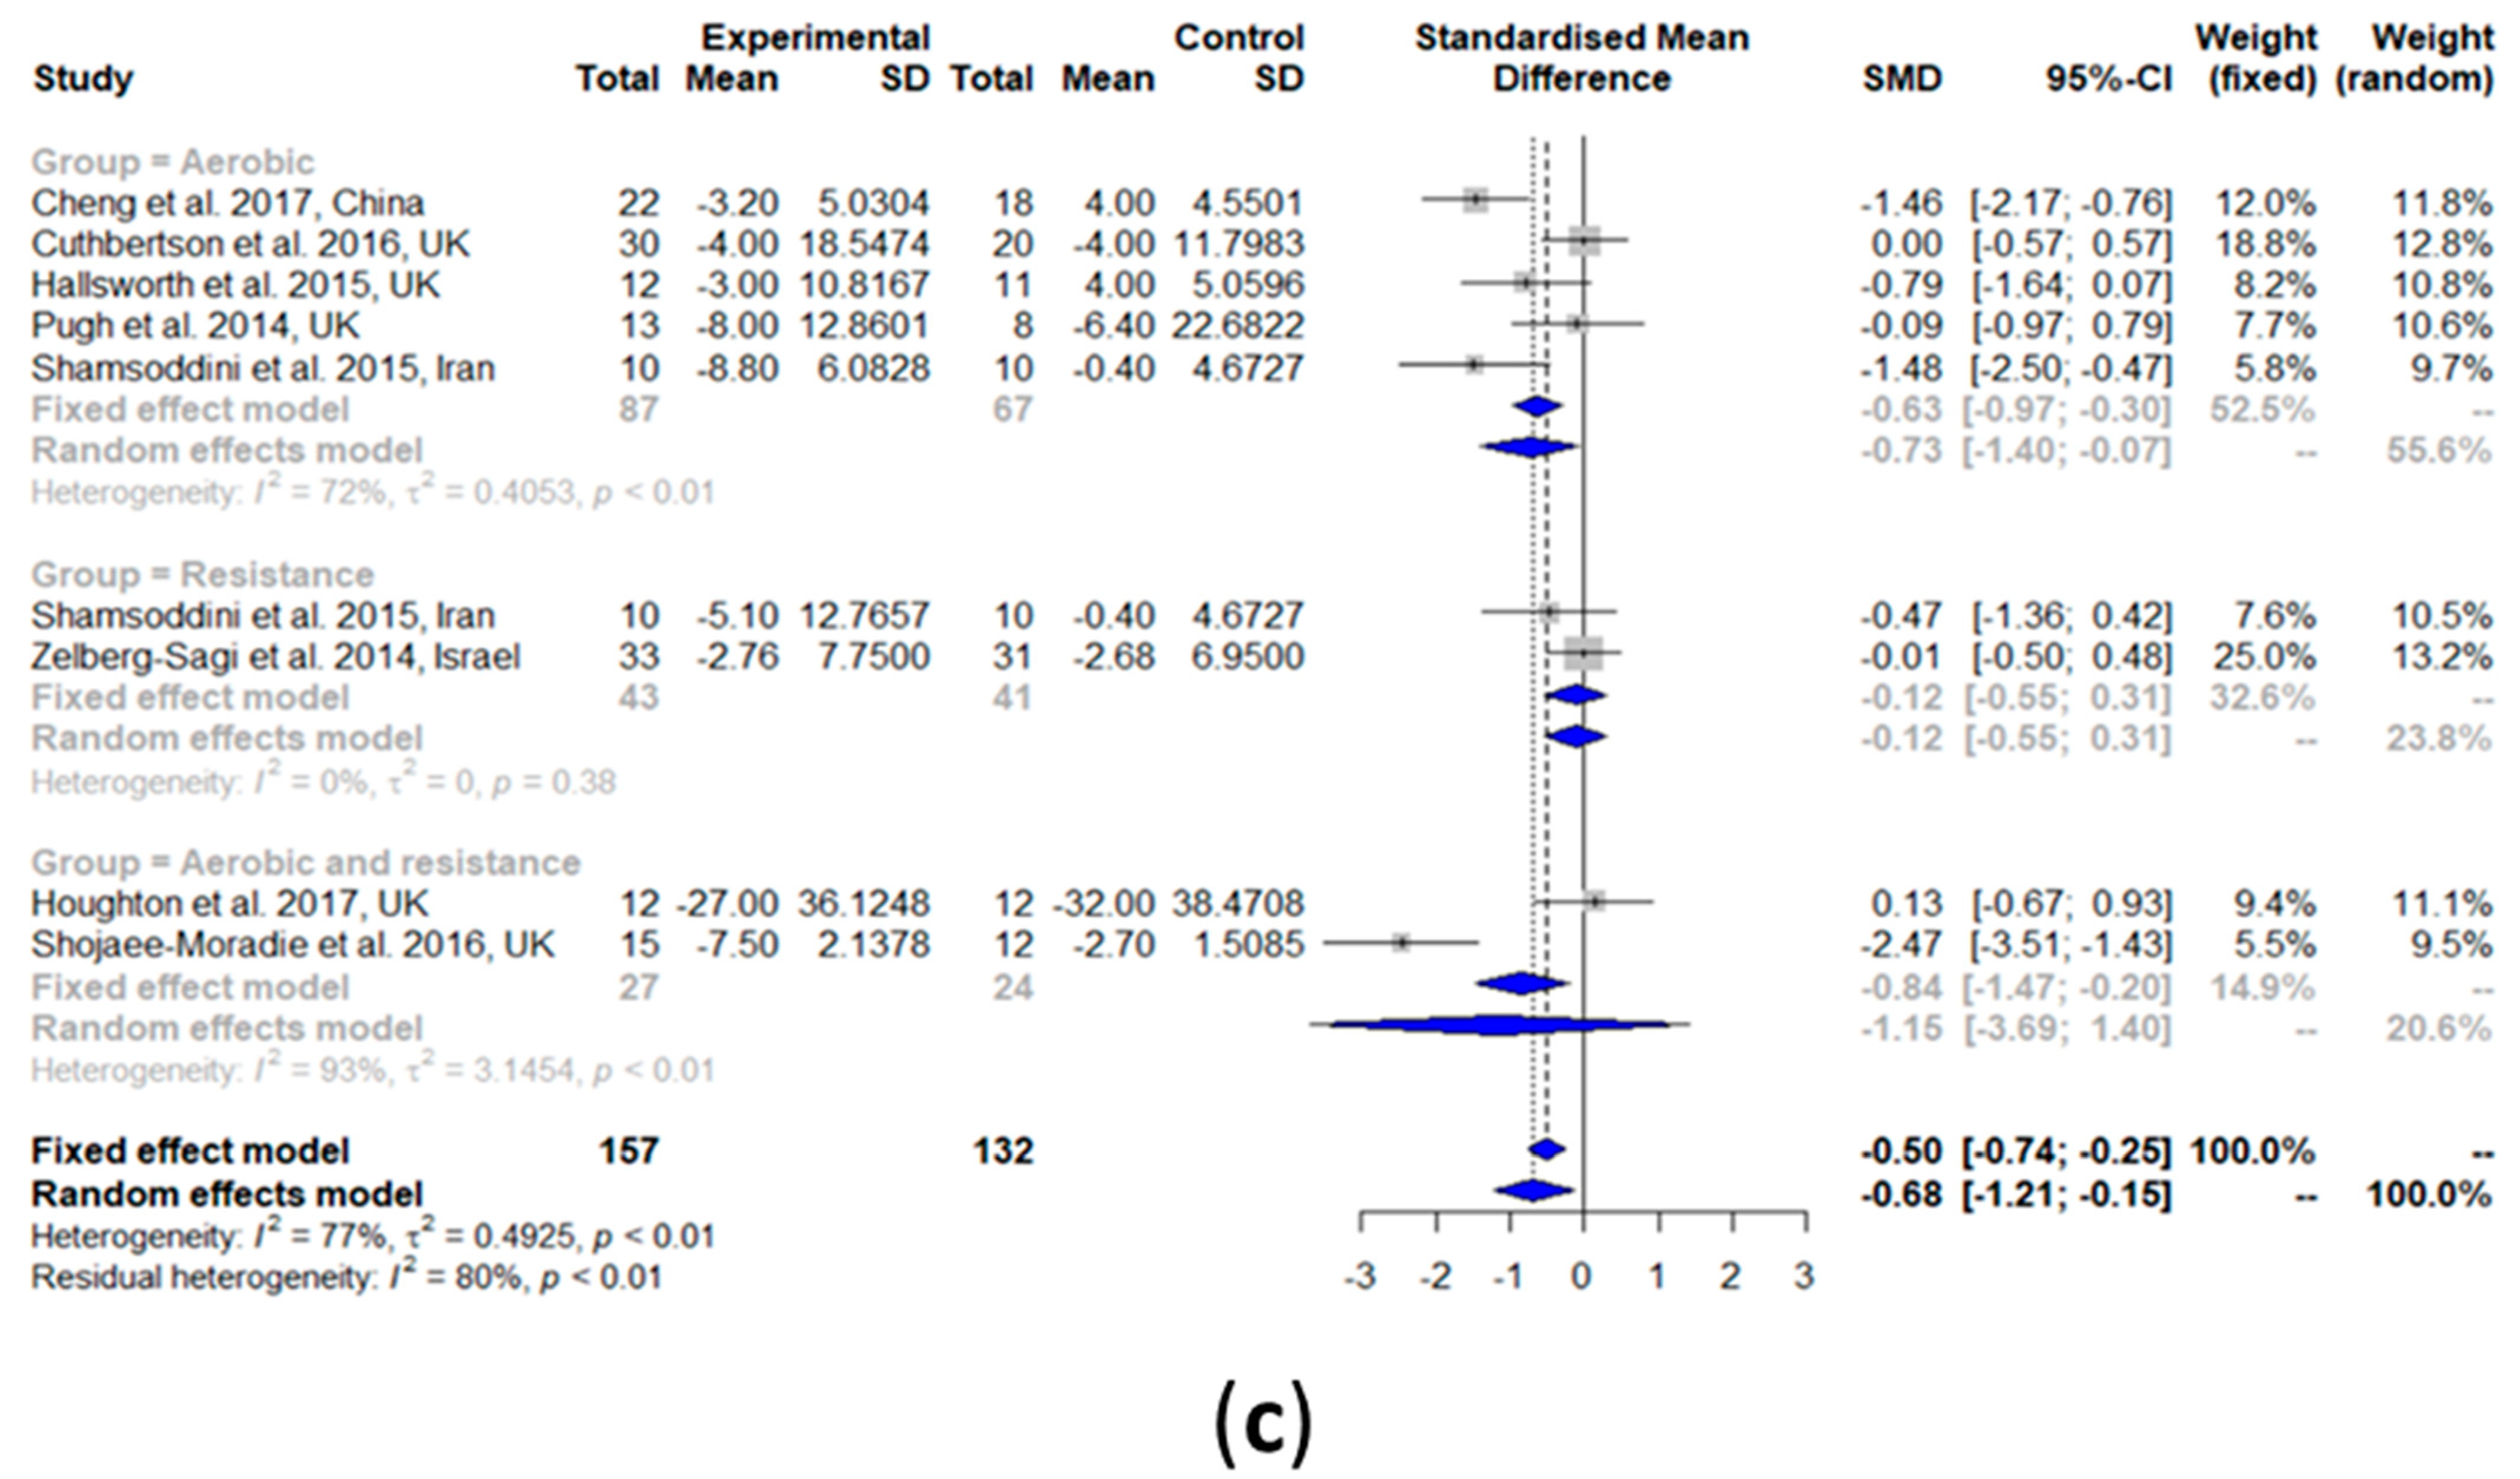
3.2.1. Intrahepatic Lipid (IHL) Content
3.2.2. Alanine Aminotransaminase (ALT)
3.2.3. Aspartate Aminotransaminase (AST)
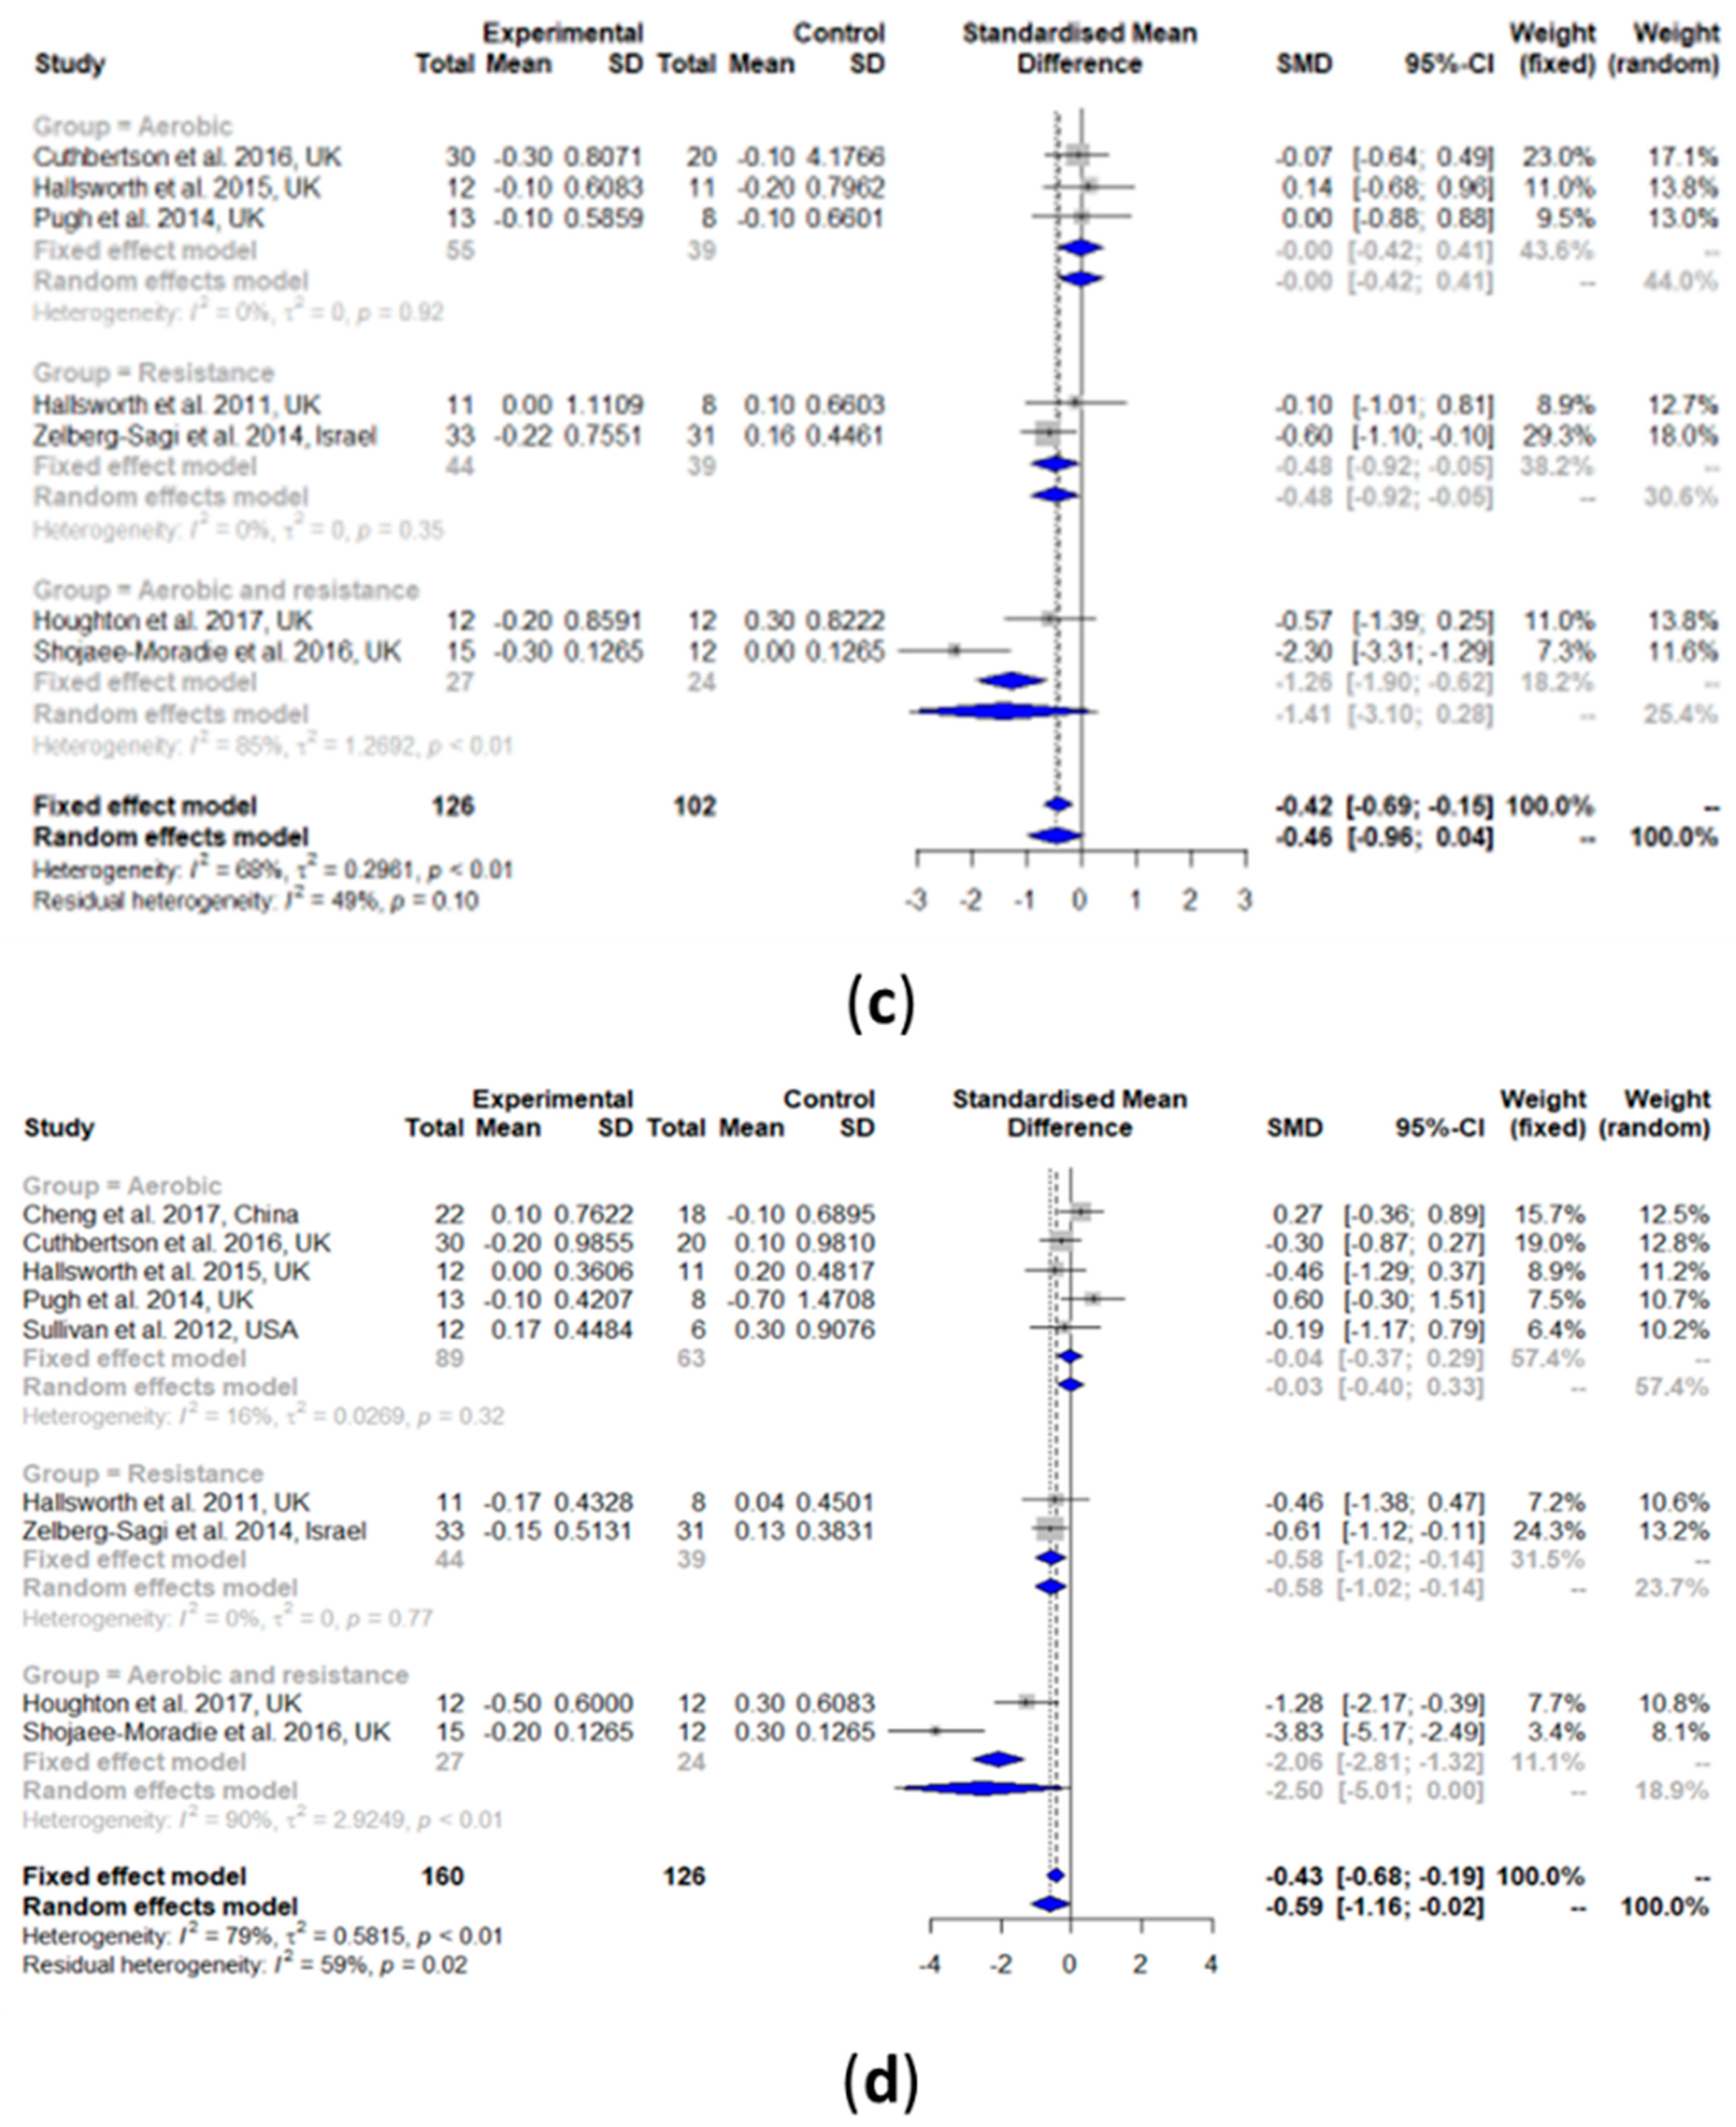
3.2.4. High-Density Lipoprotein Cholesterol (HDL-C)
3.2.5. Low-Density Lipoprotein Cholesterol (LDL-C)
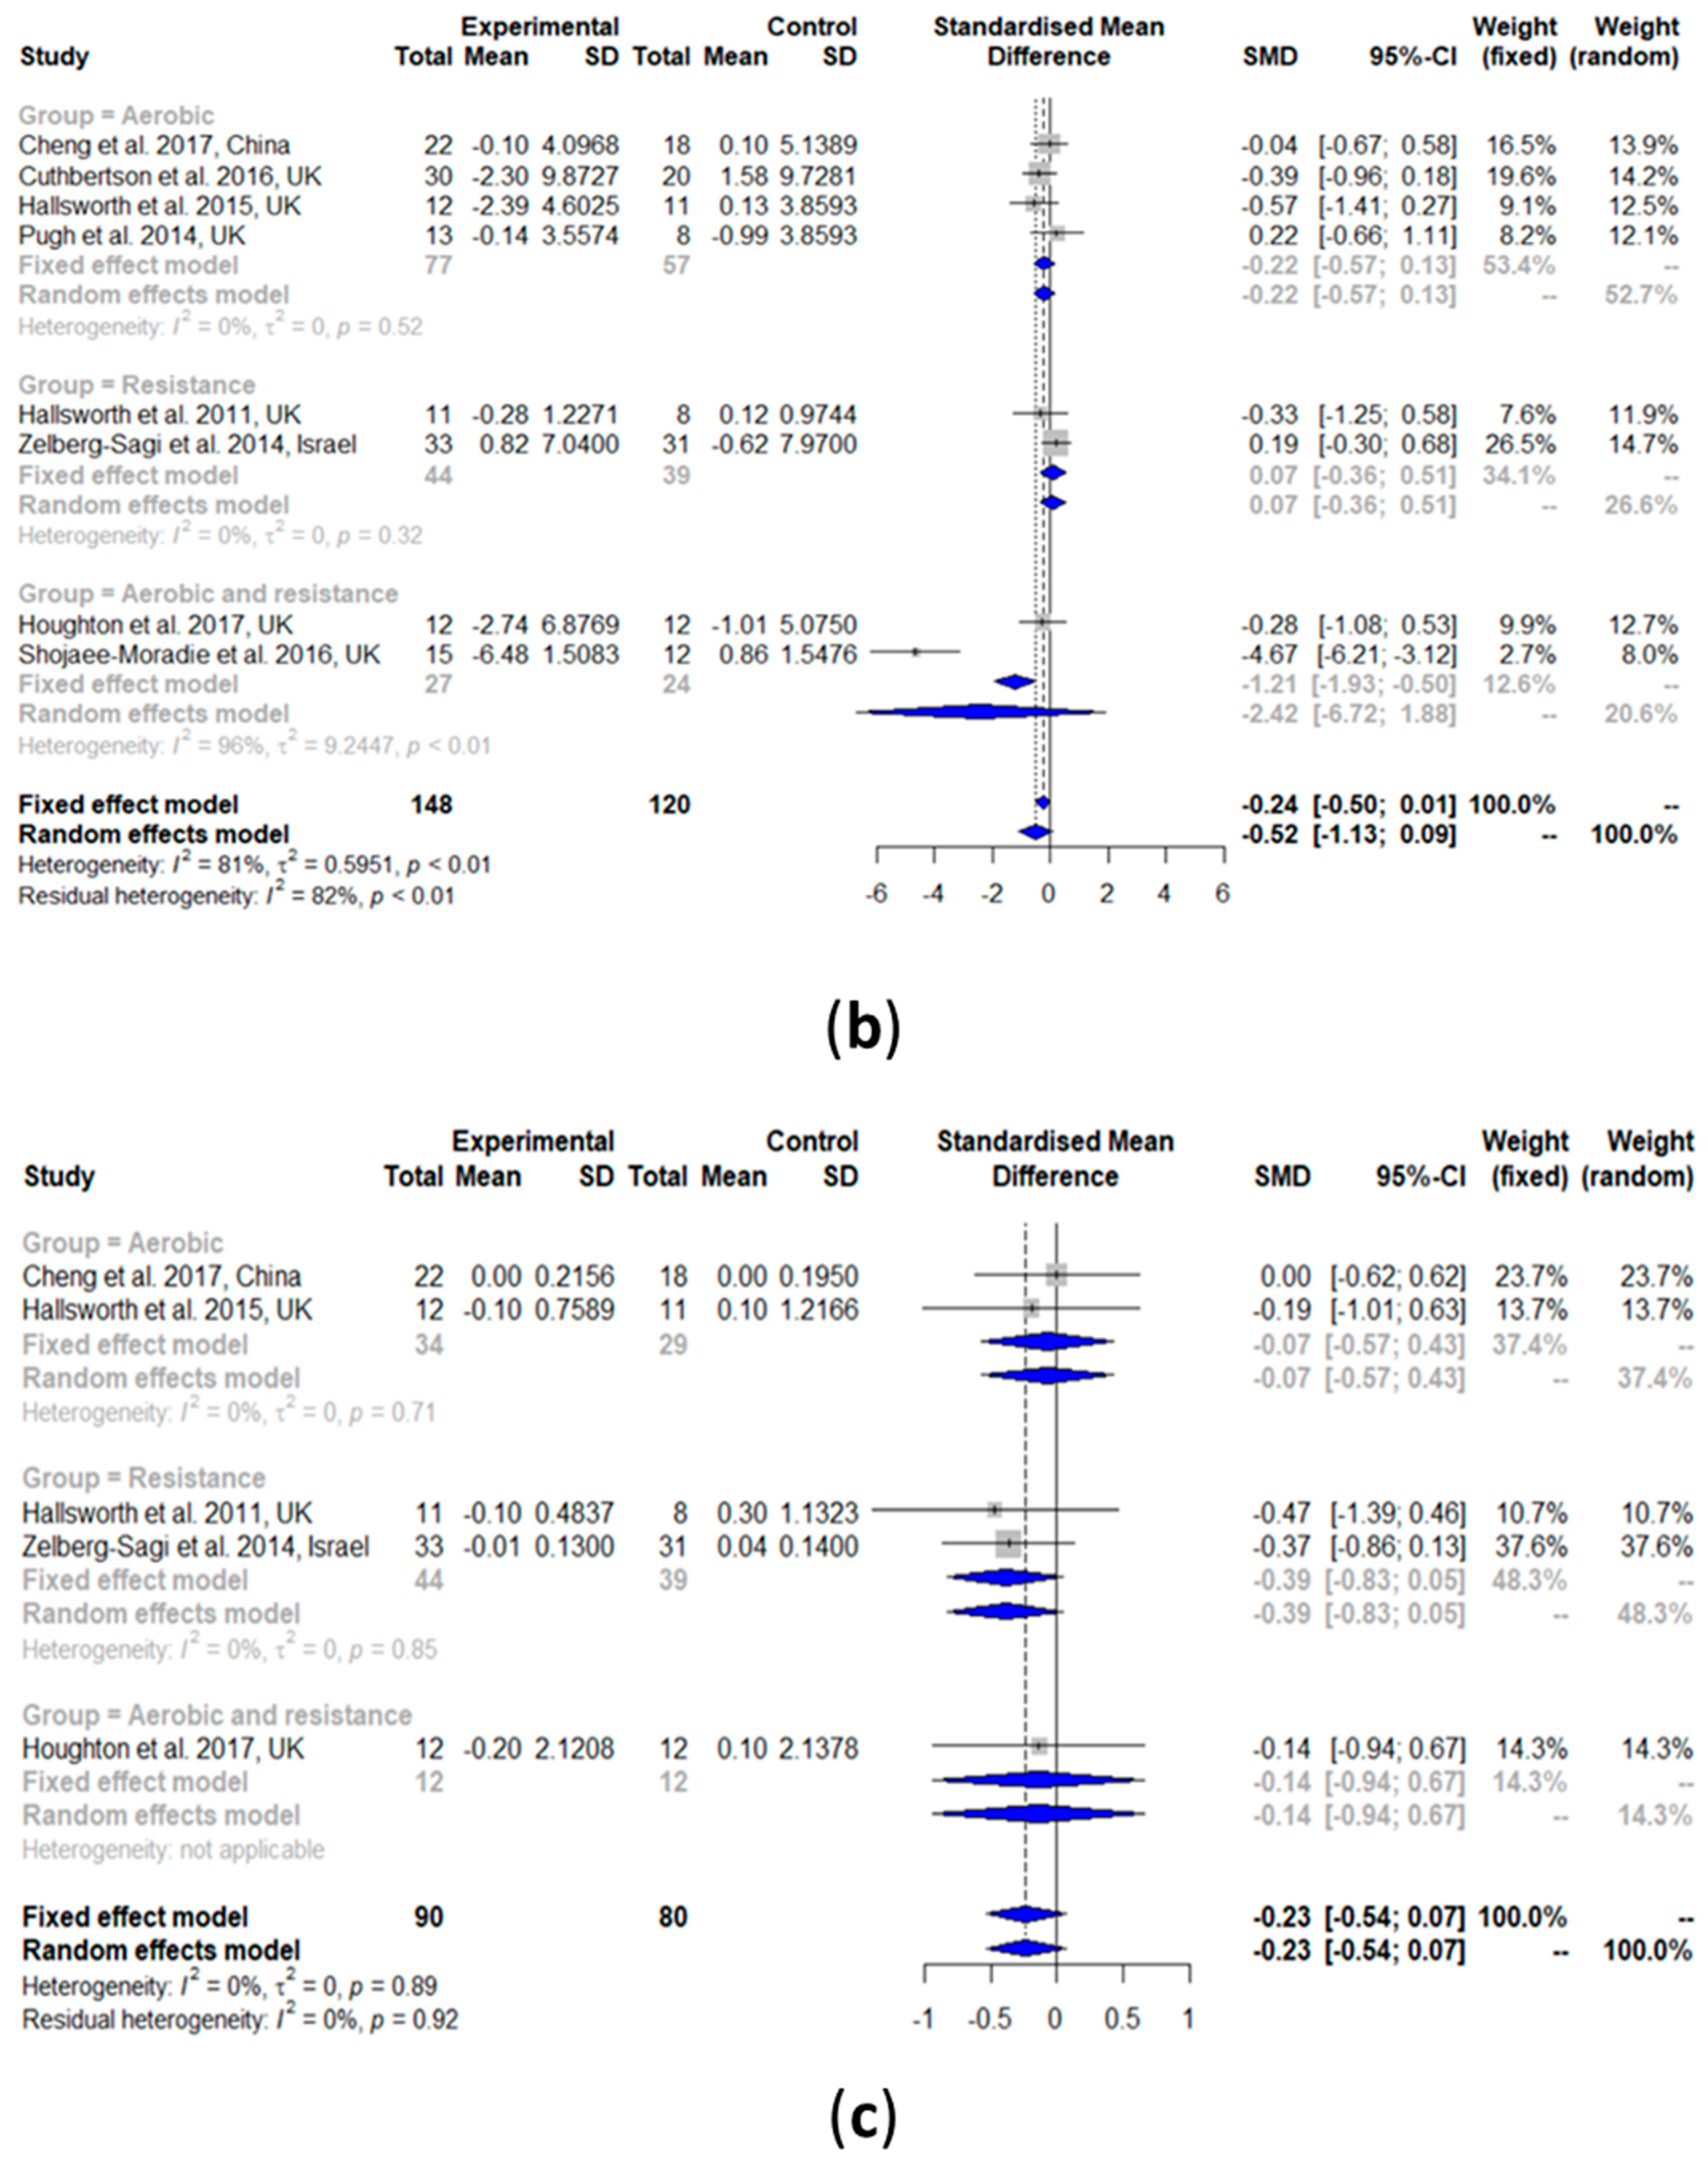
3.2.6. Total Cholesterol (TC)
3.2.7. Triglyceride (TG)
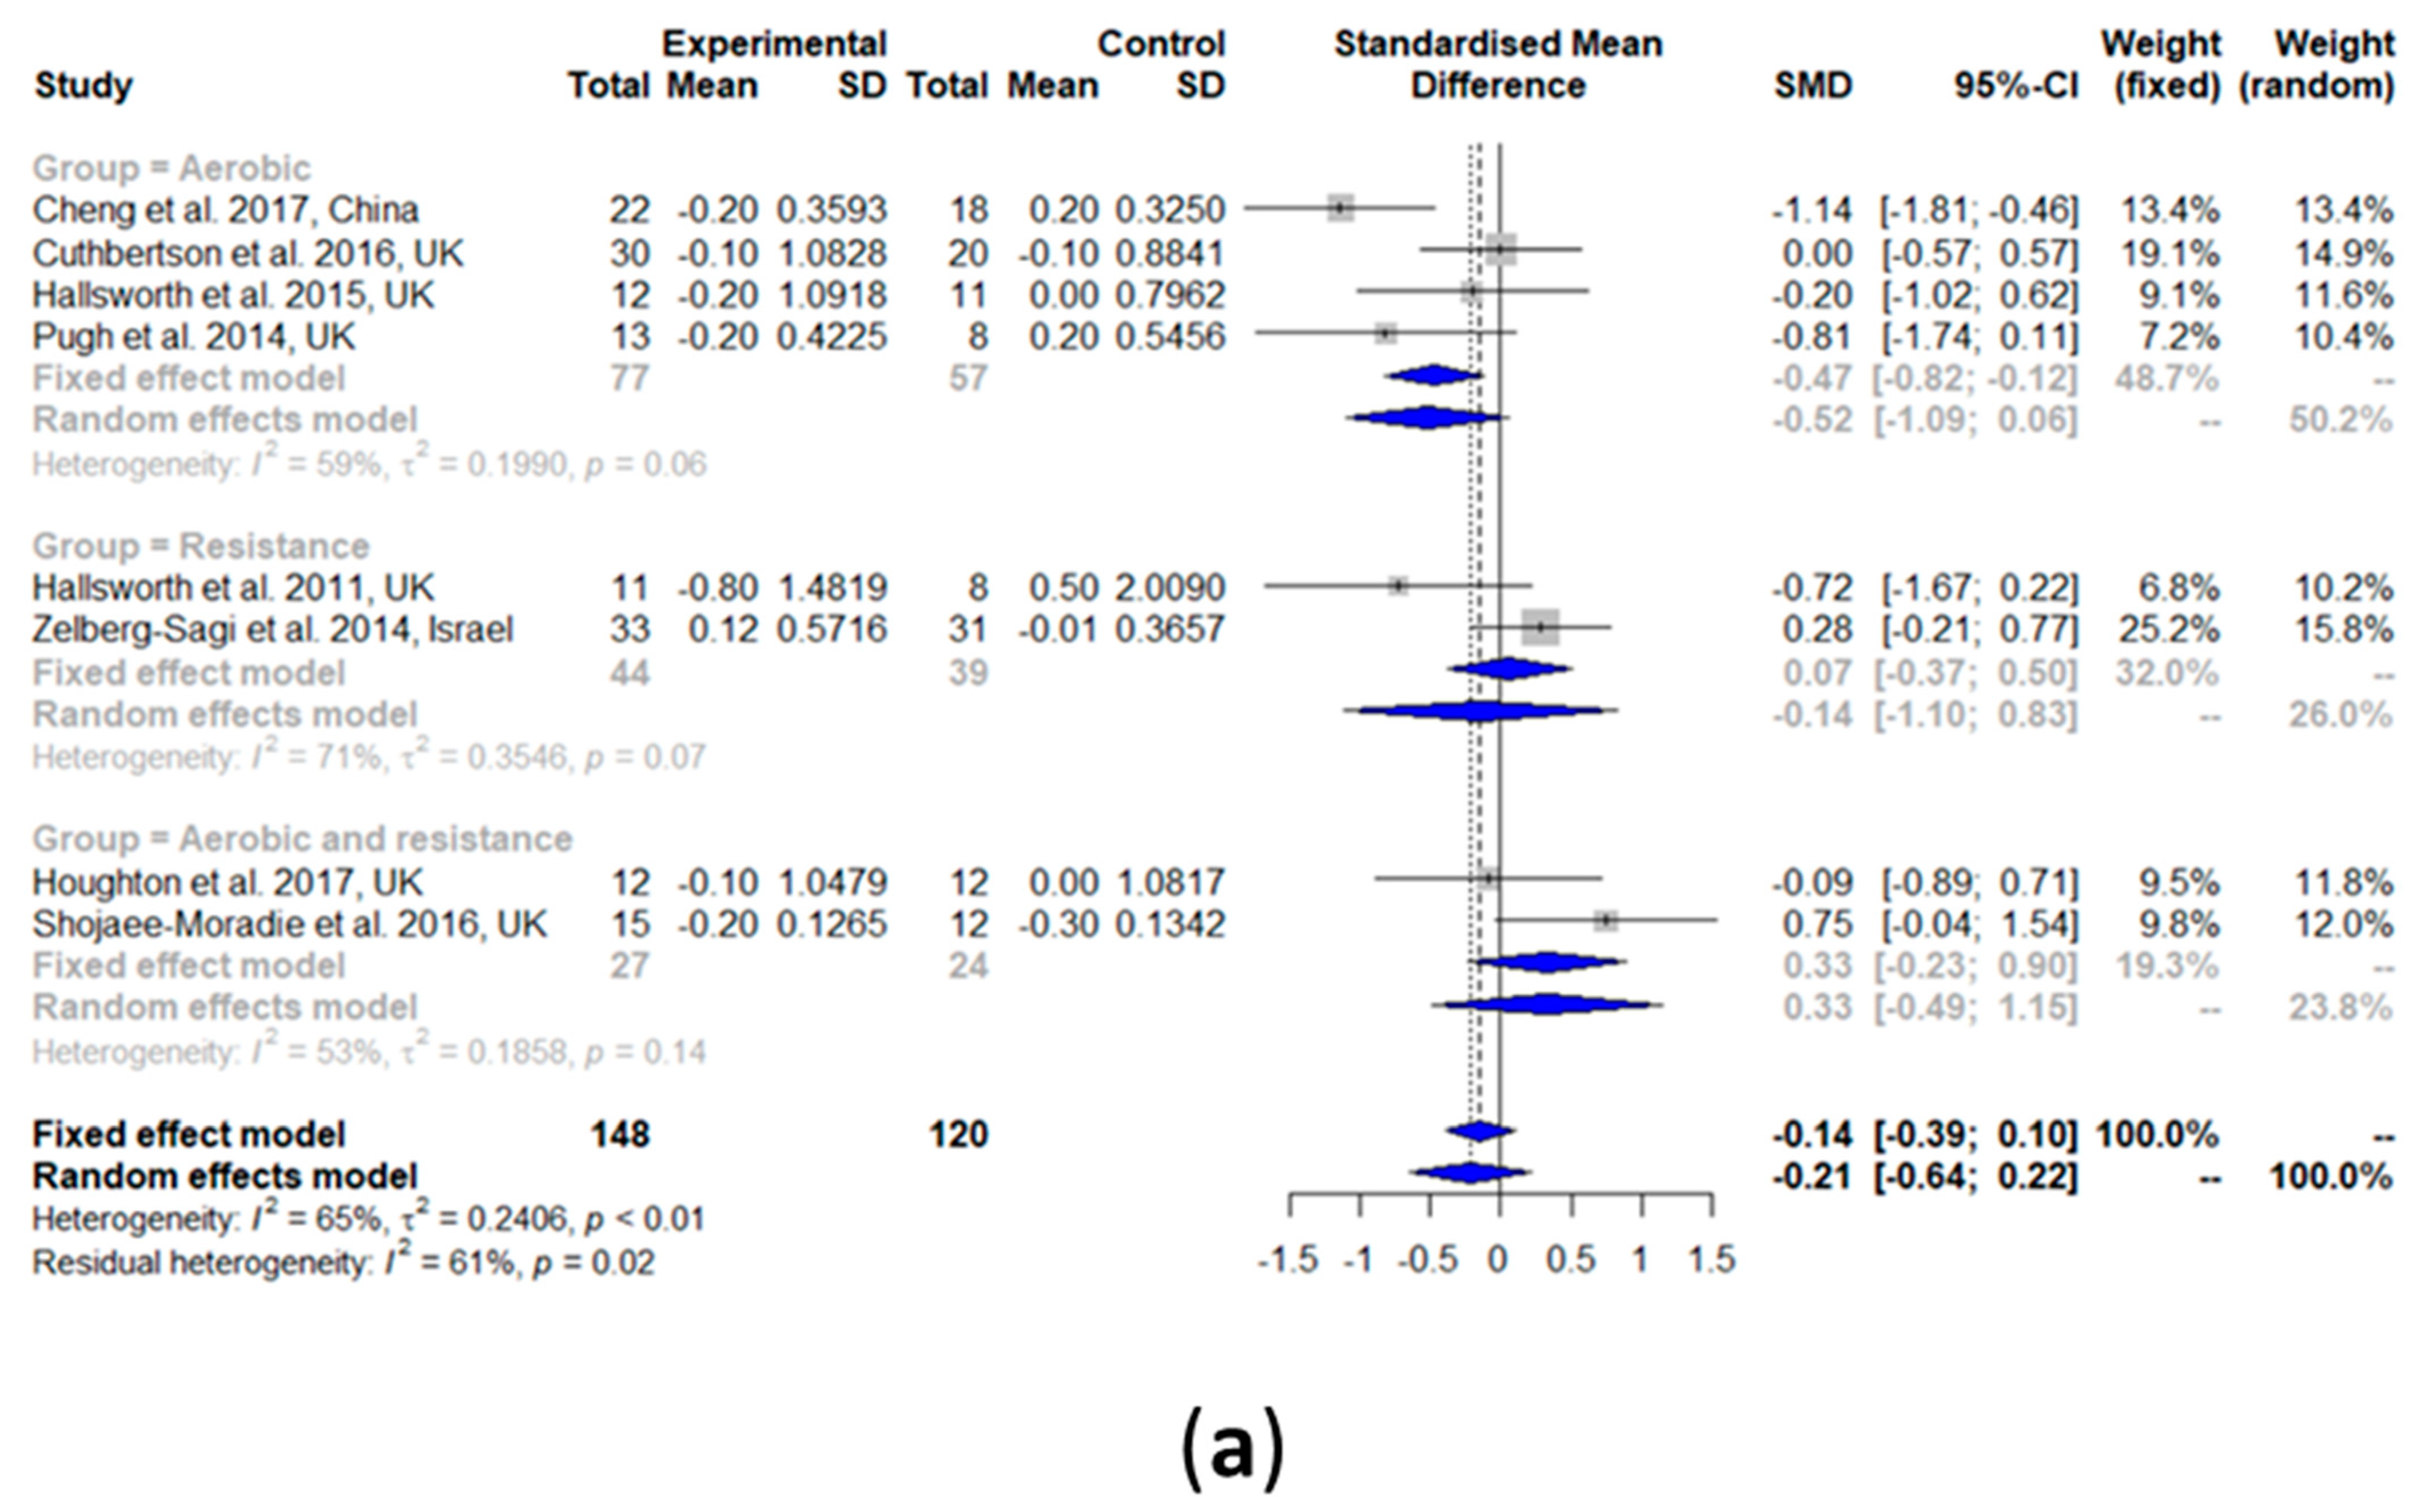
3.2.8. Fasting Glucose
3.2.9. Fasting Insulin
3.2.10. Glycated Hemoglobin (HbA1c)
3.3. Detection of Bias: Funnel Pots
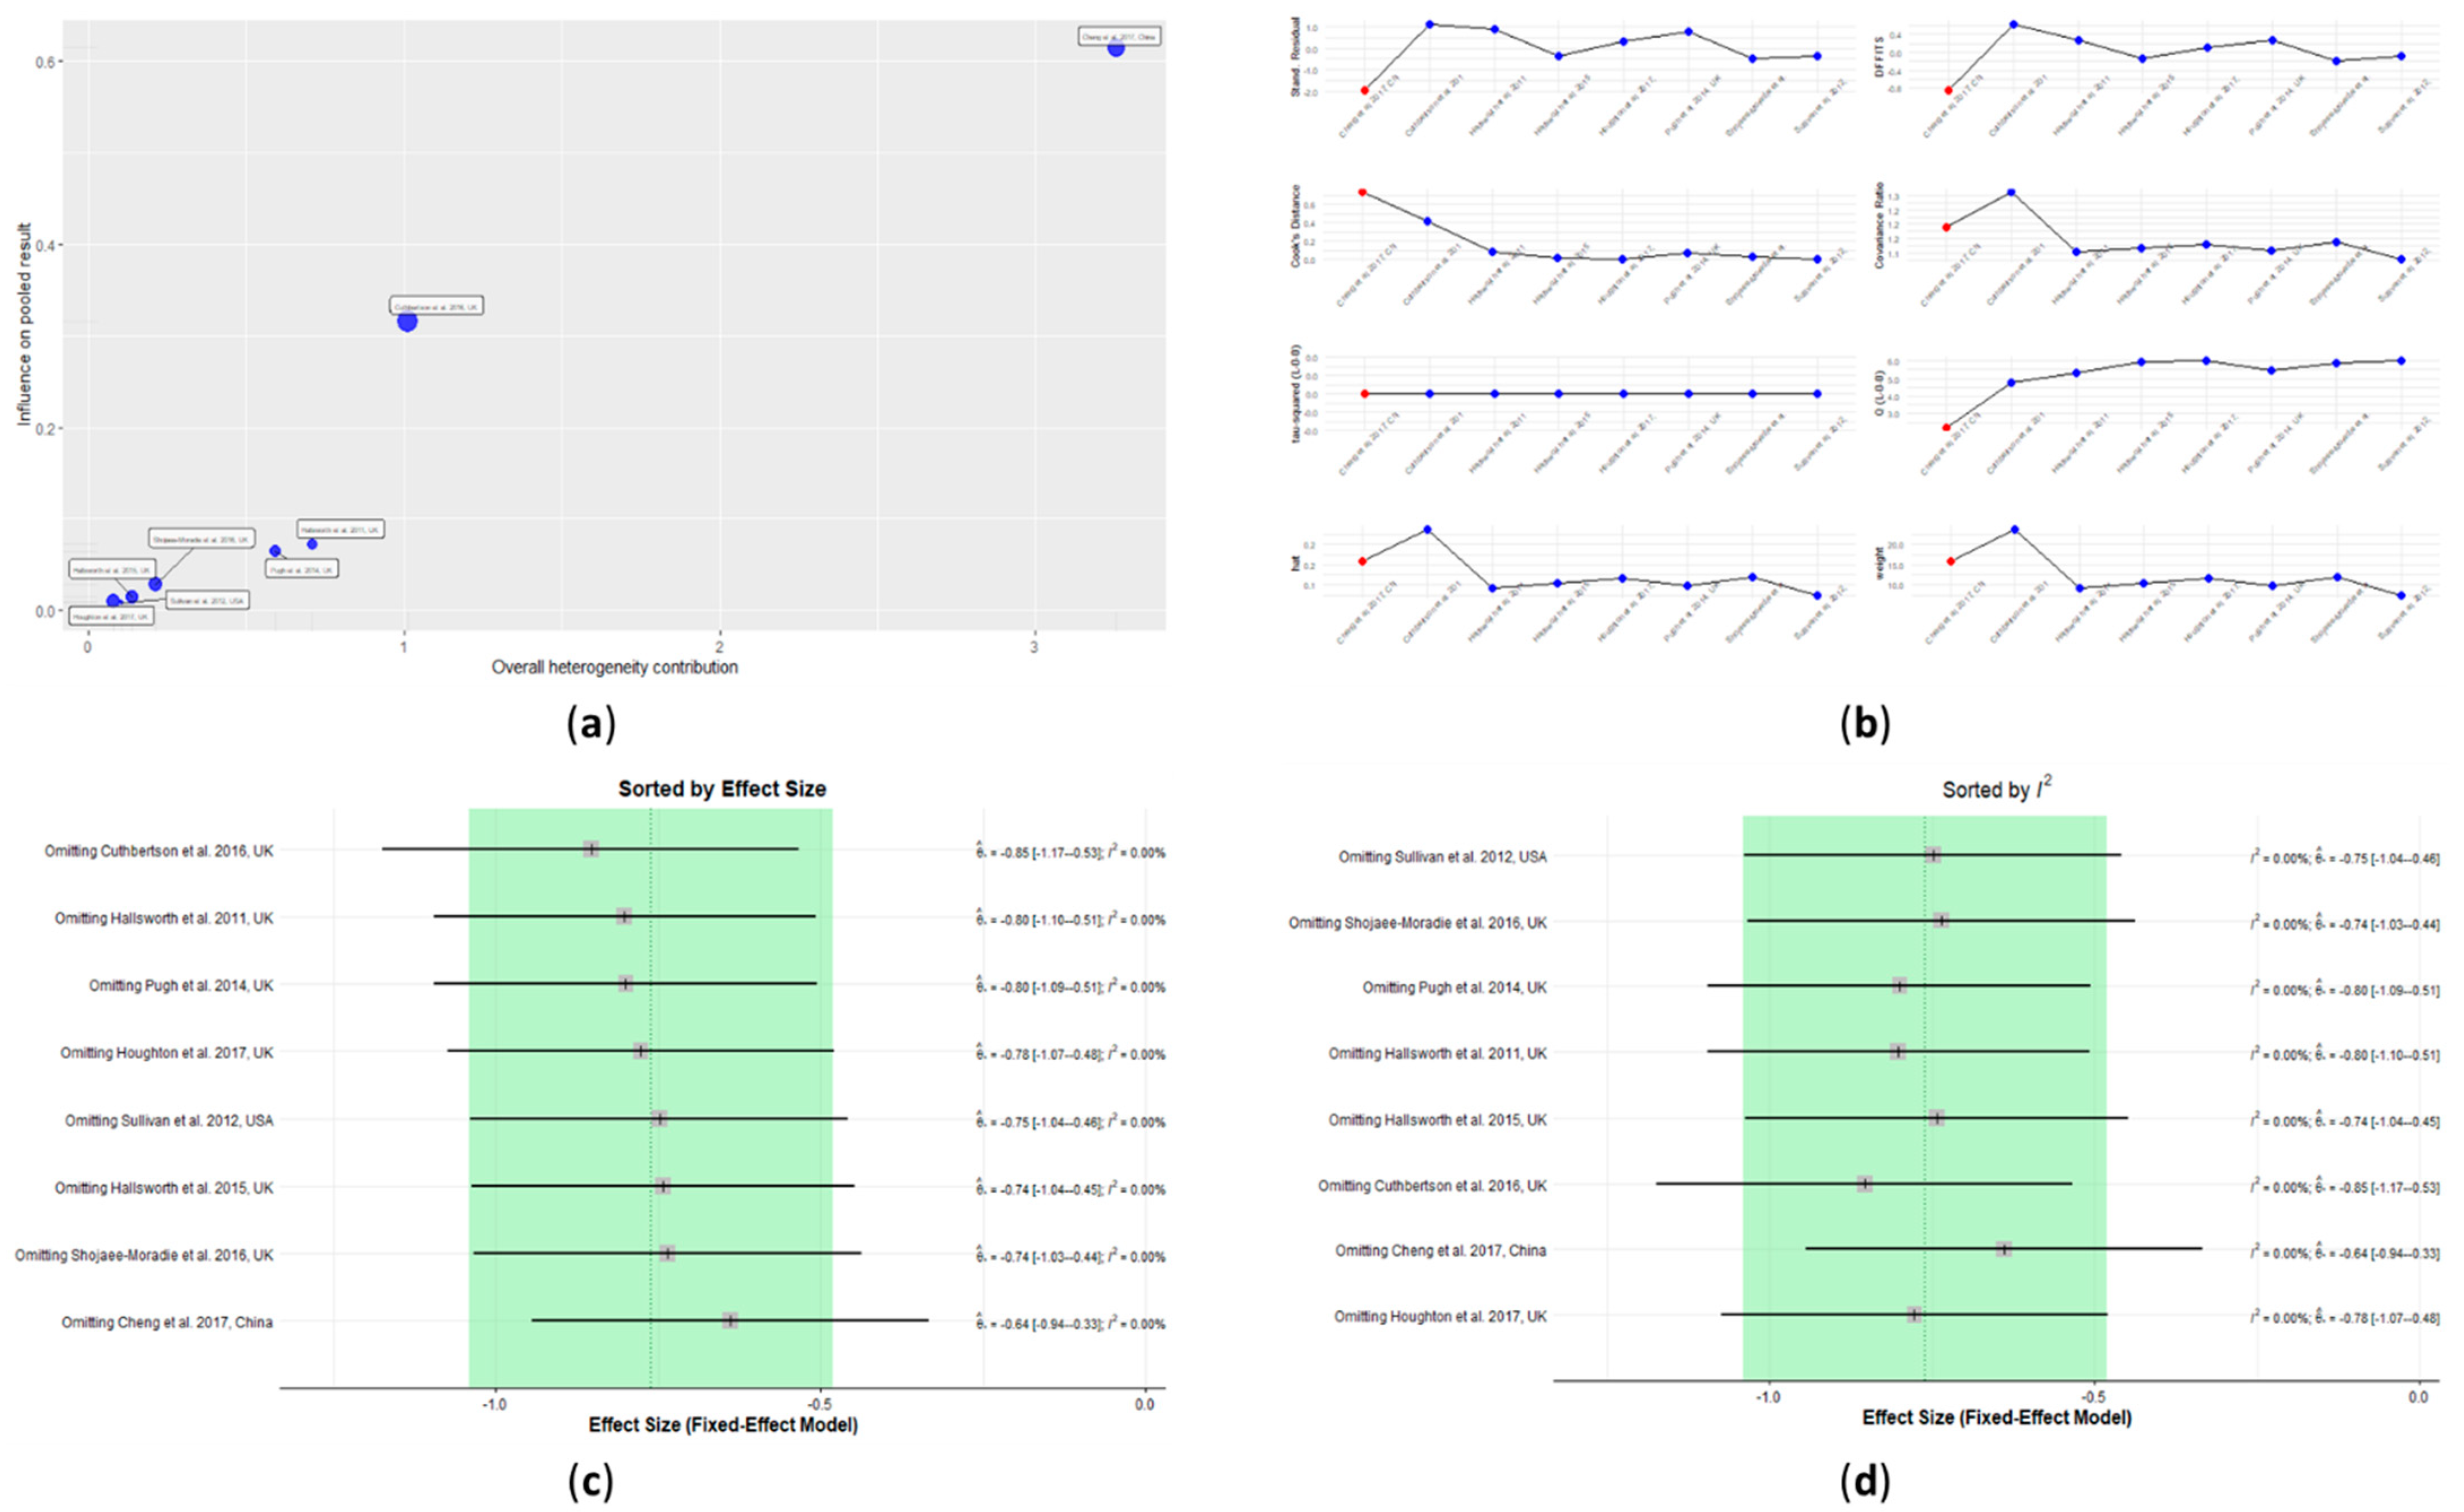
3.4. Outlier Detection
3.5. Influence Analysis
4. Discussion
5. Conclusions
Supplementary Materials
Author Contributions
Funding
Data Availability Statement
Acknowledgments
Conflicts of Interest
References
- Maurice, J.; Manousou, P. Non-alcoholic fatty liver disease. Clin. Med. 2018, 18, 245. [Google Scholar] [CrossRef]
- Younossi, Z.; Anstee, Q.M.; Marietti, M.; Hardy, T.; Henry, L.; Eslam, M.; George, J.; Bugianesi, E. Global burden of NAFLD and NASH: Trends, predictions, risk factors and prevention. Nat. Rev. Gastroenterol. Hepatol. 2018, 15, 11. [Google Scholar] [CrossRef]
- Cotter, T.G.; Rinella, M. Nonalcoholic Fatty Liver Disease 2020: The State of the Disease. Gastroenterology 2020, 158, 1851–1864. [Google Scholar] [CrossRef]
- Farrell, G.C.; Larter, C.Z. Nonalcoholic fatty liver disease: From steatosis to cirrhosis. Hepatology 2006, 43, S99–S112. [Google Scholar] [CrossRef]
- Wong, R.J.; Cheung, R.; Ahmed, A. Nonalcoholic steatohepatitis is the most rapidly growing indication for liver transplantation in patients with hepatocellular carcinoma in the US. Hepatology 2014, 59, 2188–2195. [Google Scholar] [CrossRef]
- Tiniakos, D.G.; Vos, M.B.; Brunt, E.M. Nonalcoholic fatty liver disease: Pathology and pathogenesis. Annu. Rev. Pathol. Mech. Dis. 2010, 5, 145–171. [Google Scholar] [CrossRef] [PubMed] [Green Version]
- Miele, L.; Valenza, V.; La Torre, G.; Montalto, M.; Cammarota, G.; Ricci, R.; Masciana, R.; Forgione, A.; Gabrieli, M.L.; Perotti, G. Increased intestinal permeability and tight junction alterations in nonalcoholic fatty liver disease. Hepatology 2009, 49, 1877–1887. [Google Scholar] [CrossRef]
- Sabaté, J.; Jouët, P.; Harnois, F.; Mechler, C.; Msika, S.; Grossin, M.; Coffin, B. High prevalence of small intestinal bacterial overgrowth in patients with morbid obesity: A contributor to severe hepatic steatosis. Obes. Surg. 2008, 18, 371–377. [Google Scholar] [CrossRef]
- European Association for The Study of The Liver. European Association for the Study of Diabetes (EASD EASL-EASD-EASO Clinical Practice Guidelines for the management of non-alcoholic fatty liver disease. Obes. Facts 2016, 9, 65–90. [Google Scholar] [CrossRef] [Green Version]
- Katsagoni, C.N.; Georgoulis, M.; Papatheodoridis, G.V.; Panagiotakos, D.B.; Kontogianni, M.D. Effects of lifestyle interventions on clinical characteristics of patients with non-alcoholic fatty liver disease: A meta-analysis. Metab. Clin. Exp. 2017, 68, 119–132. [Google Scholar] [CrossRef] [Green Version]
- Chen, S.; Liu, C.; Li, S.; Huang, H.; Tsai, C.; Jou, H. Effects of therapeutic lifestyle program on ultrasound-diagnosed nonalcoholic fatty liver disease. J. Chin. Med. Assoc. 2008, 71, 551–558. [Google Scholar] [CrossRef] [Green Version]
- Promrat, K.; Kleiner, D.E.; Niemeier, H.M.; Jackvony, E.; Kearns, M.; Wands, J.R.; Fava, J.L.; Wing, R.R. Randomized controlled trial testing the effects of weight loss on nonalcoholic steatohepatitis. Hepatology 2010, 51, 121–129. [Google Scholar] [CrossRef]
- Kenneally, S.; Sier, J.H.; Moore, J.B. Efficacy of dietary and physical activity intervention in non-alcoholic fatty liver disease: A systematic review. BMJ Open Gastroenterol. 2017, 4, e000139. [Google Scholar] [CrossRef] [PubMed]
- Golabi, P.; Locklear, C.T.; Austin, P.; Afdhal, S.; Byrns, M.; Gerber, L.; Younossi, Z.M. Effectiveness of exercise in hepatic fat mobilization in non-alcoholic fatty liver disease: Systematic review. World J. Gastroenterol. 2016, 22, 6318. [Google Scholar] [CrossRef] [PubMed]
- van der Heijden, G.; Wang, Z.J.; Chu, Z.D.; Sauer, P.J.; Haymond, M.W.; Rodriguez, L.M.; Sunehag, A.L. A 12-week aerobic exercise program reduces hepatic fat accumulation and insulin resistance in obese, Hispanic adolescents. Obesity 2010, 18, 384–390. [Google Scholar] [CrossRef] [PubMed]
- Keating, S.E.; Hackett, D.A.; George, J.; Johnson, N.A. Exercise and non-alcoholic fatty liver disease: A systematic review and meta-analysis. J. Hepatol. 2012, 57, 157–166. [Google Scholar] [CrossRef]
- Davoodi, M. The effect of eight weeks selected aerobic exercise on liver parenchyma and liver enzymes (AST, ALT) of fat liver patients. J. Shahrekord Univ. Med. Sci. 2012, 14, e31434. [Google Scholar]
- St. George, A.; Bauman, A.; Johnston, A.; Farrell, G.; Chey, T.; George, J. Independent effects of physical activity in patients with nonalcoholic fatty liver disease. Hepatology 2009, 50, 68–76. [Google Scholar] [CrossRef] [PubMed]
- Hallsworth, K.; Fattakhova, G.; Hollingsworth, K.G.; Thoma, C.; Moore, S.; Taylor, R.; Day, C.P.; Trenell, M.I. Resistance exercise reduces liver fat and its mediators in non-alcoholic fatty liver disease independent of weight loss. Gut 2011, 60, 1278–1283. [Google Scholar] [CrossRef]
- Kelley, G.A.; Kelley, K.S. Efficacy of aerobic exercise on coronary heart disease risk factors. Prev. Cardiol. 2008, 11, 71–75. [Google Scholar] [CrossRef] [Green Version]
- Castaneda, C.; Layne, J.E.; Munoz-Orians, L.; Gordon, P.L.; Walsmith, J.; Foldvari, M.; Roubenoff, R.; Tucker, K.L.; Nelson, M.E. A randomized controlled trial of resistance exercise training to improve glycemic control in older adults with type 2 diabetes. Diabetes Care 2002, 25, 2335–2341. [Google Scholar] [CrossRef] [Green Version]
- Hatami, M.T.; Eftekhari, E. The Effect of Combined Aerobic and Resistance Training on Hepatic Enzymes in Males With Nonalcoholic Fatty Liver. Biotechnol. Health Sci. 2016, 3, 25–29. [Google Scholar] [CrossRef] [Green Version]
- Sohail, M.U.; Yassine, H.M.; Sohail, A.; Al Thani, A.A. Impact of physical exercise on gut microbiome, inflammation, and the pathobiology of metabolic disorders. Rev. Diabet. Stud. 2019, 15, 35. [Google Scholar] [CrossRef] [Green Version]
- Patel, N.S.; Doycheva, I.; Peterson, M.R.; Hooker, J.; Kisselva, T.; Schnabl, B.; Seki, E.; Sirlin, C.B.; Loomba, R. Effect of weight loss on magnetic resonance imaging estimation of liver fat and volume in patients with nonalcoholic steatohepatitis. Clin. Gastroenterol. Hepatol. 2015, 13, 561–568.e1. [Google Scholar] [CrossRef] [Green Version]
- Wong, V.W.; Chan, R.S.; Wong, G.L.; Cheung, B.H.; Chu, W.C.; Yeung, D.K.; Chim, A.M.; Lai, J.W.; Li, L.S.; Sea, M.M. Community-based lifestyle modification programme for non-alcoholic fatty liver disease: A randomized controlled trial. J. Hepatol. 2013, 59, 536–542. [Google Scholar] [CrossRef]
- Page, M.J.; McKenzie, J.E.; Bossuyt, P.M.; Boutron, I.; Hoffmann, T.C.; Mulrow, C.D.; Shamseer, L.; Tetzlaff, J.M.; Akl, E.A.; Brennan, S.E. The PRISMA 2020 statement: An updated guideline for reporting systematic reviews. BMJ 2021, 372, n71. [Google Scholar] [CrossRef]
- Ouzzani, M.; Hammady, H.; Fedorowicz, Z.; Elmagarmid, A. Rayyan—A web and mobile app for systematic reviews. Syst. Rev. 2016, 5, 210. [Google Scholar] [CrossRef] [Green Version]
- Higgins, J.P.; Altman, D.G.; Gøtzsche, P.C.; Jüni, P.; Moher, D.; Oxman, A.D.; Savović, J.; Schulz, K.F.; Weeks, L.; Sterne, J.A. The Cochrane Collaboration’s tool for assessing risk of bias in randomised trials. BMJ 2011, 343, d5928. [Google Scholar] [CrossRef] [Green Version]
- Higgins, J.P.; Thomas, J.; Chandler, J.; Cumpston, M.; Li, T.; Page, M.J.; Welch, V.A. (Eds.) Cochrane Handbook for Systematic Reviews of Interventions; Version 6.1; Updated September 2020; Cochrane: London, UK, 2020. [Google Scholar]
- Kossmeier, M.; Tran, U.S.; Voracek, M. Visual inference for the funnel plot in meta-analysis. Z. Psychol. 2019, 227, 83–89. [Google Scholar] [CrossRef]
- Viechtbauer, W.; Cheung, M.W. Outlier and influence diagnostics for meta-analysis. Res. Synth. Methods 2010, 1, 112–125. [Google Scholar] [CrossRef]
- Winn, N.C.; Liu, Y.; Rector, R.S.; Parks, E.J.; Ibdah, J.A.; Kanaley, J.A. Energy-matched moderate and high intensity exercise training improves nonalcoholic fatty liver disease risk independent of changes in body mass or abdominal adiposity—A randomized trial. Metab. Clin. Exp. 2018, 78, 128–140. [Google Scholar] [CrossRef] [PubMed]
- Zhang, H.; He, J.; Pan, L.; Ma, Z.; Han, C.; Chen, C.; Chen, Z.; Han, H.; Chen, S.; Sun, Q. Effects of moderate and vigorous exercise on nonalcoholic fatty liver disease: A randomized clinical trial. JAMA Intern. Med. 2016, 176, 1074–1082. [Google Scholar] [CrossRef]
- Shamsoddini, A.; Sobhani, V.; Chehreh, M.E.G.; Alavian, S.M.; Zaree, A. Effect of aerobic and resistance exercise training on liver enzymes and hepatic fat in Iranian men with nonalcoholic fatty liver disease. Hepat. Mon. 2015, 15, e31434. [Google Scholar] [CrossRef] [Green Version]
- Hallsworth, K.; Thoma, C.; Hollingsworth, K.G.; Cassidy, S.; Anstee, Q.M.; Day, C.P.; Trenell, M.I. Modified high-intensity interval training reduces liver fat and improves cardiac function in non-alcoholic fatty liver disease: A randomized controlled trial. Clin. Sci. 2015, 129, 1097–1105. [Google Scholar] [CrossRef] [PubMed]
- Cheng, S.; Ge, J.; Zhao, C.; Le, S.; Yang, Y.; Ke, D.; Wu, N.; Tan, X.; Zhang, X.; Du, X. Effect of aerobic exercise and diet on liver fat in pre-diabetic patients with non-alcoholic-fatty-liver-disease: A randomized controlled trial. Sci. Rep. 2017, 7, 15952. [Google Scholar] [CrossRef] [PubMed] [Green Version]
- Cuthbertson, D.J.; Shojaee-Moradie, F.; Sprung, V.S.; Jones, H.; Pugh, C.J.; Richardson, P.; Kemp, G.J.; Barrett, M.; Jackson, N.C.; Thomas, E.L. Dissociation between exercise-induced reduction in liver fat and changes in hepatic and peripheral glucose homoeostasis in obese patients with non-alcoholic fatty liver disease. Clin. Sci. 2016, 130, 93–104. [Google Scholar] [CrossRef] [Green Version]
- Pugh, C.J.; Sprung, V.S.; Kemp, G.J.; Richardson, P.; Shojaee-Moradie, F.; Umpleby, A.M.; Green, D.J.; Cable, N.T.; Jones, H.; Cuthbertson, D.J. Exercise training reverses endothelial dysfunction in nonalcoholic fatty liver disease. Am. J. Physiol.-Heart Circ. Physiol. 2014, 307, H1298–H1306. [Google Scholar] [CrossRef] [Green Version]
- Shojaee-Moradie, F.; Cuthbertson, D.J.; Barrett, M.; Jackson, N.C.; Herring, R.; Thomas, E.L.; Bell, J.; Kemp, G.J.; Wright, J.; Umpleby, A.M. Exercise training reduces liver fat and increases rates of VLDL clearance but not VLDL production in NAFLD. J. Clin. Endocrinol. Metab. 2016, 101, 4219–4228. [Google Scholar] [CrossRef] [Green Version]
- Zelber-Sagi, S.; Buch, A.; Yeshua, H.; Vaisman, N.; Webb, M.; Harari, G.; Kis, O.; Fliss-Isakov, N.; Izkhakov, E.; Halpern, Z. Effect of resistance training on non-alcoholic fatty-liver disease a randomized-clinical trial. World J. Gastroenterol. 2014, 20, 4382. [Google Scholar] [CrossRef]
- Houghton, D.; Thoma, C.; Hallsworth, K.; Cassidy, S.; Hardy, T.; Burt, A.D.; Tiniakos, D.; Hollingsworth, K.G.; Taylor, R.; Day, C.P. Exercise reduces liver lipids and visceral adiposity in patients with nonalcoholic steatohepatitis in a randomized controlled trial. Clin. Gastroenterol. Hepatol. 2017, 15, 96–102.e3. [Google Scholar] [CrossRef] [Green Version]
- Sullivan, S.; Kirk, E.P.; Mittendorfer, B.; Patterson, B.W.; Klein, S. Randomized trial of exercise effect on intrahepatic triglyceride content and lipid kinetics in nonalcoholic fatty liver disease. Hepatology 2012, 55, 1738–1745. [Google Scholar] [CrossRef] [Green Version]
- Terrin, N.; Schmid, C.H.; Lau, J. In an empirical evaluation of the funnel plot, researchers could not visually identify publication bias. J. Clin. Epidemiol. 2005, 58, 894–901. [Google Scholar] [CrossRef]
- Duval, S.; Tweedie, R. Trim and fill: A simple funnel-plot—Based method of testing and adjusting for publication bias in meta-analysis. Biometrics 2000, 56, 455–463. [Google Scholar] [CrossRef]
- Egger, M.; Smith, G.D.; Schneider, M.; Minder, C. Bias in meta-analysis detected by a simple, graphical test. BMJ 1997, 315, 629–634. [Google Scholar] [CrossRef] [Green Version]
- Sterne, J.A.; Egger, M. Funnel plots for detecting bias in meta-analysis: Guidelines on choice of axis. J. Clin. Epidemiol. 2001, 54, 1046–1055. [Google Scholar] [CrossRef]
- Nassir, F.; Rector, R.S.; Hammoud, G.M.; Ibdah, J.A. Pathogenesis and prevention of hepatic steatosis. Gastroenterol. Hepatol. 2015, 11, 167. [Google Scholar]
- Orci, L.A.; Gariani, K.; Oldani, G.; Delaune, V.; Morel, P.; Toso, C. Exercise-based interventions for nonalcoholic fatty liver disease: A meta-analysis and meta-regression. Clin. Gastroenterol. Hepatol. 2016, 14, 1398–1411. [Google Scholar] [CrossRef] [Green Version]
- Baker, C.J.; Martinez-Huenchullan, S.F.; D’Souza, M.; Xu, Y.; Li, M.; Bi, Y.; Johnson, N.A.; Twigg, S.M. Effect of exercise on hepatic steatosis: Are benefits seen without dietary intervention? A systematic review and meta-analysis. J. Diabetes 2021, 13, 63–77. [Google Scholar] [CrossRef]
- Wang, S.; Zheng, J.; Peng, H.; Cai, X.; Pan, X.; Li, H.; Hong, Q.; Peng, X. Physical activity intervention for non-diabetic patients with non-alcoholic fatty liver disease: A meta-analysis of randomized controlled trials. BMC Gastroenterol. 2020, 20, 66. [Google Scholar] [CrossRef] [PubMed]
- Smart, N.A.; King, N.; McFarlane, J.R.; Graham, P.L.; Dieberg, G. Effect of exercise training on liver function in adults who are overweight or exhibit fatty liver disease: A systematic review and meta-analysis. Br. J. Sports Med. 2018, 52, 834–843. [Google Scholar] [CrossRef] [PubMed]
- Utzschneider, K.M.; Kahn, S.E. The role of insulin resistance in nonalcoholic fatty liver disease. J. Clin. Endocrinol. Metab. 2006, 91, 4753–4761. [Google Scholar] [CrossRef] [Green Version]
- Bessone, F.; Razori, M.V.; Roma, M.G. Molecular pathways of nonalcoholic fatty liver disease development and progression. Cell. Mol. Life Sci. 2019, 76, 99–128. [Google Scholar] [CrossRef] [PubMed]
- van der Windt, D.J.; Sud, V.; Zhang, H.; Tsung, A.; Huang, H. The effects of physical exercise on fatty liver disease. Gene Expr. 2018, 18, 89. [Google Scholar] [CrossRef] [PubMed] [Green Version]
- Gambino, R.; Bugianesi, E.; Rosso, C.; Mezzabotta, L.; Pinach, S.; Alemanno, N.; Saba, F.; Cassader, M. Different serum free fatty acid profiles in NAFLD subjects and healthy controls after oral fat load. Int. J. Mol. Sci. 2016, 17, 479. [Google Scholar] [CrossRef] [PubMed] [Green Version]
- Zhang, J.; Zhao, Y.; Xu, C.; Hong, Y.; Lu, H.; Wu, J.; Chen, Y. Association between serum free fatty acid levels and nonalcoholic fatty liver disease: A cross-sectional study. Sci. Rep. 2014, 4, 5832. [Google Scholar] [CrossRef] [Green Version]
- Donnelly, K.L.; Smith, C.I.; Schwarzenberg, S.J.; Jessurun, J.; Boldt, M.D.; Parks, E.J. Sources of fatty acids stored in liver and secreted via lipoproteins in patients with nonalcoholic fatty liver disease. J. Clin. Investig. 2005, 115, 1343–1351. [Google Scholar] [CrossRef] [Green Version]
- Sniderman, A.D.; Scantlebury, T.; Cianflone, K. Hypertriglyceridemic hyperapob: The unappreciated atherogenic dyslipoproteinemia in type 2 diabetes mellitus. Ann. Intern. Med. 2001, 135, 447–459. [Google Scholar] [CrossRef]
- Turner, N.; Cooney, G.J.; Kraegen, E.W.; Bruce, C.R. Fatty acid metabolism, energy expenditure and insulin resistance in muscle. J. Endocrinol. 2014, 220, T61–T79. [Google Scholar] [CrossRef] [Green Version]
- Sanyal, A.J.; Campbell–Sargent, C.; Mirshahi, F.; Rizzo, W.B.; Contos, M.J.; Sterling, R.K.; Luketic, V.A.; Shiffman, M.L.; Clore, J.N. Nonalcoholic steatohepatitis: Association of insulin resistance and mitochondrial abnormalities. Gastroenterology 2001, 120, 1183–1192. [Google Scholar] [CrossRef] [PubMed]
- Malin, S.K.; Rynders, C.A.; Weltman, J.Y.; Barrett, E.J.; Weltman, A. Exercise intensity modulates glucose-stimulated insulin secretion when adjusted for adipose, liver and skeletal muscle insulin resistance. PLoS ONE 2016, 11, e0154063. [Google Scholar] [CrossRef]
- Johnson, N.A.; Sachinwalla, T.; Walton, D.W.; Smith, K.; Armstrong, A.; Thompson, M.W.; George, J. Aerobic exercise training reduces hepatic and visceral lipids in obese individuals without weight loss. Hepatology 2009, 50, 1105–1112. [Google Scholar] [CrossRef]
- Thyfault, J.P.; Rector, R.S. Exercise combats hepatic steatosis: Potential mechanisms and clinical implications. Diabetes 2020, 69, 517–524. [Google Scholar] [CrossRef] [PubMed]
- Abdelbasset, W.K.; Tantawy, S.A.; Kamel, D.M.; Alqahtani, B.A.; Elnegamy, T.E.; Soliman, G.S.; Ibrahim, A.A. Effects of high-intensity interval and moderate-intensity continuous aerobic exercise on diabetic obese patients with nonalcoholic fatty liver disease: A comparative randomized controlled trial. Medicine 2020, 99, e19471. [Google Scholar] [CrossRef] [PubMed]
- Finucane, F.M.; Sharp, S.J.; Purslow, L.R.; Horton, K.; Horton, J.; Savage, D.B.; Brage, S.; Besson, H.; Rolfe, E.D.L.; Sleigh, A. The effects of aerobic exercise on metabolic risk, insulin sensitivity and intrahepatic lipid in healthy older people from the Hertfordshire Cohort Study: A randomised controlled trial. Diabetologia 2010, 53, 624–631. [Google Scholar] [CrossRef] [Green Version]
- Shojaee-Moradie, F.; Baynes, K.; Pentecost, C.; Bell, J.D.; Thomas, E.L.; Jackson, N.C.; Stolinski, M.; Whyte, M.; Lovell, D.; Bowes, S.B. Exercise training reduces fatty acid availability and improves the insulin sensitivity of glucose metabolism. Diabetologia 2007, 50, 404–413. [Google Scholar] [CrossRef] [Green Version]
- Bacchi, E.; Negri, C.; Targher, G.; Faccioli, N.; Lanza, M.; Zoppini, G.; Zanolin, E.; Schena, F.; Bonora, E.; Moghetti, P. Both resistance training and aerobic training reduce hepatic fat content in type 2 diabetic subjects with nonalcoholic fatty liver disease (the RAED2 Randomized Trial). Hepatology 2013, 58, 1287–1295. [Google Scholar] [CrossRef] [PubMed]
- Giannini, E.G.; Testa, R.; Savarino, V. Liver enzyme alteration: A guide for clinicians. CMAJ 2005, 172, 367–379. [Google Scholar] [CrossRef] [PubMed] [Green Version]
- Lee, W.M. Drug-induced hepatotoxicity. N. Engl. J. Med. 2003, 349, 474–485. [Google Scholar] [CrossRef] [PubMed]
- Purkins, L.; Love, E.R.; Eve, M.D.; Wooldridge, C.L.; Cowan, C.; Smart, T.S.; Johnson, P.J.; Rapeport, W.G. The influence of diet upon liver function tests and serum lipids in healthy male volunteers resident in a Phase I unit. Br. J. Clin. Pharmacol. 2004, 57, 199–208. [Google Scholar] [CrossRef] [PubMed] [Green Version]
- Chiriac, S.; Stanciu, C.; Girleanu, I.; Cojocariu, C.; Sfarti, C.; Singeap, A.; Cuciureanu, T.; Huiban, L.; Muzica, C.M.; Zenovia, S. Nonalcoholic Fatty Liver Disease and Cardiovascular Diseases: The Heart of the Matter. Can. J. Gastroenterol. Hepatol. 2021, 2021, 6696857. [Google Scholar] [CrossRef] [PubMed]
- Mann, S.; Beedie, C.; Jimenez, A. Differential effects of aerobic exercise, resistance training and combined exercise modalities on cholesterol and the lipid profile: Review, synthesis and recommendations. Sports Med. 2014, 44, 211–221. [Google Scholar] [CrossRef] [Green Version]
- Simonen, P.; Kotronen, A.; Hallikainen, M.; Sevastianova, K.; Makkonen, J.; Hakkarainen, A.; Lundbom, N.; Miettinen, T.A.; Gylling, H.; Yki-Järvinen, H. Cholesterol synthesis is increased and absorption decreased in non-alcoholic fatty liver disease independent of obesity. J. Hepatol. 2011, 54, 153–159. [Google Scholar] [CrossRef] [PubMed]
- Dumolt, J.H.; Patel, M.S.; Rideout, T.C. Excessive early-life cholesterol exposure may have later-life consequences for nonalcoholic fatty liver disease. J. Dev. Orig. Health Dis. 2020, 12, 229–236. [Google Scholar] [CrossRef]
- Min, H.; Kapoor, A.; Fuchs, M.; Mirshahi, F.; Zhou, H.; Maher, J.; Kellum, J.; Warnick, R.; Contos, M.J.; Sanyal, A.J. Increased hepatic synthesis and dysregulation of cholesterol metabolism is associated with the severity of nonalcoholic fatty liver disease. Cell Metab. 2012, 15, 665–674. [Google Scholar] [CrossRef] [PubMed] [Green Version]
- Keating, S.E.; Hackett, D.A.; Parker, H.M.; O’Connor, H.T.; Gerofi, J.A.; Sainsbury, A.; Baker, M.K.; Chuter, V.H.; Caterson, I.D.; George, J. Effect of aerobic exercise training dose on liver fat and visceral adiposity. J. Hepatol. 2015, 63, 174–182. [Google Scholar] [CrossRef] [PubMed]
- Jin, Y.; Kim, K.M.; Hwang, S.; Lee, S.G.; Ha, T.; Song, G.; Jung, D.; Kim, K.; Yu, E.; Shim, J.H. Exercise and diet modification in non-obese non-alcoholic fatty liver disease: Analysis of biopsies of living liver donors. J. Gastroenterol. Hepatol. 2012, 27, 1341–1347. [Google Scholar] [CrossRef] [PubMed]
- Polyzos, S.A.; Kountouras, J.; Anastasilakis, A.D.; Geladari, E.V.; Mantzoros, C.S. Irisin in patients with nonalcoholic fatty liver disease. Metab. Clin. Exp. 2014, 63, 207–217. [Google Scholar] [CrossRef]
- Oelmann, S.; Nauck, M.; Völzke, H.; Bahls, M.; Friedrich, N. Circulating irisin concentrations are associated with a favourable lipid profile in the general population. PLoS ONE 2016, 11, e0154319. [Google Scholar] [CrossRef] [PubMed] [Green Version]
- Park, M.; Kim, D.; Choi, J.; Heo, Y.; Park, S. New role of irisin in hepatocytes: The protective effect of hepatic steatosis in vitro. Cell. Signal. 2015, 27, 1831–1839. [Google Scholar] [CrossRef] [PubMed]
- Kim, H.; Lee, H.; So, B.; Son, J.S.; Yoon, D.; Song, W. Effect of aerobic training and resistance training on circulating irisin level and their association with change of body composition in overweight/obese adults: A pilot study. Physiol. Res. 2016, 65, 271. [Google Scholar] [CrossRef]
- Ye, Y.; Chen, L.; Yang, X. The efficacy of resistance training for non-alcoholic fatty-liver disease: A meta-analysis of randomized controlled trials. Int. J. Clin. Exp. Med. 2019, 12, 13188–13195. [Google Scholar]
- Church, T.S.; Blair, S.N.; Cocreham, S.; Johannsen, N.; Johnson, W.; Kramer, K.; Mikus, C.R.; Myers, V.; Nauta, M.; Rodarte, R.Q. Effects of aerobic and resistance training on hemoglobin A1c levels in patients with type 2 diabetes: A randomized controlled trial. JAMA 2010, 304, 2253–2262. [Google Scholar] [CrossRef] [PubMed] [Green Version]
- Yavari, A.; Hajiyev, A.M.; Naghizadeh, F. The effect of aerobic exercise on glycosylated hemoglobin values in type 2 diabetes patients. J. Sports Med. Phys. Fit. 2010, 50, 501. [Google Scholar]
- Younossi, Z.M.; Corey, K.E.; Lim, J.K. AGA Clinical Practice Update on Lifestyle Modification Using Diet and Exercise to Achieve Weight Loss in the Management of Nonalcoholic Fatty Liver Disease (NAFLD): Expert Review. Gastroenterology 2020, 160, 912–918. [Google Scholar] [CrossRef] [PubMed]
- Koutoukidis, D.A.; Astbury, N.M.; Tudor, K.E.; Morris, E.; Henry, J.A.; Noreik, M.; Jebb, S.A.; Aveyard, P. Association of weight loss interventions with changes in biomarkers of nonalcoholic fatty liver disease: A systematic review and meta-analysis. JAMA Intern. Med. 2019, 179, 1262–1271. [Google Scholar] [CrossRef] [Green Version]
- Chalasani, N.; Younossi, Z.; Lavine, J.E.; Charlton, M.; Cusi, K.; Rinella, M.; Harrison, S.A.; Brunt, E.M.; Sanyal, A.J. The diagnosis and management of nonalcoholic fatty liver disease: Practice guidance from the American Association for the Study of Liver Diseases. Hepatology 2018, 67, 328–357. [Google Scholar] [CrossRef]
- Bischoff, S.C.; Bernal, W.; Dasarathy, S.; Merli, M.; Plank, L.D.; Schütz, T.; Plauth, M. ESPEN practical guideline: Clinical nutrition in liver disease. Clin. Nutr. 2020, 39, 3533–3562. [Google Scholar] [CrossRef]
- Oh, S.; Tsujimoto, T.; Kim, B.; Uchida, F.; Suzuki, H.; Iizumi, S.; Isobe, T.; Sakae, T.; Tanaka, K.; Shoda, J. Weight-loss-independent benefits of exercise on liver steatosis and stiffness in Japanese men with NAFLD. JHEP Rep. 2021, 3, 100253. [Google Scholar] [CrossRef]
- Motiani, K.K.; Collado, M.C.; Eskelinen, J.; Virtanen, K.A.; Löyttyniemi, E.; Salminen, S.; Nuutila, P.; Kalliokoski, K.K.; Hannukainen, J.C. Exercise training modulates gut microbiota profile and improves endotoxemia. Med. Sci. Sports Exerc. 2020, 52, 94. [Google Scholar] [CrossRef] [Green Version]
- Munukka, E.; Ahtiainen, J.P.; Puigbó, P.; Jalkanen, S.; Pahkala, K.; Keskitalo, A.; Kujala, U.M.; Pietilä, S.; Hollmén, M.; Elo, L. Six-week endurance exercise alters gut metagenome that is not reflected in systemic metabolism in over-weight women. Front. Microbiol. 2018, 9, 2323. [Google Scholar] [CrossRef]
- Kern, T.; Blond, M.B.; Hansen, T.H.; Rosenkilde, M.; Quist, J.S.; Gram, A.S.; Ekstrøm, C.T.; Hansen, T.; Stallknecht, B. Structured exercise alters the gut microbiota in humans with overweight and obesity—A randomized controlled trial. Int. J. Obes. 2020, 44, 125–135. [Google Scholar] [CrossRef] [PubMed]
- Ijaz, S.; Verbeek, J.H.; Mischke, C.; Ruotsalainen, J. Inclusion of nonrandomized studies in Cochrane systematic reviews was found to be in need of improvement. J. Clin. Epidemiol. 2014, 67, 645–653. [Google Scholar] [CrossRef] [PubMed]
- Fletcher, J. What is heterogeneity and is it important? BMJ 2007, 334, 94–96. [Google Scholar] [CrossRef] [PubMed]
- Harrer, M.; Cuijpers, P.; Furukawa, T.A.; Ebert, D.D. Doing Meta-Analysis With R: A Hands-On Guide; Chapman & Hall/CRC Press: Boca Raton, FL, USA; London, UK, 2021. [Google Scholar]


| Clinical Parameter | Aerobic Exercise | Resistance Training | Exercise Combination (Aerobic Exercise + Resistance Training) | Overall Exercise (Aerobic Exercise + Resistance Training + Exercise Combination) |
|---|---|---|---|---|
| IHL | 5 | 1 * | 2 | 8 |
| Liver stiffness | - | - | 1 * | 1 * |
| ALT | 6 | 2 | 2 | 10 |
| AST | 5 | 2 | 2 | 9 |
| HDL-C | 3 | 1 * | 1 * | 5 |
| LDL-C | 2 | 1 * | 1 * | 4 |
| TC | 3 | 2 | 2 | 7 |
| TG | 5 | 2 | 2 | 9 |
| Fasting glucose | 4 | 2 | 2 | 8 |
| Fasting insulin | 4 | 2 | 2 | 8 |
| HbA1c | 2 | 2 | 1 * | 5 |
| First Author, Year of Publication, and Country | Sample Size (M/F) | Mean Age (SD) (Years) | Disease Stage | Techniques Used to Assess the Liver Fat | Exercise Intervention (Aerobic/Resistance/Combination) | Training Sessions/Week | Intervention Duration (Weeks) | Food Diary (Y/N) |
|---|---|---|---|---|---|---|---|---|
| Cheng et al. 2017, China [36] | C: 18 (4/14) I: 22 (5/17) | C: 60 (3.4) I: 59 (4.4) | NAFLD with impaired FG | 1H-MRS | Aerobic: Nordic brisk walking + stretching and other group exercise increased VO2max from 60% to 75% | 2–3 times 30–60 min | 12 | Y |
| Cuthbertson et al. 2016, UK [37] | C: 20 (16/4) I: 30 (23/7) | C: 52 (46,59) * I: 50 (46,58) * | NAFLD | 1H-MRS | Aerobic: moderate (30% HRR), treadmill, cross-trainer, bike ergometer, rower, progressing weekly based on HR responses (60% HRR by week 12) | 3 times for 30 min up to 5 times for 45 min | 16 | Y |
| Hallsworth et al. 2015, UK [35] | C: 11 I: 12 | C: 52 (12) I: 54 (10) | NAFLD | 1H-MRS | Aerobic: cycle-ergometer-based HIIT | 3 times for 30–40 min | 12 | N |
| Hallsworth et al. 2011, UK [19] | C: 8 I: 11 | C: 62 (7.4) I: 52 (13.3) | NAFLD | 1H-MRS | Resistance: bicep curl, calf raise, triceps press, chest press, seated hamstring curl, shoulder press, leg extension, and lateral pull-down | 3 times for 45–60 min | 8 | N |
| Houghton et al. 2017, UK [41] | C: 12 I: 12 | C: 51 (16) I: 54 (12) | NASH | 1H-MRS biopsy | Aerobic and resistance: cycling + resistance training with weight (hip and knee extension, horizontal row, chest press, vertical row, knee extension) | 3 times per for 45–60 min | 12 | N |
| Pugh et al. 2014, UK [38] | C: 8 (4/4) I: 13 (7/6) | For all: 48 (44.51) | NAFLD, obese | 1H-MRS | Aerobic: combination of treadmill and cycle ergometer-based exercise 30% HRR to 45% HHR to 60% HRR | 3 times per for 30 min up to 45 min | 16 | Y (C: N) |
| Shamsoddini et al. 2015, Iran [34] | C: 10 (10/0) I1: 10 (10/0) I2: 10 (10/0) | C: 45.8 (7.3) I1: 39.7 (6.3) I2: 45.9 (7.3) | NAFLD | US | Group 1—Aerobic: running on treadmill, 60% MHR to 75% MHR Group 2—Resistance: triceps press, bicep curl, calf raise, leg press, leg extension, lat pull down, sit-ups | 3 times for 45 min | 8 | N |
| Shojaee-Moradie et al. 2016, UK [39] | C: 12 (12/0) I: 15 (15/0) | C: 52.8 (3) I: 52.4 (2.2) | NAFLD | 1H-MRS | Aerobic and resistance: gym based/outdoor aerobic + resistance training moderate intensity (40–60% HRR) | 4 to 5 times for 20 min up to 60 min | 16 | Y |
| Sullivan et al. 2012, USA [42] | C: 6 (1/5) I: 12 (4/8) | I: 48.6 (2.2) C: 47.5 (3.1) | NAFLD obese, | MRS | Aerobic: brisk walk on treadmill, 45–55% VO2peak | 5 times for 30–60 min | 16 | N |
| Zelberg-Sagi et al. 2014, Israel [40] | C: 31 (18/13) I: 33 (16/17) | C: 46.6 (11.4) I: 46.3 (10.32) | NAFLD | US | Resistance: leg press/extension/curl, seated chest press/rowing, latissimus pull down, bicep curl, shoulder press | 3 times per for 40 min | 12 | Y |
Publisher’s Note: MDPI stays neutral with regard to jurisdictional claims in published maps and institutional affiliations. |
© 2021 by the authors. Licensee MDPI, Basel, Switzerland. This article is an open access article distributed under the terms and conditions of the Creative Commons Attribution (CC BY) license (https://creativecommons.org/licenses/by/4.0/).
Share and Cite
Babu, A.F.; Csader, S.; Lok, J.; Gómez-Gallego, C.; Hanhineva, K.; El-Nezami, H.; Schwab, U. Positive Effects of Exercise Intervention without Weight Loss and Dietary Changes in NAFLD-Related Clinical Parameters: A Systematic Review and Meta-Analysis. Nutrients 2021, 13, 3135. https://doi.org/10.3390/nu13093135
Babu AF, Csader S, Lok J, Gómez-Gallego C, Hanhineva K, El-Nezami H, Schwab U. Positive Effects of Exercise Intervention without Weight Loss and Dietary Changes in NAFLD-Related Clinical Parameters: A Systematic Review and Meta-Analysis. Nutrients. 2021; 13(9):3135. https://doi.org/10.3390/nu13093135
Chicago/Turabian StyleBabu, Ambrin Farizah, Susanne Csader, Johnson Lok, Carlos Gómez-Gallego, Kati Hanhineva, Hani El-Nezami, and Ursula Schwab. 2021. "Positive Effects of Exercise Intervention without Weight Loss and Dietary Changes in NAFLD-Related Clinical Parameters: A Systematic Review and Meta-Analysis" Nutrients 13, no. 9: 3135. https://doi.org/10.3390/nu13093135
APA StyleBabu, A. F., Csader, S., Lok, J., Gómez-Gallego, C., Hanhineva, K., El-Nezami, H., & Schwab, U. (2021). Positive Effects of Exercise Intervention without Weight Loss and Dietary Changes in NAFLD-Related Clinical Parameters: A Systematic Review and Meta-Analysis. Nutrients, 13(9), 3135. https://doi.org/10.3390/nu13093135