
Risk of Malnutrition upon Admission and after Discharge in Acutely Admitted Older Medical Patients: A Prospective Observational Study

 ,
,  , , , ,
Abstract
:1. Introduction
2. Methods
2.1. Study Design and Setting
2.2. Participants and Recruitment
2.3. Data Collection and Variables
2.4. Baseline Characteristics
2.5. Screening for Malnutrition and Risk of Malnutrition
2.6. Diagnostic Criteria for Malnutrition
2.7. Risk Factors for Malnutrition
2.8. Sample Size and Statistics
3. Results
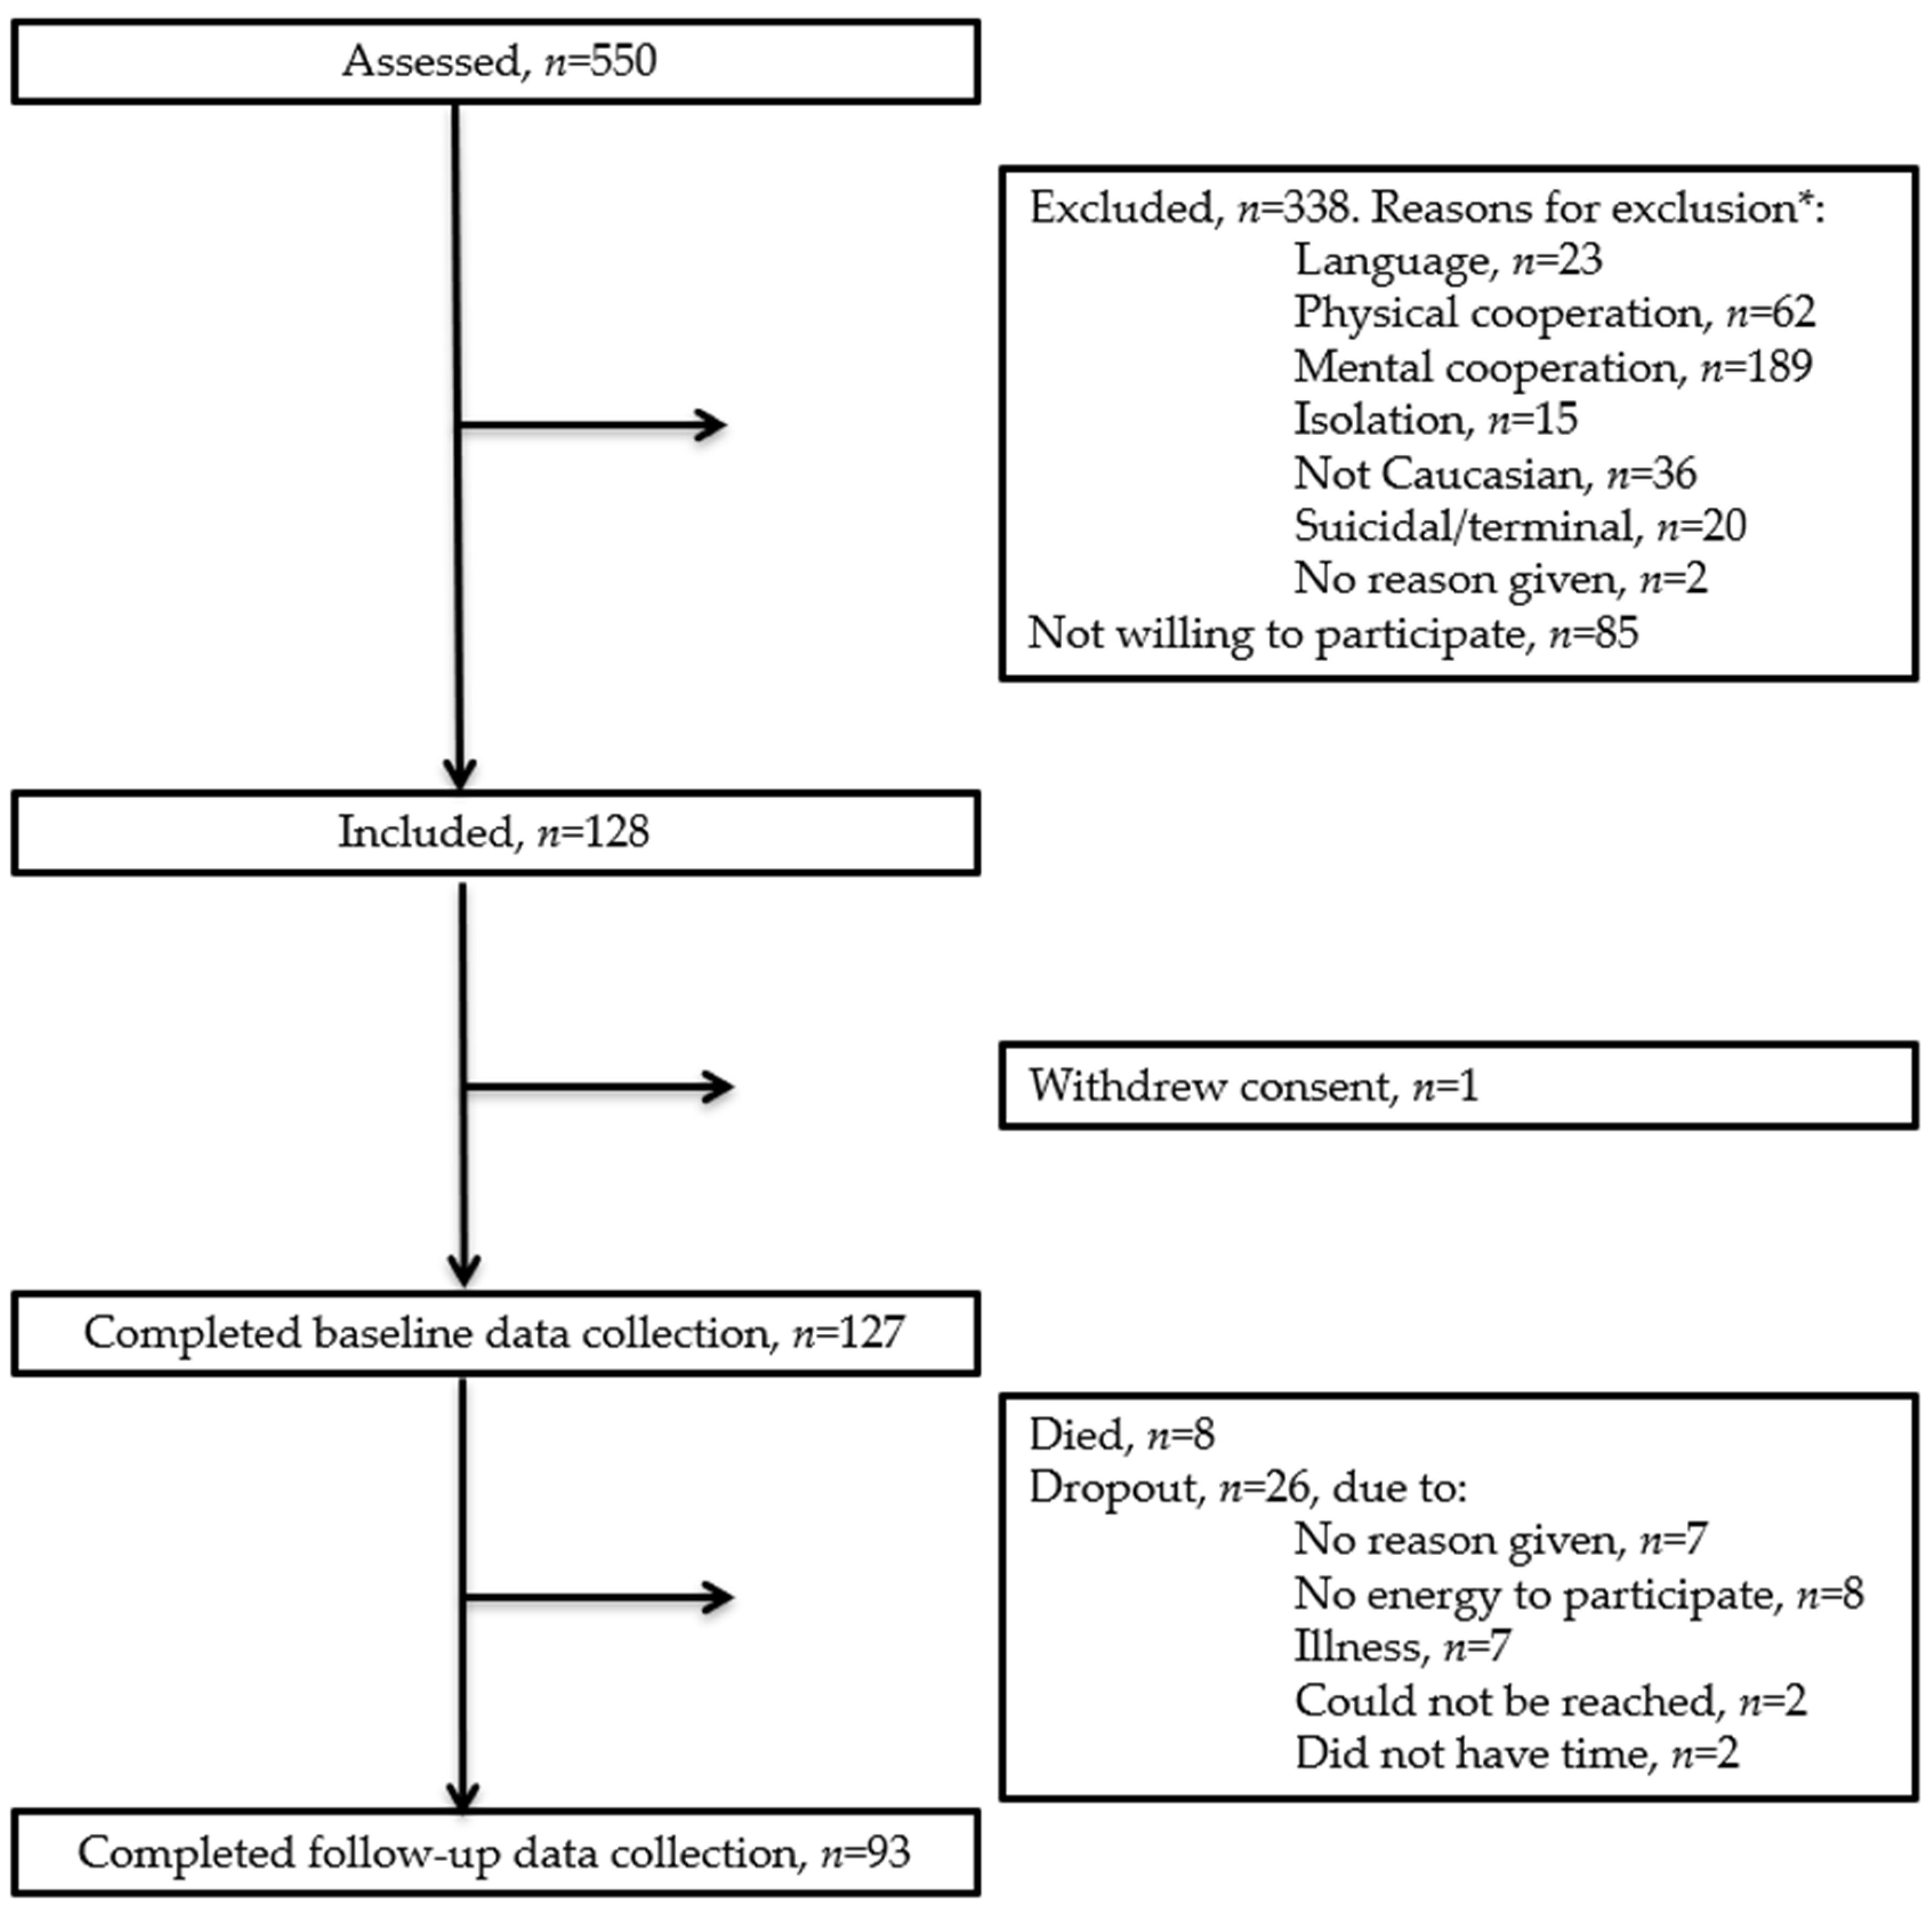
3.1. Participants
3.2. Participant Characteristics
3.3. Prevalence of Malnutrition and Risk of Malnutrition and Agreement between Screening Tools
3.4. Transitional Aggrement within and between Screnning Tools
3.5. Risk Factors for Malnutrition
4. Discussion
4.1. Prevalence of Malnutrition and Risk of Malnutrition and Agreement between Screening Tools
4.2. Diagnostic Criteria for Malnutrition
4.3. Transitional Aggrement within and between Screnning Tools and Change in Body Weight
4.4. Risk Factors for Malnutrtion
4.5. Strengths and Limitations
5. Conclusions
Supplementary Materials
Author Contributions
Funding
Institutional Review Board Statement
Informed Consent Statement
Data Availability Statement
Acknowledgments
Conflicts of Interest
References
- Lawson-Smith, L.; Petersen, J.; Jensen, P.S.; Sivertsen, D.M.; Pedersen, M.M.; Ellekilde, G.; Lindhardt, T.; Andersen, O. Nutritional Risk in Acutely Admitted Older Medical Patients. Am. J. Food Nutr. 2015, 3, 84–89. [Google Scholar] [CrossRef]
- Griffin, A.; O’Neill, A.; O’Connor, M.; Ryan, D.; Tierney, A.; Galvin, R. The prevalence of malnutrition and impact on patient outcomes among older adults presenting at an Irish emergency department: A secondary analysis of the OPTI-MEND trial. BMC Geriatr. 2020, 20, 1–11. [Google Scholar] [CrossRef]
- Bolado Jiménez, C.; Fernádez Ovalle, H.; Muñoz Moreno, M.; Aller de la Fuente, R.; de Luis Román, D. Undernutrition measured by the Mini Nutritional Assessment (MNA) test and related risk factors in older adults under hospital emergency care. Nutrition 2019, 66, 142–146. [Google Scholar] [CrossRef] [PubMed]
- Burks, C.E.; Jones, C.W.; Braz, V.A.; Swor, R.A.; Richmond, N.L.; Hwang, K.S.; Hollowell, A.G.; Weaver, M.A.; Platts-Mills, T.F. Risk Factors for Malnutrition among Older Adults in the Emergency Department: A Multicenter Study. J. Am. Geriatr. Soc. 2017, 65, 1741–1747. [Google Scholar] [CrossRef]
- Pereira, G.F.; Bulik, C.M.; Weaver, M.A.; Holland, W.C.; Platts-Mills, T.F. Malnutrition among Cognitively Intact, non-Critically Ill Older Adults in the Emergency Department. Ann. Emerg. Med. 2015, 65, 85–91. [Google Scholar] [CrossRef] [Green Version]
- Cederholm, T.; Bosaeus, I.; Barazzoni, R.; Bauer, J.; Van Gossum, A.; Klek, S.; Muscaritoli, M.; Nyulasi, I.; Ock-enga, J.; Schneider, S.M.; et al. Diagnostic criteria for malnutrition—An ESPEN Consensus Statement. Clin. Nutr. 2015, 34, 335–340. [Google Scholar] [CrossRef]
- Marshall, S.; Bauer, J.; Isenring, E. The consequences of malnutrition following discharge from rehabilitation to the community: A systematic review of current evidence in older adults. J. Hum. Nutr. Diet. 2014, 27, 133–141. [Google Scholar] [CrossRef] [PubMed] [Green Version]
- Buurman, B.M.; Hoogerduijn, J.G.; de Haan, R.J.; Abu-Hanna, A.; Lagaay, A.M.; Verhaar, H.J.; Schuurmans, M.J.; Levi, M.; de Rooij, S.E. Geriatric Conditions in Acutely Hospitalized Older Patients: Prevalence and One-Year Survival and Functional Decline. PLoS ONE 2011, 6, e26951. [Google Scholar] [CrossRef]
- Cederholm, T.; Barazzoni, R.; Austin, P.; Ballmer, P.; Biolo, G.; Bischoff, S.C.; Compher, C.; Correia, I.; Higashigu-chi, T.; Holst, M.; et al. ESPEN guidelines on definitions and terminology of clinical nutrition. Clin. Nutr. 2017, 36, 49–64. [Google Scholar] [CrossRef]
- Volkert, D.; Beck, A.M.; Cederholm, T.; Cruz-Jentoft, A.; Goisser, S.; Hooper, L.; Kiesswetter, E.; Maggio, M.; Raynaud-Simon, A.; Sieber, C.C.; et al. ESPEN guideline on clinical nutrition and hydration in geriatrics. Clin. Nutr. 2019, 38, 10–47. [Google Scholar] [CrossRef] [Green Version]
- Carrión, S.; Cabré, M.; Monteis, R.; Roca, M.; Palomera, E.; Serra-Prat, M.; Rofes, L.; Clavé, P. Oropharyngeal dysphagia is a prevalent risk factor for malnutrition in a cohort of older patients admitted with an acute disease to a general hospital. Clin. Nutr. Edinb. Scotl. 2015, 34, 436–442. [Google Scholar] [CrossRef]
- Fávaro-Moreira, N.C.; Krausch-Hofmann, S.; Matthys, C.; Vereecken, C.; Vanhauwaert, E.; Declercq, A.; Bekkering, G.E.; Duyck, J. Risk Factors for Malnutrition in Older Adults: A Systematic Review of the Literature Based on Longitudinal Data123. Adv. Nutr. 2016, 7, 507–522. [Google Scholar] [CrossRef] [PubMed]
- van der Pols-Vijlbrief, R.; Wijnhoven, H.A.H.; Schaap, L.A.; Terwee, C.B.; Visser, M. Determinants of protein-energy malnutrition in community-dwelling older adults: A systematic review of observational studies. Ageing Res. Rev. 2014, 18, 112–131. [Google Scholar] [CrossRef] [PubMed]
- Schilp, J.; Wijnhoven, H.A.H.; Deeg, D.J.H.; Visser, M. Early determinants for the development of undernutrition in an older general population: Longitudinal Aging Study Amsterdam. Br. J. Nutr. 2011, 106, 708–717. [Google Scholar] [CrossRef] [Green Version]
- Jyrkkä, J.; Enlund, H.; Lavikainen, P.; Sulkava, R.; Hartikainen, S. Association of polypharmacy with nutritional status, functional ability and cognitive capacity over a three-year period in an elderly population. Pharmacoepidemiol. Drug Saf. 2011, 20, 514–522. [Google Scholar] [CrossRef]
- van Bokhorst-de van der Schueren, M.A.E.; Lonterman-Monasch, S.; de Vries, O.J.; Danner, S.A.; Kramer, M.H.H.; Muller, M. Prevalence and determinants for malnutrition in geriatric outpatients. Clin. Nutr. 2013, 32, 1007–1011. [Google Scholar] [CrossRef]
- Christensen, J.; Klausen Fredslund, E. Fælles Ældre. Opgørelse Af 65+ Borgere i Hjemmeplejen Og i Hospitals-Sektoren; Det National Institut for Kommuners og Regioners Analyse og Forskning: Copenhagen, Denmark, 2013; ISBN 978-87-7488-771-3. [Google Scholar]
- Power, L.; de van der Schueren, M.A.E.; Leij-Halfwerk, S.; Bauer, J.; Clarke, M.; Visser, M.; Volkert, D.; Bardon, L.; Gibney, E.; Corish, C.A.; et al. Development and application of a scoring system to rate malnutrition screening tools used in older adults in community and healthcare settings—A MaNuEL study. Clin. Nutr. Edinb. Scotl. 2019, 38, 1807–1819. [Google Scholar] [CrossRef]
- Houlind, M.B.; Andersen, A.L.; Treldal, C.; Jørgensen, L.M.; Kannegaard, P.N.; Castillo, L.S.; Christensen, L.D.; Tavenier, J.; Rasmussen, L.J.H.; Ankarfeldt, M.Z.; et al. A Collaborative Medication Review Including Deprescribing for Older Patients in an Emergency Department: A Longitudinal Feasibility Study. J. Clin. Med. 2020, 9, 348. [Google Scholar] [CrossRef] [PubMed] [Green Version]
- Tavenier, J.; Rasmussen, L.J.H.; Houlind, M.B.; Andersen, A.L.; Panum, I.; Andersen, O.; Petersen, J.; Langkilde, A.; Nehlin, J.O. Alterations of monocyte NF-κB p65/RelA signaling in a cohort of older medical patients, age-matched controls, and healthy young adults. Immun. Ageing 2020, 17, 25. [Google Scholar] [CrossRef]
- Tavenier, J.; Rasmussen, L.J.H.; Andersen, A.L.; Houlind, M.B.; Langkilde, A.; Andersen, O.; Petersen, J.; Nehlin, J.O. Association of GDF15 with inflammation and physical function during aging and recovery after acute hospitalization: A longitudinal study of older patients and age-matched controls. J. Gerontol. A. Biol. Sci. Med. Sci. 2021, 76, 964–974. [Google Scholar] [CrossRef] [PubMed]
- Vandenbroucke, J.P.; von Elm, E.; Altman, D.G.; Gøtzsche, P.C.; Mulrow, C.D.; Pocock, S.J.; Poole, C.; Schlessel-man, J.J.; Egger, M.; STROBE Initiative. Strengthening the Reporting of Observational Studies in Epidemiology (STROBE): Explanation and elaboration. Int. J. Surg. Lond. Engl. 2014, 12, 1500–1524. [Google Scholar] [CrossRef] [PubMed] [Green Version]
- The EuroQol Group. EuroQol—A new facility for the measurement of health-related quality of life. Health Policy 1990, 16, 199–208. [Google Scholar] [CrossRef]
- Herdman, M.; Gudex, C.; Lloyd, A.; Janssen, M.; Kind, P.; Parkin, D.; Bonsel, G.; Badia, X. Development and preliminary testing of the new five-level version of EQ-5D (EQ-5D-5L). Qual. Life Res. Int. J. Qual. Life Asp. Treat. Care Rehabil. 2011, 20, 1727–1736. [Google Scholar] [CrossRef] [Green Version]
- EQ-5D. Crosswalk Index Value Calculator—EQ-5D. Available online: https://euroqol.org/eq-5d-instruments/eq-5d-5l-about/valuation-standard-value-sets/crosswalk-index-value-calculator/ (accessed on 16 March 2021).
- Zuckerman, J.D.; Koval, K.J.; Aharonoff, G.B.; Skovron, M.L. A functional recovery score for elderly hip fracture patients: II. Validity and reliability. J. Orthop. Trauma 2000, 14, 26–30. [Google Scholar] [CrossRef]
- Bodilsen, A.C.; Pedersen, M.M.; Petersen, J.; Beyer, N.; Andersen, O.; Smith, L.L.; Kehlet, H.; Bandholm, T. Acute Hospitalization of the Older Patient: Changes in Muscle Strength and Functional Performance during Hospitalization and 30 Days after Discharge. Am. J. Phys. Med. Rehabil. 2013, 92, 789–796. [Google Scholar] [CrossRef]
- Quan, H.; Li, B.; Couris, C.M.; Fushimi, K.; Graham, P.; Hider, P.; Januel, J.-M.; Sundararajan, V. Updating and validating the Charlson comorbidity index and score for risk adjustment in hospital discharge abstracts using data from 6 countries. Am. J. Epidemiol. 2011, 173, 676–682. [Google Scholar] [CrossRef] [PubMed] [Green Version]
- World Health Organisation. ICD-10 Version: 2019. Available online: https://icd.who.int/browse10/2019/en#/ (accessed on 9 March 2021).
- Kondrup, J.; Rasmussen, H.H.; Hamberg, O.; Stanga, Z.; Ad Hoc ESPEN Working Group. Nutritional risk screening (NRS 2002): A new method based on an analysis of controlled clinical trials. Clin. Nutr. Edinb. Scotl. 2003, 22, 321–336. [Google Scholar] [CrossRef]
- Rabito, E.I.; Marcadenti, A.; da Silva Fink, J.; Figueira, L.; Silva, F.M. Nutritional Risk Screening 2002, Short Nutritional Assessment Questionnaire, Malnutrition Screening Tool, and Malnutrition Universal Screening Tool Are Good Predictors of Nutrition Risk in an Emergency Service. Nutr. Clin. Pract. 2017, 32, 526–532. [Google Scholar] [CrossRef]
- Kroc, Ł.; Fife, E.; Piechocka-Wochniak, E.; Sołtysik, B.; Kostka, T. Comparison of Nutrition Risk Screening 2002 and Subjective Global Assessment Form as Short Nutrition Assessment Tools in Older Hospitalized Adults. Nutrients 2021, 13, 225. [Google Scholar] [CrossRef] [PubMed]
- Rubenstein, L.Z.; Harker, J.O.; Salvà, A.; Guigoz, Y.; Vellas, B. Screening for undernutrition in geriatric practice: Developing the short-form mini-nutritional assessment (MNA-SF). J. Gerontol. A. Biol. Sci. Med. Sci. 2001, 56, M366–M372. [Google Scholar] [CrossRef] [Green Version]
- Kaiser, M.J.; Bauer, J.M.; Ramsch, C.; Uter, W.; Guigoz, Y.; Cederholm, T.; Thomas, D.R.; Anthony, P.; Charlton, K.E.; Maggio, M.; et al. Validation of the Mini Nutritional Assessment short-form (MNA-SF): A practical tool for identification of nutritional status. J. Nutr. Health Aging 2009, 13, 782–788. [Google Scholar] [CrossRef]
- Ranhoff, A.H.; Gjøen, A.U.; Mowé, M. Screening for malnutrition in elderly acute medical patients: The usefulness of MNA-SF. J. Nutr. Health Aging 2005, 9, 221–225. [Google Scholar]
- O’Shea, E.; Trawley, S.; Manning, E.; Barrett, A.; Browne, V.; Timmons, S. Malnutrition in Hospitalised Older Adults: A Multicentre Observational Study of Prevalence, Associations and Outcomes. J. Nutr. Health Aging 2017, 21, 830–836. [Google Scholar] [CrossRef]
- Folven, K.; Biringer, E.; Abrahamsen, J.F. Mini Nutritional Assessment Short-Form (MNA-SF) Predicts Institutionalisation in an Intermediate Post-Acute Care Setting. J. Nutr. Health Aging 2018, 22, 199–204. [Google Scholar] [CrossRef] [PubMed]
- Nestlé Nutrition Institute. A Guide to Completing the Mini Nutritional Assesment- Short Form (MNA-SF). Available online: https://www.mna-elderly.com/forms/mna_guide_english_sf.pdf (accessed on 21 April 2021).
- Sundhedsstyrrelsen. Tidlig Opsporing af Forringet Helbredstilstand og Nedsat Funktionsevne hos Ældre Menne-Sker: Anbefalinger til Arbejdsgange og Anvendelse af Redskaber; Sundhedsstyrelsen: Copenhagen, Denmark, 2017; ISBN 978-87-7104-946-6.
- Sundhedsstyrelsen. Værktøjer til Tidlig Opsporing af Sygdomstegn, Nedsat Fysisk Funktionsniveau og Underernæring—Sammenfatning af Anbefalinger; Sundhedsstyrelsen: Copenhagen, Denmark, 2013; ISBN 978-87-7104-486-7.
- Beck, A.M.; Beermann, T.; Kjær, S.; Rasmussen, H.H. Ability of different screening tools to predict positive effect on nutritional intervention among the elderly in primary health care. Nutrition 2013, 29, 993–999. [Google Scholar] [CrossRef] [PubMed]
- Masnoon, N.; Shakib, S.; Kalisch-Ellett, L.; Caughey, G.E. What is polypharmacy? A systematic review of definitions. BMC Geriatr. 2017, 17, 230. [Google Scholar] [CrossRef] [PubMed] [Green Version]
- Rofes, L.; Arreola, V.; Mukherjee, R.; Clavé, P. Sensitivity and specificity of the Eating Assessment Tool and the Volume-Viscosity Swallow Test for clinical evaluation of oropharyngeal dysphagia. Neurogastroenterol. Motil. Off. J. Eur. Gastrointest. Motil. Soc. 2014, 26, 1256–1265. [Google Scholar] [CrossRef]
- Belafsky, P.C.; Mouadeb, D.A.; Rees, C.J.; Pryor, J.C.; Postma, G.N.; Allen, J.; Leonard, R.J. Validity and reliability of the Eating Assessment Tool (EAT-10). Ann. Otol. Rhinol. Laryngol. 2008, 117, 919–924. [Google Scholar] [CrossRef]
- Rinaldi, P.; Mecocci, P.; Benedetti, C.; Ercolani, S.; Bregnocchi, M.; Menculini, G.; Catani, M.; Senin, U.; Cherubi-ni, A. Validation of the five-item geriatric depression scale in elderly subjects in three different settings. J. Am. Geriatr. Soc. 2003, 51, 694–698. [Google Scholar] [CrossRef]
- Jones, C.J.; Rikli, R.E.; Beam, W.C. A 30-s Chair-Stand Test as a Measure of Lower Body Strength in Community-Residing Older Adults. Res. Q. Exerc. Sport 1999, 70, 113–119. [Google Scholar] [CrossRef]
- Guralnik, J.M.; Simonsick, E.M.; Ferrucci, L.; Glynn, R.J.; Berkman, L.F.; Blazer, D.G.; Scherr, P.A.; Wallace, R.B. A Short Physical Performance Battery Assessing Lower Extremity Function: Association with Self-Reported Disability and Prediction of Mortality and Nursing Home Admission. J. Gerontol. 1994, 49, M85–M94. [Google Scholar] [CrossRef] [PubMed]
- Nordén, J.; Grönberg, A.M.; Bosaeus, I.; Forslund, H.B.; Hulthén, L.; Rothenberg, E.; Karlsson, J.; Wallengren, O.; Slinde, F. Nutrition impact symptoms and body composition in patients with COPD. Eur. J. Clin. Nutr. 2015, 69, 256–261. [Google Scholar] [CrossRef]
- Katzman, R.; Brown, T.; Fuld, P.; Peck, A.; Schechter, R.; Schimmel, H. Validation of a short Orientation-Memory-Concentration Test of cognitive impairment. Am. J. Psychiatry 1983, 140, 734–739. [Google Scholar] [CrossRef] [PubMed]
- Wade, D.; Vergis, S. The Short Orientation-Memory-Concentration Test: A study of its reliability and validity. Clin. Rehabil. 1999, 13, 164–170. [Google Scholar] [CrossRef] [PubMed]
- Goring, H.; Baldwin, R.; Marriott, A.; Pratt, H.; Roberts, C. Validation of short screening tests for depression and cognitive impairment in older medically ill inpatients. Int. J. Geriatr. Psychiatry 2004, 19, 465–471. [Google Scholar] [CrossRef]
- Sim, J.; Wright, C.C. The kappa statistic in reliability studies: Use, interpretation, and sample size requirements. Phys. Ther. 2005, 85, 257–268. [Google Scholar] [CrossRef] [PubMed] [Green Version]
- McHugh, M.L. Interrater reliability: The kappa statistic. Biochem. Med. 2012, 22, 276–282. [Google Scholar] [CrossRef]
- Raupp, D.; Silva, F.M.; Marcadenti, A.; Rabito, E.I.; da Silva Fink, J.; Becher, P.; Gottschall, C. Nutrition screening in public hospital emergency rooms: Malnutrition Universal Screening Tool and Nutritional Risk Screening-2002 can be applied. Public Health 2018, 165, 6–8. [Google Scholar] [CrossRef]
- Kami, A.A.; Fernandes, R.; de Quadros Camargo, C.; Corsi, D.M.; de Salles, R.K.; de Moraes Trindade, E.B.S. Nutrition Risk Screening in Patients Admitted to an Adult Emergency Department of a Brazilian University Hospital. Nutr. Clin. Pract. 2017, 32, 84–91. [Google Scholar] [CrossRef] [PubMed]
- Velasco, C.; García, E.; Rodríguez, V.; Frias, L.; Garriga, R.; Álvarez, J.; García-Peris, P.; León, M. Comparison of four nutritional screening tools to detect nutritional risk in hospitalized patients: A multicentre study. Eur. J. Clin. Nutr. 2011, 65, 269–274. [Google Scholar] [CrossRef]
- Cederholm, T.; Jensen, G.L.; Correia, M.I.T.D.; Gonzalez, M.C.; Fukushima, R.; Higashiguchi, T.; Baptista, G.; Barazzoni, R.; Blaauw, R.; Coats, A.; et al. GLIM criteria for the diagnosis of malnutrition—A consensus report from the global clinical nutrition community. Clin. Nutr. Edinb. Scotl. 2019, 38, 1–9. [Google Scholar] [CrossRef] [PubMed] [Green Version]
- Detsky, A.S.; McLaughlin, J.R.; Baker, J.P.; Johnston, N.; Whittaker, S.; Mendelson, R.A.; Jeejeebhoy, K.N. What is subjective global assessment of nutritional status? JPEN J. Parenter. Enteral Nutr. 1987, 11, 8–13. [Google Scholar] [CrossRef] [PubMed] [Green Version]
- Canadian Malnutrition Task Force. Subjective Global Assessment Form. Available online: https://nutritioncareincanada.ca/sites/default/uploads/files/SGA%20Tool%20EN%20BKWT_2017.pdf (accessed on 31 July 2021).
- World Health Organisation. Oral Health. Fact Sheet Oral Health. Available online: https://www.who.int/news-room/fact-sheets/detail/oral-health (accessed on 24 March 2021).
- Keller, H.; de van der Schueren, M.A.E.; Jensen, G.L.; Barazzoni, R.; Compher, C.; Correia, M.I.T.D.; Gonzalez, M.C.; Jager-Wittenaar, H.; Pirlich, M.; Steiber, A.; et al. Global Leadership Initiative on Malnutrition (GLIM): Guidance on Validation of the Operational Criteria for the Diagnosis of Protein-Energy Malnutrition in Adults. J. Parenter. Enter. Nutr. 2020, 44, 992–1003. [Google Scholar] [CrossRef] [PubMed]


| All Participants | ||
|---|---|---|
| Variable | n | |
| Age, years, median (IQR) | 127 | 77.6 (72.3; 85.2) |
| Sex, male, n (%) | 127 | 56 (44) |
| Smoking, n (%) | 127 | 19 (15) |
| Education | ||
| 1–14 years of school, n (%) | 125 | 46 (36.8) |
| Skilled worker, n (%) | 125 | 60 (48) |
| High School +, n (%) | 125 | 19 (15.2) |
| Living alone, n (%) | 127 | 84 (66.1) |
| Body weight (kg), mean (SD) | 127 | 75.9 (19.4) |
| Height (cm) mean (SD) | 127 | 169.7 (9.9) |
| Body mass index (kg/m2), mean (SD) | 127 | 26.2 (5.5) |
| Quality of life (EQ-5D-5L index), median (IQR) | 125 | 0.702 (0.493; 0.786) |
| Charlson comorbidity index, median (IQR) | 122 | 1 (0; 2) |
| C-Reactive protein (mg/L), mean (SD) | 127 | 22 (5,3; 70) |
| Maximal hand grip strength (kg), mean (SD) | 124 | 23.2 (10.4) |
| Functional recovery score, median (IQR) | 119 | 88 (80; 99) |
| Physically inactive, n (%) | 126 | 53 (42.1) |
| Fallen within previous year, n (%) | 127 | 65 (51.2) |
| Baseline, n (%) * | Follow-Up, n (%) * | Development from Baseline to Follow-Up | |
|---|---|---|---|
| MNA-SF score ≤ 11 | 85 (68) | 63 (69) | |
| Maintained a score ≤ 11 | 49 (57) | ||
| Recovered, by gaining a score > 11 | 10 (12) | ||
| MNA-SF score > 11 | 40 (32) | 29 (32) | |
| Maintained a score > 11 | 19 (48) | ||
| Acquired a score ≤ 11 | 14 (35) | ||
| NRS-2002 score ≥ 3 | 71 (59) | 26 (30) | |
| Maintained a score ≥ 3 | 24 (27) | ||
| Recovered, by gaining a score < 3 | 21 (30) | ||
| NRS-2002 score < 3 | 50 (41) | 62 (71) | |
| Maintained a score < 3 | 37 (74) | ||
| Acquired a score ≥ 3 | 2 (4) | ||
| EVS score ≥ 1 | 122 (98) | 78 (85) | |
| Maintained a score ≥ 1 | 77 (63) | ||
| Recovered, by gaining a score < 1 | 12 (10) | ||
| EVS score < 1 | 3 (2) | 14 (15) | |
| Maintained a score < 1 | 2 (67) | ||
| Acquired a score ≥ 1 | 0 (0) |
| MNA-SF at Follow-Up | NRS-2002 at Follow-Up | EVS At Follow-Up | ||||
|---|---|---|---|---|---|---|
| MNA-SF at Baseline | p-Value | p-Value | p-Value | |||
| n | 92 | 88 | 92 | |||
| Kappa (95% CI) | 0.42 (0.22–0.61) | 0.861 | 0.33 (0.19–0.47) | 0.339 | 0.17 (−0.02–0.36) | <0.001 |
| PPV | 83% | 44% | 90% | |||
| NPV | 58% | 97% | 25% | |||
| Sensitivity | 78% | 96% | 69% | |||
| Specificity | 66% | 48% | 57% | |||
| Agreement | 74% | 63% | 67% | |||
| NRS-2002 at baseline | ||||||
| n | 88 | 84 | 88 | |||
| Kappa (95% CI) | 0.42 (0.23–0.60) | 0.875 | 0.47 (0.30–0.63) | 0.432 | 0.15 (−0.01–0.30) | <0.001 |
| PPV | 87% | 53% | 92% | |||
| NPV | 54% | 95% | 23% | |||
| Sensitivity | 68% | 92% | 59% | |||
| Specificity | 79% | 64% | 69% | |||
| Agreement | 72% | 73% | 54% | |||
| EVS at baseline | ||||||
| n | 91 | 87 | 91 | |||
| Kappa (95% CI) | 0.03 (−0.08–0.13) | <0.001 | 0.02 (−0.01–0.05) | <0.001 | 0.22 (−0.04–0.48) | 0.200 |
| PPV | 70% | 31% | 87% | |||
| NPV | 50% | 100% | 100% | |||
| Sensitivity | 98% | 100% | 100% | |||
| Specificity | 4% | 3% | 14% | |||
| Agreement | 69% | 32% | 87% | |||
| Risk Factor of Malnutrition | Baseline | Follow-Up | PPV, % | ||
|---|---|---|---|---|---|
| n | n (%) | n | n (%) | ||
| Polypharmacy | 127 | 86 (68) | |||
| Risk of dysphagia (EAT10 ≥ 3) | 125 | 34 (27) | 92 | 15 (16) | 33 |
| Risk of depression (GDS ≥ 2) | 123 | 27 (22) | 91 | 24 (26) | 63 |
| Activities of daily living | |||||
| Needs help cooking | 125 | 29 (23) | 90 | 24 (27) | 84 |
| Needs help eating | 126 | 1 (0.8) | 92 | 3 (3) | 100 |
| Needs help grocery shopping | 126 | 25 (20) | 92 | 21 (23) | 82 |
| Low muscle strength in lower extremities | |||||
| STS-test < 5, or STS-test > 5 or ≤ 8 + GS ≤ 0.6 m/s | 82 | 43 (52) | 76 | 25 (33) | 67 |
| Eating Symptom questionnaire, problems with: | |||||
| Chewing | 124 | 21 (17) | 93 | 16 (17) | 50 |
| Diarrhea | 125 | 34 (27) | 93 | 19 (20) | 46 |
| Xerostomia | 125 | 77 (62) | 92 | 47 (51) | 70 |
| Constipation | 125 | 37 (30) | 93 | 24 (26) | 63 |
| Nausea | 125 | 50 (40) | 93 | 24 (26) | 47 |
| Pain in mouth | 124 | 23 (19) | 92 | 12 (13) | 36 |
| Vomiting | 125 | 25 (20) | 93 | 12 (13) | 33 |
| Impaired cognition | |||||
| Moderately impaired (OMC 7–10) Severely impaired (OMC > 10) | 124 | 68 (55) 28 (23) | 90 90 | 63 (70) 12 (13) | 80 27 |
| At Risk of Malnutrition or with Malnutrition at Baseline According to: | |||
|---|---|---|---|
| MNA-SF Score ≤ 11 | NRS-2002 Score ≥ 3 | EVS Score ≥ 1 | |
| n = 85 | n = 71 | n = 122 | |
| Risk factor for malnutrition | Probability of having the risk factor, n(%) | Probability of having the risk factor, n(%) | Probability of having the risk factor, n(%) |
| Polypharmacy | 61 (72) | 52 (73) | 83 (68) |
| Risk of dysphagia, EAT10 ≥ 3 a | 27 (32) | 26 (37) | 34 (28) |
| Risk of depression, GDS ≥ 2 | 24 (29) | 18 (26) | 27 (23) |
| Activities of daily living | |||
| Needs help cooking a | 26 (31) | 22 (31) | 29 (24) |
| Needs help eating a | 1 (1) | 1 (1) | 1 (1) |
| Needs help grocery shopping | 23 (27) | 21 (30) | 24 (20) |
| Low muscle strength in lower extremities: | |||
| STS-test < 5, or STS-test >5 or ≤ 8 + GS ≤ 0.6 m/s | 34 (69) * | 31 (72) ** | 42 (53) *** |
| Eating Symptom questionnaire, problems with: | |||
| Chewing a | 15 (18) | 15 (21) | 21 (18) |
| Diarrhea | 28 (33) | 25 (35) | 34 (28) |
| Xerostomia | 54 (64) | 48 (67) | 75 (62) |
| Constipation | 26 (31) | 26 (37) | 36 (30) |
| Nausea | 38 (45) | 38 (54) | 50 (41) |
| Pain in moutha | 19 (22) | 16 (23) | 23 (19) |
| Vomiting | 21 (25) | 19 (27) | 25 (21) |
| Cognitive Impairment | |||
| Moderately impaired (OMC = 7–10) | 41 (49) | 35 (50) | 67 (56) |
| Severely impaired (OMC > 10) | 25 (30) | 21 (30) | 28 (23) |
Publisher’s Note: MDPI stays neutral with regard to jurisdictional claims in published maps and institutional affiliations. |
© 2021 by the authors. Licensee MDPI, Basel, Switzerland. This article is an open access article distributed under the terms and conditions of the Creative Commons Attribution (CC BY) license (https://creativecommons.org/licenses/by/4.0/).
Share and Cite
Andersen, A.L.; Nielsen, R.L.; Houlind, M.B.; Tavenier, J.; Rasmussen, L.J.H.; Jørgensen, L.M.; Treldal, C.; Beck, A.M.; Pedersen, M.M.; Andersen, O.; et al. Risk of Malnutrition upon Admission and after Discharge in Acutely Admitted Older Medical Patients: A Prospective Observational Study. Nutrients 2021, 13, 2757. https://doi.org/10.3390/nu13082757
Andersen AL, Nielsen RL, Houlind MB, Tavenier J, Rasmussen LJH, Jørgensen LM, Treldal C, Beck AM, Pedersen MM, Andersen O, et al. Risk of Malnutrition upon Admission and after Discharge in Acutely Admitted Older Medical Patients: A Prospective Observational Study. Nutrients. 2021; 13(8):2757. https://doi.org/10.3390/nu13082757
Chicago/Turabian StyleAndersen, Aino Leegaard, Rikke Lundsgaard Nielsen, Morten Baltzer Houlind, Juliette Tavenier, Line J. H. Rasmussen, Lillian Mørch Jørgensen, Charlotte Treldal, Anne Marie Beck, Mette Merete Pedersen, Ove Andersen, and et al. 2021. "Risk of Malnutrition upon Admission and after Discharge in Acutely Admitted Older Medical Patients: A Prospective Observational Study" Nutrients 13, no. 8: 2757. https://doi.org/10.3390/nu13082757
APA StyleAndersen, A. L., Nielsen, R. L., Houlind, M. B., Tavenier, J., Rasmussen, L. J. H., Jørgensen, L. M., Treldal, C., Beck, A. M., Pedersen, M. M., Andersen, O., & Petersen, J. (2021). Risk of Malnutrition upon Admission and after Discharge in Acutely Admitted Older Medical Patients: A Prospective Observational Study. Nutrients, 13(8), 2757. https://doi.org/10.3390/nu13082757