
Effects of Soy Protein Containing of Isoflavones and Isoflavones Extract on Plasma Lipid Profile in Postmenopausal Women as a Potential Prevention Factor in Cardiovascular Diseases: Systematic Review and Meta-Analysis of Randomized Controlled Trials

 , ,
, ,
Abstract
:1. Introduction
2. Materials and Methods
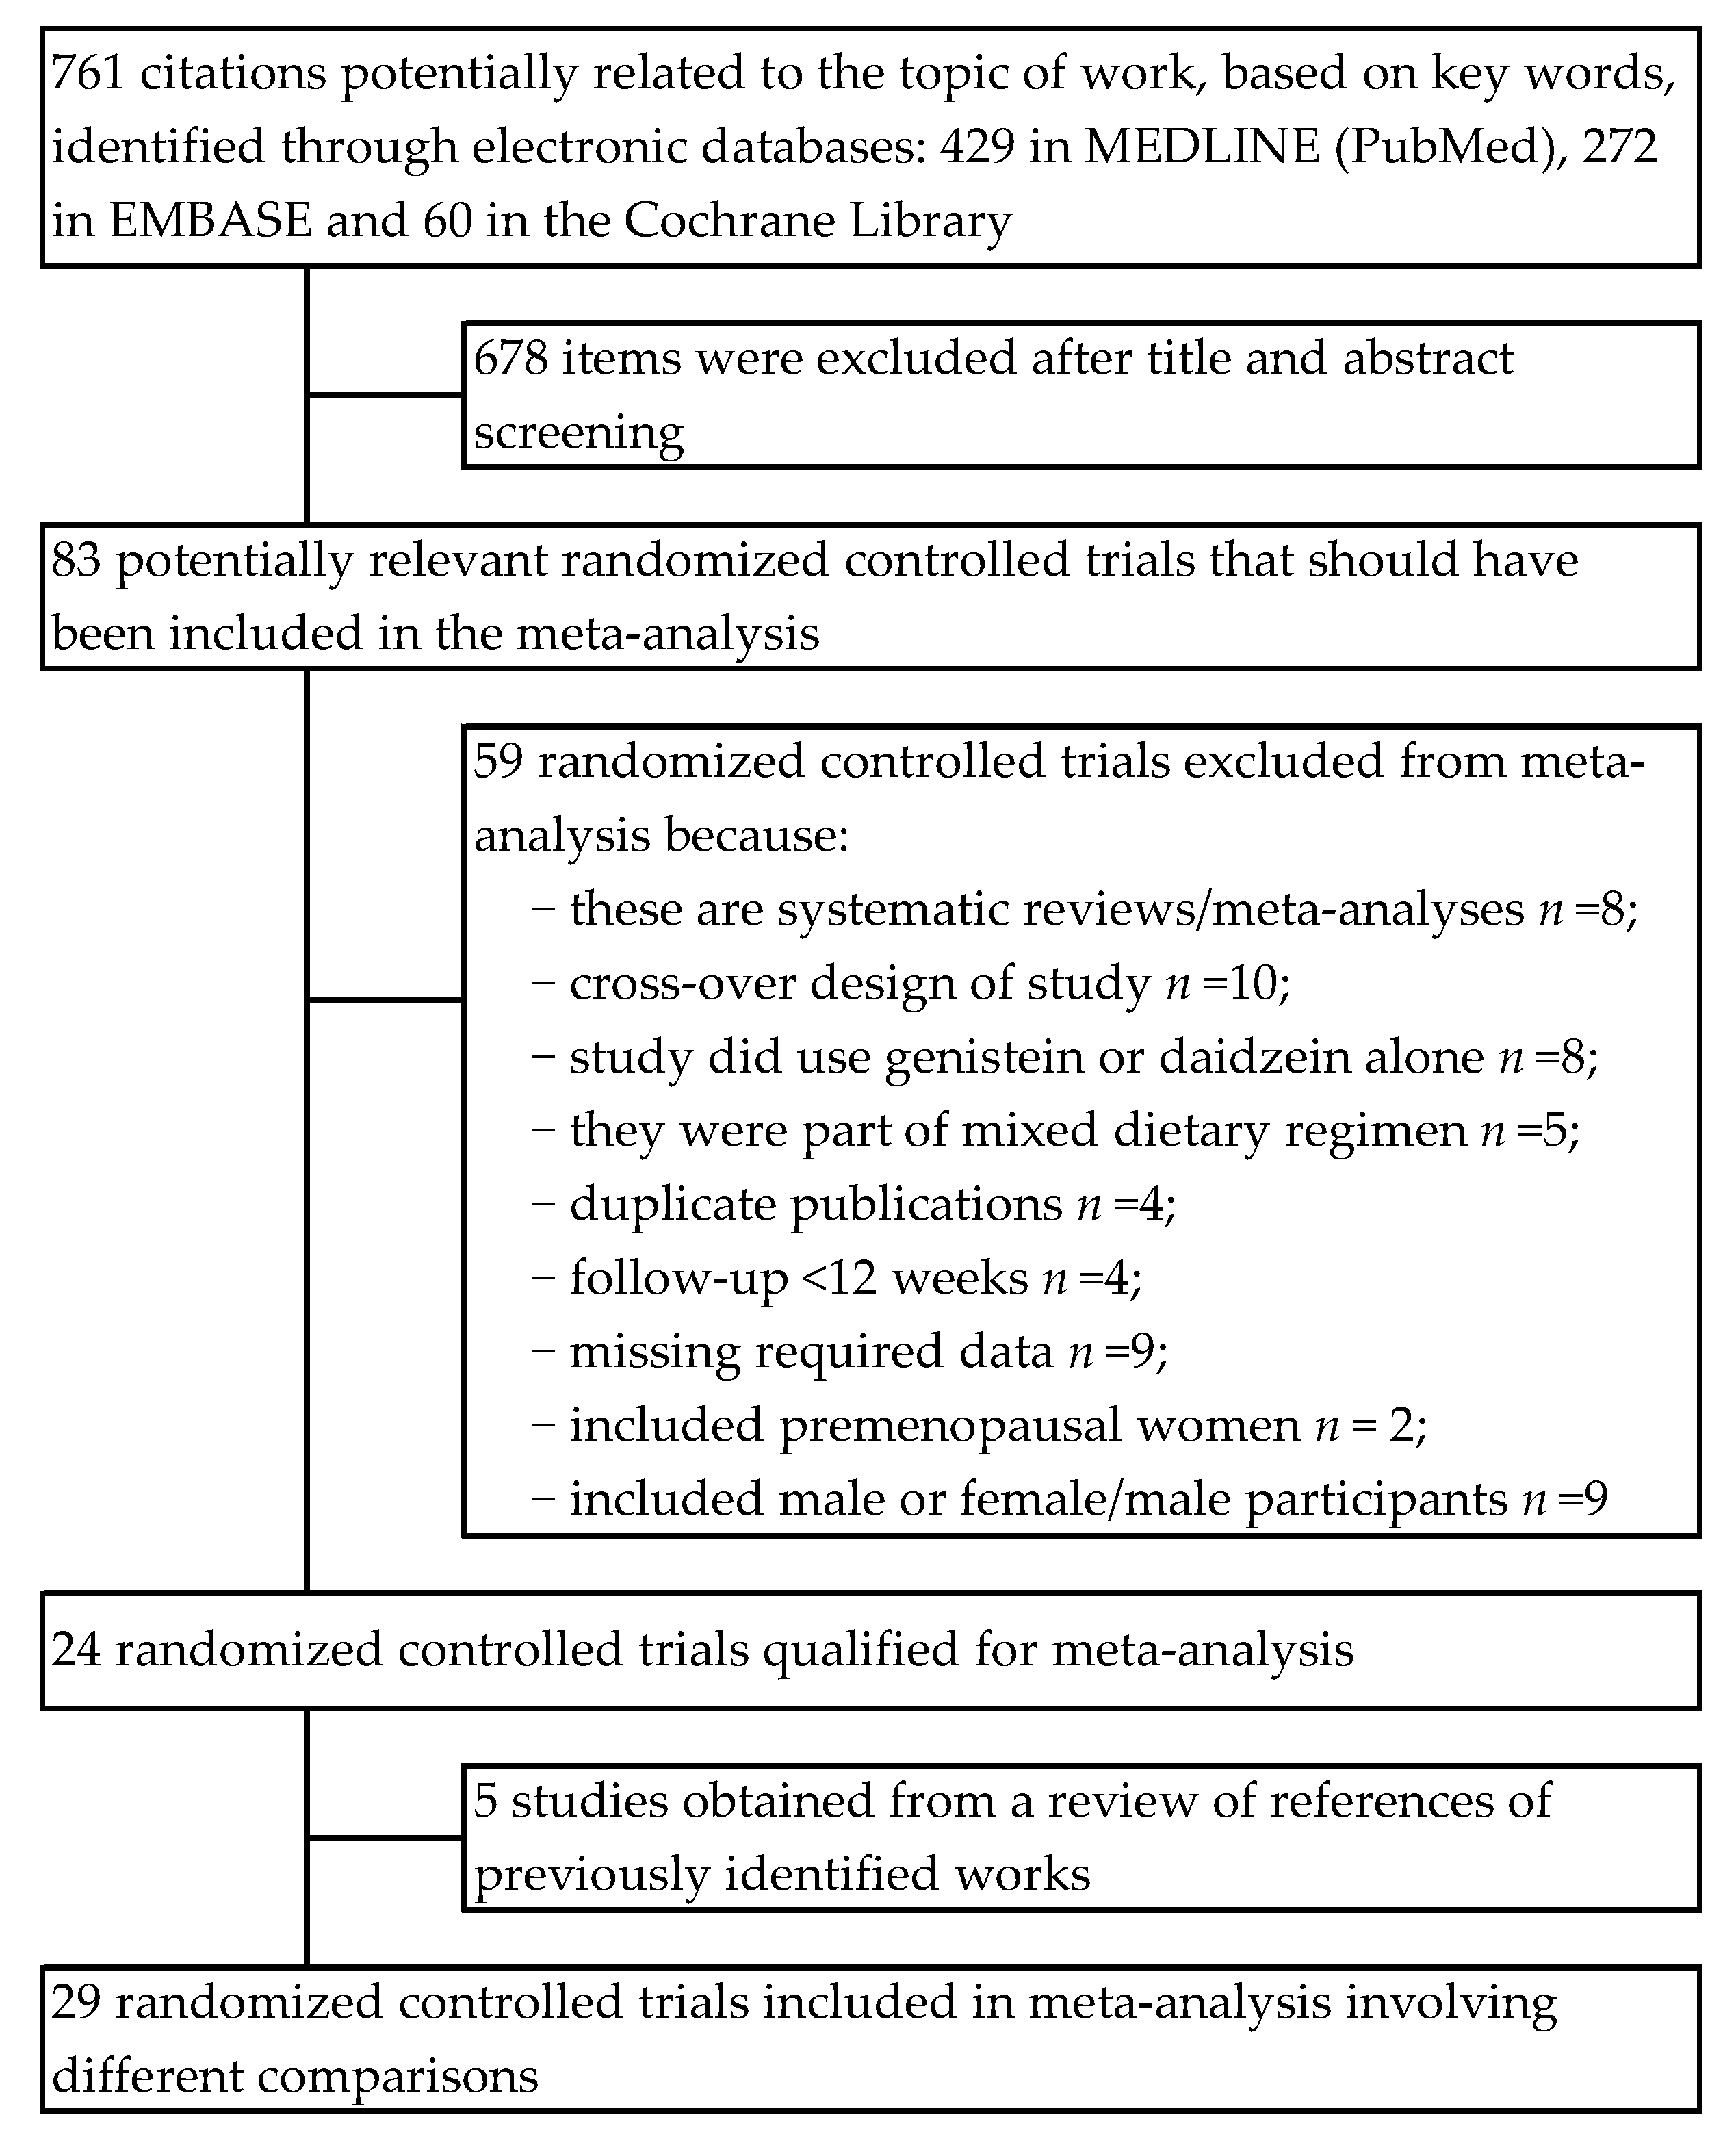
2.1. Search Strategy and Study Selection
2.2. Data Extraction
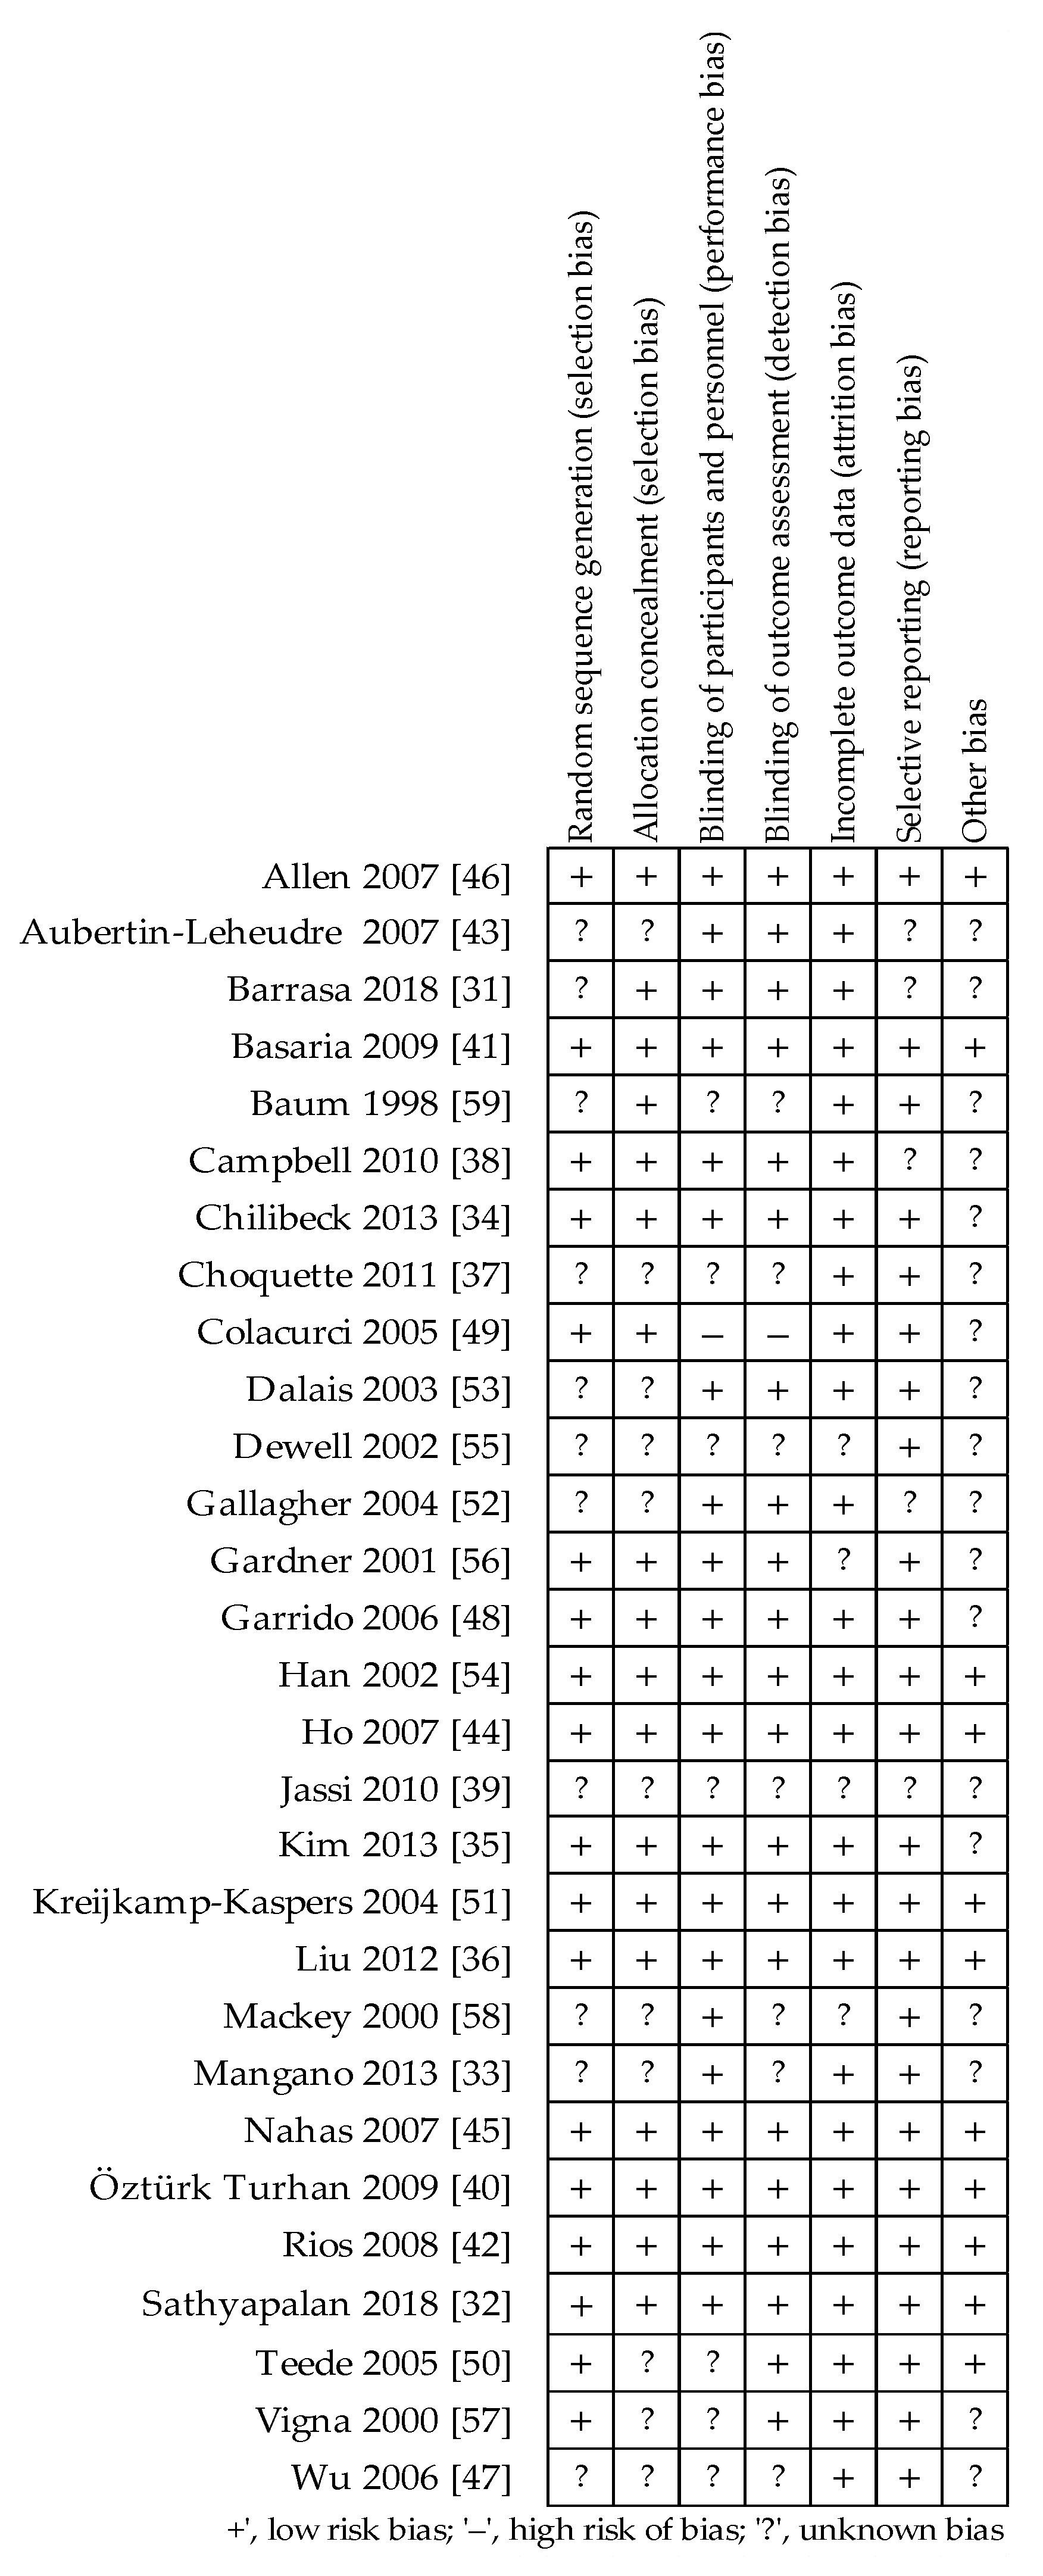
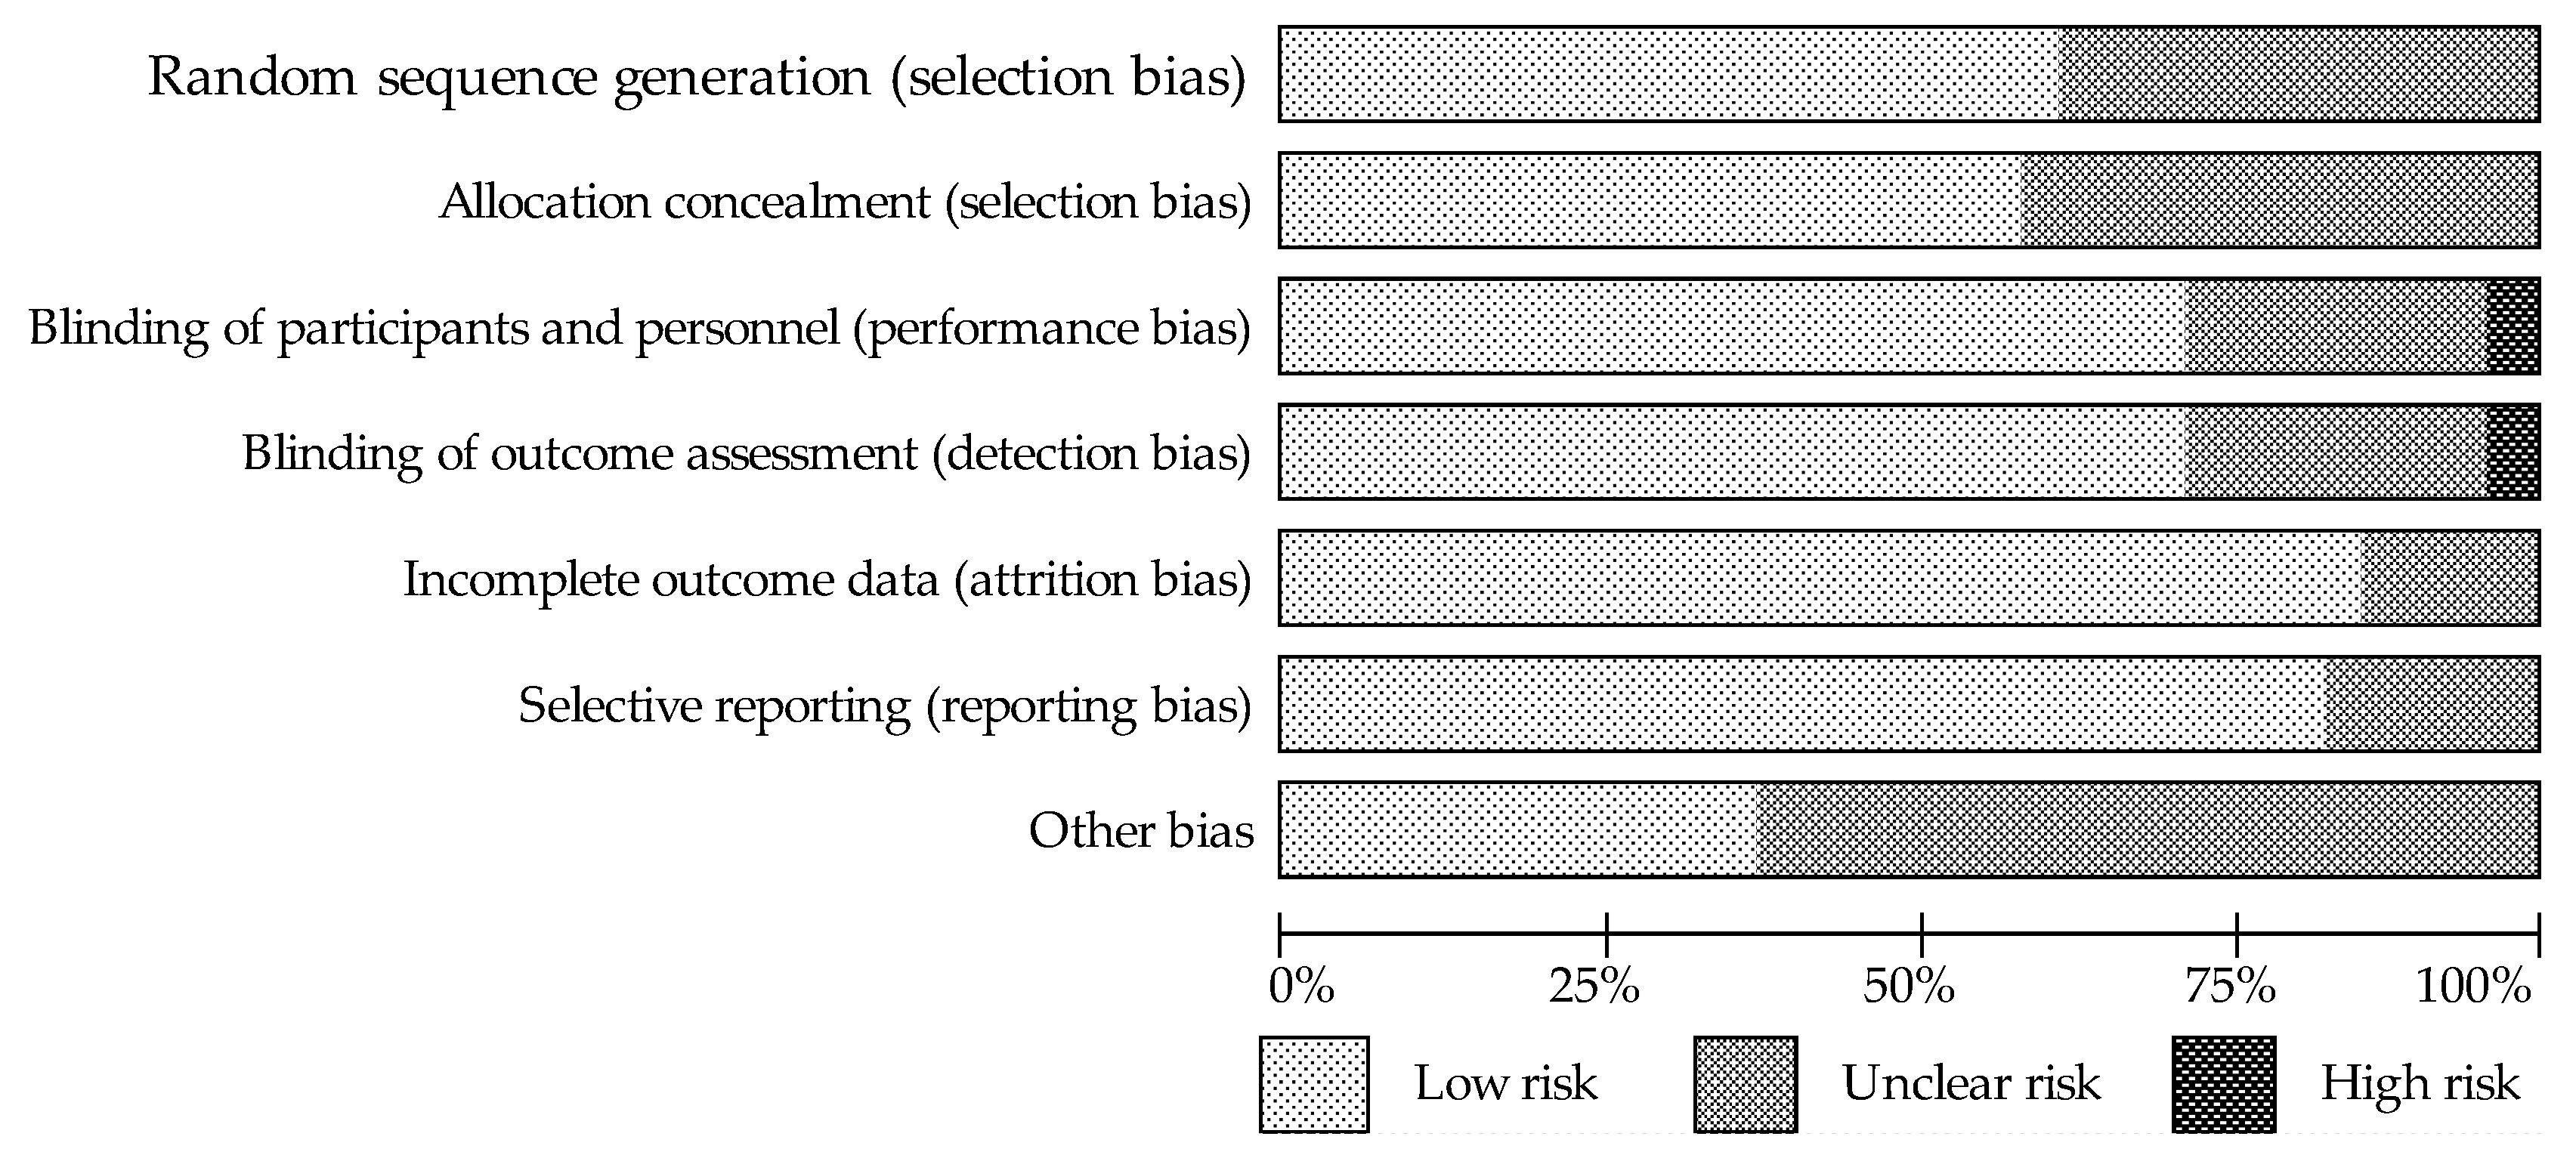
2.3. Quality Assessment and Bias Risk of the Trials
2.4. Statistical Analysis and Meta-Analysis
2.5. Subgroup Analysis
3. Results
3.1. Assessment of the Methodological Quality of Trials
3.2. Characteristics of Included Trials

| First Authors Data [ref.] Country | Study Design Trial Duration | Study Population Health Condition’ | n Sample (Treated/Control) Placebo | Intervention (Daily Dose) | Dietary Advice During Study: | Group Studied | Baseline Lipids Values | |||
|---|---|---|---|---|---|---|---|---|---|---|
| TC mmol/L | LDL-C mmol/L | HDL-C mmol/L | TAG mmol/L | |||||||
| Barrasa 2018 [31] Chile | Parallel groups 1-wk run-in / 3-mo follow-up | Mean age 64.7 ± 4.6 (55–72) y, ysm N/A, BMI 27.6 ± 0.9, healthy | 20/15 | IAE 100 mg (52 mg Gen, 40 mg Dai, 8 mg Gly) vs. placebo | No reported | SG CG | 5.13 ± 0.68 4.87 ± 0.62 | 3.10 ± 0.94 2.97 ± 0.50 | 1.30 ± 0.43 1.18 ± 0.38 | 1.53 ± 0.39 1.54 ± 0.36 |
| Sathyapalan 2018 [32] Great Britain | Parallel groups 6-mo follow-up | Mean age 52 (49–56) y, ysm < 2, BMI 25.4, healthy | 60/60 | SP 15 g, IAE 66 mg (54% Gen, 35% Dai, 12% Gly) vs. SP 15 g | Avoiding other dietary products containing soy | SG CG | 5.8 ± 0.9 5.8 ± 0.8 | 3.65 ± 0.7 3.65 ± 0.9 | 1.68 ± 0.94 1.78 ± 0.42 | 1.16 ± 0.62 1.18 ± 0.57 |
| Mangano 2013 [33] USA | Parallel groups 12-mo follow-up | Mean age 73.9 ± 5.9 (>60) y, ysm 23.1 ± 9.0, BMI 28.8 ± 5.8, healthy | 25/22 | SP 18 g + IC 105 mg (0.61% Agl) vs. control (MP 18 g + placebo) | Avoiding soy foods, nutritional or herbal supplements | SG CG | 5.45 ± 0.87 5.46 ± 1.29 | 3.50 ± 0.77 3.57 ± 1.13 | 1.39 ± 0.32 1.33 ± 0.33 | 1.23 ± 0.62 1.23 ± 0.54 |
| Chilibeck 2013 [34] Canada | Parallel groups 24-mo follow-up | Mean age 56.6 ± 6.8 y, ysm N/A, BMI 27.1 ± 4.1, healthy | 72/73 | IC 165 mg (105 mg Agl: Gen, Dai and Gly in ratio of 1:1:0.2) vs. placebo | No reported | SG CG | 5.87 ± 0.96 5.76 ± 0.91 | 3.68 ± 0.91 3.59 ± 0.89 | 1.58 ± 0.41 1.52 ± 0.44 | 1.41 ± 1.03 1.43 ± 0.79 |
| Kim 2013 [35] Republic of Korea | Parallel groups 12-wk follow-up | Mean age 53.6 ± 3.4 y, ysm 3.6 ± 2.4, BMI 23.3 ± 2.5, healthy | 42/43 | IC 70 mg (Glyco: 38 mg glycitin, 20 mg daidzin, 12 mg genistin) vs. placebo | Limitation of soy products | SG CG | 5.13 ± 0.85 5.48 ± 1.03 | 2.97 ± 0.70 3.25 ± 0.92 | 1.49 ± 0.36 1.52 ± 0.37 | 1.26 ± 0.72 1.27 ± 0.66 |
| Liu 2012 [36] Hong Kong SAR | Parallel groups 2-wk run-in / 3- mo follow-up | Mean age 56.3 ± 4.3 (48–70) y, ysm 5.9 ± 5.4, BMI 24.4 ± 3.6, prediabetes | 60/60 | SP 15 g, IAE 100 mg (59 mg Gen,4 mg Gly, 35 mg Dai) vs. MP 15 g | Other phytoestrogen supplements were prohibited | SG CG | 5.83 ± 0.94 5.63 ± 0.93 | 3.94 ± 0.67 3.81 ± 0.88 | 1.66 ± 0.31 1.65 ± 0.30 | 1.35 ± 1.19 1.30 ± 0.70 |
| Choquette 2011 [37] Canada | Parallel groups 6-mo follow-up | Mean age 58.5 ± 5.5 (50–70) y, ysm 9.0 ± 7.0, BMI 30.1 ± 2.7 overweight/obesity | 23/22 | IAE 70 mg (44 mg Dai, 16 mg Gly,10 mg Gen) vs. placebo | Maintaining normal eating habits | SG CG | 5.40 ± 0.88 5.58 ± 0.86 | 3.34 ± 0.75 3.34 ± 0.81 | 1.49 ± 0.34 1.57 ± 0.32 | 1.47 ± 0.67 1.44 ± 0.73 |
| Campbell 2010 [38] USA | Parallel groups 12-mo follow-up | Mean age 54.7 ± 5.5 (<65) ys, ysm 5.5 ± 5.0; BMI 27.9 ± 5.9, hypercholesterolemic | 35/27 | SP 25 g, 60 mg IF vs. CP 25 g | Maintaining normal eating habits | SG CG | 5.97 ± 0,93 6.15 ± 0.91 | 3.88 ± 0.90 3.95 ± 0.87 | 1.47 ± 0.38 1.50 ± 0.36 | 1.34 ± 0.70 1.48 ± 0.67 |
| Jassi 2010 [39] India | Parallel groups 12-wk follow-up | Mean age 51.1 ± 8.6 (40–60) y, ysm 2.3 ± 1.2, BMI 23.4 ± 2.7, healthy | 25/25 | SP 30 g, IF 60 mg vs. CP 30 g | No reported | SG CG | 4.96 ± 0.36 4.69 ± 0.71 | 3.09 ± 0.37 2.83 ± 0.76 | 1.06 ± 0.15 1.06 ± 0.16 | 1.76 ± 0.28 1.76 ± 0.17 |
| Öztürk Turhan 2009 [40] Turkey | Parallel groups 6-mo follow-up | Mean age 51.5 ± 5.1 (44–58) y, ysm 3.6 ± 1.7, BMI 27.1 ± 3.1, healthy | 45/45 | IAE 40 mg (29.8 mg Gen, 7.8 mg Dai, 2.4 mg Gly) vs. placebo | Not given products with presumed estrogenic activity | SG CG | 6.82 ± 0.96 6.30 ± 0.76 | 4.25 ± 0.73 4.01 ± 0.65 | 1.54 ± 0.35 1.38 ± 0.28 | 1.70 ± 0.53 1.78 ± 0.74 |
| Basaria 2009 [41] USA | Parallel groups 12-wk follow-up | Mean age 55.7 ± 1.3 (46–76) y, ysm 5.7 ± 0.9, BMI 26.1 ± 0.8, healthy | 38/46 | SP 20 g, IC 160 mg (IAE: 64 mg Gen, 63 mg Dai, 34 mg Gly) vs. MP 20 g | Avoiding products: soy, black cohosh, etc. | SG CG | 5.48 ± 0.14 5.69 ± 0.85 | 3.15 ± 0.75 3.21 ± 0.74 | 1.88 ± 0.46 2.02 ± 0.46 | 1.03 ± 0.58 0.99 ± 0.46 |
| Rios 2008 [42] Brazil | Parallel groups 6-mo follow-up | Mean age 55.5 ± 5.2 (47–66) y, ysm 8.8 ± 7.5, BMI 26.5 ± 3.3, healthy | 25/22 | IC 40 mg (5% Gen, 12% Dai) vs. placebo | Exclusion dietary products high in phytoestrogens | SG CG | 5.30 ± 0.90 5.77 ± 1.52 | 3.41 ± 0.81 3.85 ± 1.36 | 1.28 ± 0.27 1.27 ± 0.22 | N/A N/A |
| Aubertin-Leheudre 2008 [43] Canada | Parallel groups 6-mo follow-up | Mean age 57.4 ± 5.4 (50–70) y, ysm 8.6 ± 7.5, BMI 32.0 ± 12.5, obesity | 21/18 | IAE 70 mg (44 mg Dai, 16 mg Gly,10 mg Gen) vs. placebo | Maintaining normal eating habits | SG CG | 5.41 ± 0.88 5.33 ± 0.83 | 3.17 ± 0.81 3.17 ± 0.78 | 1.55 ± 0.49 1.45 ± 0.37 | 1.51 ± 0.69 1.52 ± 0.69 |
| Ho 2007 [44] China | Parallel groups 2-wk run-in / 12-mo follow-up | Mean age 54.2 ± 3.1 (48–62) y, ysm 4.1 ± 2.4, BMI 24.1 ± 3.6, healthy | 67/68/68 | a. IAE 80 mg; b. IAE 40 mg (46.4% Dai, 38.8% Gly, 14.7% Gen) vs. placebo | Maintaining normal eating habits | SG80 SG40 CG | 5.86 ± 0.83 5.83 ± 0.84 5.93 ± 0.89 | 3.19 ± 0.74 3.23 ± 0.68 3.25 ± 0.73 | 1.89 ± 0.41 1.80 ± 0.39 1.86 ± 0.42 | 1.13 ± 0.56 1.32 ± 0.93 1.29 ± 0.96 |
| Nahas 2007 [45] Brazil | Parallel groups 4-wk run-in / 4-mo follow-up | Mean age 55.7 ± 6.8 (>45) y, ysm 6.9 ± 4.5, BMI 29.1 ± 5.0, healthy | 38/38 | IC 100 mg (50% Gen, 35% Dai) vs. placebo | A diet rich in fiber, soy or of vegetarian was banned | SG CG | 5.56 ± 0.92 5.37 ± 0.97 | 3.47 ± 0.82 3.26 ± 0.82 | 1.29 ± 0.27 1.35 ± 0.34 | 1.73 ± 0.74 1.67 ± 0.89 |
| Allen 2007 [46] USA | Parallel groups 4-wk run-in / 12-wk follow-up | Mean age 56.8 ± 5.6 y, ysm 9.4 ± 8.3, BMI 27.9 ± 4.7 hypercholesterolemia | 93/98 | SP 20 g, IC 160 mg (~96 mg Agl) vs. MP 20 g | Low-fat diet | SG CG | 5.80 ± 0.68 5.71 ± 0.64 | 3.67 ± 0.68 3.60 ± 0.57 | 1.56 ± 0,37 1.52 ± 0.31 | 1.25 ± 0.51 1.28 ± 0.60 |
| Wu 2006 [47] Japan | Parallel groups 6-mo follow-up | Mean age 54.4 ± 2.9 (45–60) y, ysm N/A, BMI 21.1 ± 2.4, healthy | 25/29 | IC 75 mg (47 mg Agl: Dai 38.3 mg, Gen 8.6 mg, Gly 1 mg) vs. placebo | No changes in dietary habits | SG CG | 5.90 ± 0.76 5.88 ± 0.86 | 3.52 ± 0.72 3.59 ± 0.76 | 1.92 ± 0.47 1.85 ± 0.38 | 0.95 ± 0.43 1.16 ± 0.53 |
| Garrido 2006 [48] Chile | Parallel groups 12-wk follow-up | Mean age 53.5 ± 4.0 (45–60) y, ysm N/A, BMI 26.9 ± 2.3, healthy | 15/14 | IAE ~100 mg (46,8 mg Dai, 48.2 mg Gen) vs. placebo | Herbal supplements or soy products were prohibited | SG CG | 5.5 ± 1.0 4.8 ± 0.5 | 3.4 ± 0.4 2.9 ± 0.3 | 1.4 ± 0.3 1.8 ± 0.6 | 1.3 ± 0.2 1.4 ± 0.2 |
| Colacurci 2005 [49] Italy | Parallel groups 6-mo follow-up | Mean age 55.1 ± 3.8 y, ysm 4.9 ± 0.6, BMI 25.9 ± 1.8, healthy | 29/28 | IAE 60 mg (30 mg Gen, 30 mg Dai) vs. placebo | Other soy products were prohibited | SG CG | N/A N/A | 3.7 ± 0.3 3.6 ± 0.4 | 1.6 ± 0.5 1.5 ± 0.5 | 1.5 ± 0.6 1.6 ± 0.8 |
| Teede 2005 [50] Australia | Parallel groups 3-d run-in / 3-mo follow-up | Mean age 59.5 ± 4.5 (50–75) y, ysm N/A, BMI 25.9 ± 5.4, healthy | 19/21 | SP 40 g, IC 118 mg (54 mg Gen, 3.6 mg Gly, 26 mg Dai) vs. CP 40 g | Dietary items high in phytoestrogens were excluded | SG CG | 6.2 ± 1.30 5.8 ± 0.92 | 4.0 ± 0.87 3.6 ± 0,92 | 1.6 ± 0.43 1.6 ± 0.46 | 1.0 ± 0.48 1.0 ± 0.63 |
| Kreijkamp-Kaspers 2004 [51] Netherlands | Parallel groups 12-mo follow-up | Mean age 66.6 ± 4.7 (60–75) y, ysm 17.9 ± 6.9, BMI 26.1 ± 3.8, healthy | 88/87 | SP 25.6 g, IAE 99 mg (52 mg Gen, 6 mg Gly, 41 mg Dai) vs. MP 25,6 mg | After consultation, possible changes in the diet possible changes in the diet | SG CG | 6.21 ± 0.73 6.11 ± 0.95 | 4.16 ± 0.99 4.12 ± 0.88 | 1.55 ± 0.41 1.53 ± 0.34 | 1.36 ± 0.72 1.25 ± 0.59 |
| Gallagher 2004 [52] United States | Parallel groups 1 wk run-in / 15-mo follow-up | Mean age 55.4 ± 1.2 (40–62) y, ysm 7.6 ± 1.3, BMI 26.4 ± 9.8, healthy | 17/19/14 | SP 40 g: a. IC 96 mg (52 mg Gen, 28 mg Dai); b. IC 52 mg (28 mg Gen, 20 mg Dai) vs. SP 40 g | Restricted animal protein | SG96 SG52 CG | 5.70 ± 0.88 7.04 ± 0.59 5.49 ± 1.32 | 3.57 ± 0.81 3.50 ± 0.83 3.48 ± 1.31 | 1.42 ± 0.33 1.47 ± 0.34 1.44 ± 0.27 | 1.56 ± 0.91 1.53 ± 0,82 1,24 ± 0.47 |
| Dalais 2003 [53] Australia | Parallel groups 3-mo follow-up | Mean age 60 ± 6.2 (50–75) y ysm N/A, BMI 25.3 ± 4.6, healthy | 38/40 | SP 40 g, IC 118 mg (69 mg Agl) vs. CP 40 g | No reported | SG CG | 6.12 ± 0.92 5.92 ± 0.88 | 4.00 ± 0.86 3.69 ± 0.88 | 1.63 ± 0.49 1.72 ± 0.51 | 1.09 ± 0.68 1.01 ± 0.57 |
| Han 2002 [54] Brazil | Parallel groups 4-mo fallow-up | Mean age 48.5 ± 7.6 (45–55) y, ysm 1.9 ± 1.6, BMI 24.3 ± 3.2, healthy | 40/40 | SP 50.3 mg, IAE 33.3 mg (23.3 mg Gen, 3.8 mg Gly, 6.2 mg Dai) vs. placebo | No reported | SG CG | 5.83 ± 0.88 5.86 ± 1.26 | 3.45 ± 0.87 3.45 ± 1.32 | 1.04 ± 0.23 1.03 ± 0.21 | 2.31 ± 1.66 1.99 ± 1.66 |
| Dewell 2002 [55] USA | Parallel groups 2-mo follow-up | Mean age 69.5 ± 4.2 (64–83) y, ysm N/A, BMI 25.0 ± 4.2 moderate hypercholesterolemia | 20/16 | IC 150 mg (90 mg Agl: 45% Gen, 55% Dai and Gly) vs. placebo | Diet excluding foods containing soy | SG CG | 6.8 ± 0.9 6.3 ± 2.0 | 5.6 ± 0.9‡ 5.1 ± 2.0‡ | 1.2 ± 0.5 1.2 ± 0.4 | 0.8 ± 0.5 1.3 ± 0.8 |
| Gardner 2001 [56] USA | Parallel groups 4-wk run-in / 12-wk follow-up | Mean age 59.9 ± 6.6 (<80) y, ysm N/A, BMI 26.3 ± 4.6, hypercholesterolemia | 31/30 | SP 42 g, IAE 80 mg (52 mg Gen, 25 mg Dai, 4 mg Gly) vs. MP 42 g | Diet excluding foods containing soy | SG CG | 5.9 ± 0.6 6.1 ± 0.6 | 3.9 ± 0.6 4.0 ± 0.5 | 1.5 ± 0.3 1.5 ± 0.4 | 1.3 ± 0.8 1.3 ± 0.7 |
| Vigna 2000 [57] Italy | Parallel groups 12-wk follow-up | Mean age 53.4 ± 3.3, ysm 2.4, BMI 25.9 ± 3.5, healthy | 40/37 | SP 40 g, IF 76 mg vs. CP 40 g | No reported | SG CG | 6.37 ± 1.01 6.55 ± 0.93 | 4.13 ± 0.87 4.33 ± 0.87 | 1.57 ± 0.36 1.61 ± 0.38 | 1.47 ± 0.90 1.32 ± 0.77 |
| Mackey 2000 [58] Australia | Parallel groups 4-wk run-in / 12-wk follow-up | Mean age 56.6 ± 4.6 (45–65) y, ysm N/A, BMI N/A hypercholesterolemia | 25 /24 | SP 28 g, IF 65 mg vs. SP 28 g | Dietary guidelines from National Heart Foundation | SG CG | 7.29 ± 0.90 7.47 ± 1.04 | 5.07 ± 0.73 5.11 ± 1.02 | 1.52 ± 0.39 1.66 ± 0.45 | 1.53 ± 0.82 1.54 ± 0.77 |
| Baum 1998 [59] USA | Parallel groups 2-wk run-in / 12-wk follow-up | Mean age 60.8 ± 8.6 (49–83) y, ysm N/A, BMI 27.8 ± 5.3, hypercholesterolemia | 21/23/22 | SP 40 g: a. IAE 90 mg; b. IAE 56 mg vs. CP + MP 40 g | Low-fat diet | SG90 SG56 CG | 6.47 ± 0.88 6.57 ± 0.85 6.26 ± 0.67 | 5.1 ± 1.0‡ 5.2 ± 0.9‡ 4.9 ± 0.8‡ | 1.38 ± 0.32 1.34 ± 0.28 1.38 ± 0.31 | 1.74 ± 0.75 1.89 ± 1.02 1.75 ± 1.11 |
3.3. Interventions
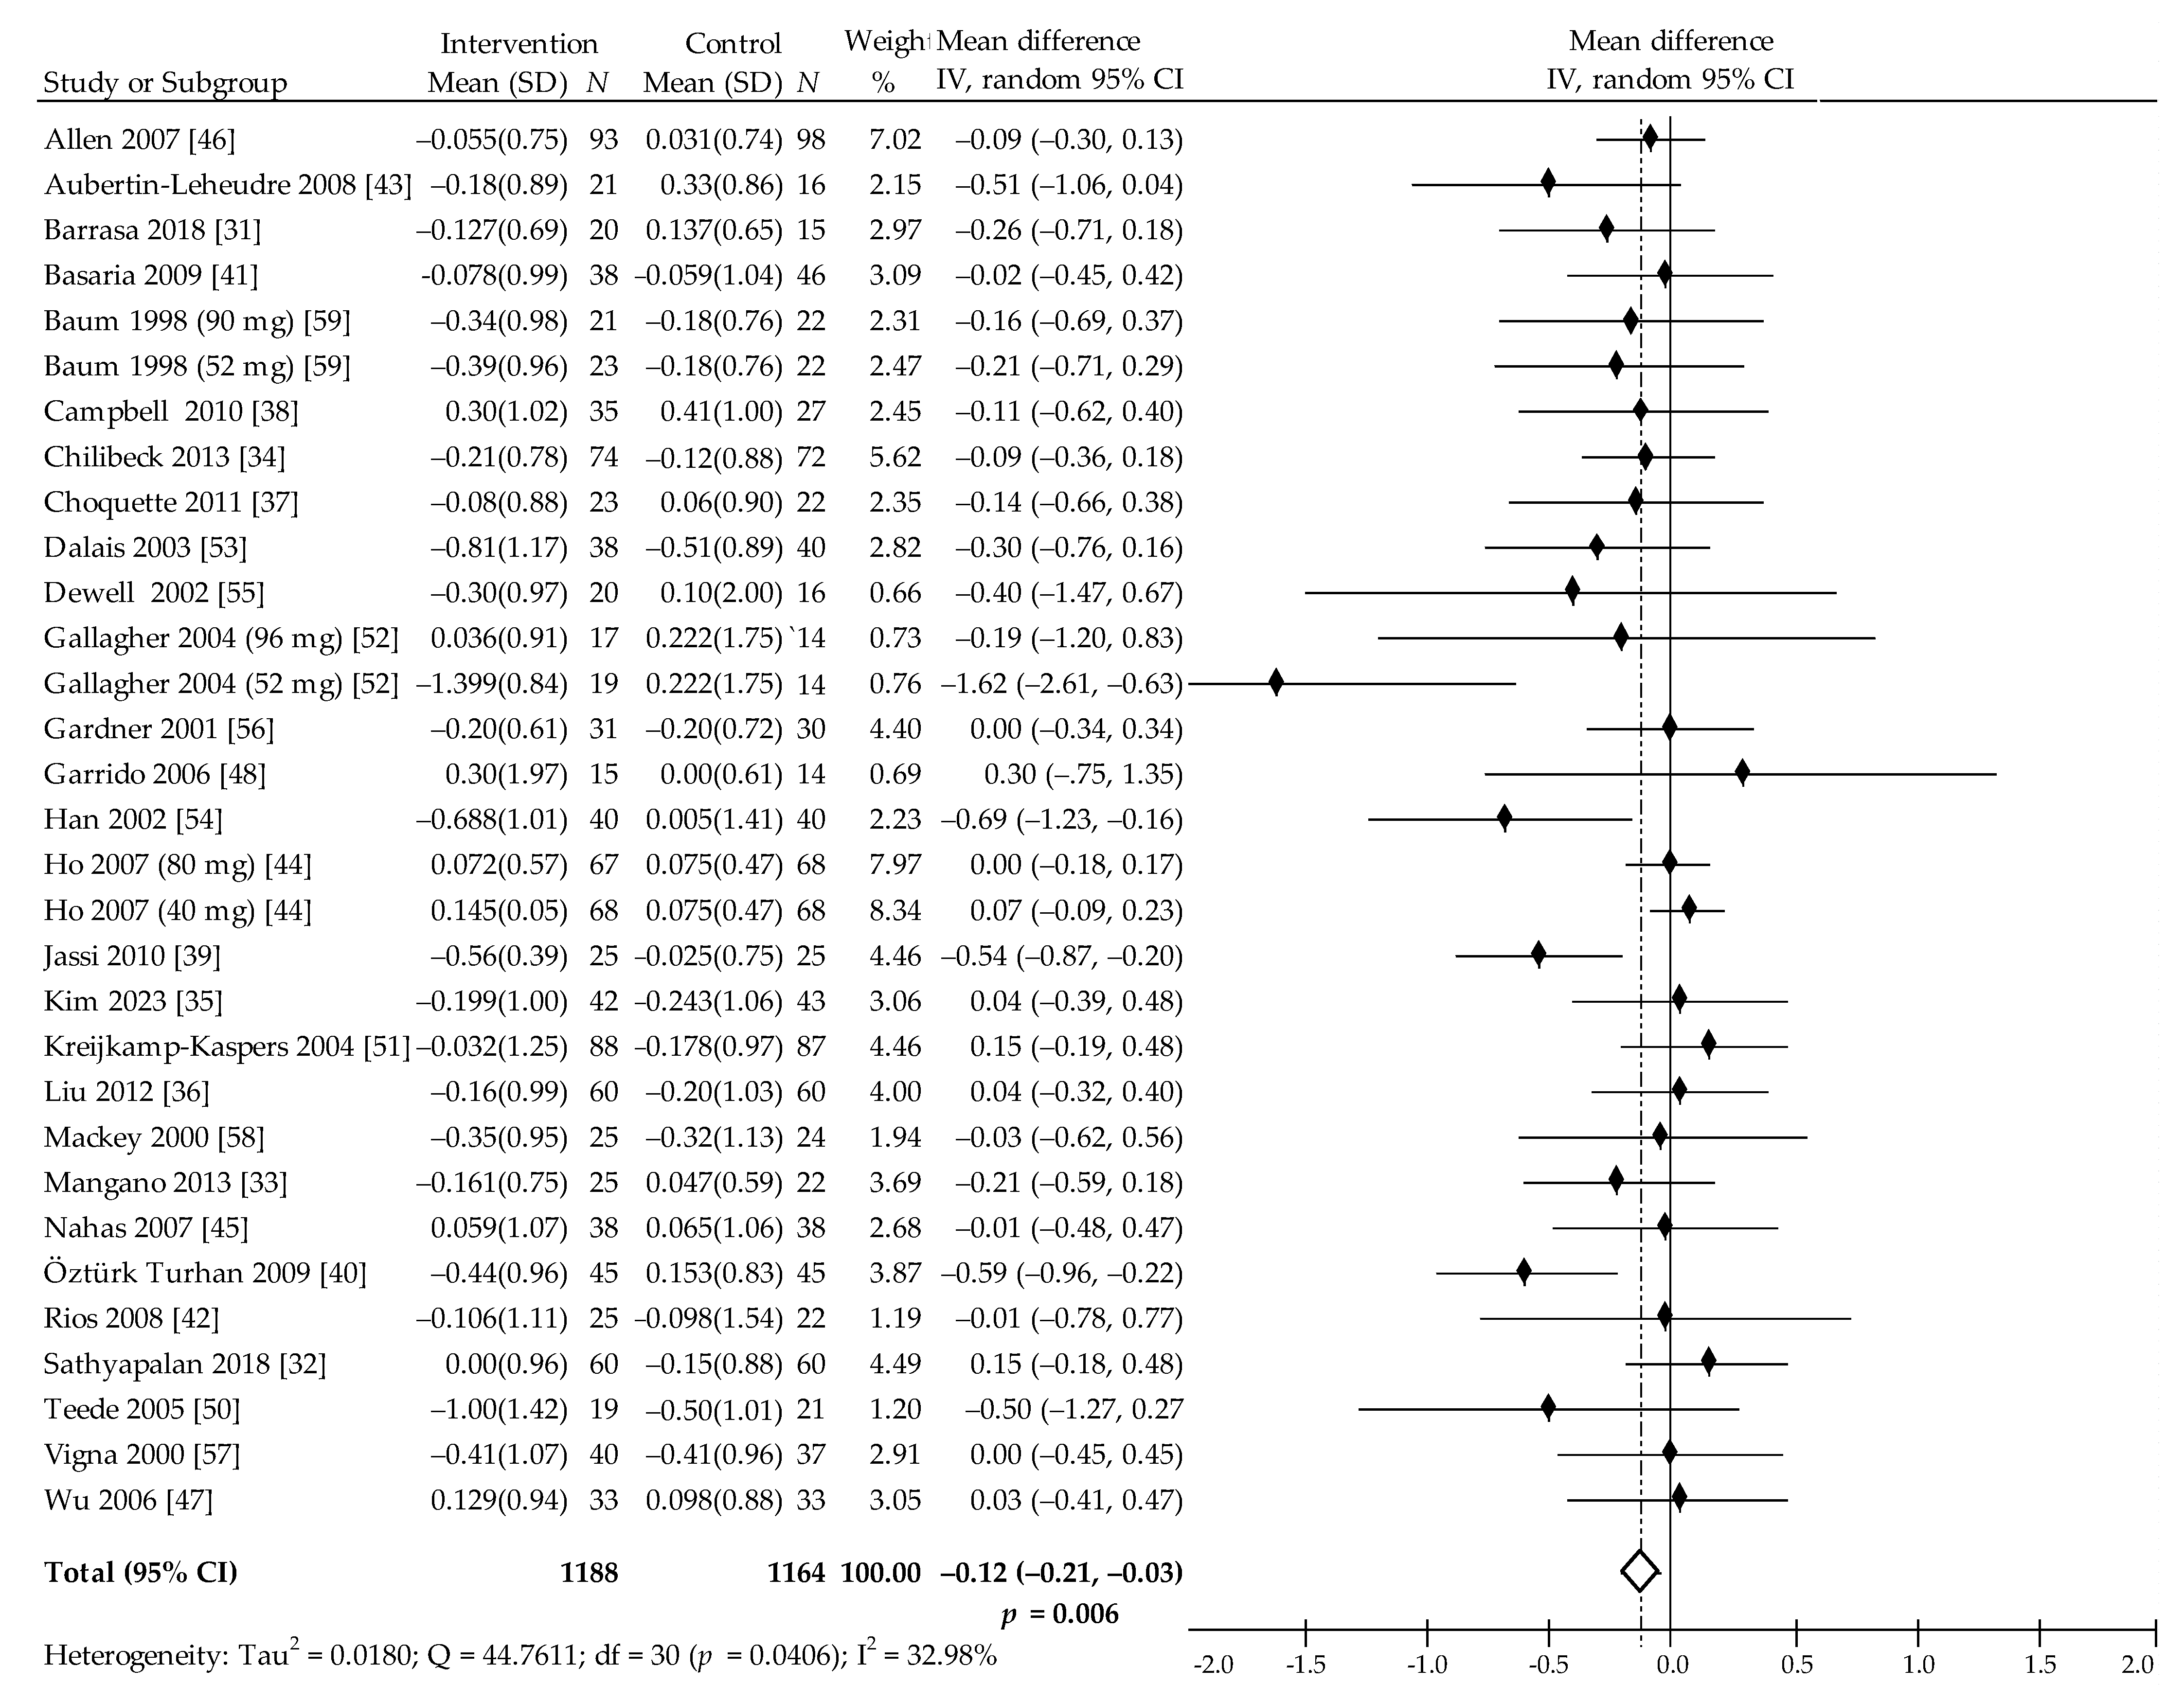
3.4. Meta-Analysis
4. Discussion
5. Conclusions
Supplementary Materials
Author Contributions
Funding
Institutional Review Board Statement
Informed Consent Statement
Data Availability Statement
Conflicts of Interest
References
- Tunstall-Pedoe, H.; Kuulasmaa, K.; Amouyel, P.; Arveiler, D.; Rajakangas, A.M.; Pajak, A. Myocardial infarction and coronary deaths in the World Health Organization MONICA Project. Registration procedures, event rates, and case-fatality rates in 38 populations from 21 countries in four continents. Circulation 1994, 90, 583–612. [Google Scholar] [CrossRef] [PubMed] [Green Version]
- Papakonstantinou, E.; Lambadiari, V.; Dimitriadis, G.; Zampelas, A. Metabolic syndrome and cardiometabolic risk factors. Curr. Vasc. Pharm. 2013, 11, 858–879. [Google Scholar] [CrossRef]
- Douchi, T.; Yonehara, Y.; Kawamura, Y.; Kuwahata, A.; Kuwahata, T.; Iwamoto, I. Difference in segmental lean and fat mass components between pre- and postmenopausal women. Menopause 2007, 14, 875–878. [Google Scholar] [CrossRef]
- Choi, Y.; Chang, Y.; Kim, B.K.; Kang, D.; Kwon, M.J.; Kim, C.W.; Jeong, C.; Ahn, Y.; Park, H.Y.; Ryu, S.; et al. Menopausal stages and serum lipid and lipoprotein abnormalities in middle-aged women. Maturitas 2015, 80, 399–405. [Google Scholar] [CrossRef] [PubMed]
- Walton, C.; Godsland, I.F.; Proudler, A.J.; Wynn, V.; Stevenson, J.C. The effects of the menopause on insulin sensitivity, secretion and elimination in non-obese, healthy women. Eur. J. Clin. Investig. 1993, 23, 466–473. [Google Scholar] [CrossRef]
- Matthews, K.A.; Crawford, S.L.; Chae, C.U.; Everson-Rose, S.A.; Sowers, M.F.; Sternfeld, B.; Sutton-Tyrrell, K. Are changes in cardiovascular disease risk factors in midlife women due to chronological aging or to the menopausal transition? J. Am. Coll. Cardiol. 2009, 54, 2366–2373. [Google Scholar] [CrossRef] [Green Version]
- Tufano, A.; Marzo, P.; Enrini, R.; Morricone, L.; Caviezel, F.; Ambrosi, B. Anthropometric, hormonal and biochemical differences in lean and obese women before and after menopause. J. Endocrinol. Investig. 2004, 27, 648–653. [Google Scholar] [CrossRef]
- Kanadys, W.; Barańska, A.; Jedrych, M.; Religioni, U.; Janiszewska, M. Effects of red clover (Trifolium pratense) isoflavones on the lipid profile of perimenopausal and postmenopausal women—A systematic review and meta-analysis. Maturitas 2020, 132, 7–16. [Google Scholar] [CrossRef]
- Stevenson, J.C.; Crook, D.; Godsland, I.F. Influence of age and menopause on serum lipids and lipoproteins in healthy women. Atherosclerosis 1993, 98, 83–90. [Google Scholar] [CrossRef]
- de Kat, A.C.; Dam, V.; Onland-Moret, N.C.; Eijkemans, M.J.; Broekmans, F.J.; van der Schouw, Y.T. Unraveling the associations of age and menopause with cardiovascular risk factors in a large population-based study. BMC Med. 2017, 15, 2. [Google Scholar] [CrossRef] [Green Version]
- Cholesterol Treatment Trialists’ (CTT) Collaboration; Baigent, C.; Blackwell, L.; Emberson, J.; Holland, L.E.; Reith, C.; Bhala, N.; Peto, R.; Barnes, E.H.; Keech, A.; et al. Eficacy and safety of more intensive lowering of LDL cholesterol: A meta-analysis of data from 170,000 participants in 26 randomised trials. Lancet 2010, 376, 1670–1681. [Google Scholar] [CrossRef] [Green Version]
- Silverman, M.G.; Ference, B.A.; Im, K.; Wiviott, S.D.; Giugliano, R.P.; Grundy, S.M.; Braunwald, E.; Sabatine, M.S. Association between lowering LDL-C and cardiovascular risk reduction among different therapeutic interventions: A systematic review and meta-analysis. JAMA 2016, 316, 1289–1297. [Google Scholar] [CrossRef] [Green Version]
- Ramdath, D.D.; Padhi, E.M.T.; Sarfaraz, S.; Renwick, S.; Duncan, A. Beyond the cholesterol-lowering effect of soy protein: A review of the effects of dietary soy and its constituents on risk factors for cardiovascular disease. Nutrients 2017, 9, 324. [Google Scholar] [CrossRef] [Green Version]
- Chan, Y.H.; Lau, K.K.; You, K.H.; Li, S.W.; Chan, H.T.; Tam, S.; Shu, X.O.; Lau, C.P.; Tse, H.F. Isoflavone intake in persons at high risk of cardiovascular events: Implications for vascular endothelial function and the carotid atherosclerotic burden. Am. J. Clin. Nutr. 2007, 86, 938–945. [Google Scholar] [CrossRef] [Green Version]
- Food labeling: Health claims; soy protein and coronary heart disease. Food and Drug Administration, HHS. Final rule. Fed. Regist 1999, 64, 206.
- Sacks, F.M.; Lichtenstein, A.; Van Horn, L.; Harris, W.; Kris-Etherton, P.; Winston, M. American Heart Association Nutrition Committee. Soy protein, isoflavones, and cardiovascular health: An American Heart Association Science Advisory for professionals from the Nutrition Committee. Circulation 2006, 113, 1034–1044. [Google Scholar] [CrossRef] [Green Version]
- Health Canada. Summary of Health Canada’s Assessment of a Health Claim about Soy Protein and Cholesterol Lowering. 2015. Available online: https://www.canada.ca/content/dam/hc-sc/migration/hc-sc/fn-an/alt_formats/pdf/label-etiquet/claims-reclam/assess-evalu/Sum-Assessment-Soy-April-2015-eng.pdf (accessed on 1 January 2021).
- Anderson, T.J.; Grégoire, J.; Pearson, G.J.; Barry, A.R.; Couture, P.; Dawes, M.; Francis, G.A.; Genest, J., Jr.; Grover, S.; Gupta, M.; et al. 2016 Canadian Cardiovascular Society Guidelines for the Management of Dyslipidemia for the Prevention of Cardiovascular Disease in the Adult. Can. J. Cardiol. 2016, 32, 1263–1282. [Google Scholar] [CrossRef]
- European Association for Cardiovascular Prevention & Rehabilitation; Reiner, Z.; Catapano, A.L.; De Backer, G.; Graham, I.; Taskinen, M.R.; Wiklund, O.; Agewall, S.; Alegria, E.; Chapman, M.J.; et al. ESC Committee for Practice Guidelines (CPG) 2008–2010 and 2010–2012 Committees. ESC/EAS Guidelines for the management of dyslipidaemias: The Task Force for the management of dyslipidaemias of the European Society of Cardiology (ESC) and the European Atherosclerosis Society (EAS). Eur. Heart J. 2011, 32, 1769–1818. [Google Scholar] [CrossRef] [Green Version]
- Blanco Mejia, S.; Messina, M.; Li, S.S.; Viguiliouk, E.; Chiavaroli, L.; Khan, T.A.; Srichaikul, K.; Mirrahimi, A.; Sievenpiper, J.L.; Kris-Etherton, P.; et al. A meta-analysis of 46 studies identified by the FDA demonstrates that soy protein decreases circulating LDL and total cholesterol concentrations in adults. J. Nutr. 2019, 149, 968–981. [Google Scholar] [CrossRef]
- Li, N.; Wu, X.; Zhuang, W.; Xia, L.; Chen, Y.; Zhao, R.; Yi, M.; Wan, Q.; Du, L.; Zhou, Y. Soy and isoflavone consumption and multiple health outcomes: Umbrella review of systematic reviews and meta-analyses of observational studies and randomized trials in humans. Mol. Nutr. Food Res. 2020, 64. [Google Scholar] [CrossRef] [PubMed]
- Barańska, A.; Błaszczuk, A.; Polz-Dacewicz, M.; Kanadys, W.; Malm, M.; Janiszewska, M.; Jedrych, M. Effects of Soy Isoflavones on Glycemic Control and Lipid Profile in Patients with Type 2 Diabetes: A Systematic Review and Meta-Analysis of Randomized Controlled Trials. Nutrients 2021, 13, 1886. [Google Scholar] [CrossRef]
- Moher, D.; Shamseer, L.; Clarke, M.; Ghersi, D.; Liberati, A.; Petticrew, M.; Shekelle, P.; Stewart, L.A. PRISMA-P Group. Preferred reporting items for systematic review and meta-analysis protocols (PRISMA-P) 2015 statement. Syst. Rev. 2015, 4, 1. [Google Scholar] [CrossRef] [Green Version]
- Higgins, J.P.T.; Thomas, J.; Chandler, J.; Cumpston, M.; Li, T.; Page, M.J.; Welch, V.A. Cochrane Handbook for Systematic Reviews of Interventions Version 6.0 (Updated July 2020); John Wiley & Sons: Hoboken, NJ, USA, 2019. [Google Scholar]
- Begg, C.B.; Mazumdar, M. Operating characteristics of a rank correlation test for publication bias. Biometrics 1994, 50, 1088–1101. [Google Scholar] [CrossRef] [PubMed]
- Egger, M.; Smith, G.D.; Schneider, M.; Minder, C. Bias in meta-analysis detected by a simple, graphical test. BMJ 1997, 315, 629–634. [Google Scholar] [CrossRef] [PubMed] [Green Version]
- Follmann, D.; Elliott, P.; Suh, I.; Cutler, J. Variance imputation for overviews of clinical trials with continuous response. J. Clin. Epidemiol. 1999, 45, 769–773. [Google Scholar] [CrossRef]
- DerSimonian, R.; Laird, N. Meta-analysis in clinical trials revisited. Contemp. Clin. Trials 2015, 45, 139–145. [Google Scholar] [CrossRef] [Green Version]
- Higgins, J.P.; Thompson, S.G. Quantifying heterogeneity in a meta-analysis. Stat. Med. 2002, 21, 1539–1558. [Google Scholar] [CrossRef]
- Baker, W.J.; White, C.M.; Cappelleri, J.C.; Kluger, J.; Coleman, C.I. Health Outcomes, Policy, and Economics (HOPE) Collaborative Group. Understanding heterogeneity in meta-analysis: The role of meta-regression. Int. J. Clin. Pract. 2009, 63, 1426–1434. [Google Scholar] [CrossRef] [PubMed]
- Barrasa, G.R.R.; González, N.; Boasi, L.E.V. Age of postmenopause women: Effect of soy Isoflavone in lipoprotein and inflammation markers. J. Menopausal Med. 2018, 24, 176–182. [Google Scholar] [CrossRef]
- Sathyapalan, T.; Aye, M.; Rigby, A.S.; Thatcher, N.J.; Dargham, S.R.; Kilpatrick, E.S.; Atkin, S.L. Soy isoflavones improve cardiovascular disease risk markers in women during the early menopause. Nutr. Metab. Cardiovasc Dis. 2018, 28, 691–697. [Google Scholar] [CrossRef]
- Mangano, K.M.; Hutchins-Wiese, H.L.; Kenny, A.M.; Walsh, S.J.; Abourizk, R.H.; Bruno, R.S.; Lipcius, R.; Fall, P.; Kleppinger, A.; Kenyon-Pesce, L.; et al. Soy proteins and isoflavones reduce interleukin-6 but not serum lipids in older women: A randomized controlled trial. Nutr. Res. 2013, 33, 1026–1033. [Google Scholar] [CrossRef] [PubMed] [Green Version]
- Chilibeck, P.D.; Vatanparast, H.; Pierson, R.; Case, A.; Olatunbosun, O.; Whiting, S.J.; Beck, T.J.; Pahwa, P.; Biem, H.J. Effect of exercise training combined with isoflavone supplementation on bone and lipids in postmenopausal women: A randomized clinical trial. J. Bone Min. Res. 2013, 28, 780–793. [Google Scholar] [CrossRef]
- Kim, J.; Lee, H.; Lee, O.; Lee, K.H.; Lee, Y.B.; Young, K.D.; Jeong, Y.H.; Choue, R. Isoflavone supplementation influenced levels of triglyceride and luteunizing hormone in Korean postmenopausal women. Arch. Pharm. Res. 2013, 36, 306–313. [Google Scholar] [CrossRef]
- Liu, Z.M.; Ho, S.C.; Chen, Y.M.; Ho, Y.P. The effects of isoflavones combined with soy protein on lipid profiles, C-reactive protein and cardiovascular risk among postmenopausal Chinese women. Nutr. Metab. Cardiovasc. Dis. 2012, 22, 712–719. [Google Scholar] [CrossRef]
- Choquette, S.; Riesco, É.; Cormier, É.; Dion, T.; Aubertin-Leheudre, M.; Dionne, I.J. Effects of soya isoflavones and exercise on body composition and clinical risk factors of cardiovascular diseases in overweight postmenopausal women: A 6-month double-blind controlled trial. Br. J. Nutr. 2011, 105, 1199–1209. [Google Scholar] [CrossRef] [PubMed] [Green Version]
- Campbell, S.C.; Khalil, D.A.; Payton, M.E.; Arjmandi, B.H. One-year soy protein supplementation does not improve lipid profile in postmenopausal women. Menopause 2010, 17, 587–593. [Google Scholar] [CrossRef] [PubMed]
- Jassi, H.K.; Jain, A.; Arora, S.; Chitra, R. Effect of soy proteins vs soy isoflavones on lipid profile in postmenopausal women. Indian J. Clin. Biochem. 2010, 25, 201–207. [Google Scholar] [CrossRef] [Green Version]
- Turhan, N.Ö.; Duvan, C.; Bolkan, F.; Onaran, Y. Effect of isoflavone on plasma nitrite/nitrate, homocysteine, and lipid levels in Turkish women in the early postmenopausal period: A randomized controlled trial. Turk. J. Med. Sci. 2009, 39, 367–375. [Google Scholar] [CrossRef]
- Basaria, S.; Wisniewski, A.; Dupree, K.; Bruno, T.; Song, M.Y.; Yao, F.; Ojumu, A.; John, M.; Dobs, A.S. Effect of high-dose isoflavones on cognition, quality of life, androgens, and lipoprotein in post-menopausal women. J. Endocrinol. Invest 2009, 32, 150–155. [Google Scholar] [CrossRef]
- Rios, D.R.; Rodrigues, E.T.; Cardoso, A.P.; Montes, M.B.; Franceschini, S.A.; Toloi, M.R. Lack of effects of isoflavones on the lipid profile of Brazilian postmenopausal women. Nutrition 2008, 24, 1153–1158. [Google Scholar] [CrossRef]
- Aubertin-Leheudre, M.; Lord, C.; Khalil, A.; Dionne, I.J. Isoflavones and clinical cardiovascular risk factors in obese postmenopausal women: A randomized, double-blind study. J. Womens Heath 2008, 17, 1363–1369. [Google Scholar] [CrossRef] [PubMed]
- Ho, S.C.; Chen, Y.M.; Ho, S.S.; Woo, J.L. Soy isoflavone supplementation and fasting serum glucose and lipid profile among postmenopausal Chinese women: A double-blind, randomized, placebo-controlled trial. Menopause 2007, 14, 905–912. [Google Scholar] [CrossRef]
- Nahas, E.A.; Nahas-Neto, J.; Orsatti, F.L.; Carvalho, E.P.; Oliveira, M.L.; Dias, R. Efficacy and safety of a soy isoflavone extract in postmenopausal women: A randomized, double-blind, and placebo-controlled study. Maturitas 2007, 58, 249–258. [Google Scholar] [CrossRef]
- Allen, J.K.; Becker, D.M.; Kwiterovich, P.O.; Lindenstruth, K.A.; Curtis, C. Effect of soy protein-containing isoflavones on lipoproteins in postmenopausal women. Menopause 2007, 14, 106–114. [Google Scholar] [CrossRef]
- Wu, J.; Oka, J.; Tabata, I.; Higuchi, M.; Toda, T.; Fuku, N.; Ezaki, J.; Sugiyama, F.; Uchiyama, S.; Yamada, K. Effects of isoflavone and exercise on BMD and fat mass in postmenopausal Japanese women: A 1-year randomized placebo-controlled trial. J. Bone Min. Res. 2006, 21, 780–789. [Google Scholar] [CrossRef]
- Garrido, A.; De la Maza, M.P.; Hirsch, S.; Valladares, L. Soy isoflavones affect platelet thromboxane A2 receptor density but not plasma lipids in menopausal women. Maturitas 2006, 54, 270–276. [Google Scholar] [CrossRef] [PubMed]
- Colacurci, N.; Chintera, A.; Fornaro, F.; de Novellis, V.; Manzella, D.; Arciello, A.; Chintera, V.; Improta, L.; Paolisso, G. Effects of soy isoflavones on endothelial function in healthy postmenopausal women. Menopause 2005, 12, 299–307. [Google Scholar] [CrossRef] [PubMed]
- Teede, H.J.; Dalais, F.S.; Kotsopoulos, D.; McGrath, B.P.; Malan, E.; Gan, T.E.; Peverill, R.E. Dietary soy containing phytoestrogens does not activate the hemostatic system in postmenopausal women. J. Clin. Endocrinol. Metab. 2005, 90, 1936–1941. [Google Scholar] [CrossRef] [PubMed] [Green Version]
- Kreijkamp-Kaspers, S.; Kok, L.; Grobbee, D.E.; de Haan, E.H.; Aleman, A.; Lampe, J.W.; van der Schouw, Y.T. Effect of soy protein containing isoflavones on cognitive function, bone mineral density, and plasma lipids in postmenopausal women: A randomized controlled trial. JAMA 2004, 292, 65–74. [Google Scholar] [CrossRef] [Green Version]
- Gallagher, J.C.; Satpathy, R.; Rafferty, K.; Haynatzka, V. The effect of soy protein isolate on bone metabolism. Menopause 2004, 11, 290–298. [Google Scholar] [CrossRef]
- Dalais, F.S.; Ebeling, P.R.; Kotsopoulos, D.; McGrath, B.P.; Teede, H.J. The effects of soy protein containing isoflavones on lipids and indices of bone resorption in postmenopausal women. Clin. Endocrinol. 2003, 58, 704–709. [Google Scholar] [CrossRef]
- Han, K.K.; Soares, J.M., Jr.; Haidar, M.A.; de Lima, G.R.; Baracat, E.C. Benefits of soy isoflavone therapeutic regimen on menopausal symptoms. Obs. Gynecol. 2002, 99, 389–394. [Google Scholar]
- Dewell, A.; Hollenbeck, C.B.; Bruce, B. The effects of soy-derived phytoestrogens on serum lipids and lipoproteins in moderately hypercholesterolemic postmenopausal women. J. Clin. Endocrinol. Metab. 2002, 87, 118–121. [Google Scholar] [CrossRef]
- Gardner, C.D.; Newell, K.A.; Cherin, R.; Haskell, W.L. The effect of soy protein with or without isoflavones relative to milk protein on plasma lipids in hypercholesterolemic postmenopausal women. Am. J. Clin. Nutr. 2001, 73, 728–735. [Google Scholar] [CrossRef] [Green Version]
- Vigna, G.B.; Pansini, F.; Bonaccorsi, G.; Albertazzi, P.; Doneg, P.; Zanotti, L.; De Aloysio, D.; Mollica, G.; Fellin, R. Plasma lipoproteins in soy-treated postmenopausal women: A double-blind, placebo-controlled trial. Nutr. Metab. Cardiovasc Dis. 2000, 10, 315–322. [Google Scholar] [PubMed]
- Mackey, R.; Ekangaki, A.; Eden, J.A. The effects of soy protein in women and men with elevated plasma lipids. Biofactors 2000, 12, 251–257. [Google Scholar] [CrossRef] [PubMed]
- Baum, J.A.; Teng, H.; Erdman, J.W., Jr.; Weigel, R.M.; Klein, B.P.; Persky, V.W.; Freels, S.; Surya, P.; Bakhit, R.M.; Ramos, E.; et al. Long-term intake of soy protein improves blood lipid profiles and increases mononuclear cell low-density-lipoprotein receptor messenger RNA in hypercholesterolemic, postmenopausal women. Am. J. Clin. Nutr. 1998, 68, 545–551. [Google Scholar] [CrossRef] [PubMed]
- Zhan, S.; Ho, S.C. Meta-analysis of the effects of soy protein containing isoflavones on the lipid profile. Am. J. Clin. Nutr. 2005, 81, 397–408. [Google Scholar] [CrossRef] [Green Version]
- Prediger, C.C.; Olinto, M.T.A.; Nacul, L.C.; Ziegler, D.R.; Pattussi, M.P. Effects of soy protein containing isoflavones on women’s lipid profile: A meta-analysis. Rev. Nutr. Camp. 2011, 24, 161–172. [Google Scholar] [CrossRef]
- Yeung, J.; Yu, T.F. Effects of isoflavones (soy phyto-estrogens) on serum lipids: A meta-analysis of randomized controlled trials. Nutr. J. 2003, 2. [Google Scholar] [CrossRef] [Green Version]
- Weggemans, R.M.; Trautwein, E.A. Relation between soy-associated isoflavones and LDL and HDL cholesterol concentrations in humans: A meta-analysis. Eur. J. Clin. Nutr. 2003, 57, 940–946. [Google Scholar] [CrossRef] [PubMed]
- Taku, K.; Umegaki, K.; Sato, Y.; Taki, Y.; Endoh, K.; Watanabe, S. Soy isoflavones lower serum total and LDL cholesterol in humans: A meta-analysis of 11 randomized controlled trials. Am. J. Clin. Nutr. 2007, 85, 1148–1156. [Google Scholar] [CrossRef]
- Tokede, O.A.; Onabanjo, T.A.; Yansane, A.; Gaziano, J.M.; Djoussé, L. Soya products and serum lipids: A meta-analysis of randomised controlled trials. Br. J. Nutr. 2015, 114, 831–843. [Google Scholar] [CrossRef] [PubMed]
- Reynolds, K.; Chin, A.; Lees, K.A.; Nguyen, A.; Bujnowski, D.; He, J. A meta-analysis of the effect of soy protein supplementation on serum lipids. Am. J. Cardiol 2006, 98, 633–640. [Google Scholar] [CrossRef] [PubMed]
- Simental-Mendía, L.E.; Gotto, A.M., Jr.; Atkin, S.L.; Banach, M.; Pirro, M.; Sahebkar, A. Effect of soy isoflavone supplementation on plasma lipoprotein(a) concentrations: A meta-analysis. J. Clin. Lipidol. 2018, 12, 16–24. [Google Scholar] [CrossRef] [PubMed]
- Izumi, T.; Piskula, M.K.; Osawa, S.; Obata, A.; Tobe, K.; Saito, M.; Kataoka, S.; Kubota, Y.; Kikuchi, M. Soy isoflavone aglycones are absorbed faster and in higher amounts than their glucosides in humans. J. Nutr. 2000, 130, 1695–1699. [Google Scholar] [CrossRef] [PubMed] [Green Version]
- Nielsen, I.L.; Williamson, G. Review of the factors affecting bioavailability of soy isoflavones in humans. Nutr. Cancer 2007, 57, 1–10. [Google Scholar] [CrossRef] [PubMed]
- Oakenfull, D. Soy protein, saponins and plasma cholesterol. J. Nutr. 2001, 131, 2971–2972. [Google Scholar] [CrossRef] [PubMed] [Green Version]
- Erdman, J.W., Jr.; Badger, T.M.; Lampe, J.W.; Setchell, K.D.; Messina, M. Not all soy products are created equal: Caution needed in interpretation of research results. J. Nutr. 2004, 134, 1229–1233. [Google Scholar] [CrossRef] [Green Version]


| Subgroup Outcome | TC (mmol/L) | LDL-C (mmol/L) | HDL-C (mmol/L) | TAG (mmol/L) | ||||||||||||||||
|---|---|---|---|---|---|---|---|---|---|---|---|---|---|---|---|---|---|---|---|---|
| n | N | WMD (95% CI) | p | I2 (%) | n | N | WMD (95% CI) | p | I2 (%) | n | N | WMD (95% CI) | p | I2 (%) | n | N | WMD (95% CI) | p | I2 (%) | |
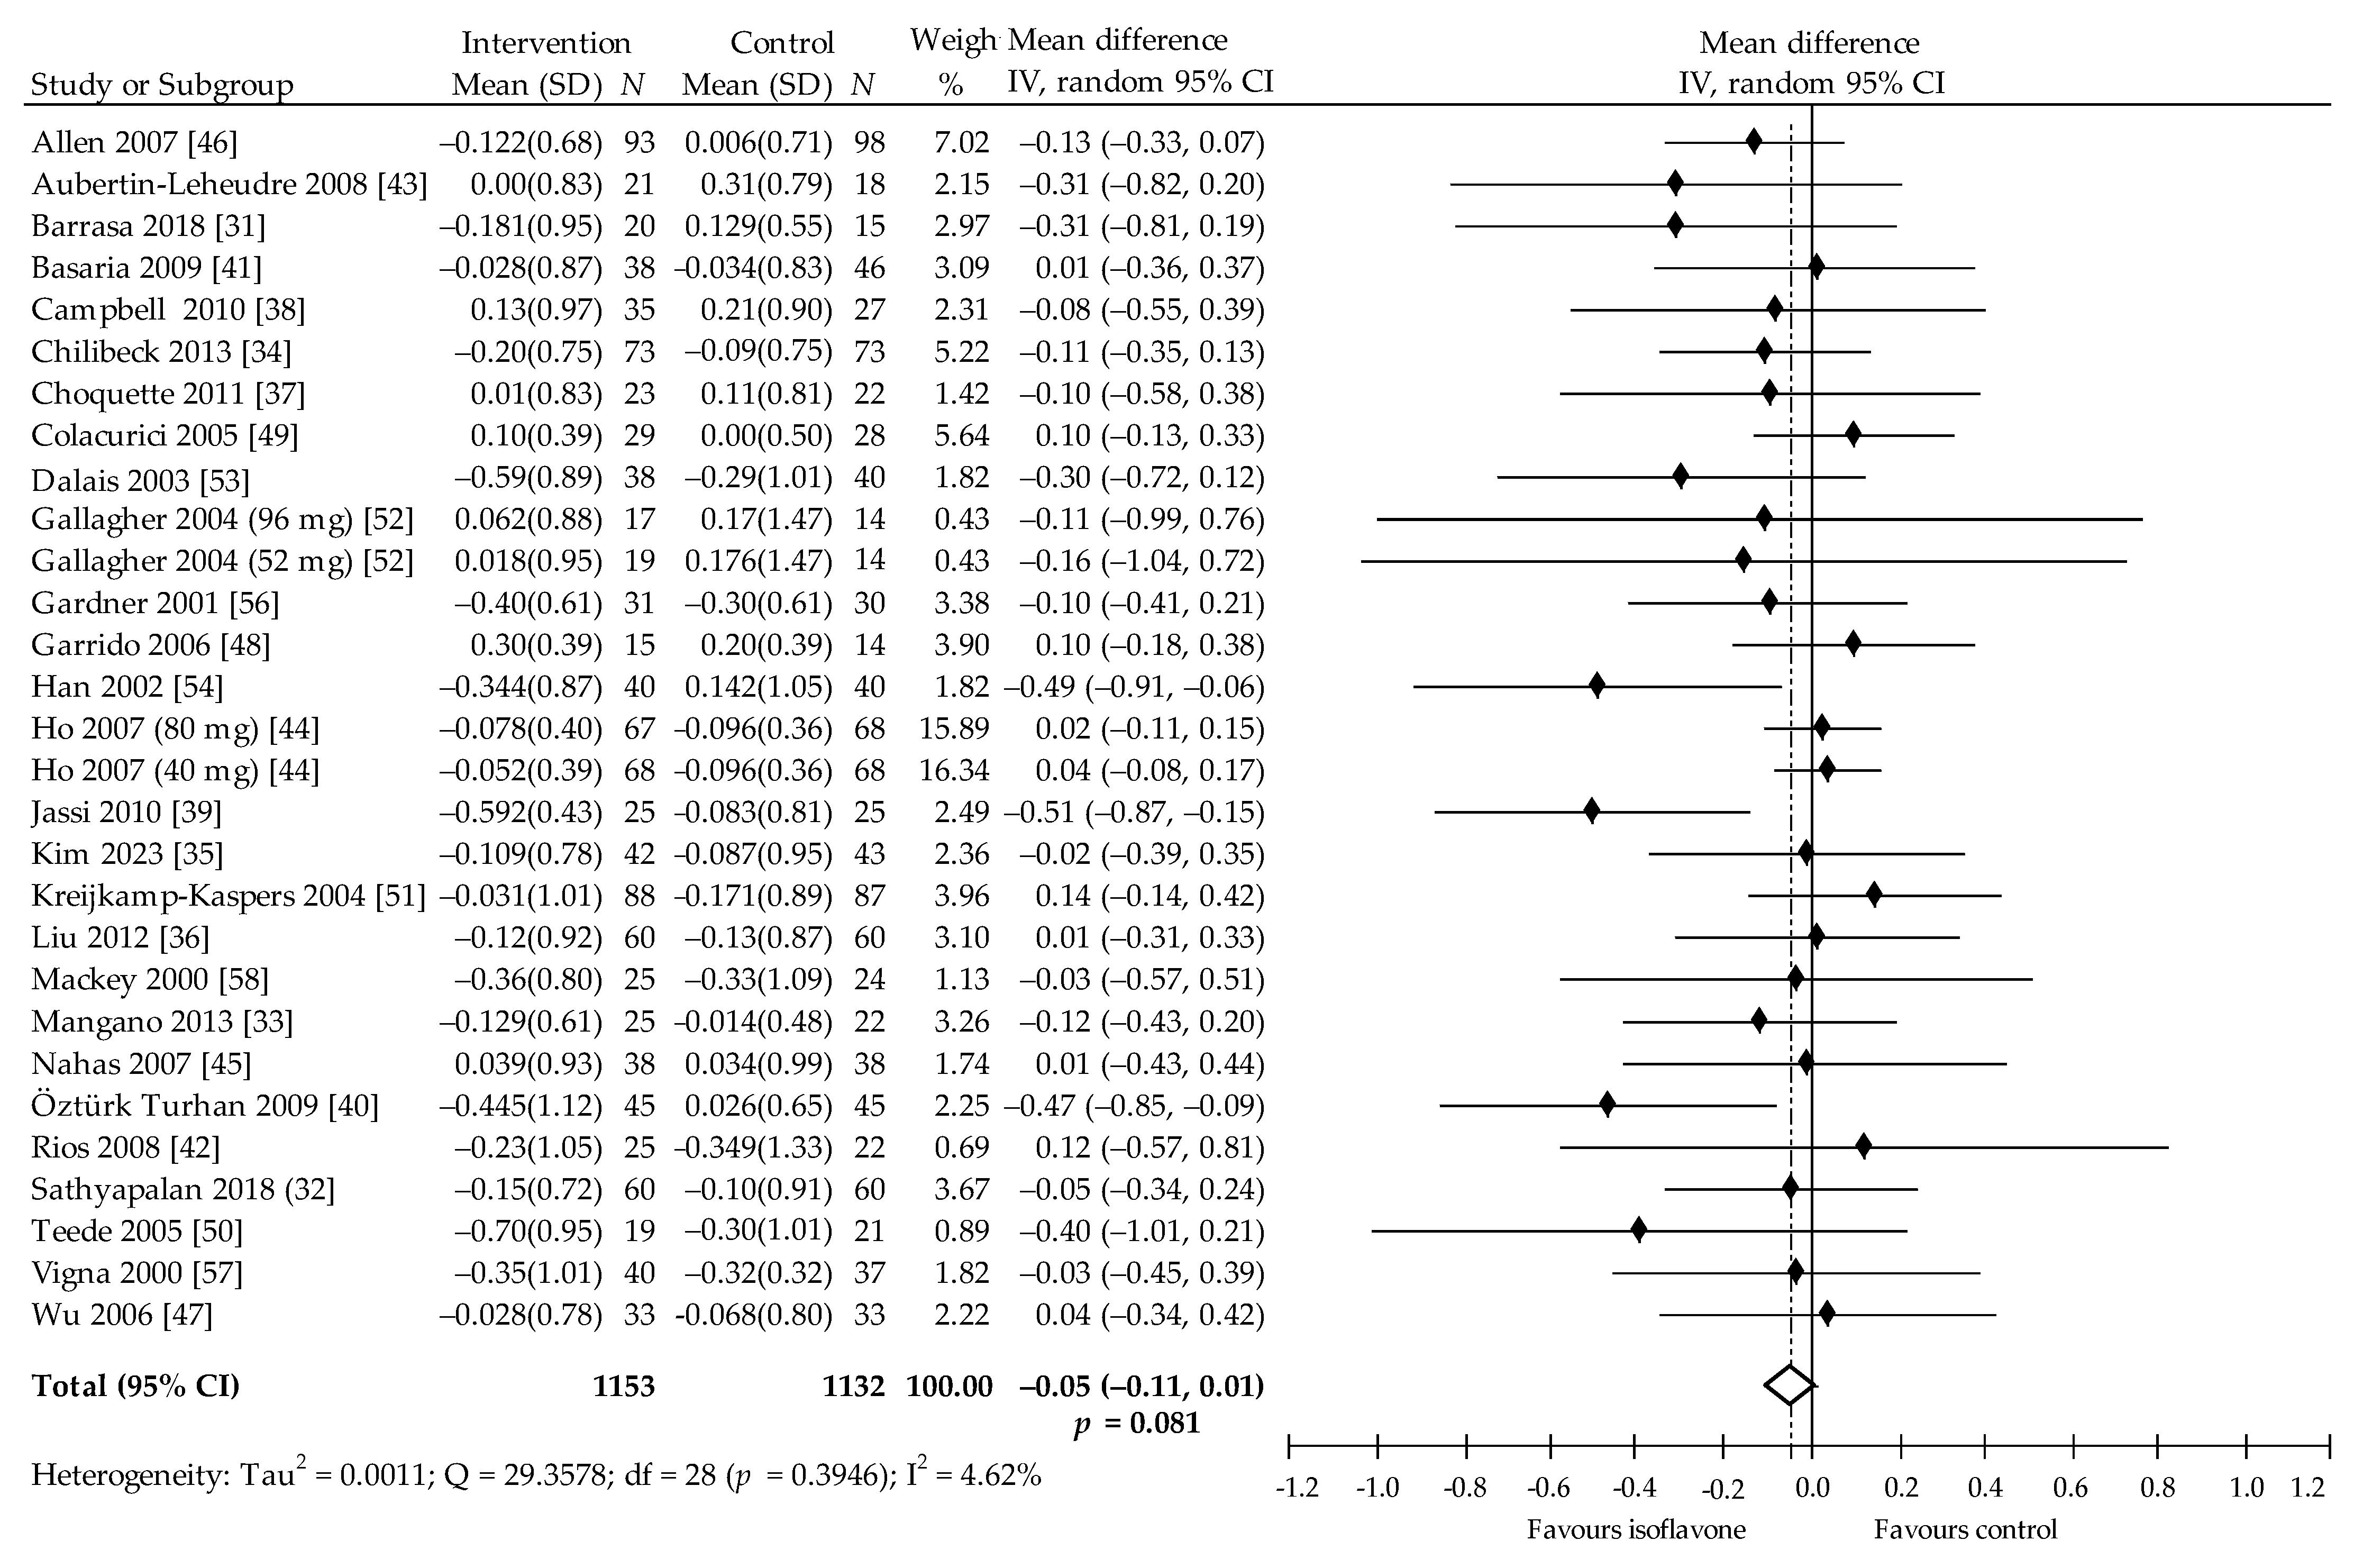
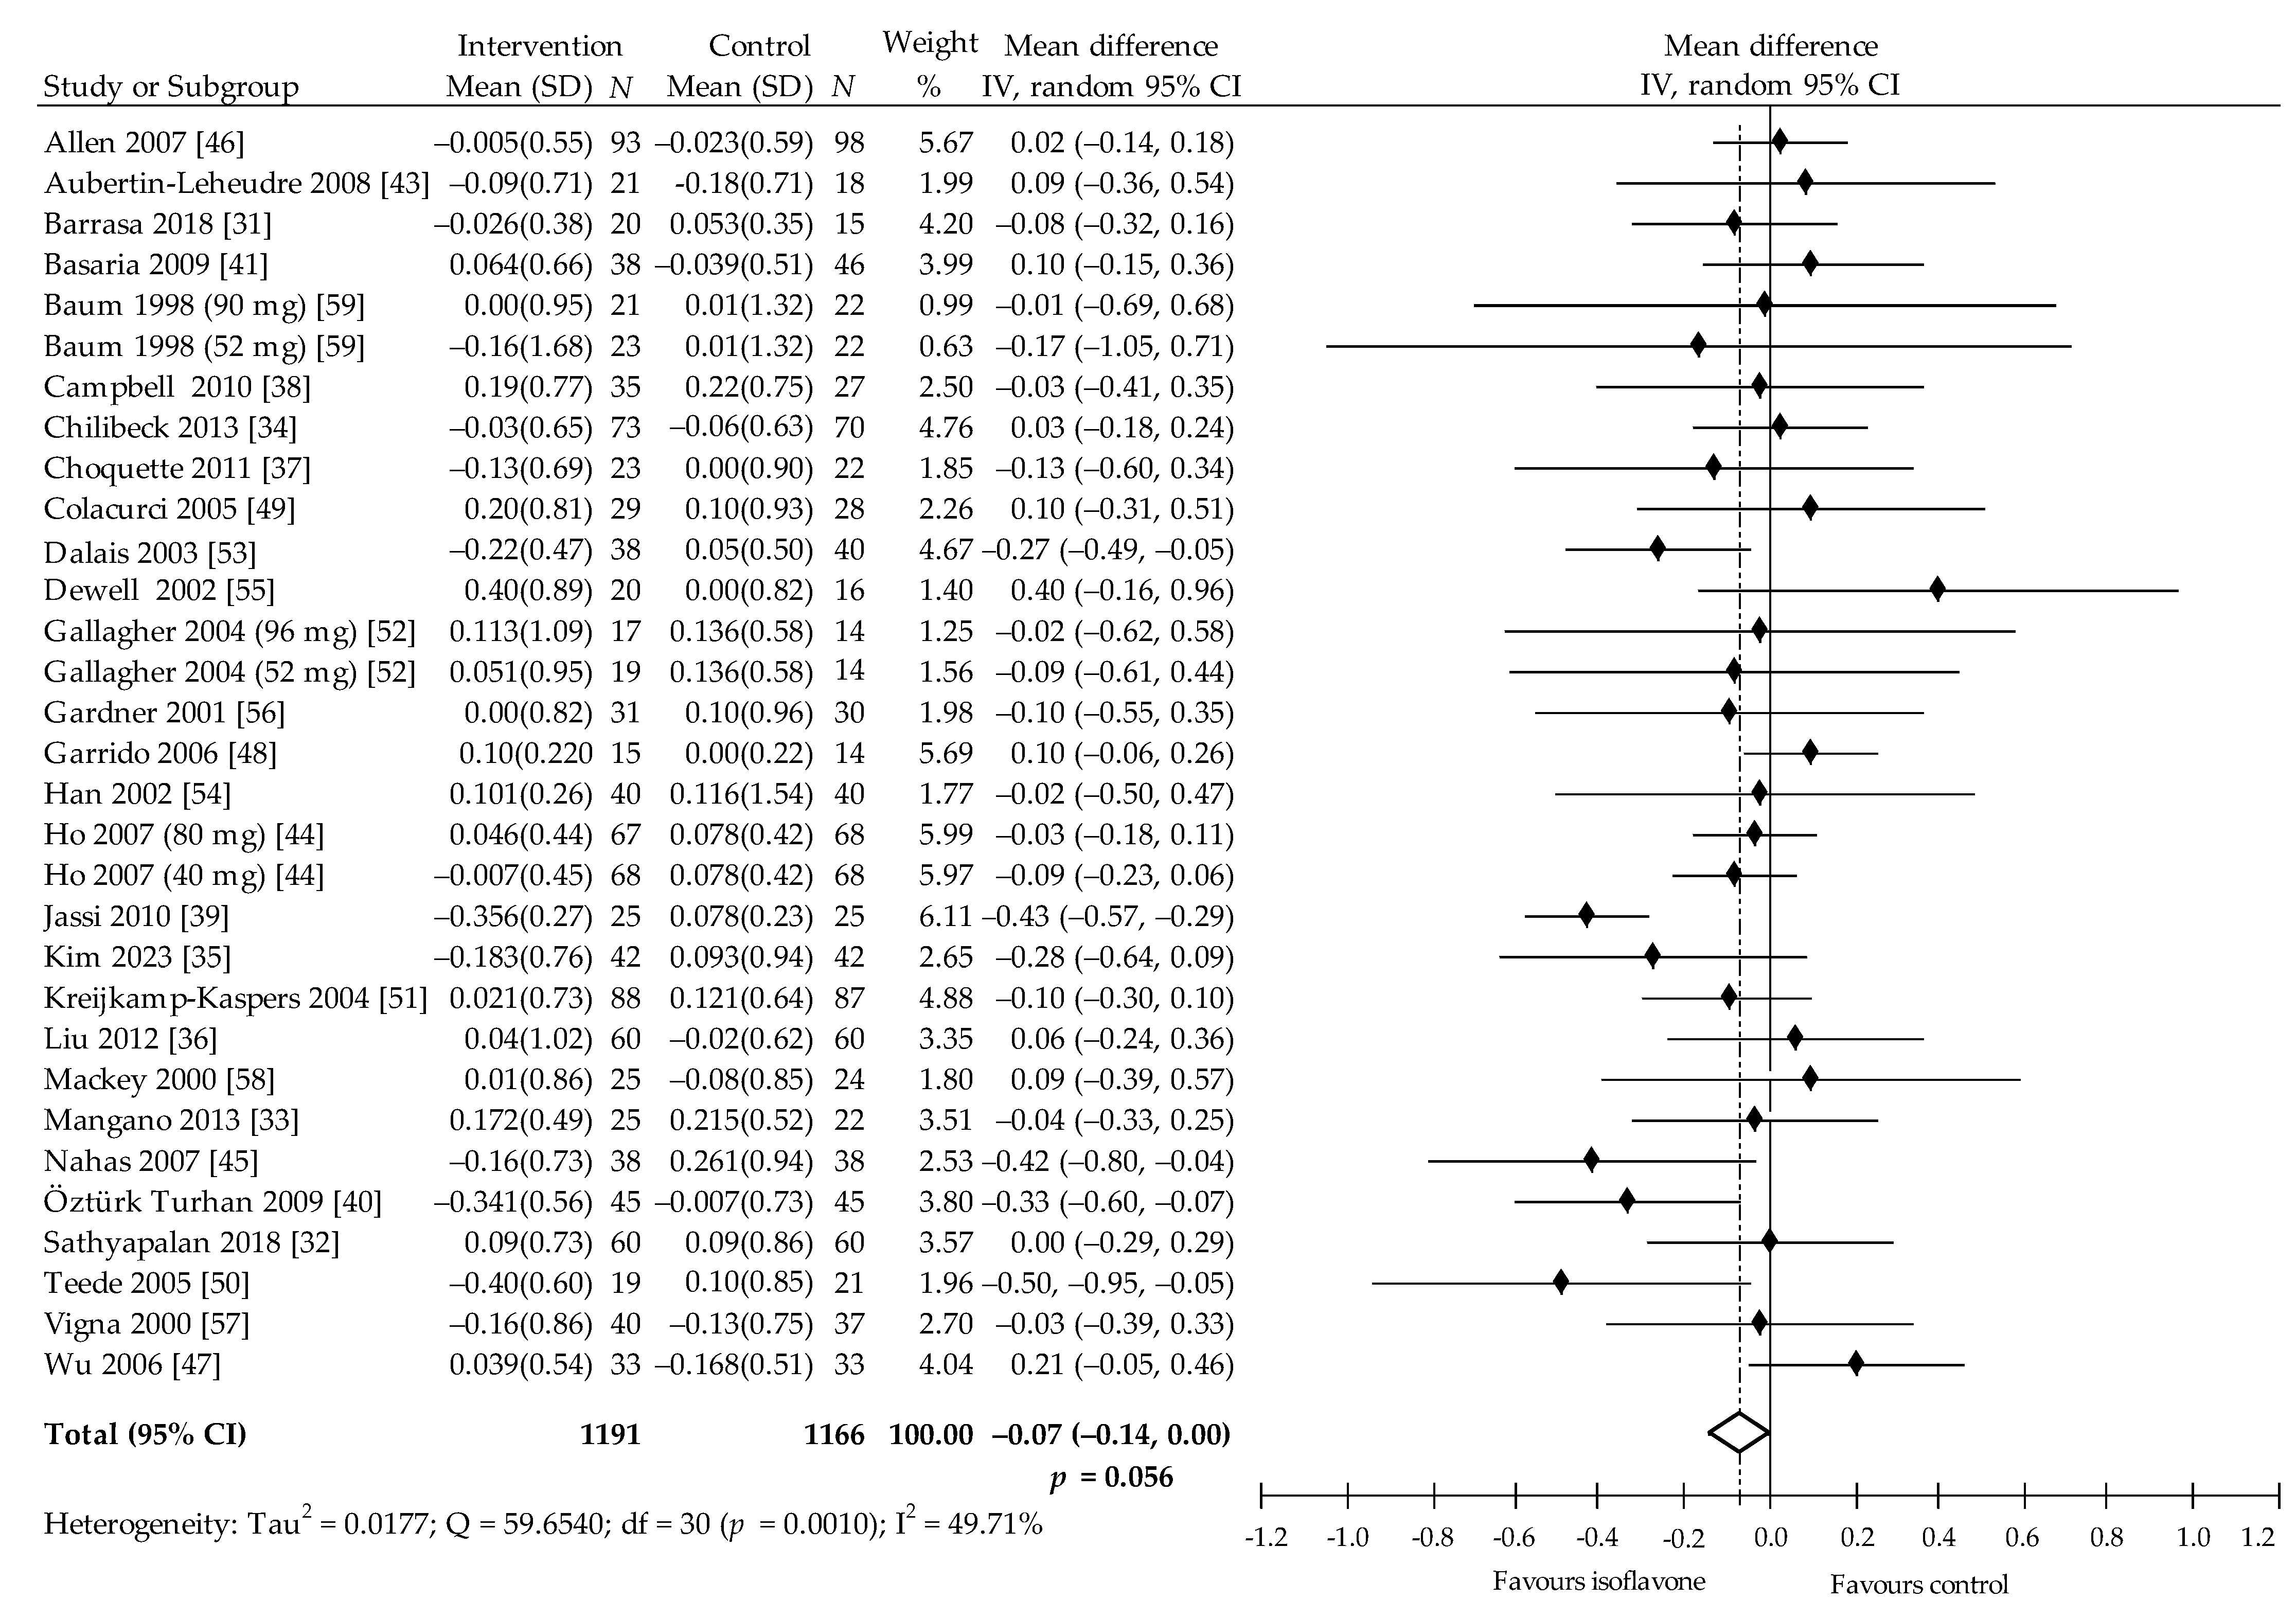
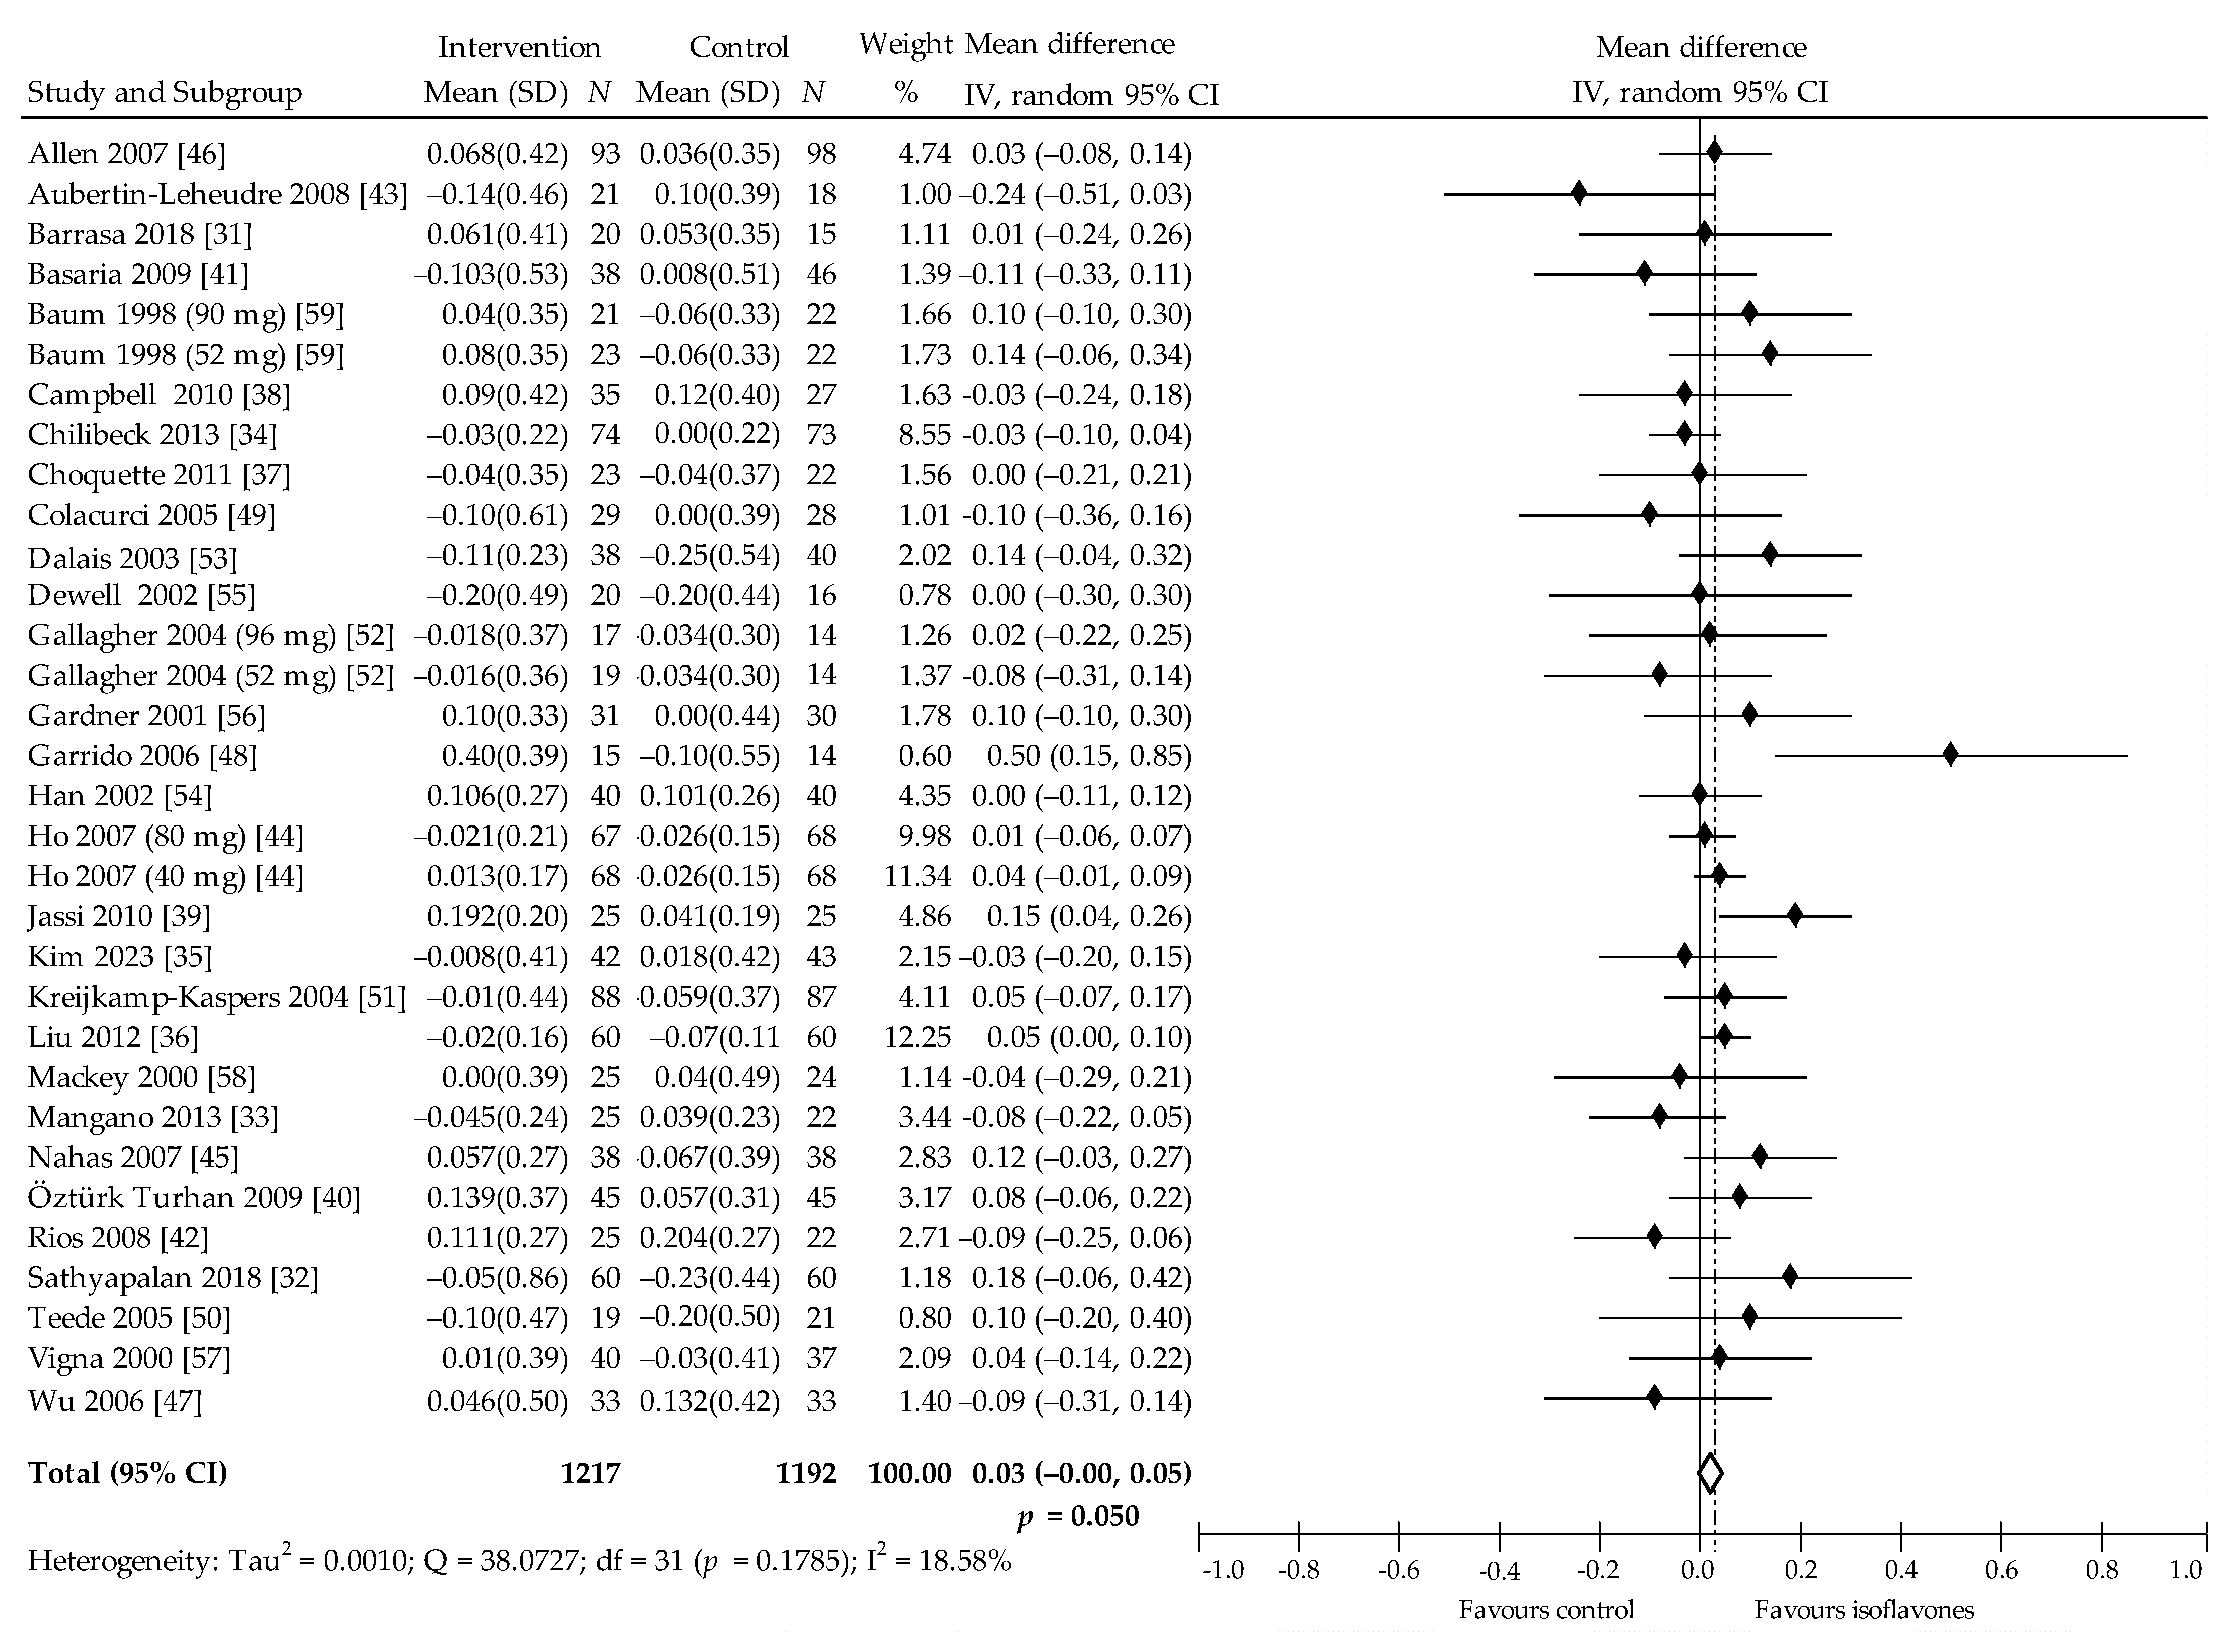
| Overall effects | 31 | 2351 | −0.12 (−0.21, −0.03) | 0.007 | 32.98 | 29 | 2284 | −0.05 (−0.01, 0.01) | 0.081 | 4.62 | 32 | 2409 | 0.03 (−0.00, 0.05) | 0.050 | 18.58 | 31 | 2397 | −0.07 (−0.14, 0.00) | 0.056 | 49.71 |
| Follow-Up Period | ||||||||||||||||||||
| <6 months | 16 | 1143 | −0.15 (−0.25, −0.04) | 0.006 | 3.42 | 14 | 1055 | −0.13 (−0.22, −0.03) | 0.012 | 5.32 | 16 | 1143 | 0.06 (0.03, 0.10) | 0.001 | 9.06 | 16 | 1142 | −0.12 (−0.24, 0.01) | 0.062 | 65.03 |
| ≥6 months | 15 | 1208 | −0.11 (−0.25, 0.03) | 0.125 | 48.54 | 15 | 1229 | −0.01 (−0.07, 0.06) | 0.867 | 0.00 | 16 | 1265 | 0.00 (−0.03, 0.03) | 0.899 | 0.00 | 15 | 1215 | −0.04 (−0.10, 0.03) | 0.299 | 0.00 |
| Coefficients β (SE), p b | <6 mths: −0.097 (0.13), 0.469 | ≥6 mths: 0.131 (0.09), 0.141 | <6 mths: 0.037(0.03), 0.213 | <6 mths: −0.129 (0.08), 0.091 | ||||||||||||||||
| Postmenopausal Status | ||||||||||||||||||||
| <5 years | 12 | 952 | −0.13 (−0.30, 0.03) | 0.115 | 59.62 | 7 | 672 | −0.07 (−0.18, 0.04) | 0.192 | 44.65 | 13 | 1009 | 0.04 (−0.00, 0.09) | 0.077 | 30.11 | 13 | 1008 | −0.07 (−0.20, 0.05) | 0.235 | 70.35 |
| ≥5 years | 19 | 1399 | −0.11 (−0.20, −0.11) | 0.026 | 0.00 | 21 | 1563 | −0.08 (−0.17, 0.01) | 0.069 | 0.00 | 19 | 1400 | 0.02 (−0.02, 0.05) | 0.328 | 11.65 | 18 | 1349 | −0.06 (−0.13, 0.02) | 0.138 | 5.35 |
| Coefficients β (SE), p b | ≥5 yrs.: −0.089 (0.15), 0.560 | ≥5 yrs.: 0.124 (0.11), 0.254 | ≥5 yrs.: −0.031 (0.04), 0.419 | ≥5 yrs.: −0.039 (0.10), 0.690 | ||||||||||||||||
| Age of Participants | ||||||||||||||||||||
| <55 years | 16 | 1201 | −0.14 (−0.30, 0.02) | 0.079 | 58.47 | 17 | 1258 | −0.04 (−0.13, 0.04) | 0.338 | 23.02 | 17 | 1258 | 0.03 (−0.01, 0.07) | 0.175 | 32.64 | 16 | 1210 | −0.08 (−0.20, 0.03) | 0.163 | 67.02 |
| ≥55 years | 15 | 1150 | −0.11 (−0.21, −0.01) | 0.037 | 0.00 | 12 | 1026 | −0.10 (−0.20, −0.01) | 0.035 | 0.00 | 15 | 1151 | 0.03 (−0.01, 0.06) | 0.130 | 1.91 | 15 | 1147 | −0.05 (−0.13, 0.02) | 0.152 | 0.00 |
| Coefficients β (SE), p b | ≥55 yrs.: −0.061 (0.13), 0.637 | ≥55 yrs.: 0.183 (0.91), 0.045 | ≥55 yrs.: −0.050 (0.03), 0.127 | ≥55 yrs.: −0.037 (0.08), 0.641 | ||||||||||||||||
| Body Mass Index | ||||||||||||||||||||
| ≤24.9 kg/m2 | 8 | 708 | −0.11 (−0.30, 0.07) | 0.226 | 58.87 | 7 | 672 | −0.07 (−0.22, 0.07) | 0.302 | 54.63 | 8 | 708 | 0.04 (0.01, 0.07) | 0.019 | 7.75 | 8 | 707 | −0.06 (−0.24, 0.12) | 0.518 | 78.82 |
| ≥25.0 kg/m2 | 22 | 1594 | −0.13 (−0.24, −0.03) | 0.012 | 20.31 | 21 | 1563 | −0.07 (−0.15, 0.00) | 0.060 | 0.00 | 23 | 1652 | 0.02 (−0.02, 0.07) | 0.274 | 25.13 | 22 | 1601 | −0.06 (−0.12, 0.01) | 0.083 | 10.02 |
| Coefficients β (SE), p b | ≤24.9 kg/m2: −0.038 (0.13), 0.770 | ≤24.9 kg/m2: −0.051 (0.09), 0.573 | ≤24.9 kg/m2: −0.056 (0.03), 0.055 | ≤24.9 kg/m2: 0.048 (0.07), 0.511 | ||||||||||||||||
| Cholesterol | ||||||||||||||||||||
| Normal | 4 | 199 | −0.23 (−0.56, 0.10) | 0.174 | 46.05 | 4 | 199 | −0.17 9–0.46, 0.13) | 0.270 | 60.60 | 4 | 199 | 0.12 (−0.04, 0.29) | 0.151 | 63.59 | 4 | 198 | −0.17 (−0.46, 0.13) | 0.263 | 88.20 |
| Bordeline | 18 | 1564 | −0.04 (−0.12, 0.04) | 0.304 | 0.00 | 18 | 18 | −0.04 (−0.10, 0.02) | 0.221 | 0.00 | 18 | 1565 | 0.01 (−0.02,0.04) | 0.339 | 16.48 | 17 | 1514 | −0.03 (−0.09, 0.03) | 0.294 | 0.00 |
| High | 9 | 588 | −0.27 (−0.53, 0.00) | 0.052 | 56.06 | 6 | 464 | −0.12 (−0.36, 0.11) | 0.289 | 34.19 | 9 | 588 | 0.05 (−0.01, 0.11) | 0.098 | 0.00 | 9 | 588 | −0.13 (−0.27, 0.02) | 0.090 | 16.34 |
| Coefficients β (SE), p b | Normal: −0.130 (0.19), 0.505 | Borderline: −0.095 (0.12), 0.447 | Normal: 0.084 (0.05), 0.061 | Normal: −0.042 (0.10), 0.685 | ||||||||||||||||
| High: −0.219 (0.13), 0.085 | High: −0.057 (0.15), 0.700 | High: −0.063 (0.034), 0.065 | High: −0.001 (0.08), 0.985 | |||||||||||||||||
| Types of Intervention | ||||||||||||||||||||
| Soy protein c | 18 | 1386 | −0.15 (−0.28, −0.02) | 0.024 | 39.41 | 16 | 1298 | −0.12 (−0.21, −0.03) | 0.011 | 0.00 | 18 | 1386 | 0.05 (0.02, 0.08) | 0.003 | 0.00 | 18 | 1386 | −0.10 (−0.20, 0.01) | 0.066 | 49.25 |
| Isoflavone extract | 13 | 965 | −0.08 (−0.20, 0.03) | 0.163 | 22.82 | 13 | 986 | −0.00 (−0.07, 0.07) | 0.925 | 0.00 | 14 | 1023 | 0.01 (−0.04, 0.05) | 0.768 | 34.15 | 32 | 971 | −0.04 (−0.13, 0.06) | 0.445 | 42.18 |
| Coefficients β (SE), p b | Isoflavones alone: 0.130 (0.13), 0.301 | Dietary isoflavones: −0.139 (0.09), 0.104 | Isoflavone alone: −0.019 (0.03), 0.540 | Isoflavone alone: −0.069 (0.07), 0.353 | ||||||||||||||||
| Isoflavone Dose | ||||||||||||||||||||
| <80 mg/day | 15 | 1024 | −0.21 (−0.39, −0.03) | 0.021 | 61.91 | 15 | 1036 | −0.10 (−0.22, 0.01) | 0.080 | 52.44 | 16 | 1081 | 0.02 (−0.02, 0.07) | 0.327 | 1947 | 15 | 1033 | −0.09 (−0.22, 0.03) | 0.149 | 56.75 |
| ≥80 mg/day | 16 | 1327 | −0.06 (−0.15, 0.03) | 0.185 | 0.00 | 14 | 1248 | −0.04 (−0.11, 0.03) | 0.294 | 0.00 | 16 | 1328 | 0.03 (−0.01, 0.07) | 0.111 | 22.84 | 16 | 1324 | −0.04 (−0.12, 0.04) | 0.292 | 26.99 |
| Coefficients β (SE), p b | ≥80 mg/d: 0.194 (0.12), 0.115 | <88 mg/d: −0.117 (0.08), 0.164 | ≥80 mg/d: −0.025 (0.03), 0.383 | ≥80 mg/d: −0.147 (0.08), 0.052 | ||||||||||||||||
Publisher’s Note: MDPI stays neutral with regard to jurisdictional claims in published maps and institutional affiliations. |
© 2021 by the authors. Licensee MDPI, Basel, Switzerland. This article is an open access article distributed under the terms and conditions of the Creative Commons Attribution (CC BY) license (https://creativecommons.org/licenses/by/4.0/).
Share and Cite
Barańska, A.; Błaszczuk, A.; Kanadys, W.; Baczewska, B.; Jędrych, M.; Wawryk-Gawda, E.; Polz-Dacewicz, M. Effects of Soy Protein Containing of Isoflavones and Isoflavones Extract on Plasma Lipid Profile in Postmenopausal Women as a Potential Prevention Factor in Cardiovascular Diseases: Systematic Review and Meta-Analysis of Randomized Controlled Trials. Nutrients 2021, 13, 2531. https://doi.org/10.3390/nu13082531
Barańska A, Błaszczuk A, Kanadys W, Baczewska B, Jędrych M, Wawryk-Gawda E, Polz-Dacewicz M. Effects of Soy Protein Containing of Isoflavones and Isoflavones Extract on Plasma Lipid Profile in Postmenopausal Women as a Potential Prevention Factor in Cardiovascular Diseases: Systematic Review and Meta-Analysis of Randomized Controlled Trials. Nutrients. 2021; 13(8):2531. https://doi.org/10.3390/nu13082531
Chicago/Turabian StyleBarańska, Agnieszka, Agata Błaszczuk, Wiesław Kanadys, Bożena Baczewska, Marian Jędrych, Ewelina Wawryk-Gawda, and Małgorzata Polz-Dacewicz. 2021. "Effects of Soy Protein Containing of Isoflavones and Isoflavones Extract on Plasma Lipid Profile in Postmenopausal Women as a Potential Prevention Factor in Cardiovascular Diseases: Systematic Review and Meta-Analysis of Randomized Controlled Trials" Nutrients 13, no. 8: 2531. https://doi.org/10.3390/nu13082531