
Beyond Lockdown: The Potential Side Effects of the SARS-CoV-2 Pandemic on Public Health

 , ,
, ,  , , ,
, , ,
Abstract
: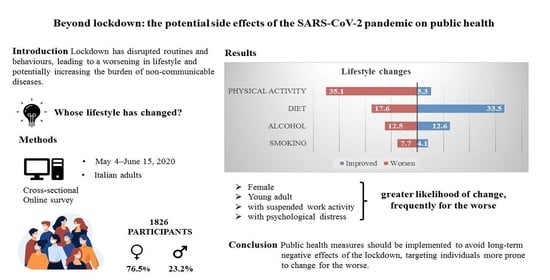
1. Introduction
2. Materials and Methods
2.1. Study Design, Participants, and Setting
2.2. Ethics
2.3. Procedures
2.4. Outcomes
2.5. Potential Determinants and Covariates
2.6. Analyses
3. Results
3.1. Participants’ Characteristics
3.2. Lifestyle Changes during Lockdown
3.3. Influence of Potential Determinants on Lifestyle Changes
4. Discussion
Limitations
5. Conclusions
Supplementary Materials
Author Contributions
Funding
Institutional Review Board Statement
Informed Consent Statement
Data Availability Statement
Acknowledgments
Conflicts of Interest
References
- World Health Organization. Coronavirus Disease (COVID-2019) Situation Reports. Available online: https://www.who.int/emergencies/diseases/novel-coronavirus-2019/situation-reports (accessed on 16 March 2021).
- The Lancet. COVID-19: A new lens for non-communicable diseases. Lancet 2020, 396, 649. [Google Scholar] [CrossRef]
- Palmer, K.; Monaco, A.; Kivipelto, M.; Onder, G.; Maggi, S.; Michel, J.P.; Prieto, R.; Sykara, G.; Donde, S. The potential long-term impact of the COVID-19 outbreak on patients with non-communicable diseases in Europe: Consequences for healthy ageing. Aging Clin. Exp. Res. 2020, 32, 1189–1194. [Google Scholar] [CrossRef]
- Williams, R.; Jenkins, D.A.; Ashcroft, D.M.; Brown, B.; Campbell, S.; Carr, M.J.; Cheraghi-Sohi, S.; Kapur, N.; Thomas, O.; Webb, R.T.; et al. Diagnosis of physical and mental health conditions in primary care during the COVID-19 pandemic: A retrospective cohort study. Lancet Public Health 2020, 5, e543–e550. [Google Scholar] [CrossRef]
- Matias, T.; Dominski, F.H.; Marks, D.F. Human needs in COVID-19 isolation. J. Health Psychol. 2020, 25, 871–882. [Google Scholar] [CrossRef] [PubMed]
- Ammar, A.; Brach, M.; Trabelsi, K.; Chtourou, H.; Boukhris, O.; Masmoudi, L.; Bouaziz, B.; Bentlage, E.; How, D.; Ahmed, M.; et al. Effects of COVID-19 Home Confinement on Eating Behaviour and Physical Activity: Results of the ECLB-COVID19 International Online Survey. Nutrients 2020, 12, 1583. [Google Scholar] [CrossRef] [PubMed]
- Finlay, I.; Gilmore, I. Covid-19 and alcohol-a dangerous cocktail. BMJ 2020, 369, m1987. [Google Scholar] [CrossRef] [PubMed]
- Vanderbruggen, N.; Matthys, F.; Van Laere, S.; Zeeuws, D.; Santermans, L.; Van den Ameele, S.; Crunelle, C.L. Self-Reported Alcohol, Tobacco, and Cannabis Use during COVID-19 Lockdown Measures: Results from a Web-Based Survey. Eur. Addict. Res. 2020, 26, 309–315. [Google Scholar] [CrossRef] [PubMed]
- European Commission. EU Burden from Non-Communicable Diseases and Key Risk Factors. EC. Available online: https://ec.europa.eu/jrc/en/health-knowledge-gateway/societal-impacts/burden (accessed on 16 March 2021).
- Lippi, G.; Sanchis-Gomar, F. An Estimation of the Worldwide Epidemiologic Burden of Physical Inactivity-Related Ischemic Heart Disease. Cardiovasc. Drugs Ther. 2020, 34, 133–137. [Google Scholar] [CrossRef] [PubMed]
- Brooks, S.K.; Webster, R.K.; Smith, L.E.; Woodland, L.; Wessely, S.; Greenberg, N.; Rubin, G.J. The psychological impact of quarantine and how to reduce it: Rapid review of the evidence. Lancet 2020, 395, 912–920. [Google Scholar] [CrossRef] [Green Version]
- European Commission. State of Health in the EU, Italy Country Health Profile. EC. Available online: https://www.euro.who.int/__data/assets/pdf_file/0008/355985/Health-Profile-Italy-Eng.pdf (accessed on 16 March 2021).
- Gazzetta ufficiale della Repubblica Italiana. Decreto del Presidente del Consiglio dei Ministri. Ulteriori disposizioni attuative del decreto-legge 23 febbraio 2020, n. 6, recante misure urgenti in materia di contenimento e gestione dell’emergenza epidemiologica da COVID-19. (20°01522) (GU Serie Generale n. 59 del 08–03–2020). Available online: https://www.gazzettaufficiale.it/eli/id/2020/04/27/20A02352/sg (accessed on 16 March 2021).
- Dipartimento della Protezione Civile. Covid-19 Situazione in Italia. Available online: http://opendatadpc.maps.arcgis.com/apps/opsdashboard/index.html#/b0c68bce2cce478eaac82fe38d4138b1 (accessed on 16 March 2021).
- Baldissera, S.; Campostrini, S.; Binkin, N.; Minardi, V.; Minelli, G.; Ferrante, G.; Salmaso, S.; PASSI Coordinating Group. Features and initial assessment of the Italian Behavioral Risk Factor Surveillance System (PASSI) 2007–2008. Prev. Chronic Dis. 2011, 8, A24. [Google Scholar]
- Behavioral Risk Factor Surveillance System: Questionnaires. Atlanta (GA): Centers for Disease Control and Prevention. Available online: https://www.cdc.gov/brfss/questionnaires/index.htm (accessed on 16 March 2021).
- Ferrante, G.; Camussi, E.; Piccinelli, C.; Senore, C.; Armaroli, P.; Ortale, A.; Garena, F.; Giordano, L. Did social isolation during the SARS-CoV-2 epidemic have an impact on the lifestyles of citizens? Epidemiol. Prev. 2020, 44, 353–362. [Google Scholar] [PubMed]
- Cheikh Ismail, L.; Osaili, T.M.; Mohamad, M.N.; Al Marzouqi, A.; Jarrar, A.H.; Abu Jamous, D.O.; Magriplis, E.; Ali, H.I.; Al Sabbah, H.; Hasan, H.; et al. Eating Habits and Lifestyle during COVID-19 Lockdown in the United Arab Emirates: A Cross-Sectional Study. Nutrients 2020, 12, 3314. [Google Scholar] [CrossRef]
- Chopra, S.; Ranjan, P.; Singh, V.; Kumar, S.; Arora, M.; Hasan, M.S.; Kasiraj, R.; Suryansh Kaur, D.; Vikram, N.K.; Malhotra, A.; et al. Impact of COVID-19 on lifestyle—Related behaviours—A cross-Sectional audit of responses from nine hundred and ninety-five participants from India. Diabetes Metab. Syndr. 2020, 14, 2021–2030. [Google Scholar] [CrossRef] [PubMed]
- Flanagan, E.W.; Beyl, R.A.; Fearnbach, S.N.; Altazan, A.D.; Martin, C.K.; Redman, L.M. The Impact of COVID-19 Stay-At-Home Orders on Health Behaviors in Adults. Obes. Silver Spring 2021, 29, 438–445. [Google Scholar] [CrossRef]
- Di Renzo, L.; Gualtieri, P.; Pivari, F.; Soldati, L.; Attinà, A.; Cinelli, G.; Leggeri, C.; Caparello, G.; Barrea, L.; Scerbo, F.; et al. Eating habits and lifestyle changes during COVID-19 lockdown: An Italian survey. J. Transl. Med. 2020, 18, 229. [Google Scholar] [CrossRef]
- Cicero, A.F.G.; Fogacci, F.; Giovannini, M.; Mezzadri, M.; Grandi, E.; Borghi, C.; The Brisighella Heart Study Group. COVID-19-Related Quarantine Effect on Dietary Habits in a Northern Italian Rural Population: Data from the Brisighella Heart Study. Nutrients 2021, 13, 309. [Google Scholar] [CrossRef] [PubMed]
- Cransac-Miet, A.; Zeller, M.; Chagué, F.; Faure, A.S.; Bichat, F.; Danchin, N.; Boulin, M.; Cottin, Y. Impact of COVID-19 lockdown on lifestyle adherence in stay-at-home patients with chronic coronary syndromes: Towards a time bomb. Int. J. Cardiol. 2021, 323, 285–287. [Google Scholar] [CrossRef] [PubMed]
- Giacalone, D.; Frøst, M.B.; Rodríguez-Pérez, C. Reported Changes in Dietary Habits During the COVID-19 Lockdown in the Danish Population: The Danish COVIDiet Study. Front. Nutr. 2020, 7, 592112. [Google Scholar] [CrossRef]
- Al-Musharaf, S. Prevalence and Predictors of Emotional Eating among Healthy Young Saudi Women during the COVID-19 Pandemic. Nutrients 2020, 12, 2923. [Google Scholar] [CrossRef]
- Costi, S.; Paltrinieri, S.; Bressi, B.; Fugazzaro, S.; Giorgi Rossi, P.; Mazzini, E. Poor Sleep during the First Peak of the SARS-CoV-2 Pandemic: A Cross-Sectional Study. Int. J. Environ. Res. Public Health 2021, 18, 306. [Google Scholar] [CrossRef]
- Bhutani, S.; vanDellen, M.R.; Cooper, J.A. Longitudinal Weight Gain and Related Risk Behaviors during the COVID-19 Pandemic in Adults in the US. Nutrients 2021, 13, 671. [Google Scholar] [CrossRef] [PubMed]
- Ashby, N.J.S. Impact of the COVID-19 Pandemic on Unhealthy Eating in Populations with Obesity. Obes. Silver Spring 2020, 28, 1802–1805. [Google Scholar] [CrossRef] [PubMed]
- Bowling, A. Mode of questionnaire administration can have serious effects on data quality. J. Public Health 2005, 27, 281–291. [Google Scholar] [CrossRef] [PubMed] [Green Version]
- Kampf, G.; Kulldorff, M. Calling for benefit-risk evaluations of COVID-19 control measures. Lancet 2021, 397, 576–577. [Google Scholar] [CrossRef]

| Sample of Participants | Resident Population | ||||||||
| Total | Male | Female | Missing | Male | Female | Male | Female | ||
| n (%) | n (%) | n (%) | n (%) | % observed | % expected | ||||
| 1826 (100) | 423 (23.2) | 1397 (76.5) | 6 (0.3) | 21.2 * | 72.5 * | 49.2 ** | 50.8 ** | ||
| Sociodemographic factors | |||||||||
| Age | Young adults (18–44) | 818 (44.8) | 182 (22.2) | 636 (77.8) | 0 (0.0) | ·· | ·· | 31 ** | |
| Middle-aged (45–64) | 802 (43.9) | 179 (22.3) | 622 (77.6) | 1 (0.1) | ·· | ·· | 30 ** | ||
| Aged (≥65) | 194 (10.6) | 62 (32.0) | 132 (68.0) | 0 (0.0) | ·· | ·· | 21.7 ** | ||
| Missing | 12 (0.7) | 0 (0.0) | 7 (58.3) | 5 (41.7) | ·· | ·· | ·· | ||
| Education level | Low | 94 (5.1) | 32 (34.0) | 62 (66.0) | 0 (0.0) | 6.2 * | 3.8 * | 35.3 * | 28.0 * |
| Medium | 805 (44.1) | 190 (23.6) | 614 (76.3) | 1 (0.1) | 45.6 * | 45.2 * | 47.4 * | 48.4 * | |
| High | 889 (48.7) | 194 (21.8) | 695 (78.2) | 0 (0.0) | 48.2 * | 51.1 * | 17.3 * | 23.5 * | |
| Missing | 38 (2.1) | 7 (18.4) | 26 (68.4) | 5 (13.2) | ·· | ·· | ·· | ·· | |
| Household composition | Alone | 208 (11.4) | 51 (24.5) | 156 (75.0) | 1 (0.5) | ·· | ·· | 36.0 ** | |
| At least one cohabitant | 1618 (88.6) | 372 (23.0) | 1241 (76.7) | 5 (0.3) | ·· | ·· | 64.0 ** | ||
| Work-related factors | |||||||||
| Changes in work modality | Work suspended | 103 (5.6) | 14 (13.6) | 88 (85.4) | 1 (1.0) | ·· | ·· | ·· | ·· |
| More remote working | 544 (29.8) | 128 (23.5) | 416 (76.5) | 0 (0.0) | ·· | ·· | ·· | ·· | |
| Unchanged | 685 (37.5) | 168 (24.5) | 516 (75.3) | 1 (0.1) | ·· | ·· | ·· | ·· | |
| Not applicable | 313 (17.1) | 81 (25.9) | 231 (73.8) | 1 (0.3) | ·· | ·· | ·· | ·· | |
| Missing | 181 (9.9) | 32 (17.7) | 146 (80.7) | 3 (1.7) | ·· | ·· | ·· | ·· | |
| Economic difficulties | No | 1320 (72.3) | 317 (24.0) | 1001 (75.8) | 2 (0.2) | 76.4 * | 74.1 * | 67.0 * | 60.7 * |
| Some | 399 (21.9) | 83 (20.8) | 316 (79.2) | 0 (0.0) | 21.6 * | 23.7 * | 26.7 * | 31.7 * | |
| Many | 38 (2.1) | 9 (23.7) | 29 (76.3) | 0 (0.0) | 2.1 * | 2.2 * | 6.3 * | 7.6 * | |
| Missing | 69 (3.8) | 14 (20.3) | 51 (73.9) | 4 (5.8) | ·· | ·· | ·· | ·· | |
| Health status and lifestyle prior to lockdown | |||||||||
| Presence of chronic diseases | No | 1506 (82.5) | 355 (23.6) | 1145 (76.0) | 6 (0.4) | ·· | ·· | ·· | ·· |
| Yes | 320 (17.5) | 68 (21.3) | 252 (78.8) | 0 (0.0) | ·· | ·· | ·· | ·· | |
| BMI *** | Normal weight | 1052 (57.6) | 204 (19.4) | 845 (80.3) | 3 (0.3) | 52.8 * | 67.9 * | 48.8 * | 67.7 * |
| Overweight | 600 (32.9) | 192 (32.0) | 408 (68.0) | 0 (0.0) | 47.2 * | 32.1 * | 51.2 * | 32.3 * | |
| Missing | 174 (9.5) | 27 (15.5) | 144 (82.8) | 3 (1.7) | ·· | ·· | ·· | ·· | |
| Physical activity habits | Sedentary | 239 (13.1) | 45 (18.8) | 194 (81.2) | 0 (0.0) | 11.5 * | 14.0 * | 13.3 * | 19.5 * |
| Partially active | 995 (54.5) | 202 (20.3) | 791 (79.5) | 2 (0.2) | 47.4 * | 57.9 * | 26.3 * | 31.4 * | |
| Active | 548 (30.0) | 169 (30.8) | 379 (69.2) | 0 (0.0) | 41.0 * | 28.1 * | 60.4 * | 49.0 * | |
| Missing | 44 (2.4) | 7 (15.9) | 33 (75.0) | 4 (9.1) | ·· | ·· | ·· | ·· | |
| Alcohol drinking habits | Not a drinker | 824 (45.1) | 141 (17.1) | 683 (82.9) | 0 (0.0) | 32.4 * | 48.4 * | 20.0 * | 40.9 * |
| Moderate drinker | 780 (42.7) | 230 (29.5) | 549 (70.4) | 1 (0.1) | 67.6 * | 51.6 * | 80.0 * | 59.1 * | |
| High-risk drinker | 176 (9.6) | 48 (27.3) | 127 (72.2) | 1 (0.6) | |||||
| Missing | 46 (2.5) | 4 (8.7) | 38 (82.6) | 4 (8.7) | ·· | ·· | ·· | ·· | |
| Cigarette smoking habits | Smoker | 389 (21.3) | 95 (24.4) | 294 (75.6) | 0 (0.0) | 24.0 * | 21.9 * | 30.4 * | 22.9 * |
| Non-smoker | 1195 (65.4) | 269 (22.5) | 926 (77.5) | 0 (0.0) | 64.4 * | 68.5 * | 44.9 * | 58.9 * | |
| Former smoker | 189 (10.4) | 52 (27.5) | 135 (71.4) | 2 (1.1) | 11.6 * | 9.6 * | 24.7 * | 18.1 * | |
| Missing | 53 (2.9) | 7 (13.2) | 42 (79.2) | 4 (7.5) | ·· | ·· | ·· | ·· | |
| Total | Improved | Worsened | Unchanged | Missing | Improved | Worsened | |||||||
| n (%) | ORs | 95% CI | ORs | 95% CI | |||||||||
| lower limit | upper limit | lower limit | upper limit | p value | |||||||||
| 1826 (100.0) | 97 (5.3) | 641 (35.1) | 972 (53.2) | 116 (6.4) | |||||||||
| Sociodemographic factors | |||||||||||||
| Sex | Male | 423 (23.2) | 15 (3.5) | 140 (33.1) | 253 (59.8) | 15 (3.5) | 1 | .. | .. | 1 | .. | .. | 0.035 |
| Female | 1397 (76.5) | 82 (5.9) | 500 (35.8) | 718 (51.4) | 97 (6.9) | 1.96 | 1.08 | 3.53 | 1.22 | 0.96 | 1.56 | ||
| Missing | 6 (0.3) | 0 (0.0) | 1 (16.7) | 1 (16.7) | 4 (66.7) | .. | .. | .. | .. | .. | .. | ||
| Age * | Young adults | 818 (44.8) | 64 (7.8) | 302 (36.9) | 409 (50.0) | 43 (5.3) | 1 | .. | .. | 1 | .. | .. | <0.001 |
| Middle-aged | 802 (43.9) | 27 (3.4) | 287 (35.8) | 447 (55.7) | 41 (5.1) | 0.40 | 0.24 | 0.64 | 0.88 | 0.71 | 1.10 | ||
| Aged | 194 (10.6) | 5 (2.6) | 48 (24.7) | 113 (58.2) | 28 (14.4) | 0.28 | 0.10 | 0.79 | 0.64 | 0.44 | 0.94 | ||
| Missing | 12 (0.7) | 1 (8.3) | 4 (33.3) | 3 (25.0) | 4 (33.3) | .. | .. | .. | .. | .. | .. | ||
| Education level | Low | 94 (5.1) | 1 (1.1) | 26 (27.7) | 60 (63.8) | 7 (7.4) | 1 | .. | .. | 1 | .. | .. | 0.312 |
| Medium | 805 (44.1) | 41 (5.1) | 282 (35.0) | 402 (49.9) | 80 (9.9) | 4.53 | 0.61 | 33.91 | 1.51 | 0.92 | 2.48 | ||
| High | 889 (48.7) | 54 (6.1) | 322 (36.2) | 488 (54.9) | 25 (2.8) | 3.98 | 0.53 | 29.81 | 1.38 | 0.83 | 2.27 | ||
| Missing | 38 (2.1) | 1 (2.6) | 11 (28.9) | 22 (57.9) | 4 (10.5) | .. | .. | .. | .. | .. | .. | ||
| Household composition | Alone | 208 (11.4) | 11 (5.3) | 73 (35.1) | 115 (55.3) | 9 (4.3) | 1 | .. | .. | 1 | .. | .. | 0.898 |
| At least one cohabitant | 1618 (88.6) | 86 (5.3) | 568 (35.1) | 857 (53.0) | 107 (6.6) | 0.85 | 0.44 | 1.67 | 0.98 | 0.71 | 1.35 | ||
| Work-related factors | |||||||||||||
| Changes in work modality | Work suspended | 103 (5.6) | 6 (5.8) | 50 (48.5) | 40 (38.8) | 7 (6.8) | 1 | .. | .. | 1 | .. | .. | 0.001 |
| More remote working | 544 (29.8) | 47 (8.6) | 200 (36.8) | 274 (50.4) | 23 (4.2) | 1.17 | 0.46 | 2.98 | 0.60 | 0.38 | 0.97 | ||
| Unchanged | 685 (37.5) | 24 (3.5) | 230 (33.6) | 398 (58.1) | 33 (4.8) | 0.48 | 0.18 | 1.27 | 0.50 | 0.31 | 0.79 | ||
| Not appl. ** | 313 (17.1) | 15 (4.8) | 84 (26.8) | 180 (57.5) | 34 (10.9) | 0.96 | 0.33 | 2.80 | 0.44 | 0.26 | 0.76 | ||
| Missing | 181 (9.9) | 5 (2.8) | 77 (42.5) | 80 (44.2) | 19 (10.5) | .. | .. | .. | .. | .. | .. | ||
| Health status and lifestyle prior to lockdown | |||||||||||||
| Body mass index | Overweight | 600 (32.9) | 37 (6.2) | 210 (35.0) | 310 (51.7) | 43 (7.2) | 1 | .. | .. | 1 | .. | .. | 0.054 |
| Normal weight | 1052 (57.6) | 55 (5.2) | 376 (35.7) | 577 (54.8) | 44 (4.2) | 0.58 | 0.37 | 0.92 | 0.87 | 0.69 | 1.10 | ||
| Missing | 174 (9.5) | 5 (2.9) | 55 (31.6) | 85 (48.9) | 29 (16.7) | .. | .. | .. | .. | .. | .. | ||
| Physical activity habits *** | Sedentary | 239 (13.1) | 47 (19.7) | 0 (0.0) | 180 (75.3) | 12 (5.0) | 1 | .. | .. | 1 | .. | .. | <0.001 |
| Partially active | 995 (54.5) | 50 (5.0) | 355 (35.7) | 543 (54.6) | 47 (4.7) | 0.33 | 0.21 | 0.52 | - | - | - | ||
| Active | 548 (30.0) | 0 (0.0) | 286 (52.2) | 249 (45.4) | 13 (2.4) | - | - | - | - | - | - | ||
| Missing | 44 (2.4) | 0 (0.0) | 0 (0.0) | 0 (0.0) | 44 (100.0) | .. | .. | .. | .. | .. | .. | ||
| Cigarette smoking habits | Smoker | 389 (21.3) | 34 (8.7) | 138 (35.5) | 183 (47.0) | 34 (8.7) | 1 | .. | .. | 1 | .. | .. | 0.014 |
| Non-smoker | 1195 (65.4) | 53 (4.4) | 436 (36.5) | 655 (54.8) | 51 (4.3) | 0.44 | 0.28 | 0.72 | 0.89 | 0.69 | 1.15 | ||
| Former smoker | 189 (10.4) | 9 (4.8) | 55 (29.1) | 112 (59.3) | 13 (6.9) | 0.59 | 0.27 | 1.31 | 0.73 | 0.49 | 1.09 | ||
| Missing | 53 (2.9) | 1 (1.9) | 12 (22.6) | 22 (41.5) | 18 (34.0) | .. | .. | .. | .. | .. | .. | ||
| Symptoms of Psychological distress | |||||||||||||
| Tension | Yes | 359 (19.7) | 19 (5.3) | 162 (45.1) | 153 (42.6) | 25 (7.0) | 1 | .. | .. | 1 | .. | .. | <0.001 |
| No | 1337 (73.2) | 74 (5.5) | 445 (33.3) | 751 (56.2) | 67 (5.0) | 0.91 | 0.53 | 1.57 | 0.59 | 0.45 | 0.76 | ||
| Missing | 130 (7.1) | 4 (3.1) | 34 (26.2) | 68 (52.3) | 24 (18.5) | .. | .. | .. | .. | .. | .. | ||
| Upset | Yes | 372 (20.4) | 20 (5.4) | 156 (41.9) | 178 (47.8) | 18 (4.8) | 1 | .. | .. | 1 | .. | .. | 0.030 |
| No | 1284 (70.3) | 71 (5.5) | 435 (33.9) | 725 (56.5) | 53 (4.1) | 0.94 | 0.55 | 1.60 | 0.71 | 0.55 | 0.92 | ||
| Missing | 170 (9.3) | 6 (3.5) | 50 (29.4) | 69 (40.6) | 45 (26.5) | .. | .. | .. | .. | .. | .. | ||
| Worry | Yes | 810 (44.4) | 37 (4.6) | 323 (39.9) | 406 (50.1) | 44 (5.4) | 1 | .. | .. | 1 | .. | .. | 0.002 |
| No | 914 (50.1) | 52 (5.7) | 291 (31.8) | 527 (57.7) | 44 (4.8) | 1.13 | 0.71 | 1.78 | 0.70 | 0.57 | 0.86 | ||
| Missing | 102 (5.6) | 8 (7.8) | 27 (26.5) | 39 (38.2) | 28 (27.5) | .. | .. | .. | .. | .. | .. | ||
| Fear | Yes (ref) | 303 (16.6) | 13 (4.3) | 115 (38.0) | 150 (49.5) | 25 (8.3) | 1 | .. | .. | 1 | .. | .. | 0.329 |
| No | 1404 (76.9) | 81 (5.8) | 490 (34.9) | 768 (54.7) | 65 (4.6) | 1.28 | 0.68 | 2.38 | 0.86 | 0.65 | 1.13 | ||
| Missing | 119 (6.5) | 3 (2.5) | 36 (30.3) | 54 (45.4) | 26 (21.8) | .. | .. | .. | .. | .. | .. | ||
| Loneliness | Yes (ref) | 249 (13.6) | 13 (5.2) | 110 (44.2) | 116 (46.6) | 10 (4.0) | 1 | .. | .. | 1 | .. | .. | 0.028 |
| No | 1439 (78.8) | 79 (5.5) | 493 (34.3) | 798 (55.5) | 69 (4.8) | 0.88 | 0.47 | 1.65 | 0.67 | 0.50 | 0.90 | ||
| Missing | 138 (7.6) | 5 (3.6) | 38 (27.5) | 58 (42.0) | 37 (26.8) | .. | .. | .. | .. | .. | .. | ||
| Uncertainty | Yes | 996 (54.5) | 55 (5.5) | 405 (40.7) | 482 (48.4) | 54 (5.4) | 1 | .. | .. | 1 | .. | .. | <0.001 |
| No | 778 (42.6) | 39 (5.0) | 222 (28.5) | 470 (60.4) | 47 (6.0) | 0.78 | 0.50 | 1.21 | 0.57 | 0.46 | 0.70 | ||
| Missing | 52 (2.8) | 3 (5.8) | 14 (26.9) | 20 (38.5) | 15 (28.8) | .. | .. | .. | .. | .. | .. | ||
| Total | Improved | Worsened | Mixed Behaviors * | Unchanged * | Missing | Improved | Worsened | |||||||
| n (%) | ORs | 95% CI | ORs | 95% CI | p value | |||||||||
| lower limit | upper limit | lower limit | upper limit | |||||||||||
| 1826 (100.0) | 612 (33.5) | 321 (17.6) | 337 (18.5) | 530 (29.0) | 26 (1.4) | |||||||||
| Sociodemographic factors | ||||||||||||||
| Sex | Male | 423 (23.2) | 156 (36.9) | 48 (11.3) | 60 (14.2) | 150 (35.5) | 9 (2.1) | 1 | .. | .. | 1 | .. | .. | <0.001 |
| Female | 1397 (76.5) | 456 (32.6) | 272 (19.5) | 277 (19.8) | 379 (27.1) | 13 (0.9) | 0.90 | 0.71 | 1.15 | 1.90 | 1.33 | 2.71 | ||
| Missing | 6 (0.3) | 0 (0.0) | 1 (16.7) | 0 (0.0) | 1 (16.7) | 4 (66.7) | .. | .. | .. | .. | .. | .. | ||
| Age ** | Young adult | 818 (44.8) | 289 (35.3) | 165 (20.2) | 168 (20.5) | 187 (22.9) | 9 (1.1) | 1 | .. | .. | 1 | .. | .. | <0.001 |
| Middle-aged | 802 (43.9) | 274 (34.2) | 136 (17.0) | 132 (16.5) | 250 (31.2) | 10 (1.2) | 0.95 | 0.76 | 1.19 | 0.70 | 0.52 | 0.92 | ||
| Aged | 194 (10.6) | 45 (23.2) | 18 (9.3) | 36 (18.6) | 92 (47.4) | 3 (1.5) | 0.44 | 0.30 | 0.66 | 0.30 | 0.17 | 0.51 | ||
| Missing | 12 (0.7) | 4 (33.3) | 2 (16.7) | 1 (8.3) | 1 (8.3) | 4 (33.3) | .. | .. | .. | .. | .. | .. | ||
| Educational level | Low | 94 (5.1) | 23 (24.5) | 17 (18.1) | 19 (20.2) | 34 (36.2) | 1 (1.1) | 1 | .. | .. | 1 | .. | .. | <0.001 |
| Medium | 805 (44.1) | 242 (30.1) | 163 (20.2) | 162 (20.1) | 227 (28.2) | 11 (1.4) | 1.22 | 0.72 | 2.06 | 0.96 | 0.53 | 1.73 | ||
| High | 889 (48.7) | 338 (38.0) | 135 (15.2) | 148 (16.6) | 259 (29.1) | 9 (1.0) | 1.57 | 0.93 | 2.66 | 0.67 | 0.37 | 1.24 | ||
| Missing | 38 (2.1) | 9 (23.7) | 6 (15.8) | 8 (21.1) | 10 (26.3) | 5 (13.2) | .. | .. | .. | .. | .. | .. | ||
| Household composition | Alone | 208 (11.4) | 64 (30.8) | 43 (20.7) | 30 (14.4) | 68 (32.7) | 3 (1.4) | 1 | .. | .. | 1 | .. | .. | 0.213 |
| At least one cohabitant | 1618 (88.6) | 548 (33.9) | 278 (17.2) | 307 (19.0) | 462 (28.6) | 23 (1.4) | 1.01 | 0.72 | 1.42 | 0.72 | 0.48 | 1.07 | ||
| Work-related factors | ||||||||||||||
| Changes in work modality | Work suspended | 103 (5.6) | 32 (31.1) | 33 (32.0) | 23 (22.3) | 14 (13.6) | 1 (1.0) | 1 | .. | .. | 1 | .. | .. | 0.002 |
| More remote working | 544 (29.8) | 219 (40.3) | 88 (16.2) | 106 (19.5) | 122 (22.4) | 9 (1.7) | 1 | 0.60 | 1.69 | 0.51 | 0.30 | 0.89 | ||
| Unchanged | 685 (37.5) | 200 (29.2) | 132 (19.3) | 125 (18.2) | 225 (32.8) | 3 (0.4) | 0.63 | 0.38 | 1.06 | 0.52 | 0.30 | 0.89 | ||
| Not applicable | 313 (17.1) | 91 (29.1) | 42 (13.4) | 42 (13.4) | 133 (42.5) | 5 (1.6) | 0.86 | 0.48 | 1.54 | 0.50 | 0.27 | 0.94 | ||
| Missing | 181 (9.9) | 70 (38.7) | 26 (14.4) | 41 (22.7) | 36 (19.9) | 8 (4.4) | .. | .. | .. | .. | .. | .. | ||
| Health status and lifestyle prior to lockdown | ||||||||||||||
| Body mass index | Overweight | 600 (32.9) | 208 (34.7) | 120 (20.0) | 119 (19.8) | 149 (24.8) | 4 (0.7) | 1 | .. | .. | 1 | .. | .. | 0.010 |
| Normal weight | 1052 (57.6) | 361 (34.3) | 168 (16.0) | 173 (16.4) | 335 (31.8) | 15 (1.4) | 0.82 | 0.64 | 1.04 | 0.64 | 0.48 | 0.86 | ||
| Missing | 174 (9.5) | 43 (24.7) | 33 (19.0) | 45 (25.9) | 46 (26.4) | 7 (4.0) | .. | .. | .. | .. | .. | .. | ||
| Physical activity habits | Sedentary | 239 (13.1) | 76 (31.8) | 44 (18.4) | 40 (16.7) | 77 (32.2) | 2 (0.8) | 1 | .. | .. | 1 | .. | .. | 0.463 |
| Partially active | 995 (54.5) | 346 (34.8) | 180 (18.1) | 194 (19.5) | 265 (26.6) | 10 (1.0) | 1.17 | 0.84 | 1.61 | 1.10 | 0.74 | 1.63 | ||
| Active | 548 (30.0) | 176 (32.1) | 91 (16.6) | 96 (17.5) | 178 (32.5) | 7 (1.3) | 0.96 | 0.67 | 1.36 | 0.89 | 0.58 | 1.37 | ||
| Missing | 44 (2.4) | 14 (31.8) | 6 (13.6) | 7 (15.9) | 10 (22.7) | 7 (15.9) | .. | .. | .. | .. | .. | .. | ||
| Cigarette smoking habits | Smoker | 389 (21.3) | 116 (29.8) | 88 (22.6) | 85 (21.9) | 97 (24.9) | 3 (0.8) | 1 | .. | .. | 0.126 | |||
| Non- smoker | 1195 (65.4) | 427 (35.7) | 194 (16.2) | 207 (17.3) | 357 (29.9) | 10 (0.8) | 1.16 | 0.88 | 1.53 | 0.74 | 0.54 | 1.01 | ||
| Former smoker | 189 (10.4) | 57 (30.2) | 32 (16.9) | 38 (20.1) | 60 (31.7) | 2 (1.1) | 1.02 | 0.67 | 1.54 | 0.78 | 0.48 | 1.29 | ||
| Missing | 53 (2.9) | 12 (22.6) | 7 (13.2) | 7 (13.2) | 16 (30.2) | 11 (20.8) | .. | .. | .. | .. | .. | .. | ||
| Symptoms of Psychological distress | ||||||||||||||
| Tension | Yes | 359 (19.7) | 97 (27.0) | 105 (29.2) | 78 (21.7) | 76 (21.2) | 3 (0.8) | 1 | .. | .. | 1 | .. | .. | <0.001 |
| No | 1337 (73.2) | 479 (35.8) | 197 (14.7) | 238 (17.8) | 408 (30.5) | 15 (1.1) | 1.16 | 0.87 | 1.55 | 0.50 | 0.37 | 0.69 | ||
| Missing | 130 (7.1) | 36 (27.7) | 19 (14.6) | 21 (16.2) | 46 (35.4) | 8 (6.2) | .. | .. | .. | .. | .. | .. | ||
| Upset | Yes | 372 (20.4) | 126 (33.9) | 87 (23.4) | 81 (21.8) | 75 (20.2) | 3 (0.8) | 1 | .. | .. | 1 | .. | .. | 0.001 |
| No | 1284 (70.3) | 450 (35.0) | 190 (14.8) | 220 (17.1) | 411 (32.0) | 13 (1.0) | 0.82 | 0.62 | 1.07 | 0.55 | 0.40 | 0.76 | ||
| Missing | 170 (9.3) | 36 (21.2) | 44 (25.9) | 36 (21.2) | 44 (25.9) | 10 (5.9) | .. | .. | .. | .. | .. | .. | ||
| Worry | Yes | 810 (44.4) | 274 (33.8) | 167 (20.6) | 148 (18.3) | 211 (26.0) | 10 (1.2) | 1 | .. | .. | 1 | .. | .. | <0.001 |
| No | 914 (50.1) | 310 (33.9) | 124 (13.6) | 176 (19.3) | 296 (32.4) | 8 (0.9) | 0.81 | 0.65 | 1.00 | 0.56 | 0.42 | 0.74 | ||
| Missing | 102 (5.6) | 28 (27.5) | 30 (29.4) | 13 (12.7) | 23 (22.5) | 8 (7.8) | .. | .. | .. | .. | .. | .. | ||
| Fear | Yes | 303 (16.6) | 90 (29.7) | 77 (25.4) | 62 (20.5) | 72 (23.8) | 2 (0.7) | 1 | .. | .. | 1 | .. | .. | 0.023 |
| No | 1404 (76.9) | 482 (34.3) | 228 (16.2) | 257 (18.3) | 422 (30.1) | 15 (1.1) | 0.99 | 0.74 | 1.34 | 0.65 | 0.47 | 0.90 | ||
| Missing | 119 (6.5) | 40 (33.6) | 16 (13.4) | 18 (15.1) | 36 (30.3) | 9 (7.6) | .. | .. | .. | .. | .. | .. | ||
| Loneliness | Yes | 249 (13.6) | 76 (30.5) | 59 (23.7) | 57 (22.9) | 55 (22.1) | 2 (0.8) | 1 | .. | .. | 1 | .. | .. | 0.039 |
| No | 1439 (78.8) | 504 (35.0) | 225 (15.6) | 261 (18.1) | 436 (30.3) | 13 (0.9) | 1.00 | 0.73 | 1.38 | 0.65 | 0.45 | 0.93 | ||
| Missing | 138 (7.6) | 32 (23.2) | 37 (26.8) | 19 (13.8) | 39 (28.3) | 11 (8.0) | .. | .. | .. | .. | .. | .. | ||
| Uncertainty | Yes | 996 (54.5) | 345 (34.6) | 190 (19.1) | 186 (18.7) | 265 (26.6) | 10 (1.0) | 1 | .. | .. | 1 | .. | .. | 0.032 |
| No | 778 (42.6) | 247 (31.7) | 121 (15.6) | 145 (18.6) | 256 (32.9) | 9 (1.2) | 0.78 | 0.63 | 0.97 | 0.75 | 0.57 | 0.99 | ||
| Missing | 52 (2.8) | 20 (38.5) | 10 (19.2) | 6 (11.5) | 9 (17.3) | 7 (13.5) | .. | .. | .. | .. | .. | .. | ||
| Total | Decreased | Increased | Unchanged | Missing | Decreased | Increased | |||||||
| n (%) | ORs | 95% CI | ORs | 95% CI | |||||||||
| lower limit | upper limit | lower limit | upper limit | p value | |||||||||
| 1826 (100) | 231 (12.6) | 229 (12.5) | 1275 (69.8) | 91 (5.0) | |||||||||
| Sociodemographic factors | |||||||||||||
| Sex | Male | 423 (23.2) | 80 (18.9) | 54 (12.8) | 277 (65.5) | 12 (2.8) | 1 | .. | .. | 1 | .. | .. | <0.001 |
| Female | 1397(76.5) | 151 (10.8) | 174 (12.5) | 997 (71.4) | 75 (5.4) | 0.47 | 0.34 | 0.65 | 0.80 | 0.57 | 1.13 | ||
| Missing | 6 (0.3) | 0 (0.0) | 1 (16.7) | 1 (16.7) | 4 (66.7) | .. | .. | .. | .. | .. | .. | ||
| Age | Young adults (18–44) | 818 (44.8) | 162 (19.8) | 131 (16.0) | 503 (61.5) | 22 (2.7) | 1 | .. | .. | 1 | .. | .. | <0.001 |
| Middle-aged (45–64) | 802 (43.9) | 56 (7.0) | 94 (11.7) | 607 (75.7) | 45 (5.6) | 0.27 | 0.20 | 0.39 | 0.60 | 0.44 | 0.80 | ||
| Aged (≥ 65) | 194 (10.6) | 12 (6.2) | 3 (1.5) | 159 (82.0) | 20 (10.3) | 0.20 | 0.10 | 0.38 | 0.07 | 0.02 | 0.23 | ||
| Missing | 12 (0.7) | 1 (8.3) | 1 (8.3) | 6 (50.0) | 4 (33.3) | .. | .. | .. | .. | .. | .. | ||
| Educational level | Low | 94 (5.1) | 6 (6.4) | 9 (9.6) | 68 (72.3) | 11(11.7) | 1 | .. | .. | 1 | .. | .. | 0.910 |
| Medium | 805 (44.1) | 97 (12.0) | 95 (11.8) | 573 (71.2) | 40 (5.0) | 1.46 | 0.60 | 3.57 | 0.91 | 0.43 | 1.93 | ||
| High | 889 (48.7) | 124 (13.9) | 123 (13.8) | 610 (68.6) | 32 (3.6) | 1.41 | 0.58 | 3,44 | 0.97 | 0.46 | 2.05 | ||
| Missing | 38 (2.1) | 4 (10.5) | 2 (5.3) | 24 (63.2) | 8 (21.1) | .. | .. | .. | .. | .. | .. | ||
| Household composition | Alone | 208 (11.4) | 36 (17.3) | 19 (9.1) | 140 (67.3) | 13 (6.3) | 1 | .. | .. | 1 | .. | .. | 0.012 |
| At least one cohabitant | 1618 (88.6) | 195 (12.1) | 210 (13.0) | 1135 (70.1) | 78 (4.8) | 0.55 | 0.36 | 0.85 | 1.17 | 0.70 | 1.96 | ||
| Work-related factors | |||||||||||||
| Changes in work modality | Work suspended | 103 (5.6) | 18 (17.5) | 12 (11.7) | 66 (64.1) | 7 (6.8) | 1 | .. | .. | 1 | .. | .. | 0.024 |
| More remote working | 544 (29.8) | 64 (11.8) | 95 (17.5) | 375 (68.9) | 10 (1.8) | 0.57 | 0.31 | 1.06 | 1.37 | 0.70 | 2.68 | ||
| Unchanged | 685 (37.5) | 103 (15.0) | 81 (11.8) | 485 (70.8) | 16 (2.3) | 0.88 | 0.49 | 1.59 | 0.99 | 0.50 | 1.94 | ||
| Not applicable | 313 (17.1) | 30 (9.6) | 18 (5.8) | 229 (73.2) | 36 (11.5) | 0.90 | 0.44 | 1.84 | 0.84 | 0.37 | 1.91 | ||
| Missing | 181 (9.9) | 16 (8.8) | 23 (12.7) | 120 (66.3) | 22 (12.2) | .. | .. | .. | .. | .. | .. | ||
| Health status and lifestyle prior to lockdown | |||||||||||||
| Body mass index | Overweight | 600 (32.9) | 57 (9.5) | 61 (10.2) | 452 (75.3) | 30 (5.0) | 1 | .. | .. | 1 | .. | .. | 0.013 |
| Normal weight | 1052 (57.6) | 154 (14.6) | 147 (14.0) | 705 (67.0) | 46 (4.4) | 1.59 | 1.12 | 2.24 | 1.35 | 0.97 | 1.89 | ||
| Missing | 174 (9.5) | 20 (11.5) | 21 (12.1) | 118 (67.8) | 15 (8.6) | .. | .. | .. | .. | .. | .. | ||
| Physical activity habits | Sedentary | 239 (13.1) | 27 (11.3) | 26 (10.9) | 176 (73.6) | 10 (4.2) | 1 | .. | .. | 1 | .. | .. | 0.037 |
| Partially active | 995 (54.5) | 110 (11.1) | 120 (12.1) | 729 (73.3) | 36 (3.6) | 0.97 | 0.61 | 1.55 | 1.15 | 0.72 | 1.82 | ||
| Active | 548 (30.0) | 93 (17.0) | 79 (14.4) | 348 (63.5) | 28 (5.1) | 1.53 | 0.94 | 2.47 | 1.50 | 0.92 | 2.44 | ||
| Missing | 44 (2.4) | 1 (2.3) | 4 (9.1) | 22 (50.0) | 17 (38.6) | .. | .. | .. | .. | .. | .. | ||
| Cigarette smoking habits | Smoker | 389 (21.3) | 59 (15.2) | 60 (15.4) | 253 (65.0) | 17 (4.4) | 1 | .. | .. | 1 | .. | .. | 0.123 |
| Non- smoker | 1195 (65.4) | 152 (12.7) | 139 (11.6) | 857 (71.7) | 47 (3.9) | 0.85 | 0.60 | 1.22 | 0.66 | 0.47 | 0.93 | ||
| Former smoker | 189 (10.4) | 16 (8.5) | 22 (11.6) | 146 (77.2) | 5 (2.6) | 0.62 | 0.33 | 1.16 | 0.73 | 0.42 | 1.28 | ||
| Missing | 53 (2.9) | 4 (7.5) | 8 (15.1) | 19 (35.8) | 22 (41.5) | .. | .. | .. | .. | .. | .. | ||
| Psychological distress | |||||||||||||
| Tension | Yes | 359 (19.7) | 43 (12.0) | 74 (20.6) | 232 (64.6) | 10 (2.8) | 1 | .. | .. | 1 | .. | .. | <0.001 |
| No | 1337 (73.2) | 184 (13.8) | 140 (10.5) | 951 (71.1) | 62 (4.6) | 1.06 | 0.73 | 1.56 | 0.49 | 0.35 | 0.68 | ||
| Missing | 130 (7.1) | 4 (3.1) | 15 (11.5) | 92 (70.8) | 19 (14.6) | .. | .. | .. | .. | .. | .. | ||
| Upset | Yes | 372 (20.4) | 45 (12.1) | 72 (19.4) | 246 (66.1) | 9 (2.4) | 1 | .. | .. | 1 | .. | .. | 0.001 |
| No | 1284 (70.3) | 181 (14.1) | 143 (11.1) | 900 (70.1) | 60 (4.7) | 1.00 | 0.69 | 1.44 | 0.54 | 0.39 | 0.75 | ||
| Missing | 170 (9.3) | 5 (2.9) | 14 (8.2) | 129 (75.9) | 22 (12.9) | .. | .. | .. | .. | .. | .. | ||
| Worry | Yes | 810 (44.4) | 94 (11.6) | 127 (15.7) | 556 (68.6) | 33 (4.1) | 1 | .. | .. | 1 | .. | .. | 0.004 |
| No | 914 (50.1) | 133 (14.6) | 95 (10.4) | 647 (70.8) | 39 (4.3) | 1.04 | 0.77 | 1.42 | 0.61 | 0.45 | 0.82 | ||
| Missing | 102 (5.6) | 4 (3.9) | 7 (6.9) | 72 (70.6) | 19 (18.6) | .. | .. | .. | .. | .. | .. | ||
| Fear | Yes | 303 (16.6) | 31 (10.2) | 53 (17.5) | 201 (66.3) | 18 (5.9) | 1 | .. | .. | 1 | .. | .. | 0.010 |
| No | 1404 (76.9) | 194 (13.8) | 160 (11.4) | 995 (70.9) | 55 (3.9) | 1.02 | 0.66 | 1.56 | 0.58 | 0.40 | 0.83 | ||
| Missing | 119 (6.5) | 6 (5.0) | 16 (13.4) | 79 (66.4) | 18 (15.1) | .. | .. | .. | .. | .. | .. | ||
| Loneliness | Yes | 249 (13.6) | 47 (18.9) | 41 (16.5) | 152 (61.0) | 9 (3.6) | 1 | .. | .. | 1 | .. | .. | 0.001 |
| No | 1439 (78.8) | 180 (12.5) | 170 (11.8) | 1027 (71.4) | 62 (4.3) | 0.54 | 0.36 | 0.78 | 0.62 | 0.42 | 0.93 | ||
| Missing | 138 (7.6) | 4 (2.9) | 18 (13.0) | 96 (69.6) | 20 (14.5) | .. | .. | .. | .. | .. | .. | ||
| Uncertainty | Yes | 996 (54.5) | 118 (11.8) | 140 (14.1) | 693 (69.6) | 45 (4.5) | 1 | .. | .. | 1 | .. | .. | 0.040 |
| No | 778 (42.6) | 107 (13.8) | 78 (10.0) | 558 (71.7) | 35 (4.5) | 1.06 | 0.79 | 1.43 | 0.69 | 0.51 | 0.93 | ||
| Missing | 52 (2.8) | 6 (11.5) | 11 (21.2) | 24 (46.2) | 11 (21.2) | .. | .. | .. | .. | .. | .. | ||
| Total | Decreased | Increased | Unchanged | Missing | Decreased | Increased | |||||||
| n (%) | ORs | 95% CI | ORs | 95% CI | |||||||||
| lower limit | upper limit | lower limit | upper limit | p value | |||||||||
| 1826 (100) | 75 (4.1) | 140 (7.7) | 1327 (72.7) | 284 (15.6) | |||||||||
| Sociodemographic factors | |||||||||||||
| Sex | Male | 423 (23.2) | 18 (4.3) | 32 (7.6) | 311 (73.5) | 62 (14.7) | 1 | .. | .. | 1 | .. | .. | 0.827 |
| Female | 1397(76.5) | 57 (4.1) | 108 (7.7) | 1014 (72.6) | 218 (15.6) | 1.06 | 0.60 | 1.86 | 1.14 | 0.74 | 1.74 | ||
| Missing | 6 (0.3) | 0 (0.0) | 0 (0.0) | 2 (33.3) | 4 (66.7) | .. | .. | .. | .. | .. | .. | ||
| Age | Young adult (18–44) | 818 (44.8) | 55 (6.7) | 66 (8.1) | 611 (74.7) | 86 (10.5) | 1 | .. | .. | 1 | .. | .. | <0.001 |
| Middle-aged (45–64) | 802 (43.9) | 17 (2.1) | 51 (6.4) | 611 (76.2) | 123 (15.3) | 0.27 | 0.15 | 0.48 | 0.69 | 0.46 | 1.02 | ||
| Aged (≥ 65) | 194 (10.6) | 2 (1.0) | 23 (11.9) | 99 (51.0) | 70 (36.1) | 0.22 | 0.05 | 0.91 | 2.11 | 1.23 | 3.62 | ||
| Missing | 12 (0.7) | 1 (8.3) | 0 (0.0) | 6 (50.0) | 5 (41.7) | .. | .. | .. | .. | .. | .. | ||
| Educational level | Low | 94 (5.1) | 2 (2.1) | 7 (7.4) | 59 (62.8) | 26 (27.7) | 1 | .. | .. | 1 | .. | .. | 0.004 |
| Medium | 805 (44.1) | 40 (5.0) | 73 (9.1) | 545 (67.7) | 147 (18.3) | 1.58 | 0.37 | 6.87 | 1.34 | 0.57 | 3.11 | ||
| High | 889 (48.7) | 32 (3.6) | 58 (6.5) | 700 (78.7) | 99 (11.1) | 0.76 | 0.17 | 3.37 | 0.77 | 0.33 | 1.83 | ||
| Missing | 38 (2.1) | 1 (2.6) | 2 (5.3) | 23 (60.5) | 12 (31.6) | .. | .. | .. | .. | .. | .. | ||
| Household composition | Alone | 208 (11.4) | 12 (5.8) | 21 (10.1) | 138 (66.3) | 37 (17.8) | 1 | .. | .. | 1 | .. | .. | 0.027 |
| At least one cohabitant | 1618 (88.6) | 63 (3.9) | 119 (7.4) | 1189 (73.5) | 247 (15.3) | 0.48 | 0.25 | 0.93 | 0.63 | 0.38 | 1.05 | ||
| Work-related factors | |||||||||||||
| Changes in work modality | Work suspended | 103 (5.6) | 6 (5.8) | 10 (9.7) | 72 (69.9) | 15 (14.6) | 1 | .. | .. | 1 | .. | .. | 0.126 |
| More remote working | 544 (29.8) | 26 (4.8) | 41 (7.5) | 419 (77.0) | 58 (10.7) | 0.80 | 0.31 | 2.09 | 0.80 | 0.38 | 1.69 | ||
| Unchanged | 685 (37.5) | 27 (3.9) | 62 (9.1) | 515 (75.2) | 81 (11.8) | 0.84 | 0.33 | 2.15 | 0.89 | 0.43 | 1.84 | ||
| Not applicable | 313 (17.1) | 9 (2.9) | 17 (5.4) | 197 (62.9) | 90 (28.8) | 0.97 | 0.32 | 3.00 | 0.30 | 0.11 | 0.78 | ||
| Missing | 181 (9.9) | 7 (3.9) | 10 (5.5) | 124 (68.5) | 40 (22.1) | .. | .. | .. | .. | .. | .. | ||
| Health status and lifestyle prior to lockdown | |||||||||||||
| Body mass index | Overweight | 600 (32.9) | 22 (3.7) | 39 (6.5) | 434 (72.3) | 105 (17.5) | 1 | .. | .. | 1 | .. | .. | 0.658 |
| Normal weight | 1052 (57.6) | 45 (4.3) | 81 (7.7) | 785 (74.6) | 141 (13.4) | 1.03 | 0.60 | 1.79 | 1.21 | 0.80 | 1.84 | ||
| Missing | 174 (9.5) | 8 (4.6) | 20 (11.5) | 108 (62.1) | 38 (21.8) | .. | .. | .. | .. | .. | .. | ||
| Physical activity habits | Sedentary | 239 (13.1) | 12 (5.0) | 14 (5.9) | 176 (73.6) | 37 (15.5) | 1 | .. | .. | 1 | .. | .. | 0.281 |
| Partially active | 995 (54.5) | 31 (3.1) | 79 (7.9) | 733 (73.7) | 152 (15.3) | 0.60 | 0.30 | 1.21 | 1.30 | 0.72 | 2.37 | ||
| Active | 548 (30.0) | 30 (5.5) | 45 (8.2) | 398 (72.6) | 75 (13.7) | 0.99 | 0.49 | 2.02 | 1.39 | 0.74 | 2.62 | ||
| Missing | 44 (2.4) | 2 (4.5) | 2 (4.5) | 20 (45.5) | 20 (45.5) | .. | .. | .. | .. | .. | .. | ||
| Cigarette smoking habits | Smoker | 389 (21.3) | 72 (18.5) | 127 (32.6) | 171 (44.0) | 19 (4.9) | 1 | .. | .. | 1 | .. | .. | <0.001 |
| Non-smoker | 1195 (65.4) | 2 (0.2) | 6 (0.5) | 987 (82.6) | 200 (16.7) | 0.00 | 0.00 | 0.02 | 0.01 | 0.00 | 0.02 | ||
| Former smoker | 189 (10.4) | 0 (0.0) | 5 (2.6) | 156 (82.5) | 28 (14.8) | - | 0 | - | 0.04 | 0.02 | 0.11 | ||
| Missing | 53 (2.9) | 1 (1.9) | 2 (3.8) | 13 (24.5) | 37 (69.8) | .. | .. | .. | .. | .. | .. | ||
| Psychological distress | |||||||||||||
| Tension | Yes | 359 (19.7) | 17 (4.7) | 37 (10.3) | 248 (69.1) | 57 (15.9) | 1 | .. | .. | 1 | .. | .. | 0.129 |
| No | 1337 (73.2) | 55 (4.1) | 97 (7.3) | 1006 (75.2) | 179 (13.4) | 0.90 | 0.50 | 1.60 | 0.65 | 0.43 | 0.99 | ||
| Missing | 130 (7.1) | 3 (2.3) | 6 (4.6) | 73 (56.2) | 48 (36.9) | .. | .. | .. | .. | .. | .. | ||
| Upset | Yes | 372 (20.4) | 15 (4.0) | 39 (10.5) | 264 (71.0) | 54 (14.5) | 1 | .. | .. | 1 | .. | .. | 0.034 |
| No | 1284 (70.3) | 55 (4.3) | 84 (6.5) | 975 (75.9) | 170 (13.2) | 1.02 | 0.56 | 1.87 | 0.58 | 0.38 | 0.88 | ||
| Missing | 170 (9.3) | 5 (2.9) | 17 (10.0) | 88 (51.8) | 60 (35.3) | .. | .. | .. | .. | .. | .. | ||
| Worry | Yes | 810 (44.4) | 31 (3.8) | 64 (7.9) | 595 (73.5) | 120 (14.8) | 1 | .. | .. | 1 | .. | .. | 0.918 |
| No | 914 (50.1) | 40 (4.4) | 69 (7.5) | 677 (74.1) | 128 (14.0) | 1.11 | 0.67 | 1.84 | 1.00 | 0.69 | 1.45 | ||
| Missing | 102 (5.6) | 4 (3.9) | 7 (6.9) | 55 (53.9) | 36 (35.3) | .. | .. | .. | .. | .. | .. | ||
| Fear | Yes | 303 (16.6) | 9 (3.0) | 30 (9.9) | 209 (69.0) | 55 (18.2) | 1 | .. | .. | 1 | .. | .. | 0.224 |
| No | 1404 (76.9) | 62 (4.4) | 105 (7.5) | 1047 (74.6) | 190 (13.5) | 1.36 | 0.65 | 2.83 | 0.72 | 0.46 | 1.12 | ||
| Missing | 119 (6.5) | 4 (3.4) | 5 (4.2) | 71 (59.7) | 39 (32.8) | .. | .. | .. | .. | .. | .. | ||
| Loneliness | Yes | 249 (13.6) | 17 (6.8) | 28 (11.2) | 166 (66.7) | 38 (15.3) | 1 | .. | .. | 1 | .. | .. | 0.027 |
| No | 1439 (78.8) | 53(3.7) | 105 (7.3) | 1089 (75.7) | 192 (13.3) | 0.55 | 0.31 | 1.01 | 0.61 | 0.39 | 0.97 | ||
| Missing | 138 (7.6) | 5 (3.6) | 7 (5.1) | 72 (52.2) | 54 (39.1) | .. | .. | .. | .. | .. | .. | ||
| Uncertainty | Yes | 996 (54.5) | 40 (4.0) | 98 (9.8) | 725 (72.8) | 133 (13.4) | 1 | .. | .. | 1 | .. | .. | 0.011 |
| No | 778 (42.6) | 32 (4.1) | 41 (5.3) | 574 (73.8) | 131 (16.8) | 1.05 | 0.64 | 1.72 | 0.56 | 0.38 | 0.82 | ||
| Missing | 52 (2.8) | 3 (5.8) | 1 (1.9) | 28 (53.8) | 20 (38.5) | .. | .. | .. | .. | .. | .. | ||
Publisher’s Note: MDPI stays neutral with regard to jurisdictional claims in published maps and institutional affiliations. |
© 2021 by the authors. Licensee MDPI, Basel, Switzerland. This article is an open access article distributed under the terms and conditions of the Creative Commons Attribution (CC BY) license (https://creativecommons.org/licenses/by/4.0/).
Share and Cite
Paltrinieri, S.; Bressi, B.; Costi, S.; Mazzini, E.; Cavuto, S.; Ottone, M.; De Panfilis, L.; Fugazzaro, S.; Rondini, E.; Giorgi Rossi, P. Beyond Lockdown: The Potential Side Effects of the SARS-CoV-2 Pandemic on Public Health. Nutrients 2021, 13, 1600. https://doi.org/10.3390/nu13051600
Paltrinieri S, Bressi B, Costi S, Mazzini E, Cavuto S, Ottone M, De Panfilis L, Fugazzaro S, Rondini E, Giorgi Rossi P. Beyond Lockdown: The Potential Side Effects of the SARS-CoV-2 Pandemic on Public Health. Nutrients. 2021; 13(5):1600. https://doi.org/10.3390/nu13051600
Chicago/Turabian StylePaltrinieri, Sara, Barbara Bressi, Stefania Costi, Elisa Mazzini, Silvio Cavuto, Marta Ottone, Ludovica De Panfilis, Stefania Fugazzaro, Ermanno Rondini, and Paolo Giorgi Rossi. 2021. "Beyond Lockdown: The Potential Side Effects of the SARS-CoV-2 Pandemic on Public Health" Nutrients 13, no. 5: 1600. https://doi.org/10.3390/nu13051600