Article

The Joint Effect of Maternal Marital Status and Type of Household Cooking Fuel on Child Nutritional Status in Sub-Saharan Africa: Analysis of Cross-Sectional Surveys on Children from 31 Countries

1
Africa Centre of Excellence in Coastal Resilience, University of Cape Coast, Cape Coast PMB TF0494, Ghana
2
Department of Fisheries and Aquatic Sciences, College of Agriculture and Natural Sciences, School of Biological Sciences, University of Cape Coast, Cape Coast PMB TF0494, Ghana
3
Department of Population and Health, College of Humanities and Legal Studies, University of Cape Coast, Cape Coast PMB TF0494, Ghana
4
College of Public Health, Medical and Veterinary Sciences, James Cook University, Townsville, QLD 4811, Australia
5
Department of Health, Physical Education, and Recreation, University of Cape Coast, Cape Coast PMB TF0494, Ghana
6
Neurocognition and Action-Biomechanics-Research Group, Faculty of Psychology and Sport Sciences, Bielefeld University, Postfach 10 01 31, 33501 Bielefeld, Germany
7
School of Public Health, Faculty of Health, University of Technology Sydney, Sydney, NSW 2007, Australia
*
Author to whom correspondence should be addressed.
Nutrients 2021, 13(5), 1541; https://doi.org/10.3390/nu13051541
Submission received: 12 March 2021 / Revised: 21 April 2021 / Accepted: 28 April 2021 / Published: 3 May 2021
(This article belongs to the Section Nutrition and Public Health)

Abstract

:
The current study sought to investigate the joint effect of maternal marital status and type of household cooking fuel on child nutritional status in sub-Saharan Africa. Data in the children’s files of 31 sub-Saharan African countries were pooled from the Demographic and Health Surveys collected between 2010 and 2019. The outcome variables were three child anthropometrics: stunting (height-for-age z-scores); wasting (weight-for-height z-scores); and underweight (weight-for-age z-scores). The joint effect of maternal marital status and type of household cooking fuel on child nutritional status was examined using multilevel regression models. The results were presented as adjusted odds ratios (aORs) at p < 0.05. The percentages of children who were stunted, wasted and underweight in the 31 countries in sub-Saharan Africa were 31%, 8% and 17%, respectively. On the joint effect of maternal marital status and type of household cooking fuel on stunting, we found that compared to children born to married mothers who used clean household cooking fuel, children born to single mothers who use unclean household cooking fuel, children born to single women who use clean household cooking fuel, and children born to married women who used unclean household cooking were more likely to be stunted. With wasting, children born to single mothers who used unclean household cooking fuel and children born to married women who used unclean household cooking fuel were more likely to be wasted compared to children born to married mothers who used clean household cooking fuel. With underweight, we found that compared to children born to married mothers who used clean household cooking fuel, children born to single mothers who used unclean household cooking fuel, children born to single women who used clean household cooking fuel and children born to married women who used unclean household cooking were more likely to be underweight. It is imperative for the governments of the 31 sub-Saharan African countries to double their efforts to end the use of unclean household cooking fuel. This goal could be achieved by promoting clean household cooking fuel (e.g., electricity, gas, ethanol, solar, etc.) through effective health education, and promotion programmes. The attention of policymakers is drawn to the urgent need for children’s nutritional status policies and programmes (e.g., dietary supplementation, increasing dietary diversity, improving agriculture and food security) to be targeted towards at-risk sub-populations (i.e., single mothered households).

1. Introduction

Children are expected to receive the required nutritional needs to promote their physical and cognitive development [1]. Hence, child nutrition can be thought of as a fundamental right of children, with several countries across the globe contributing significantly towards the improvement of children’s nutritional status (CNS) [1]. Notwithstanding these efforts to reduce child morbidity and mortality, CNS (manifesting as stunting, wasting, or underweight) remains an obdurate public health concern, especially in sub-Saharan Africa (SSA) [2]. Reports from UNICEF [3] indicate that SSA recorded the highest prevalence of stunting (40%) and the second-highest prevalence of wasting (9%) worldwide in 2018. This is a worrying development for SSA, and therefore calls for urgent research to explore the underlying factors that result in the nutritional status of children within the region.
Prioritizing CNS is integral to the health, and wellbeing of the child sincepoor CNS may have deleterious repercussions (short and long term) on the individual. For instance, some studies have revealed that stunted children are at higher risk of experiencing poorer health, lower economic status, poor cognition, as well as lower educational performance [4,5].
Existing evidence on CNS has largely focused on how characteristics such as the age of the mother, poverty, and feeding practices [6,7,8] relate to CNS, with little attention given to the potential relationship between maternal marital status and CNS. However, available evidence suggests that there have been significant changes in the family structure, with an increasing incidence of out-of-wedlock motherhood, divorce, and widowhood being reported in SSA [9]. The effects of globalization, urbanization, and the HIV pandemic have been cited as potential reasons, hence resulting in an increased proportion of single mothers within the sub-region [9,10]. This proliferation of single mothers also arouses concerns that a substantial proportion of children born are being raised in a single-mother household [2].
Beyond the postulation that there may be an association between maternal marital status and CNS, there is a growing interest within the public health discipline concerning the role or association between household cooking fuel type and CNS [11,12,13,14]. Previous studies have demonstrated the association between cooking fuel and children’s health. For instance, in a study conducted by Owili et al. [11], it was found that the odds of an under-five child dying was higher for those whose households used charcoal and biomass cooking fuel compared to those who used clean fuel. Thus, a lack of access to and non-use of clean cooking fuel exacerbates under-five mortality. Other studies have also shown that under-fives may die when exposed to solid fuel usually used in the household within the sub-Saharan African context [15].
After an extensive literature search, we found no study in SSA that has explicitly examined the joint effect of maternal marital status and household cooking fuel type on CNS. Therefore, in the present study, we sought to contribute towards bridging the gap in the literature by investigating the joint effect of maternal marital status and householdcooking fuel type on CNSin SSA.
Our study is timely and significant in facilitating SSA’s quest to achieve the Sustainable Development Goals (SDG), particularly SDG 2.2, which envisions to end all forms of malnutrition by 2030, and also ensure that by 2025, the internationally agreed targets on stunting and wasting in children under five years of age are achieved [3].

2. Materials and Methods
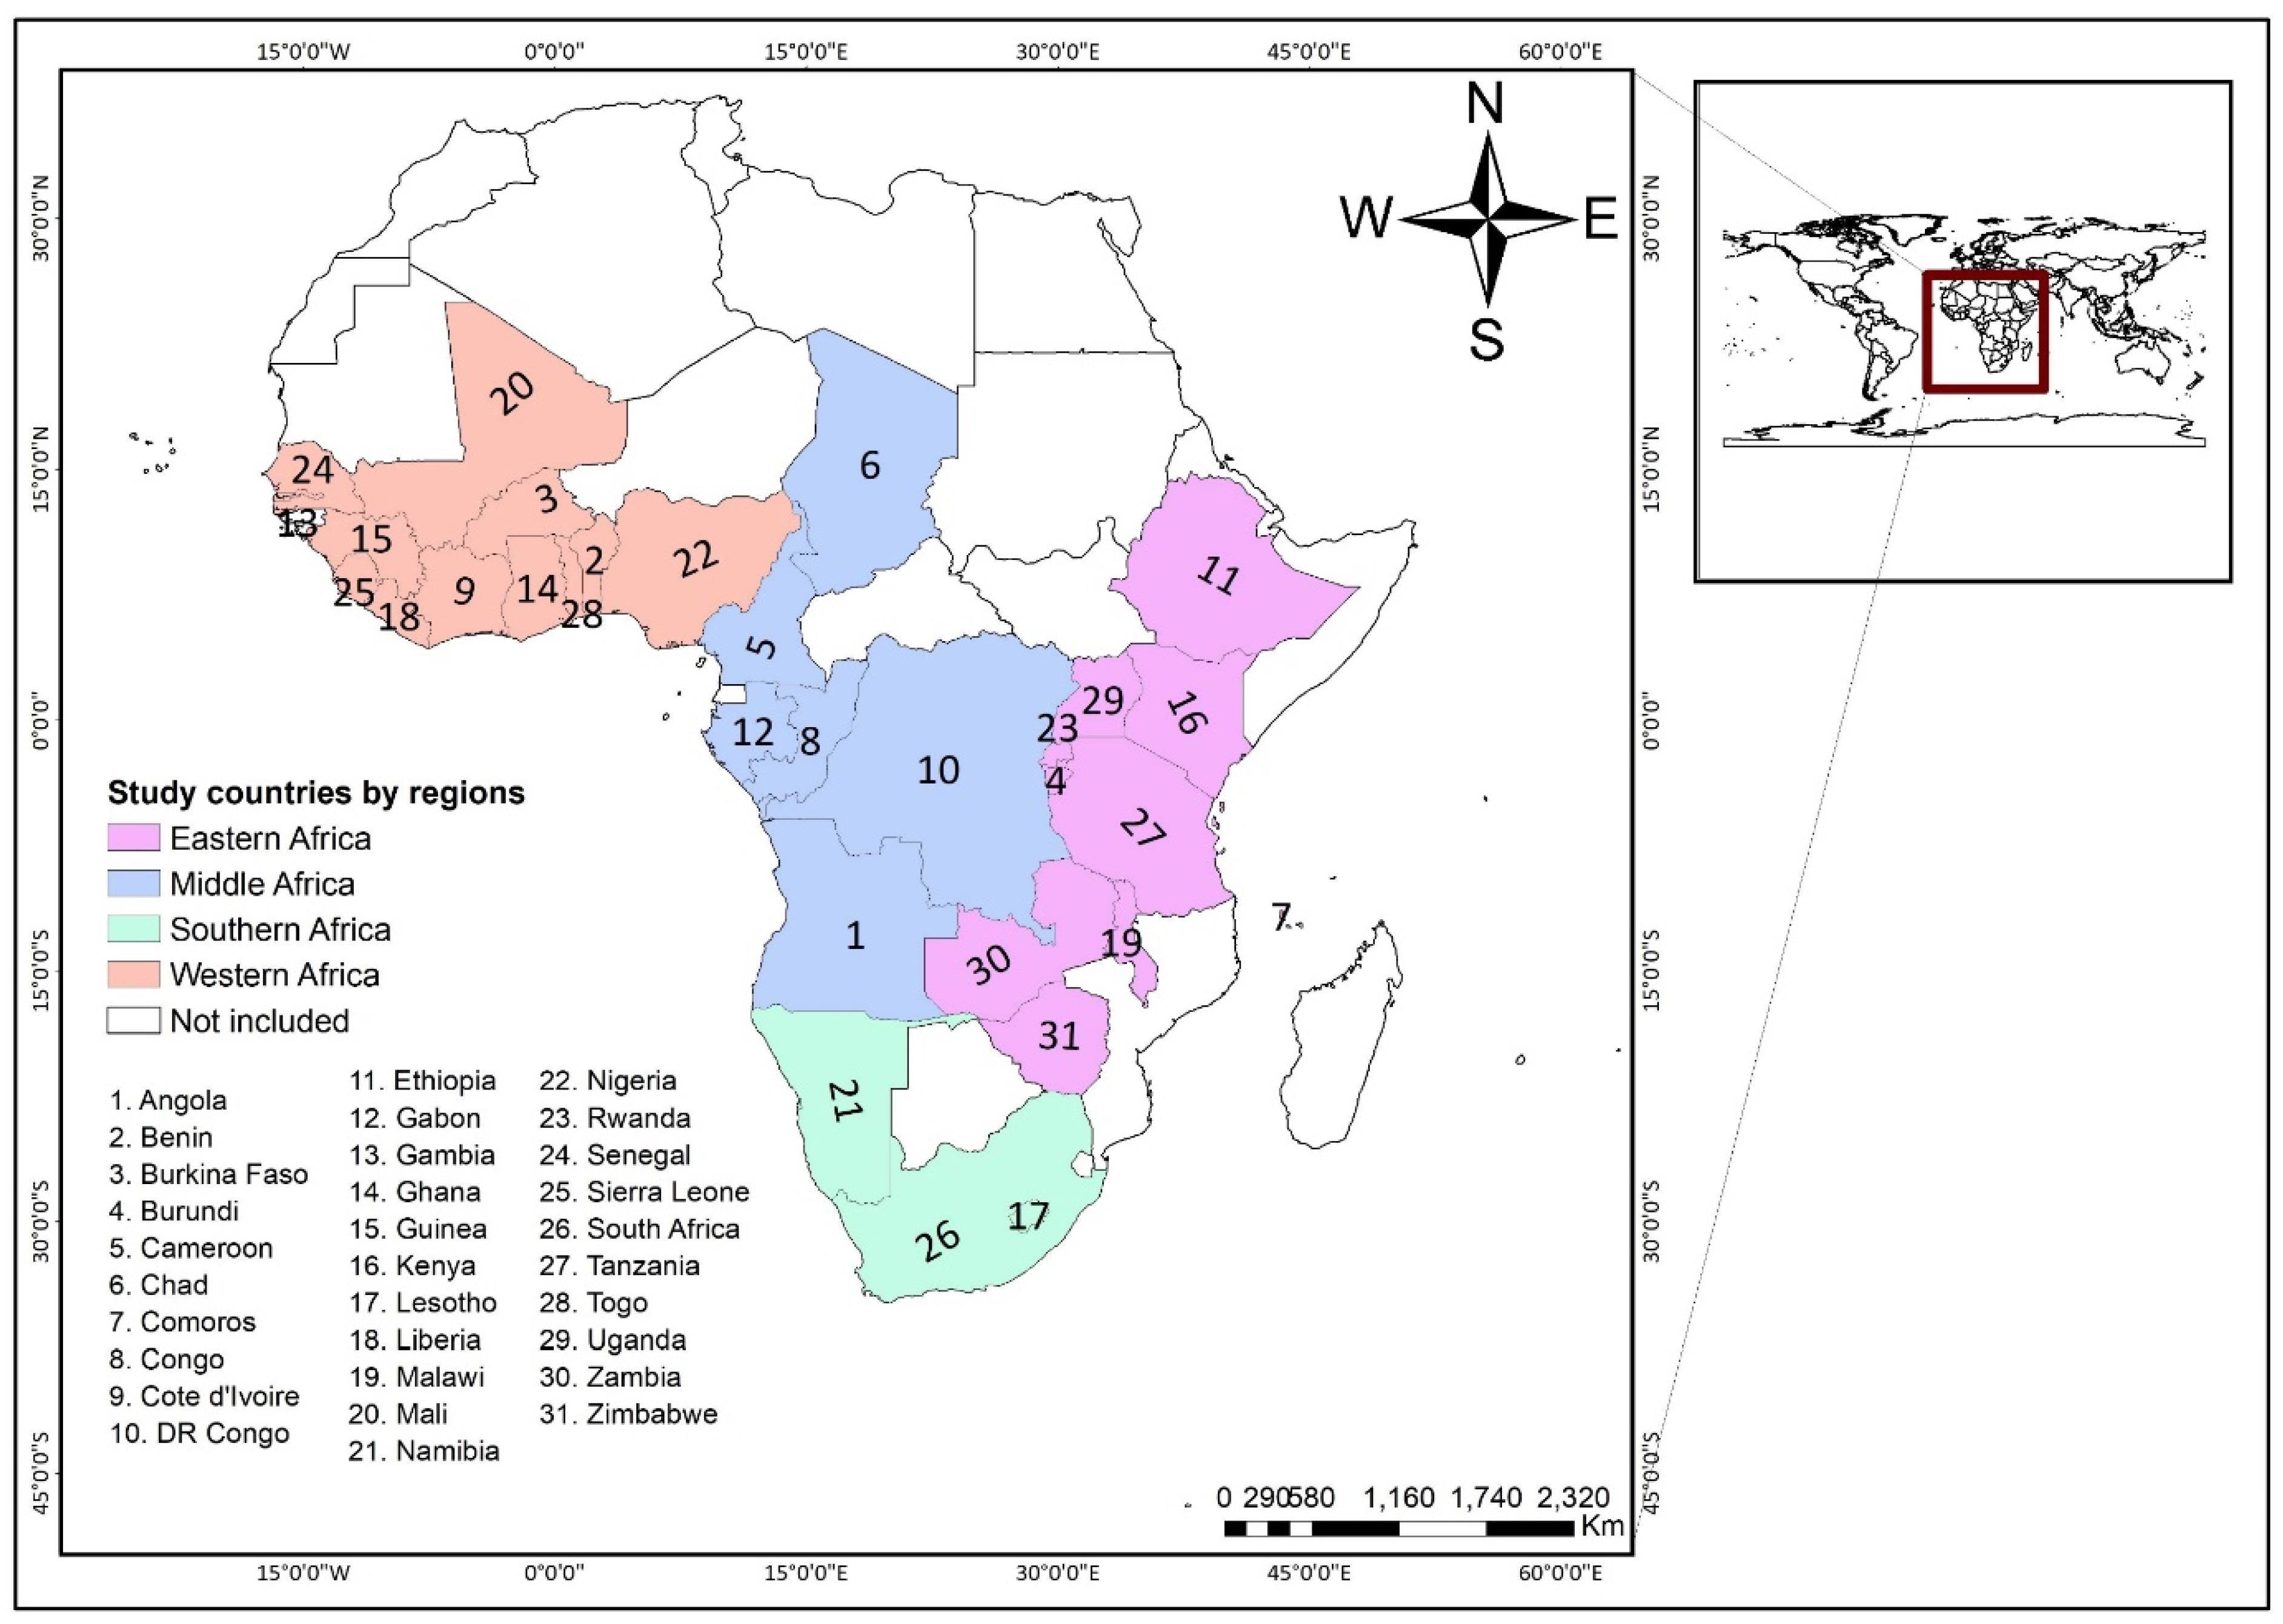
2.1. Data Source

Data for this study were obtained from the Demographic and Health Surveys (DHS) of 31 countries in SSA counducted from 2010 to 2019. The DHS Program has since 1984 assisted in the conduct of over 400 surveys in many low-and middle-income countries around the world. These cross-sectional surveys provide nationally representative household data on various nutrition, population and health indicators in more than 90 countries. Standardized protocols and instruments are employed to gather data of children, women, men and households. For this study, data in the children’s files were pooled from the DHS. The surveys employ a two-stage stratified sampling in selecting participants. The first stage involves the selection of clusters, usually called enumeration areas (EAs), and the second stage consists of the selection of households for the survey. To ensure consistency in data collection across countries, the DHS use a standard questionnaire comparable across countries for data collection, and the questionnaire is often translated into the major local languages of the countries involved. To ensure validity of the translated questionnaires, the DHS reports that the translated questionnaires, together with the version in English, are pretested in English and the local dialect [16,17]. Figure 1 shows the countries included in this study. We followed the Strengthening the Reporting of Observational Studies in Epidemiology’ (STROBE) statement in writing the manuscript. The dataset is freely accessible for download at: https://dhsprogram.com/data/available-datasets.cfm (accessed on 3 February 2021).

2.2. Measures

2.2.1. Outcome Variables

The outcome variables are three child anthropometrics: stunting (height-for-age z-scores); wasting (weight-for-height z-scores); and underweight (weight-for-age z-scores). These variables were defined and coded using the WHO child growth standard which is followed by the DHS program [18]. The coding was done as follows:
  • Stunting: children with height-for-age z-scores below minus 2 (−2.0) standard deviations less than the mean on the WHO Child Growth Standards (moderately or severely stunted) and children with height-for-age z-scores below minus 3 (−3.0) standard deviations less than the mean on the WHO Child Growth Standards (severely stunted) were combined to form the response group “Stunt” while those height-for-age z-scores equal to or higher than minus 2 (−2.0) standard deviations greater than the mean on the WHO Child Growth Standards were regarded as “not a stunt”.
  • Wasting: children with weight-for-height z-scores below minus 2 (−2.0) standard deviations less than the mean on the WHO Child Growth Standards (moderately or severely wasting) and children with weight-for-height z-scores below minus 3 (−3.0) standard deviations less than the mean on the WHO Child Growth Standards (severely wasting) were combined to form the response group “Wasting” while those weight-for-height z-scores equal to or higher than minus 2 (−2.0) standard deviations greater than the mean on the WHO Child Growth Standards were regarded as “No wasting”.
  • Underweight: children with weight-for-age z-scores below minus 2 (−2.0) standard deviations less than the mean on the WHO Child Growth Standards (moderately or severely underweight) and children with weight-for-age z-scores below minus 3 (−3.0) standard deviations less than the mean on the WHO Child Growth Standards (severely underweight) were combined to form the response group “Underweight” while those weight-for-age z-scores equal to or higher than minus 2 (−2.0) standard deviations greater than the mean on the WHO Child Growth Standards were regarded as “Not underweight”. For each of these variables, “age out of plausible limits”, “height out of plausible limits”, missing and “flagged” responses which constituted, 13, 744, 1833 and 3285 respectively were deemed invalid and dropped.

2.2.2. Key Predictor Variable

The main predictor variables used were generated based on literature and potential contextual implications of findings. They were maternal marital status and type of household cooking fuel. The variable “maternal marital status” was coded to produce two responses as follows: never married, widowed and separated/divorced were coded together as “Single” and married and living with a partner as “Married” [9]. For parsimony, theoretical and contextual relevance, the variable “type of household cooking fuel” was also coded into two response categories “Clean” and “Unclean” following previous studies [19,20]. Clean fuels included electricity, liquefied petroleum gas (LPG) and natural gas while charcoal, firewood, grass/straw, dung, shrubs, agricultural crop waste represented unclean cooking fuels [19,20]. The two variables “maternal marital status” and “type of household cooking fuel” were then combined [19,20] to produce the variable “Maternal marital status-Type of cooking fuel” with four (4) mutually exclusive categories: “Single mother-clean” (single mothers living in a household that uses clean cooking fuel), “Single mother-unclean” (single mothers living in households that uses unclean cooking fuel), “Married -clean” (mothers who are married or living with a partner in a household that uses clean cooking fuel” and “Married -unclean” (mothers who are married or living with a partner in a household that uses unclean cooking fuel). To observe the effect of maternal marital status and the type of household cooking fuel on the nutritional status of children under the age of 5 years, married-clean is used as the reference group.

2.2.3. Covariates

In the analysis of the effect of maternal marital status and household cooking fuel type on the nutritional status of children under age 5, three categories/clusters of variables (individual level factors-child and mother’s characteristics, household characteristics, and contextual factors) were considered ascovariates. The selection of these variables was based on their significant associations with CNS in previous studies (6–8). Variables under individual level factorsconsidered include the age of the child (0, 1, 2 and 4); sex of child (female and male); birth order of child (1, 2 to 4, and 5 and above); and perceived size at birth (small, average and large) (see [21]). Other included maternal age (re-coded into two categories “15–19” years and “20–49” years (see [22]); educational attainment (no formal education, primary, secondary and higher); working status (yes and no); antenatal visits during pregnancy (yes, no, and “Don’t know”); postnatal check within 2 months (yes and no); and place of delivery (home, health facility, other). At the household level, relevant variables included wealth status (recode as “poor”, “middle” and “rich”); the age of household head (recoded as ages below 35 years “young adults”, between 35 and 55 years “middle-aged adults” and those above 55 years “old-aged adults”; sex of household head (male and female); access to electricity (yes and no); type of toilet facility (re-coded into “improved” and unimproved”; source of drinking water (re-coded as “improved” and “unimproved” (see [23]); and access to media (yes, no) which was derived from the three variables “access to television”, “radio” and “newspaper/magazine”. The contextual factors considered are Urbanicity (rural and urban) and geographic region. The variable “Country” was re-coded to generate “Geographic region” following the UN’s list of countries and geographic regions in SSA.

2.3. Data Analyses

Stata SE version 14.2 (StataCorp, College Station, TX, USA) was used for statistical analyses of data. Descriptive statistics, including frequencies, percentages (weighted) and 95% confidence intervals (CIs) of percentages at p < 0.05 were used to summarize and present the data in tables. To enhance visualization and appreciation of the distributions of the outcome variables across the study countries, the data was integrated into a GIS environment and presented in map images. This procedure was then followed with a bivariate chi-square test of independence to determine the associations between the outcome variables and each of the key predictor variables and covariates. Collinearity diagnosis tests, including Variance Inflation Factors (VIF), Square VIF, Tolerance and R-squared were conducted for the key predictor variables and covariates. The joint effect of maternal marital status and type of household cooking fuel on CNS was examined using six multilevel regression models for each of the outcome variables (stunting, wasting, and underweight). The first model (Model 0) showed the variance in nutritional status attributed to the clustering of the primary sampling units (PSUs), without the explanatory variables. Model I contained only the key predictor variable (maternal marital status-type of household cooking fuel). Model II and III controlled for the individual and household level factors, respectively, while Model IV controlled for the contextual level factors. The final model (Model V) controlled for all the the individual, household, and contextual level factors. The Stata command “melogit” was used in fitting these models. We used Akaike’s Information Criterion (AIC) tests for Model comparison. All the results were presented using adjusted odds ratios (aOR) at 95% Confidence Interval (CI). To prevent potential challenges of oversampling or under-sampling and clustering of samples emerging from the multi-stage sampling technique used in the data collection, the weighting, cluster and strata variables were used to adjust the effect sizes.

2.4. Ethical Approval

For DHS reports, ethical clearance are sought from the Ethics Committee of ORC Macro Inc. as well as Ethics Boards of partner institutions (e.g., Ministries of Health) of the studied countries. The DHS protocols ensure that standards for the protection of respondents’ privacy and confidentiality are adhered. Inner City Fund International also make sure that the survey conforms with the United States Department of Health and Human Services’ regulations for the respect of human subjects. This study used a secondary data, hence, no further ethical approval was required. The datasets are freely available for download in the public domain. Further information about the DHS data usage and ethical standards is available at http://goo.gl/ny8T6X (accessed on 3 February 2021).

3. Results

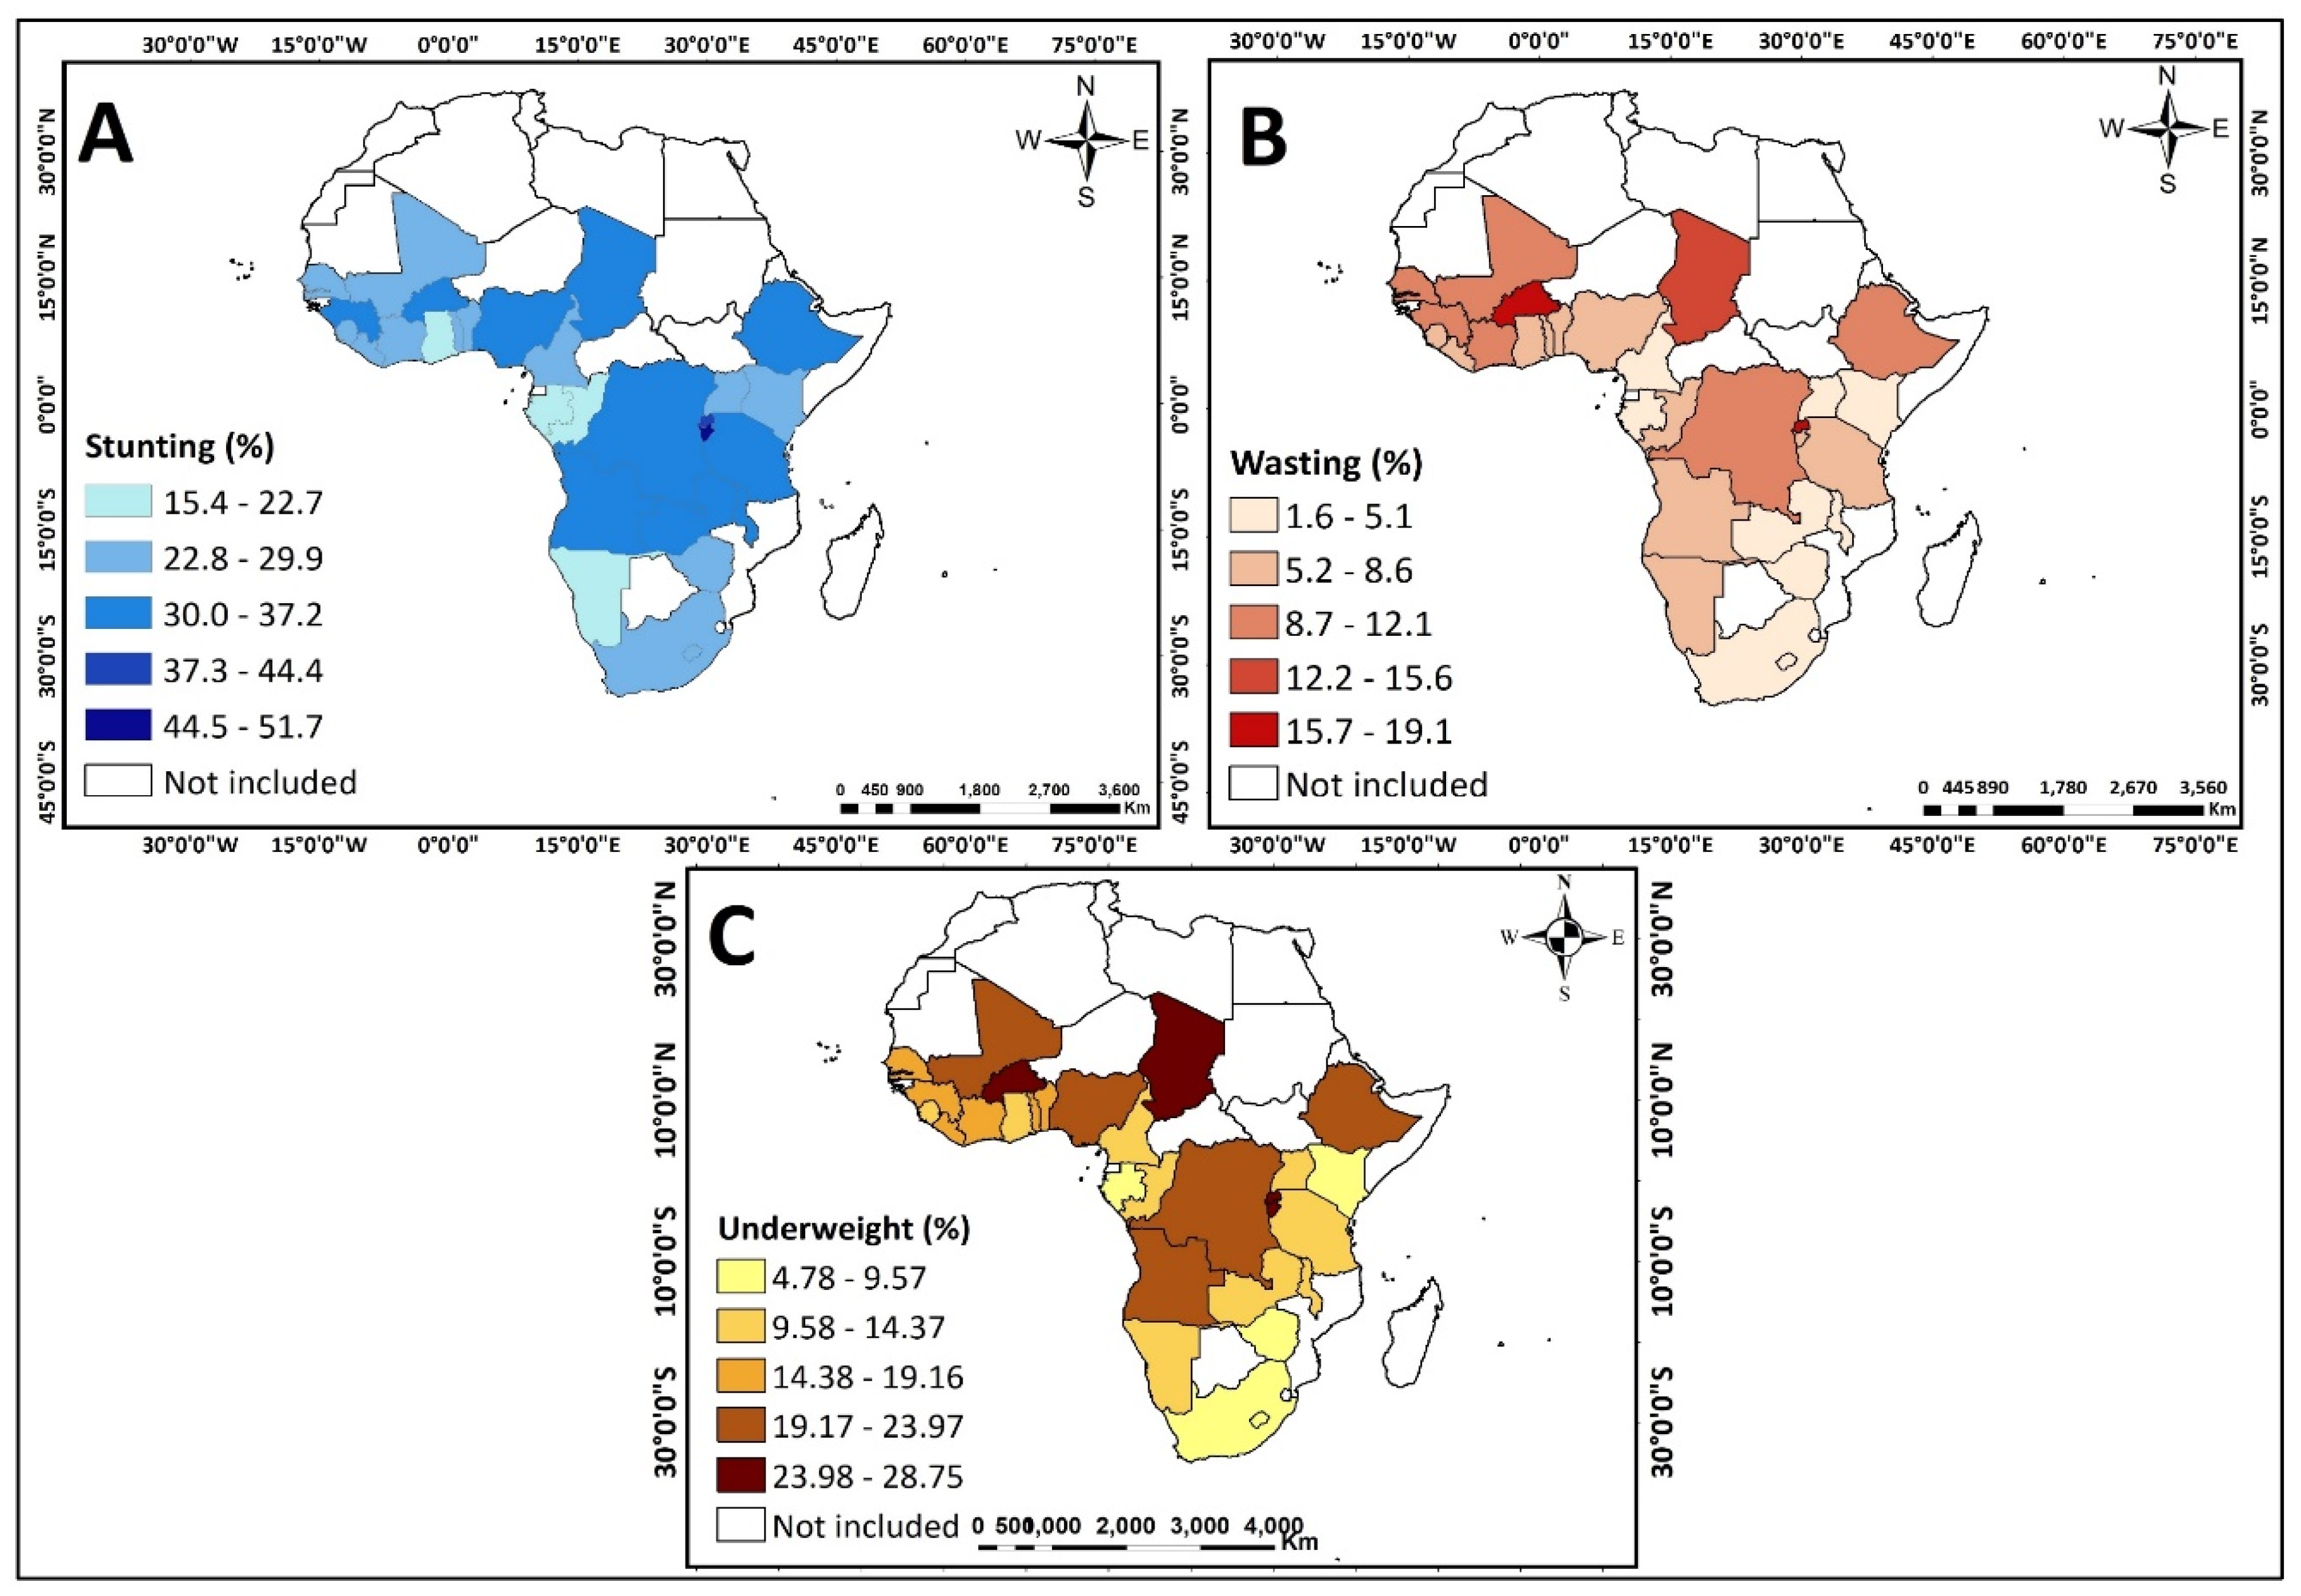
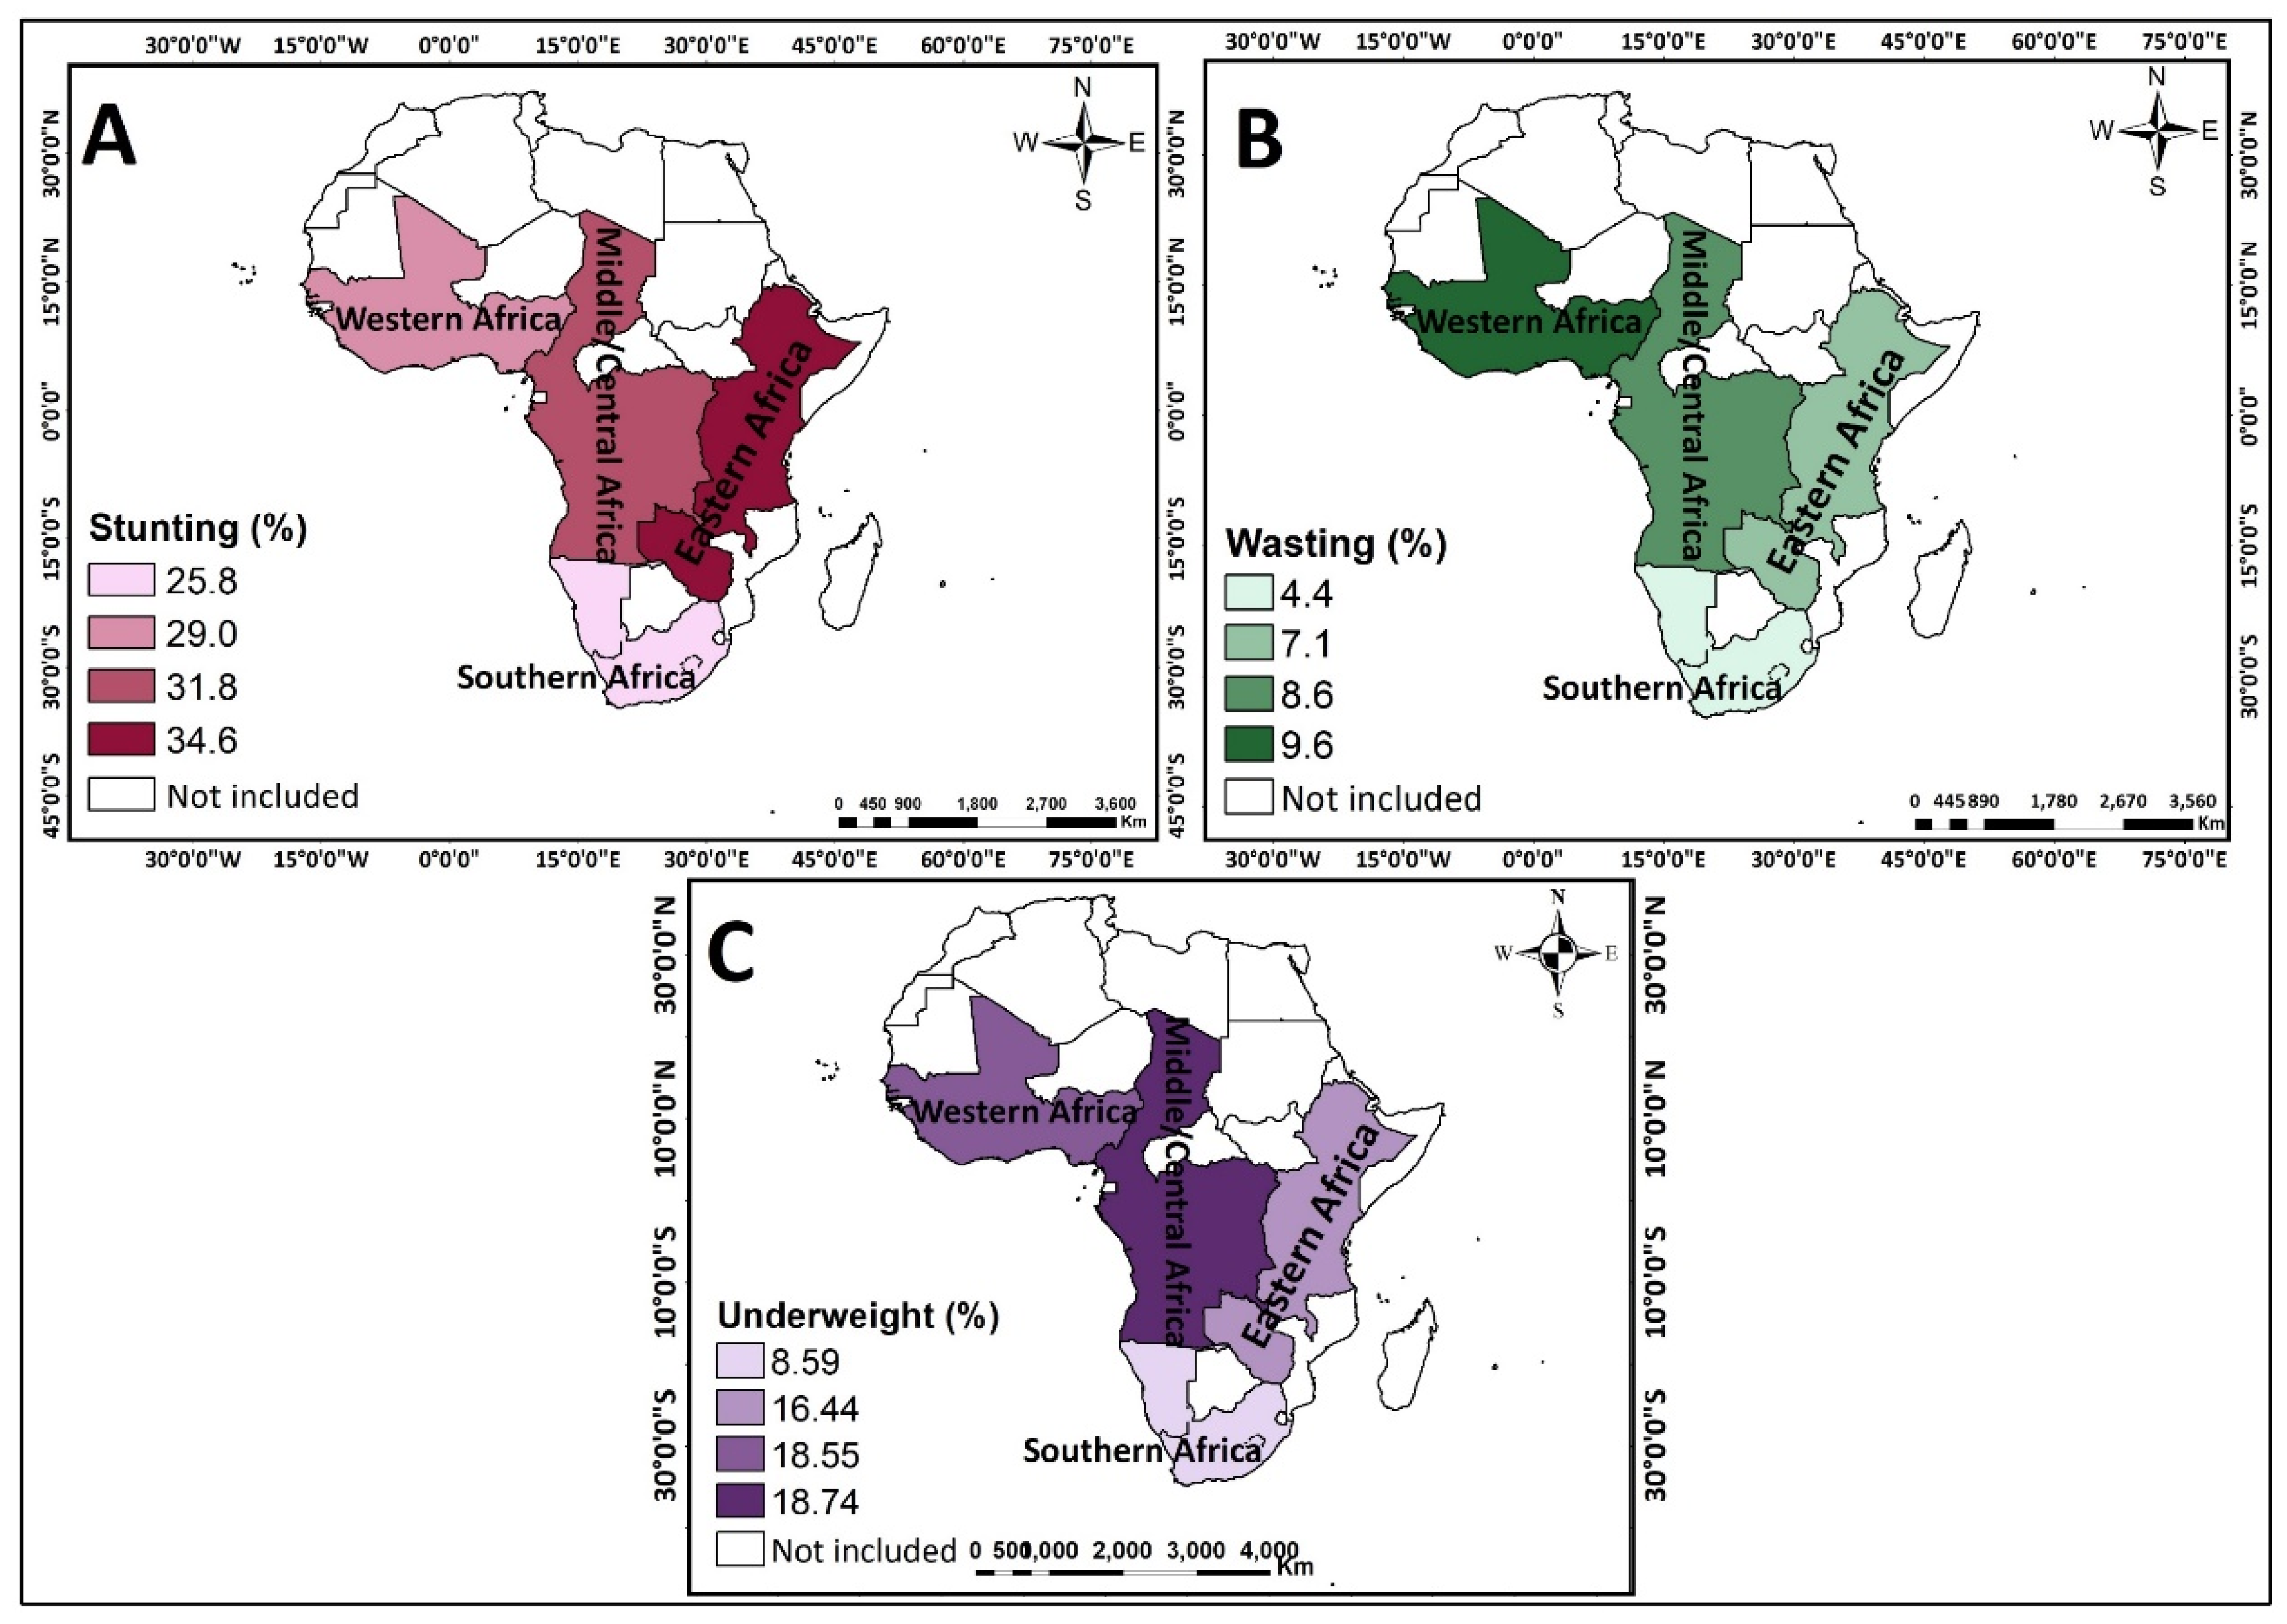
3.1. Descriptive Analysis on the Percentage of Children Who Were Stunted, Wasted and Underweight in the 31 Countries in SSA

The study included 129,646 children under five from 31 sub-Saharan African countries. The percentage of children who were stunted, wasted, and underweight in the 31 countries in SSA considered was 31%, 8% and 17%, respectively (see Table 1).
The prevalence of stunting varied across countries and sub-regions, with the highest prevalence of stunting found in Burundi (44.5%–51.7%), while the lowest prevalence was found in Congo, Gabon, Namibia, and Ghana (15.4%–22.7%) (see Figure 2A). In terms of sub-region, the highest prevalence of wasting was observed in Eastern Africa (34.6%) (see Figure 3A). The prevalence of wasting also varied across countries and sub-regions. The highest prevalence of wasting was found in Burundi, Burkina Faso and Chad (15.7%–19.1%), whereas the lowest prevalence was seen in South Africa, Lesotho, Zimbabwe, Zambia, Malawi, Kenya, Uganda, Rwanda, Gabon, Congo, and Cameroon (1.6%–5.1%) (see Figure 2B). Across sub-regions, wasting was more predominant in Western Africa (9.6%) (see Figure 2B). The highest prevalence of underweight was found in Burundi, Burkina Faso and Chad (24.0%–28.8%) (see Figure 2C) while the lowest prevalence was noted in South Africa, Lesotho, Zimbabwe, Kenya, and Gabon (4.8%–9.6%) (see Figure 2C).
Central/Middle Africa had the highest prevalence of underweight children across sub-regions (18.74%) (see Figure 3C).
In terms of the association between the key predictor variables, covariates and stunting, wasting, and underweight, we found significant associations between all the key predictor variables, covariates and stunting, except thematernal marital status and maternal age. Apart from age of the household head, all the independent variables had significant associations with wasting. With underweight, all the independent variables had significant associations, except the maternal age(see Table 2).

3.2. Multivariate Analysis on the Joint Effect of Single-Motherhood and Unclean Household Cooking Fuel Use on Child Nutritional Status

Table 3, Table 4 and Table 5 show the results from the multilevel logistic regression analysis on the joint effect of maternal marital status and household cooking fuel type on CNS. The last models (Model V) of each table indicate the joint effect of maternal marital status and household cooking fuel type on CNS, while controlling for individual level factors, household characteristics, and contextual factors. On the joint effect of maternal marital status and type of household cooking fuel on stunting, we found that compared to children born to married mothers who use clean household cooking fuel, children born to single mothers who use unclean household cooking fuel (aOR = 1.27; 95% CI = 1.17–1.47), children born to single women who use clean household cooking fuel (aOR = 1.18; 95% CI = 1.05–1.32) and children born to married women who use unclean household cooking (aOR = 1.25; 95% CI = 1.17–1.33) were more likely to be stunted (Table 3, Model V). With wasting, children born to single mothers who used unclean household cooking fuel (aOR = 1.17; 95% CI = 1.03–1.33) and children born to married women who use unclean household cooking fuel (aOR = 1.24; 95% CI = 1.11–1.39) were more likely to be wasted compared to children born to married mothers who used clean household cooking fuel (Table 4, Model V). With underweight, we found that compared to children born to married mothers who use clean household cooking fuel, children born to single mothers who use unclean household cooking fuel (aOR = 1.41; 95% CI = 1.28–1.55), children born to single women who use clean household cooking fuel (aOR = 1.33; 95% CI = 1.14–1.55) and children born to married women who use unclean household cooking (aOR = 1.33; 95% CI = 1.22–1.45) were more likely to be underweight (Table 3, Model V).

4. Discussion

Improving the health status of children has become an important global health issue. International organisations and individual countries have concentrated efforts and strategies to improve child nutritional status [1]. Yet, there are still a substantial proportion of children who are stunted, underweight or wasted [3]. Therefore, this study aimed to examine the joint effect of maternal marital status and household cooking fuel type on CNS in SSA.
The results indicated that there were some significant inter-country variations concerning the nutritional status of children. Consistently, our findings showed that Burundi had the worst children’s nutritional status (stunting, wasting, and underweight). This indicates that the indicators of child nutritional status in Burundi were poorer than those of other countries in SSA. Previous studies have found a high prevalence of stunting, wasting, and underweight among children in Burundi [24,25,26]. Besides Burundi, the prevalence of wasting and underweight was highest in Burkina Faso and Chad. This finding is in line with previous evidence that shows that wasting and underweight are most prevalent in Burkina Faso [27] and Chad [28].
We found that the prevalence of stunting is lowest in Ghana. This finding is consistent with previous outcomes in the country [6]. The identified pattern could be explained by the various strategies adopted by the government of Ghana to alleviate poverty and ensure food security for households to meet the children’s nutritional requirements. Notable among these interventions are the capitation grant and the school feeding programme, as well as the Livelihoods Empowerment Against Poverty Programme (LEAP) [29].
Concerning the joint effect of maternal marital status and type of household cooking fuel use on stunting, we found that compared to children born to married mothers who use clean household cooking fuel, children born to single mothers who use unclean household cooking fuel, single mothers who use clean household cooking fuel, and married mothers who use unclean household cooking fuel were more likely to be stunted. This finding corroborates recent studies (e.g., [30]) that the likelihood of childhood stunting among children living in households using unclean cooking fuel was significantly higher than those living in households using clean cooking fuel. For example, Balietti and [31] found increased odds of stunting among children whose household used unclean cooking fuel. Unclean cooking fuel coupled with poor ventilation increases household air pollution (HAP), which exacerbates the likelihood of stunting among children [32]. These result in respiratory infections that lead to the activation of the immune system to fight off disease-causing agents and consume metabolic energy, which will no longer be available for other functions of the metabolism. Child growth can be impaired, leading to stunting [33]. The association between use of unclean cooking fuel and stunting could also be explained from the perspective that, during pregnancy, mothers who used biofuel in the form of wood and dung have a higher risk of delivering small-for-gestational-age infants, with this outcome persisting during the growth of the child, and later causing stunting [34]. As found in this study, the use of unclean household cooking fuel influences stunting, together with single motherhood. Hence, children borrn to single mothers are also more likely to be stunted, irrespective of the type of household cooking fuel used by their mothers. The findings on the association between single motherhood and stunting is supported by previous studies [35,36,37].
Other findings also showed that children born to single mothers who used unclean household cooking fuel, single mothers who use clean household cooking fuel and married mothers who use unclean household cooking fuel were more likely to be underweight compared to children born to married mothers who used clean household cooking fuel. Thus, being a child born to a single mother who uses unclean household cooking fuel, a married mother who use unclean household cooking fuel and single mother who uses a clean household cooking fuel increases your likelihood of being underweight [12,13,14]. Generally, single mothers face substantial socio-economic stress and hardship in many parts of SSA [38]. These challenges limit the capacity of single mothers to provide quality child care for their children compared to married women [39]. As such, single mothers usually find it difficult to juggle between work and providing the nutritional needs of their children, hence, the higher likelihood of underweight among children born to single mothered households. The result is further supported by [40] which shows that the use of clean cooking fuel significantly reduces childhood underweight and mortality by 14–31%.
We also found that, compared to children born to married mothers who use clean household cooking fuel, those born to single and married mothers who use unclean household cooking fuel are more likely to be wasted. Hence, the use of unclean household fuel has significant effect on childhood stunting, irrespective of marital status. Similar finfings are evidenced in prior studies [12,41]. The effect of unclean cooking fuel and wasting could be attributed to the higher likelihood of delivering small-for-gestational-age infants among mothers who use unclean household cooking fuel, as this later can cause wasting [34].

4.1. Strength and Limitations

The study has several strengths. First, the use of a valid survey and rigorous statistical methods emphasise the trustworthiness and robustness of our findings. Additonally, the use of nationally representative data ensures that our findings are generalizable and replicable in the studied 31 sub-Saharan African countries. Moreover, current findings contribute to bridging the gaps in child nutrition literature which previous studies did not consider. Notwithstanding these strengths, the study has some limitations. Therefore, interpretations and inferences made from our findings must be considered in light of these limitations.
First, childhood nutritional status, maternal marital status and use of unclean cooking fuel interact in a complex system in SSA influenced by cultural beliefs. However, because the study relied on secondary data, the analysis was limited to only variables that were in the datasets. Further, the DHS employs cross-sectional designs, hence causal effects cannot be ascribed to the noted outcomes. However, only associative effects can be ascribed to the noted outcomes. The key predictor variables were self-reported by the mothers, and therefore, responses given are subject to recall biases and other social desirability concerns. Relatedly, self-reported cooking fuel type is only a crude proxy for exposure to household air pollution and, therefore, may not completely capture the relationship between exposure to particulate matter or carbon monoxide and health outcomes. Finally, the pooling of the data may be affected by heterogeneity across countries or regions.

4.2. Practical Implications

Practically, these findings demonstrate the need to invest in clean household cooking fuel. It is imperative for the governments of the 31 sub-Saharan African countries to double their efforts to end the use of unclean household cooking fuel. This could be achieved by going beyond just increasing access and affordability of clean cooking fuels (e.g., electricity, gas, ethanol, solar) by promoting their use through effective health education and health promotion programmes. Findings also draw the attention of policymakers to the urgent need for CNS policies and programmes (e.g., dietary supplementation, increasing dietary diversity, improving agriculture and food security) to be targeted towards at-risk sub-populations (i.e., single mothered households). Given the sub-regional variations noted in the current study, appropriate context-specific interventions are required to address household cooking fuel challenges and issues related to stunting, wasting and underweight among children in the studied 31 sub-Saharan African countries.

5. Conclusions

The current study sought to examine the joint effect of maternal marital status and household cooking fuel type on child nutritional status in SSA. We found that maternal marital status and household cooking fuel type have a joint effect on childhood stunting, wasting and underweight. Future studies could explore the cultural dimension to this association between being a single mother, the use of unclean cooking fuel, and child nutritional status in SSA. Undertaking such studies would be instrumental in informing appropriate culturally sensitive strategies that can effectively improve CNS in SSA.

Author Contributions

I.A. and B.O.A. developed the study concept. I.A. and E.D. performed the data analysis. A.-A.S., E.D., J.O., J.E.H.J., T.H. and B.O.A. drafted and revised the manuscript critically for its intellectual content. All authors have read and agreed to the published version of the manuscript.

Funding

The authors sincerely thank Bielefeld University, Germany for providing financial support through the Institutional Open Access Publication Fund for the article processing charge.

Institutional Review Board Statement

The study was conducted using data provided by the Demographic and Health Surveys (DHS) Program. The DHS Program uses protocols reviewed and approved by the ICF Institutional Review Board (IRB). Also, IRB’s in host countries review contry-specific DHS survey protocols to ensure they comply with local laws on inclusion of minors and as well as adults in its surveys.

Informed Consent Statement

The DHS Program seeks written consent from all individuals aged 18 years and above. For those aged below 18 years, written consent is obtained from parent(s) or guardian(s) before inclusion in the study.

Data Availability Statement

The dataset is available on the following website: http://goo.gl/ny8T6X (accessed on 3 February 2021).

Acknowledgments

We acknowledge the DHS Program for making the data sets freely accessible upon request.

Conflicts of Interest

The authors declare no conflict of interest.

References

  1. Remans, R.; Flynn, D.F.B.; Declerck, F.; Diru, W.; Fanzo, J.; Gaynor, K.; Lambrecht, I.; Mudiope, J.; Mutuo, P.K.; Nkhoma, P.; et al. Assessing nutritional diversity of cropping systems in African villages. PLoS ONE 2011, 6, e21235. [Google Scholar] [CrossRef] [Green Version]
  2. Ntoimo, L.F.C.; Odimegwu, C.O. Health effects of single motherhood on children in sub-Saharan Africa: A cross-sectional study. BMC Public Health 2014, 14, 1145. [Google Scholar] [CrossRef] [Green Version]
  3. UNICEF. Briefing Note Series on SDG Global Indicators Related to Children. 2018. Available online: File:///C:/Users/iddri/AppData/Local/Temp/SDG-briefing-note-1_introduction.pdf (accessed on 6 March 2021).
  4. De Onis, M.; Blössner, M.; Borghi, E. Prevalence and trends of stunting among pre-school children, 1990–2020. Public Health Nutr. 2012, 15, 142–148. [Google Scholar] [CrossRef] [Green Version]
  5. Devlin, K. Stunting limits learning and future earnings of children. World J. 2012, 40, 26. [Google Scholar]
  6. Darteh, E.K.M.; Acquah, E.; Kumi-Kyereme, A. Correlates of stunting among children in Ghana. BMC Public Health 2014, 14, 504. [Google Scholar] [CrossRef] [PubMed] [Green Version]
  7. Goudet, S.M.; Kimani-Murage, E.W.; Wekesah, F.; Wanjohi, M.; Griffiths, P.L.; Bogin, B.; Madise, N.J. How does poverty affect children’s nutritional status in Nairobi slums? A qualitative study of the root causes of undernutrition. Public Health Nutr. 2016, 20, 608–619. [Google Scholar] [CrossRef] [Green Version]
  8. Saaka, M.; Wemakor, A.; Abizari, A.-R.; Aryee, P.A. How well do WHO complementary feeding indicators relate to nutritional status of children aged 6–23 months in rural Northern Ghana? BMC Public Health 2015, 15, 1–12. [Google Scholar] [CrossRef] [Green Version]
  9. Clark, S.; Hamplová, D. Single motherhood and child mortality in sub-Saharan Africa: A life course perspective. Demography 2013, 50, 1521–1549. [Google Scholar] [CrossRef] [PubMed]
  10. Odimegwu, C.; Somefun, O.D.; De Wet, N. Contextual determinants of family dissolution in sub-Saharan Africa. Dev. S. Afr. 2017, 34, 721–737. [Google Scholar] [CrossRef]
  11. Owili, P.O.; Muga, M.A.; Pan, W.-C.; Kuo, H.-W. Cooking fuel and risk of under-five mortality in 23 Sub-Saharan African countries: A population-based study. Int. J. Environ. Health Res. 2017, 27, 191–204. [Google Scholar] [CrossRef] [PubMed] [Green Version]
  12. Obasohan, P.E.; Walters, S.J.; Jacques, R.; Khatab, K. Risk factors associated with malnutrition among children under-five years in sub-Saharan African countries: A scoping review. Int. J. Environ. Res. Public Health 2020, 17, 8782. [Google Scholar] [CrossRef]
  13. Wali, N.; Agho, K.E.; Renzaho, A.M. factors associated with stunting among children under 5 years in five South Asian countries (2014–2018): Analysis of demographic health surveys. Nutrients 2020, 12, 3875. [Google Scholar] [CrossRef]
  14. Tanwi, T.S.; Chakrabarty, S.; Hasanuzzaman, S. Double burden of malnutrition among ever-married women in Bangladesh: A pooled analysis. BMC Womens Health 2019, 19, 1–8. [Google Scholar] [CrossRef]
  15. Ezeh, O.K.; Agho, K.E.; Dibley, M.J.; Hall, J.J.; Page, A.N. The effect of solid fuel use on childhood mortality in Nigeria: Evidence from the 2013 cross-sectional household survey. Environ. Health 2014, 13, 1–10. [Google Scholar] [CrossRef] [Green Version]
  16. Corsi, D.J.; Neuman, M.; E Finlay, J.; Subramanian, S.V. Demographic and health surveys: A profile. Int. J. Epidemiol. 2012, 41, 1602–1613. [Google Scholar] [CrossRef]
  17. Rutstein, S.O.; Rojas, G. Guide to DHS Statistics; ORC Macro: Calverton, MD, USA, 2006; Volume 38. [Google Scholar]
  18. DHS. Guide to DHS Statistics DHS-7: Nutritional Status. 2021. Available online: https://dhsprogram.com/data/Guide-to-DHS-Statistics/Nutritional_Status.htm (accessed on 11 March 2021).
  19. Armah, F.A.; Ekumah, B.; Yawson, D.O.; Odoi, J.O.; Afitiri, A.-R.; Nyieku, F.E. Predictive probabilities of access to clean cooking: Evidence from the demographic and health surveys in 31 countries in sub-Saharan Africa. Environ. Justice 2019, 12, 118–131. [Google Scholar] [CrossRef] [Green Version]
  20. Amegah, A.K.; Boachie, J.; Näyhä, S.; Jaakkola, J.J.K. Association of biomass fuel use with reduced body weight of adult Ghanaian women. J. Expo. Sci. Environ. Epidemiol. 2020, 30, 670–679. [Google Scholar] [CrossRef] [PubMed]
  21. Yaya, S.; Uthman, O.A.; Ekholuenetale, M.; Bishwajit, G.; Adjiwanou, V. Effects of birth spacing on adverse childhood health outcomes: Evidence from 34 countries in sub-Saharan Africa. J. Matern. Neonatal Med. 2019, 33, 1–8. [Google Scholar] [CrossRef] [PubMed] [Green Version]
  22. Amare, Z.Y.; Ahmed, M.E.; Mehari, A.B. Determinants of nutritional status among children under age 5 in Ethiopia: Further analysis of the 2016 Ethiopia demographic and health survey. Glob. Health 2019, 15, 1–11. [Google Scholar] [CrossRef] [PubMed] [Green Version]
  23. Armah, F.A.; Ekumah, B.; Yawson, D.O.; Odoi, J.O.; Afitiri, A.-R.; Nyieku, F.E. Access to improved water and sanitation in sub-Saharan Africa in a quarter century. Heliyon 2018, 4, e00931. [Google Scholar] [CrossRef] [Green Version]
  24. Odjidja, E.N.; Christensen, C.; Gatasi, G.; Hakizimana, S.; Murorunkwere, H.; Masabo, J.-B.; Meguid, T. 2030 Countdown to combating malnutrition in Burundi: Comparison of proactive approaches for case detection and enrolment into treatment. Int. Health 2020. [Google Scholar] [CrossRef] [Green Version]
  25. Nkurunziza, S.; Meessen, B.; Van Geertruyden, J.-P.; Korachais, C. Determinants of stunting and severe stunting among Burundian children aged 6-23 months: Evidence from a national cross-sectional household survey, 2014. BMC Pediatr. 2017, 17, 1–14. [Google Scholar] [CrossRef] [PubMed] [Green Version]
  26. Akombi, B.J.; Agho, K.E.; Merom, D.; Renzaho, A.M.; Hall, J.J. Child malnutrition in sub-Saharan Africa: A meta-analysis of demographic and health surveys (2006–2016). PLoS ONE 2017, 12, e0177338. [Google Scholar] [CrossRef] [PubMed] [Green Version]
  27. Daboné, C.; Delisle, H.F.; Receveur, O. Poor nutritional status of schoolchildren in urban and peri-urban areas of Ouagadougou (Burkina Faso). Nutr. J. 2011, 10, 34. [Google Scholar] [CrossRef] [Green Version]
  28. Ekholuenetale, M.; Tudeme, G.; Onikan, A.; Ekholuenetale, C.E. Socioeconomic inequalities in hidden hunger, undernutrition, and overweight among under-five children in 35 sub-Saharan Africa countries. J. Egypt. Public Health Assoc. 2020, 95, 1–15. [Google Scholar] [CrossRef] [Green Version]
  29. United Nations. The Millennium Development Goals Report; United Nations: New York, NY, USA, 2015. [Google Scholar]
  30. Islam, S.; Rana, J.; Mohanty, S.K. Cooking, smoking, and stunting: Effects of household air pollution sources on childhood growth in India. Indoor Air 2021, 31, 229–249. [Google Scholar] [CrossRef]
  31. Balietti, A.; Datta, S. The Impact of Indoor Solid Fuel Use on the Stunting of Indian Children. 2017. Available online: http://www.ancabalietti.net/wp-content/uploads/2017/04/Datta_Balietti_March2017.pdf (accessed on 3 March 2021).
  32. Upadhyay, A.K.; Singh, A.; Kumar, K.; Singh, A. Impact of indoor air pollution from the use of solid fuels on the incidence of life threatening respiratory illnesses in children in India. BMC Public Health 2015, 15, 1–9. [Google Scholar] [CrossRef] [PubMed] [Green Version]
  33. Schlaudecker, E.P.; Steinhoff, M.C.; Moore, S.R. Interactions of diarrhea, pneumonia, and malnutrition in childhood: Recent evidence from developing countries. Curr. Opin. Infect. Dis. 2011, 24, 496. [Google Scholar] [CrossRef]
  34. Tielsch, J.M.; Katz, J.; Thulasiraj, R.D.; Coles, C.L.; Sheeladevi, S.; Yanik, E.L.; Rahmathullah, L. Exposure to indoor biomass fuel and tobacco smoke and risk of adverse reproductive outcomes, mortality, respiratory morbidity and growth among newborn infants in south India. Int. J. Epidemiol. 2009, 38, 1351–1363. [Google Scholar] [CrossRef] [PubMed] [Green Version]
  35. Dearden, K.; Crookston, B.; Madanat, H.; West, J.; Penny, M.; Cueto, S. What difference can fathers make? Early paternal absence compromises Peruvian children’s growth. Matern. Child Nutr. 2011, 9, 143–154. [Google Scholar] [CrossRef] [PubMed]
  36. Bronte-Tinkew, J.; DeJong, G. Children’s nutrition in Jamaica: Do household structure and household economic resources matter? Soc. Sci. Med. 2004, 58, 499–514. [Google Scholar] [CrossRef]
  37. Gurmu, E.; Etana, D. Household structure and children’s nutritional status in Ethiopia. Genus 2013, 69, 113–130. [Google Scholar]
  38. Izugbara, C. Single motherhood and neonatal and infant mortality in Sierra Leone, Burkina Faso and Burundi. Public Health 2016, 135, 122–130. [Google Scholar] [CrossRef] [PubMed] [Green Version]
  39. Hertz, R.; Mattes, J.; Shook, A. When paid work invades the family: Single mothers in the COVID-19 pandemic. J. Fam. Issues 2020. [Google Scholar] [CrossRef]
  40. Gakidou, E.; Oza, S.; Fuertes, C.V.; Li, A.Y.; Lee, D.K.; Sousa, A.; Hogan, M.C.; Vander Hoorn, S.; Ezzati, M. Improving child survival through environmental and nutritional interventions: The importance of targeting interventions toward the poor. J. Am. Med. Assoc. 2007, 298, 1876–1887. [Google Scholar] [CrossRef] [Green Version]
  41. Odo, D.B.; Yang, I.A.; Knibbs, L.D. A systematic review and appraisal of epidemiological studies on household fuel use and its health effects using demographic and health surveys. Int. J. Environ. Res. Public Health 2021, 18, 1411. [Google Scholar] [CrossRef] [PubMed]
Figure 1. Map showing the 31 sub-Saharan African Countries.
Nutrients 13 01541 g001
Figure 2. Maps showing the prevalence of stunting, wasting and underweight from 2010 to 2019 DHS across the 31 Sub-Saharan African Countries. (A) Stunting (%) (B) Wasting (%) (C) Underweight (%).
Nutrients 13 01541 g002
Figure 3. Maps showing the prevalence of stunting, wasting and undernutrition from 2010 to 2019 DHS across the 31 Sub-Saharan African Countries. (A) Stunting (%) (B) Wasting (%) (C) Underweight (%).
Nutrients 13 01541 g003
Table 1. Distribution of study variables from 2010 to 2019 DHS data of 31 sub-Saharan African countries.
VariableWeighted
N
Weighted %VariableWeighted
N
Weighted %
Key outcome variables Household characteristics
Stunting40,45331Wealth status
Wasting10,7708Poor54,73442
Underweight22,50317Middle26,26220
Rich48,65038
Key predictor variable Age of household head
Maternal marital status Young-adults55,80343
Single14,07111Middle-aged adults56,74844
Married26452Old-aged adults17,09413
Type of cooking fuel102,19279Sex of household head
Clean
Unclean
10,7258Male103,25480
Child characteristics Female26,39220
Age Access to electricity
039,90631No89,36469
136,82828Yes40,27231
226,21420Type of toilet facility
316,12812Improved55,24743
410,5718Unimproved74,37557
Sex Source of drinking water
Male65,44250Improved85,10366
Female64,20450Unimproved44,53134
Birth order Type of cooking fuel
125,42120Unclean116,26390
2 to 462,42648Clean13,36910
5 and above41,79932Access to media (tv/radio/newspaper)
Perceived size at birth No45,68435
Large43,85534Yes83,96265
Average64,36050Contextual factors
Small21,42217Urbanicity
Weight at birth Urban43,41233
Underweight71806Rural86,23467
Normal72,08956Country
Not taken50,37739Angola73846
Stunting Benin15,85712
Severely/moderately stunting40,45431Burkina Faso89087
No stunting89,19269Burundi41743
Wasting Cameroon29362
Severely/moderately wasting10,7708Chad61145
No wasting118,87692Comoros15231
Underweight Congo26202
Not underweight107,136.9983Cote d’Ivoire21902
Underweight22,503.3317DR Congo48424
Mother’s characteristics Ethiopia65855
Maternal marital status Gabon19982
single 16,71813Gambia7461
Married112,92887Ghana19081
Maternal Age Guinea22912
15–1992307Kenya60825
20–49120,41693Lesotho10181
Educational attainment Liberia20352
No education54,15042Malawi40353
Primary40,33931Mali57854
Secondary31,07124Namibia11551
Higher40863Nigeria75026
Working status Rwanda44243
No46,03436Senegal19892
Yes83,50564Siera Leone30522
Antenatal visits during pregnancy South Africa8771
No13,71111Tanzania60885
Yes113,76588Togo22272
Dont’ know21532Uganda29002
Postnatal check within 2 months Zambia64025
No75,89359Zimbabwe40003
Yes53,75341Geographic region
Place of delivery Western Africa54,48942
Home40,30031Eastern Africa42,21333
Health facility87,84668Central Africa25,89420
Other14941South Africa70515
Total129,646
Table 2. Association between stunting, wasting and underweight and characteristics of a child, mother and household, and contextual factors from 2010 to 2019 DHS across the 31 Sub-Saharan African Countries.
Independent Variables Stunting (Weighted %)95% CIp-ValueWasting (Weighted %)95% CIp-ValueUnderweight (Weighted %)95% CIp-Value
Key predictor variables
Maternal marital status 0.382 <0.001 <0.001
Single31.330.5–32.0 6.46.0–6.7 15.515.0–16.1
Married31.230.9–31.58.68.4–8.8 17.617.4–17.9
Type of cooking fuel <0.001 <0.001 <0.001
Unclean32.632.4–32.9 8.78.5–8.9 18.318.1–18.5
Clean18.818.1–18.4 5.04.6–5.3 98.5–9.5
Child characteristics
Age of child <0.001 <0.001 <0.001
016.816.4–17.2 11.110.8–11.4 13.5613.2–13.0
136.335.8–36.89.79.4–10.019.9719.6–20.4
243.542.9–44.16.25.9–6.520.5920.1–21.1
337.236.438.04.34.0–4.616.8416.3–17.4
428.227.3–29.04.44.0–4.815.3514.7–16.1
Sex of child <0.001 <0.001 <0.001
Male34.033.6–34.4 9.28.9–9.4 18.8418.5–19.1
Female28.328.0–28.77.57.2–7.715.8515.6–16.1
Birth order <0.001 <0.001 <0.001
129.528.9–30.0 7.57.2–7.8 15.2314.8–15.7
2 to 430.029.4–30.17.97.7–8.216.1515.9–16.4
5 and above34.433.9–34.89.39.1–9.620.4520.0–20.8
Perceived size at birth <0.001 <0.001 <0.001
Large26.726.3–27.1 6.46.2–6.6 12.9312.6–13.2
Average31.431.0–31.88.38.1–8.517.0216.7–17.3
Small39.839.1–40.412.211.7–12.627.4526.9–28.0
Mother’s characteristics
Maternal age 0.604 <0.001 0.189
15–1931.030.0–31.9 9.69.0–10.2 17.6816.9–18.5
20–4931.231.0–31.58.28.1–8.417.3317.1–17.5
Educational attainment <0.001 <0.001 <0.001
No education36.636.2–37.0 11.511.3–11.8 24.0223.7–24.3
Primary32.632.1–33.06.46.2–6.715.114.8–15.5
Secondary22.622.2–23.15.65.3–5.910.199.9–10.5
Higher10.910.0–11.94.64.0–5.35.815.1–6.6
Working status 0.017 <0.001 <0.001
No30.830.3–31.2 9.69.4–9.9 18.1617.8–18.5
Yes31.431.1–31.87.67.4–7.716.9116.7–17.3
Antenatal visits during pregnancy <0.001 <0.001 <0.001
No41.741.0–42.6 12.512.0–13.1 28.4227.7–29.2
Yes30.029.8–30.37.87.7–8.016.115.9–16.3
Dont’know26.324.4–28.27.66.5–8.813.0711.7–14.6
Postnatal check within 2 months <0.001 0.748 <0.001
No33.032.6–33.3 8.38.1–8.5 18.5418.3–18.8
Yes28.728.3–29.18.48.1–8.615.6915.4–16.0
Place of delivery <0.001 <0.001 <0.001
Home38.538.1–39.0 11.211.0–11.5 24.924.5–25.3
Health facility27.827.5–28.17.06.8–7.113.8713.6–14.1
Other34.832.4–37.37.56.2–9.019.2617.3–21.4
Household characteristics
Wealth status <0.001 <0.001 <0.001
Poor37.236.8–37.6 9.49.1–9.6 21.2820.9–21.6
Middle32.632.0–33.28.27.9–8.617.817.3–18.3
Rich23.723.4–24.17.26.9–7.412.7112.4–13.0
Age of household head 0.680 0.791 <0.001
Young-adults31.531.1–32.0 8.27.9–8.4 16.816.5–17.1
Middle-aged adults30.930.5–31.38.58.2–8.717.8317.5–18.1
Old-aged adults31.130.4–31.88.37.9–8.717.6117.0–18.2
Sex of household head <0.05 <0.001 <0.001
Male31.431.1–31.7 8.78.5–8.9 17.7817.5–18.0
Female30.530.0–31.06.96.6–7.315.7215.3–16.2
Access to electricity <0.001 <0.001 <0.001
No35.335.0–35.6 9.29.0–9.4 20.0119.7–20.3
Yes22.121.7–22.56.36.0–6.511.4711.1–11.8
Type of toilet facility <0.001 <0.001 <0.001
Improved26.826.4–27.2 6.46.2–6.6 13.0712.8–13.3
Unimproved34.534.1–34.89.79.5–9.920.5420.3–20.8
Source of drinking water <0.001 <0.05 <0.001
Improved30.129.8–30.4 8.28.0–8.4 16.6416.4–16.9
Unimproved33.432.9–33.88.58.3–8.818.7218.4–19.1
Access to media (tv/radio/newspaper) <0.001 <0.001 <0.001
No37.937.4–38.3 10.09.7–10.2 22.4322.0–22.8
Yes27.627.3–27.97.47.2–7.614.614.4–14.8
Contextual factors
Urbanicity <0.001 <0.001 <0.001
Urban23.623.2–24.0 6.66.3–6.8 12.1211.8–12.4
Rural35.034.7–35.49.29.0–9.42019.7–20.3
Geographic region <0.001 <0.001 <0.001
Western Africa29.028.6–29.4 9.69.4–9.8 18.5518.2–18.9
Eastern Africa34.634.1–35.07.16.9–7.416.4416.1–16.8
Central Africa31.831.3–32.48.68.3–8.918.7418.3–19.2
South Africa25.824.7–26.84.43.9–4.98.598.0–9.3
Table 3. Multilevel logistic regression results on joint effect of maternal marital status and type of household cooking fuel on childhood stunting from 2010 to 2019 DHS across the 31 Sub-Saharan African Countries.
Key Predictor VariableModel 0Model I Model IIModel IIIModel IVModel V
OR (95% CI)aOR (95% CI)aOR (95% CI)aOR (95% CI)aOR (95% CI)
Fixed effects
Maternal marital status-Cooking fuel
Married-clean 11111
Single unclean 2.22 *** (2.08–2.36)1.65 *** (1.54–1.77)1.49 *** (1.39–1.60)1.83 *** (1.71–1.95)1.27 *** (1.17–1.47)
Single clean 1.25 *** (1.12–1.39)1.21 *** (1.08–1.36)1.22 *** (1.09–1.36)1.23 *** (1.10–1.37)1.18 * (1.05–1.32)
Married-unclean 2.25 *** (2.03–2.26)1.49 *** (1.41–1.59)0.04 *** (1.32–1.48)1.76 *** (1.66–1.87)1.25 *** (1.17–1.33)
Random effects
PSU Variance (95% CI)0.02 (0.18–0.03)0.02 (0.02–0.3)0.02 (0.02–0.03)0.02 (0.01–0.03)0.02 (0.01–0.03)0.02 (0.01–0.03)
ICC0.0070.0070.0060.0060.0060.006
LR Test161.74 ***141.62 ***111.82 ***118.11 ***121.89 ***105.02 ***
Wild χ2Reference864.24 ***10,324.15 ***2958.64 ***2061.47 ***11,264.12 ***
Model fitness
Log-likelihood−81,022.8−80,532.1−74,861.3−79,409.4−79,911.5−74,213.7
AIC162,049.6161,074.3149,770.6158,846.9159,841148,501.4
Number of clusters160816081608160816081608
* p < 0.05; *** p < 0.001; Model 0: Empty model with no independent variables; Model I: Joint effect of maternal marital status and household cooking fuel type on stunting; Model II: Included individual level characteristics (age of child in years, sex of child, birth order and perceived size of child at birth, maternal age, educational attainment, working status, antenatal visits during pregnancy, postnatal check within 2 months and place of delivery) as covariates; Model III: Included household characteristics (wealth status, age of household head, sex of household head, access to electricity, type of toilet facility, source of drinking water and access to media) as covariates; Model IV: Included contextual factors (urbanicity and geographic region) as covariates; Model V: Included individual, household and contextual level characteristics as covariates Exponentiated coefficients; 95% confidence intervals in brackets; cOR: crude odds ratios; aOR adjusted odds ratios; CI Confidence Interval; 1 = Reference category; PSU = Primary Sampling Unit; ICC = Intra-Class Correlation; LR Test = Likelihood ratio Test; AIC = Akaike’s Information Criterion.
Table 4. Multilevel logistic regression results on joint effect of maternal marital status and type of household cooking fuel on childhood wasting from 2010 to 2019 DHS across the 31 Sub-Saharan African Countries.
Key Predictor VariableModel 0Model IModel IIModel IIIModel IVModel V
OR (95% CI)aOR (95% CI)aOR (95% CI)aOR (95% CI)aOR (95% CI)
Fixed effects
Maternal marital status-Cooking fuel
Married-clean 11111
Single unclean 1.46 *** (1.30–1.63)1.23 ** (1.09–1.39)1.12 (0.99–1.27)1.32 *** (1.17–1.49)1.17 * (1.03–1.33)
Single clean 0.92 (0.74–1.14)0.91 (0.73–1.13)0.94 (0.75–1.17)0.97 (0.78–1.20)0.97 (0.78–1.21)
Married-unclean 1.98 *** (1.80–2.19)1.35 *** (1.22–1.50)1.45 *** (1.30–1.61)1.69 *** (1.54–1.88)1.24 *** (1.11–1.39)
Random effects
PSU Variance (95% CI)0.04 (0.03–0.06)0.4 (0.03–0.06)0.04 (0.03–0.05)0.04 (0.03–0.05)0.04 (0.03–0.5)0.04 (0.03–0.5)
ICC0.0120.0130.0120.0120.0130.012
LR Test84.12 ***86.79 ***78.58 ***82.1 ***86.54 ***77.54 ***
Wild χ2Reference302.86 ***3430.13 ***813.45 ***633.06 ***3623.65 ***
Model fitness
Log-likelihood−37,598.7−37,423.4−35,695.6−37,145.5−37,243.6−35,562.1
AIC75,201.4274,856.8271,439.2774,319.0374,505.2271,198.25
Number of clusters160816081608160816081608
* p < 0.05; ** p < 0.01; *** p < 0.001; Model 0: Empty model with no independent variables; Model I: Joint effect of maternal marital status and household cooking fuel type on wasting; Model II: Included individual level characteristics (age of child in years, sex of child, birth order and perceived size of child at birth, maternal age, educational attainment, working status, antenatal visits during pregnancy, postnatal check within 2 months and place of delivery) as covariates; Model III: Included household characteristics (wealth status, age of household head, sex of household head, access to electricity, type of toilet facility, source of drinking water and access to media) as covariates; Model IV: Included contextual factors (urbanicity and geographic region) as covariates; Model V: Included individual, household and contextual level characteristics as covariates; Exponentiated coefficients; 95% confidence intervals in brackets; cOR: crude odds ratios; aOR adjusted odds ratios; CI Confidence Interval; 1 = Reference category; PSU = Primary Sampling Unit; ICC = Intra-Class Correlation; LR Test = Likelihood ratio Test; AIC = Akaike’s Information Criterion.
Table 5. Multilevel logistic regression results on joint effect of maternal marital status and type of household cooking fuel on childhood underweight from 2010 to 2019 DHS across the 31 Sub-Saharan African Countries.
Key Predictor VariableModel 0Model IModel IIModel IIIModel IVModel V
OR (95% CI)aOR (95% CI)aOR (95% CI)aOR (95% CI)aOR (95% CI)
Fixed effects
Marital status-Cooking fuel
Married-clean 11111
Single unclean 2.26 *** (2.08–2.47)1.62 *** (1.48–1.77)1.46 *** (1.32–1.60)1.87 *** (1.71–2.04)1.41 *** (1.28–1.55)
Single clean 1.21 *** (1.13–1.52)1.28 * (1.10–1.50)1.29 * (1.11–1.50)1.38 *** (1.19–1.61)1.33 *** (1.14–1.55)
Married-unclean 2.60 *** (2.41–2.80)1.56 *** (1.44–1.69)1.61 *** (1.48–1.74)2.01 *** (1.86–2.18)1.33 *** (1.22–1.45)
Random effects
PSU Variance (95% CI)0.03 (0.02–0.04)0.03 (0.02–0.04)0.02 (0.02–0.03)0.03 (0.02–0.03)0.03 (0.02–0.04)0.02 (0.02–0.03)
ICC0.0090.0090.0070.0080.0080.007
LR Test124.1 ***118.46 ***76.82 ***101.51 ***115.42 ***80.61 ***
Wild χ2Reference707.76 ***6725.19 ***2423.9 ***1821.05 ***7154.32 ***
Model fitness
Log-likelihood−60,841.6−60,404.4−57,078.2−59,474.5−59,780.2−56,749.8
AIC121,687.2120,818.7114,204.4118,977119,578.4113,573.6
Number of clusters160816081608160816081608
* p < 0.05; *** p < 0.001; Model 0: Empty model with no independent variables; Model I: Joint effect of maternal marital status and household cooking fuel type on underweight; Model II: Included individual level characteristics (age of child in years, sex of child, birth order and perceived size of child at birth, maternal age, educational attainment, working status, antenatal visits during pregnancy, postnatal check within 2 months and place of delivery) as covariates; Model III: Included household characteristics (wealth status, age of household head, sex of household head, access to electricity, type of toilet facility, source of drinking water and access to media) as covariates; Model IV: Included contextual factors (urbanicity and geographic region) as covariates; Model V: Included individual, household and contextual level characteristics as covariates; Exponentiated coefficients; 95% confidence intervals in brackets; cOR: crude odds ratios; aOR adjusted odds ratios; CI Confidence Interval; 1 = Reference category; PSU = Primary Sampling Unit; ICC = Intra-Class Correlation; LR Test = Likelihood ratio Test; AIC = Akaike’s Information Criterion.
Publisher’s Note: MDPI stays neutral with regard to jurisdictional claims in published maps and institutional affiliations.

