
Consumption of Sweet Beverages and Cancer Risk. A Systematic Review and Meta-Analysis of Observational Studies


 , ,
, , 
Abstract
1. Introduction
2. Materials and Methods
2.1. Search Method for Identification of Studies
2.2. Eligibility Criteria and Data Extraction
2.3. Quality Assessment of Included Studies
2.4. Data Synthesis and Statistical Analysis
3. Results
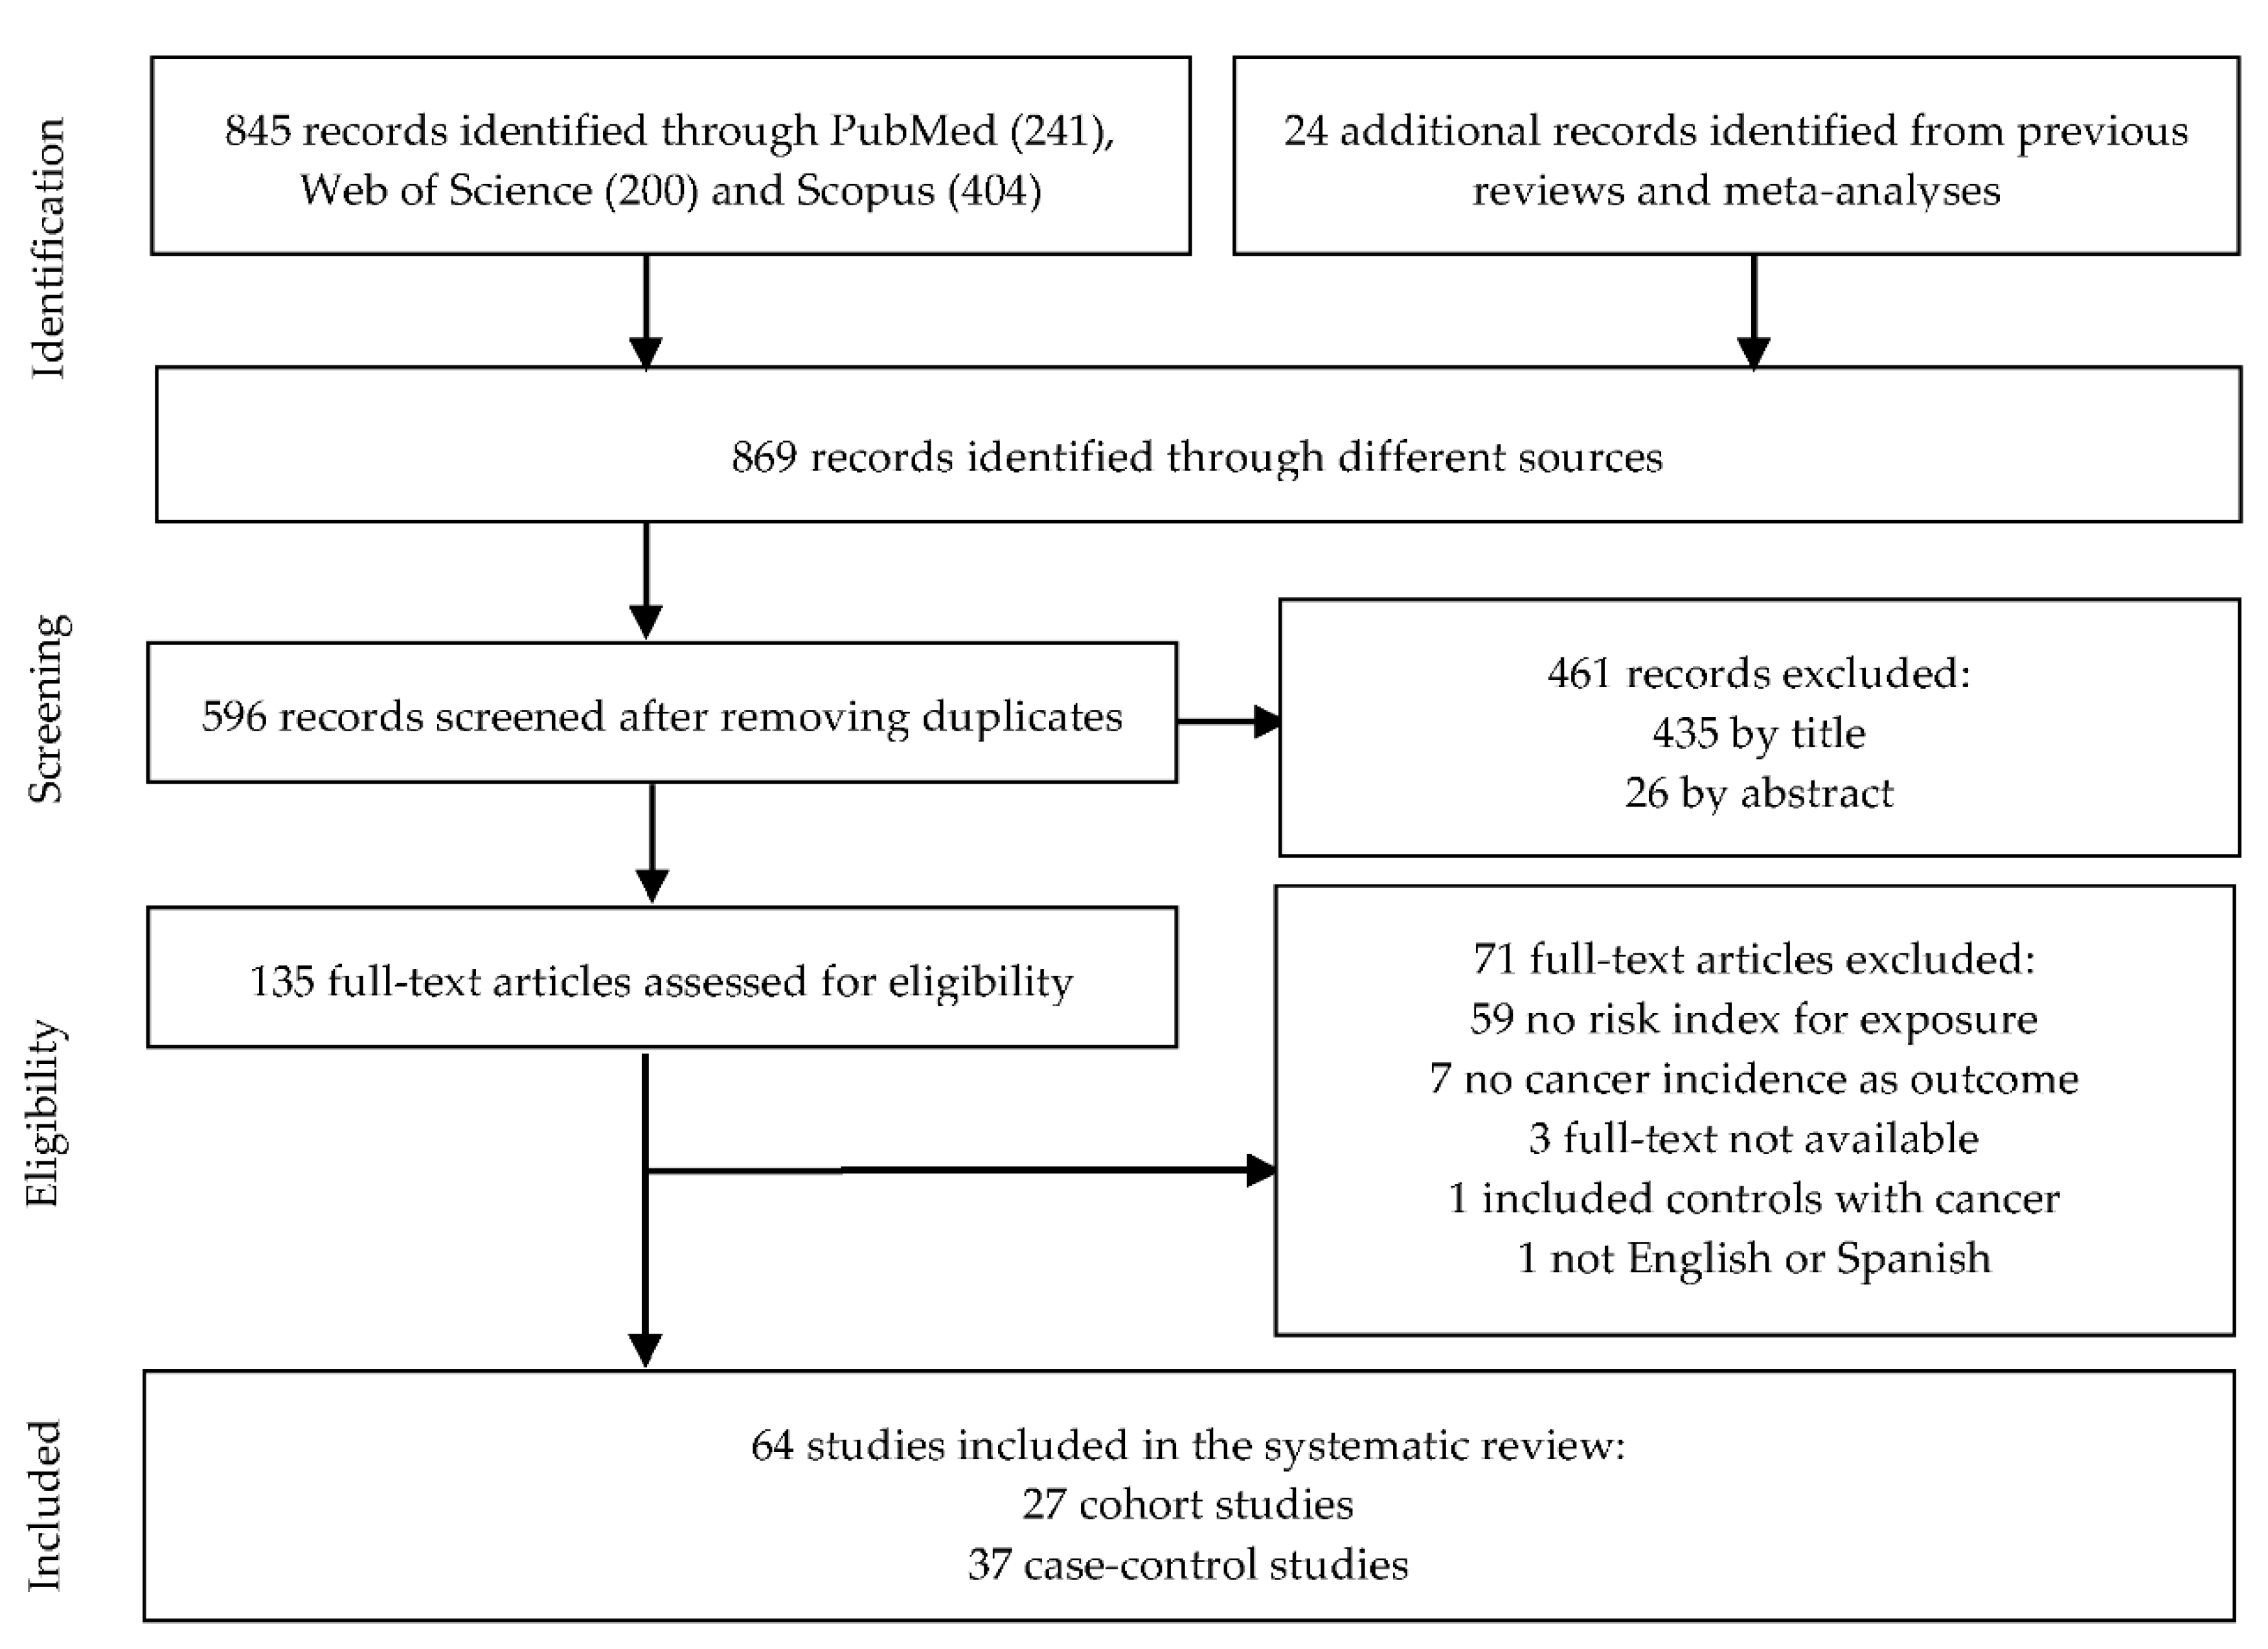
3.1. Literature Search and Study Characteristics
3.2. Sweet Beverages and Risk of Breast Cancer
3.2.1. Sweet Beverages and Risk of Pre-Menopausal Breast Cancer
3.2.2. Sweet Beverages and Risk of Post-Menopausal Breast Cancer
3.3. Sweet Beverages and Risk of Intestinal and Colorectal Cancer
3.4. Sweet Beverages and Risk of Esophageal Cancer
3.5. Sweet Beverages and Risk of Gastric Cancer
3.6. Sweet Beverages and Risk of Pancreatic Cancer
3.7. Sweet Beverages and Risk of Genitourinary Cancer
3.7.1. Bladder
3.7.2. Prostate
3.7.3. Renal and Urothelial Cell Cancer
3.8. Sweet Beverages and Risk of Gynecological Cancers
3.9. Sweet Beverages and Risk of Hepatobiliary Cancers
3.10. Sweet Beverages and Risk of Hematologic Cancers
3.11. Sweet Beverages and Risk of Upper Aerodigestive Cancers
3.12. Sweet Beverages and Risk of Other Cancers
3.13. Sweet Beverages and Risk of Overall Cancer
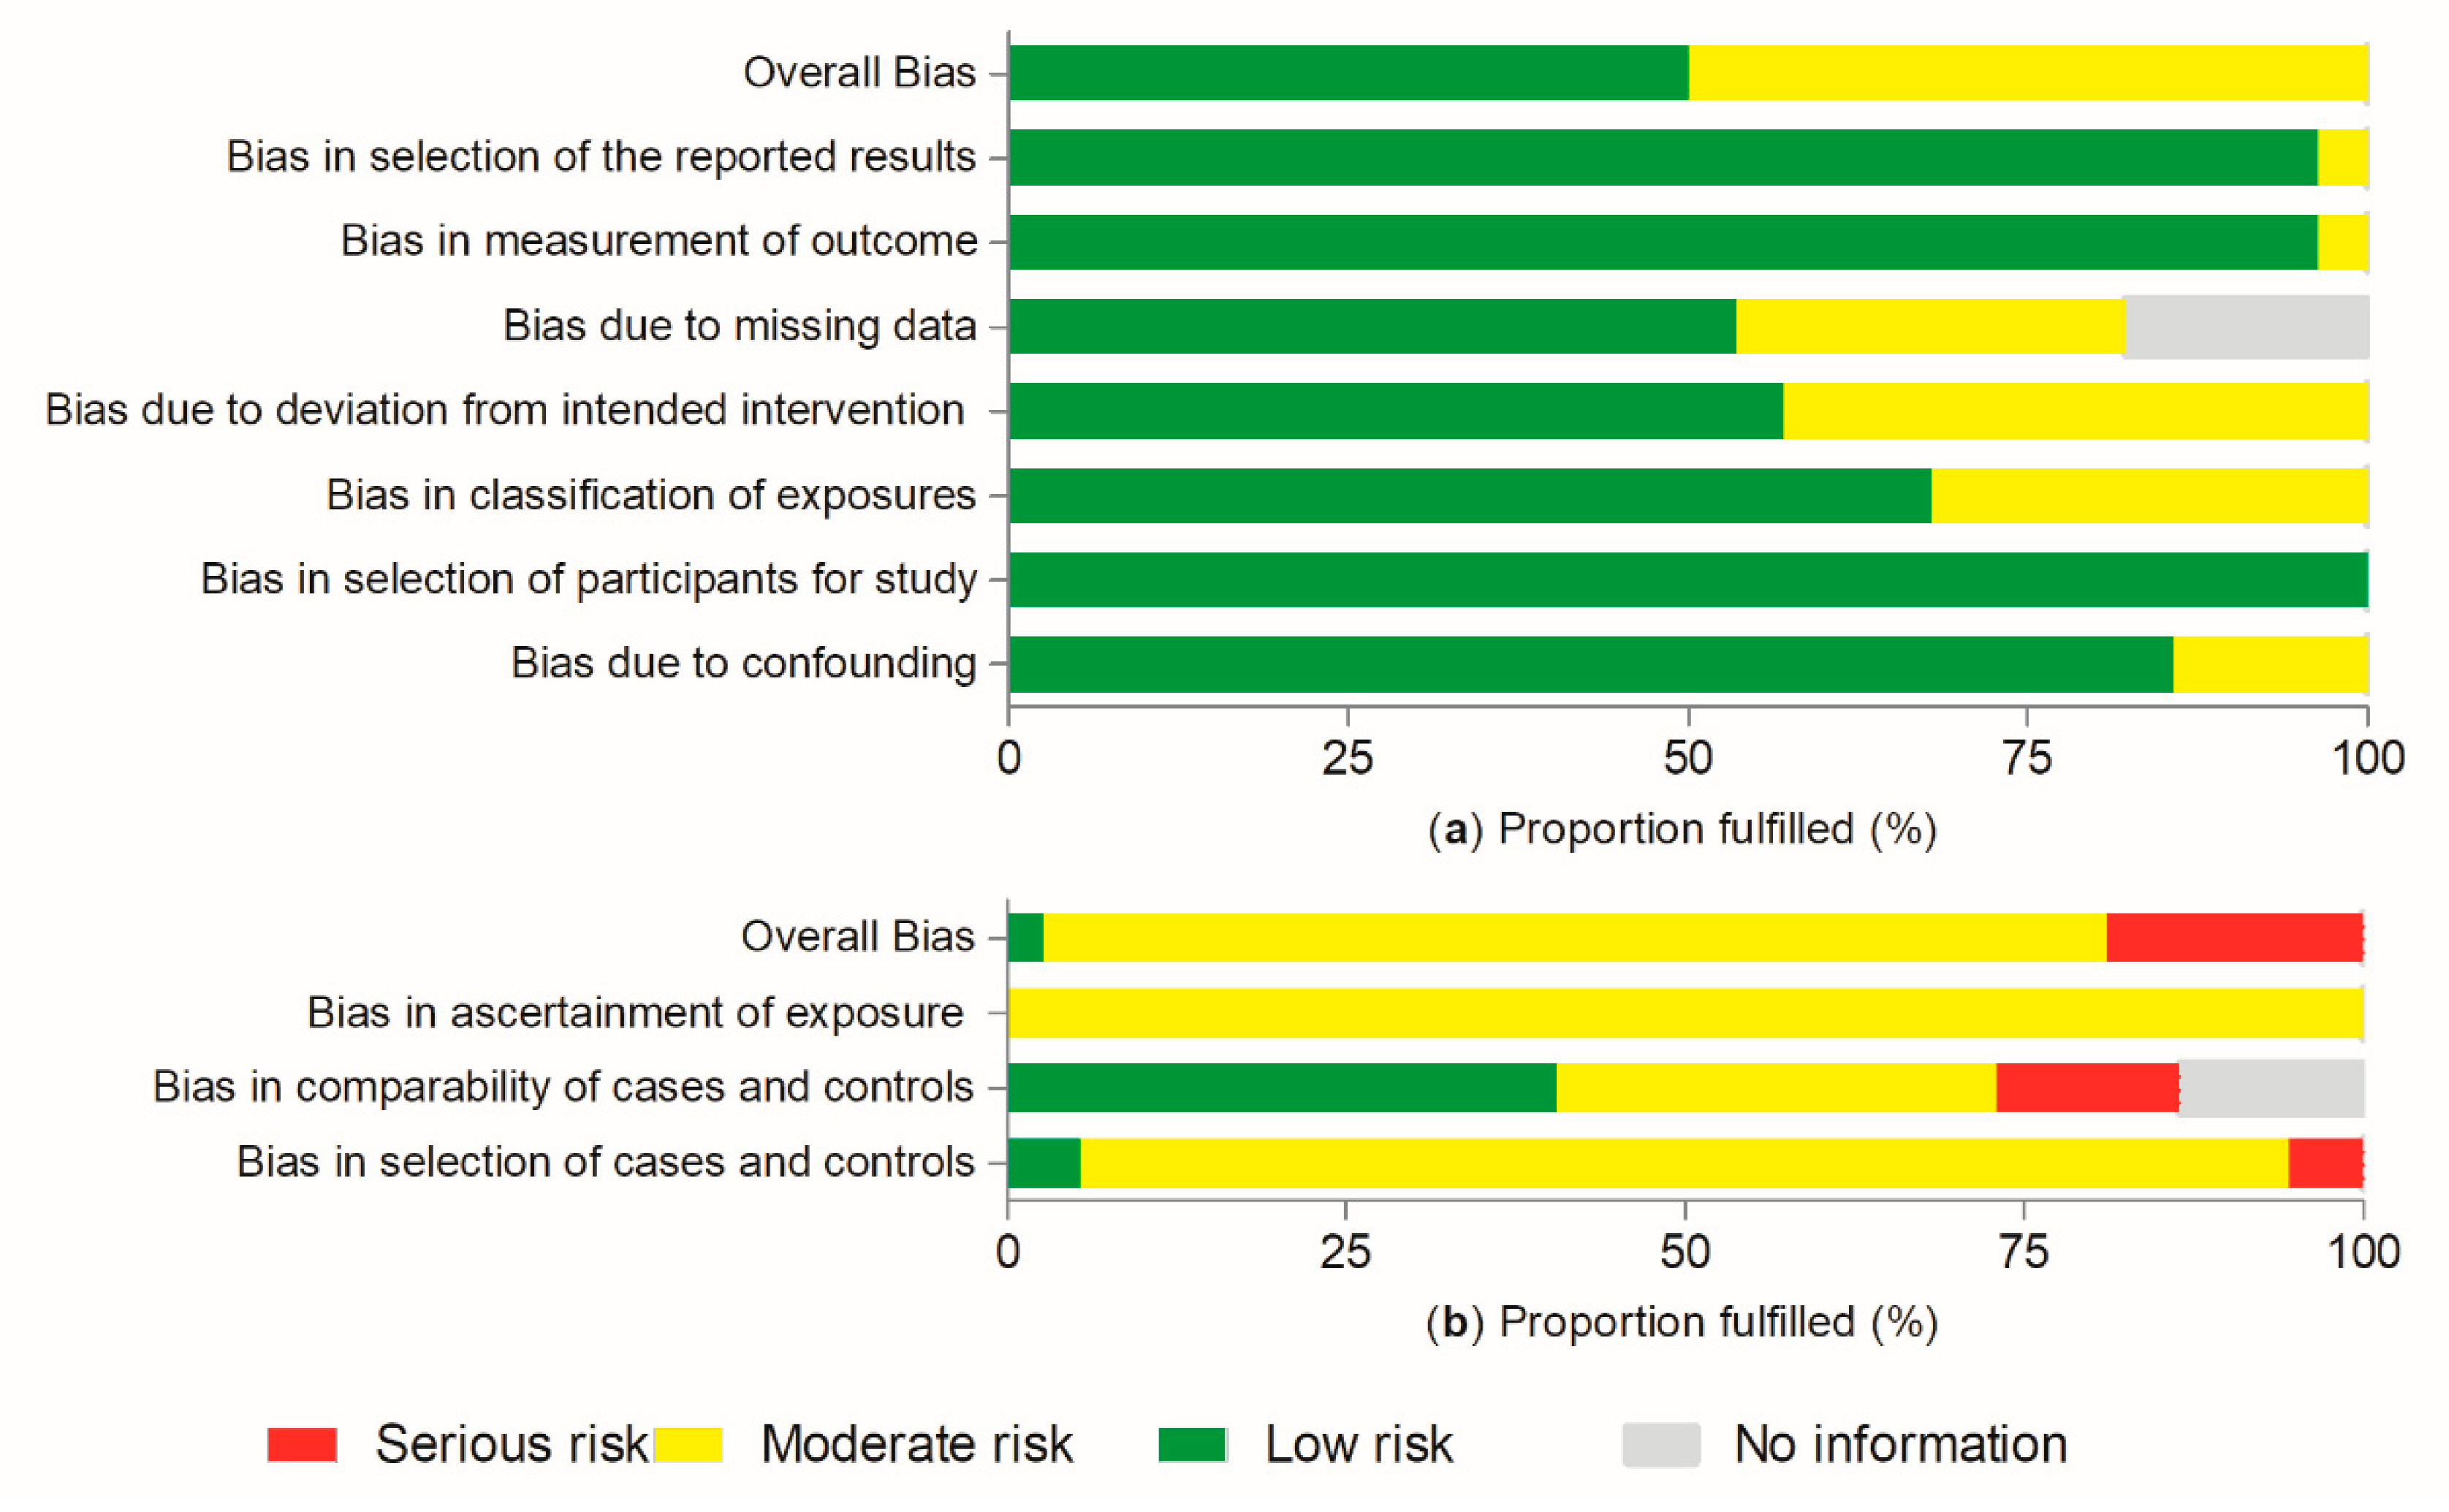
3.14. Quality of Included Studies
4. Discussion
4.1. Association between Consumption of Sweet Beverages and Cancer Risk
4.2. Limitations of the Current Data
5. Conclusions
Supplementary Materials
Author Contributions
Funding
Informed Consent Statement
Data Availability Statement
Conflicts of Interest
References
- Welsh, J.A.; Lundeen, E.A.; Stein, A.D. The sugar-sweetened beverage wars: Public health and the role of the beverage industry. Curr. Opin. Endocrinol. Diabetes Obes. 2013, 20, 401–406. [Google Scholar] [CrossRef] [PubMed]
- Sylvetsky, A.C.; Jin, Y.; Clark, E.J.; Welsh, J.A.; Rother, K.I.; Talegawkar, S.A. Consumption of Low-Calorie Sweeteners among Children and Adults in the United States. J. Acad. Nutr. Diet. 2017, 117, 441–448. [Google Scholar] [CrossRef] [PubMed]
- Wojcicki, J.M.; Heyman, M.B. Reducing childhood obesity by eliminating 100% fruit juice. Am. J. Public Health 2012, 102, 1630–1633. [Google Scholar] [CrossRef] [PubMed]
- Te Morenga, L.; Simonette, M.; Jim, M. Dietary sugars and body weight: Systematic review and meta-analyses of randomised controlled trials and cohort studies. BMJ 2013, 346, e7492. [Google Scholar] [CrossRef] [PubMed]
- Imamura, F.; O’Connor, L.; Ye, Z.; Mursu, J.; Hayashino, Y.; Bhupathiraju, S.N.; Forouhi, N.G. Consumption of sugar sweetened beverages, artificially sweetened beverages, and fruit juice and incidence of type 2 diabetes: Systematic review, meta-analysis, and estimation of population attributable fraction. BMJ 2015, 351. [Google Scholar] [CrossRef]
- Friedman, F.; Mozaffarian, D. Dietary and Policy Priorities for Cardiovascular Disease, Diabetes, and Obesity A Comprehensive Review. Circulation 2016, 133, 187–225. [Google Scholar] [CrossRef]
- Calle, E.E.; Kaaks, R. Overweight, obesity and cancer: Epidemiological evidence and proposed mechanisms. Nat. Rev. Cancer 2004, 4, 579–591. [Google Scholar] [CrossRef]
- Giovannucci, E.; Harlan, D.M.; Archer, M.C.; Bergenstal, R.M.; Gapstur, S.M.; Habel, L.A.; Pollak, M.; Regensteiner, J.G.; Yee, D. Diabetes and Cancer: A consensus report. Diabetes Care 2010, 33, 1674–1685. [Google Scholar] [CrossRef] [PubMed]
- Elliott, S.S.; Keim, N.L.; Stern, J.S.; Teff, K.; Havel, P.J. Fructose, weight gain, and the insulin resistance syndrome. Am. J. Clin. Nutr. 2002, 76, 911–933. [Google Scholar] [CrossRef]
- Lauby-Secretan, B.; Scoccianti, C.; Loomis, D.; Grosse, Y.; Bianchini, F.; Straif, K. Body Fatness and Cancer—Viewpoint of the IARC Working Group. N. Engl. J. Med. 2016, 375, 794–798. [Google Scholar] [CrossRef]
- Giovannucci, E. Insulin, insulin-like growth factors and colon cancer: A review of the evidence. J. Nutr. 2001, 131, 3109S–3120S. [Google Scholar] [CrossRef]
- Atkinson, F.S.; Foster-Powell, K.; Brand-Miller, J.C. International tables of glycemic index and glycemic load values: 2008. Diabetes Care 2008, 31, 2281–2283. [Google Scholar] [CrossRef] [PubMed]
- Sieri, S.; Krogh, V. Dietary glycemic index, glycemic load and cancer: An overview of the literature. Nutr. Metab. Cardiovasc. Dis. 2017, 27, 18–31. [Google Scholar] [CrossRef] [PubMed]
- Lerma-Cabrera, J.M.; Carvajal, F.; Lopez-Legarrea, P. Food addiction as a new piece of the obesity framework. Nutr. J. 2016, 15. [Google Scholar] [CrossRef]
- Ruanpeng, D.; Thongprayoon, C.; Cheungpasitporn, W.; Harindhanavudhi, T. Sugar and artificially sweetened beverages linked to obesity: A systematic review and meta-analysis. QJM Int. J. Med. 2017, 110, 513–520. [Google Scholar] [CrossRef]
- Soffritti, M.; Belpoggi, F.; Degli Esposti, D.; Lambertini, L. Aspartame induces lymphomas and leukaemias in rats. Eur. J. Oncol. 2005, 10, 107–116. [Google Scholar]
- International Agency for Research on Cancer Monograph Working Group. Formaldehyde, 2-Butoxyethanol and 1-tert-Butoxypropan-2-ol. IARC Monogr. Eval. Carcinog. Risks Hum. 2006, 88, 1–478. [Google Scholar]
- Boyle, P.; Koechlin, A.; Autier, P. Sweetened carbonated beverage consumption and cancer risk. Eur. J. Cancer Prev. 2014, 23, 481–490. [Google Scholar] [CrossRef]
- Milajerdi, A.; Larijani, B.; Esmaillzadeh, A. Sweetened Beverages Consumption and Pancreatic Cancer: A Meta-Analysis. Nutr. Cancer 2019, 71, 375–384. [Google Scholar] [CrossRef]
- Genkinger, J.M.; Li, R.; Spiegelman, D.; Anderson, K.E.; Albanes, D.; Bergkvist, L.; Bernstein, L.; Black, A.; Van Den Brandt, P.A.; English, D.R.; et al. Coffee, tea, and sugar-sweetened carbonated soft drink intake and pancreatic cancer risk: A pooled analysis of 14 cohort studies. Cancer Epidemiol. Biomark. Prev. 2012, 21, 305–318. [Google Scholar] [CrossRef]
- Zhang, X.; Albanes, D.; Beeson, W.L.; Van Den Brandt, P.A.; Buring, J.E.; Flood, A.; Freudenheim, J.L.; Giovannucci, E.L.; Goldbohm, R.A.; Jaceldo-Siegl, K.; et al. Risk of colon cancer and coffee, tea, and sugar-sweetened soft drink intake: Pooled analysis of prospective cohort studies. J. Natl. Cancer Inst. 2010, 102, 771–783. [Google Scholar] [CrossRef] [PubMed]
- Makarem, N.; Bandera, E.V.; Nicholson, J.M.; Parekh, N. Consumption of Sugars, Sugary Foods, and Sugary Beverages in Relation to Cancer Risk: A Systematic Review of Longitudinal Studies. Annu. Rev. Nutr. 2018, 38, 17–39. [Google Scholar] [CrossRef] [PubMed]
- Chazelas, E.; Srour, B.; Desmetz, E.; Kesse-Guyot, E.; Julia, C.; Deschamps, V.; Druesne-Pecollo, N.; Galan, P.; Hercberg, S.; Latino-Martel, P.; et al. Sugary drink consumption and risk of cancer: Results from NutriNet-Santé prospective cohort. BMJ 2019, 366, l2408. [Google Scholar] [CrossRef]
- Schernhammer, E.S.; Bertrand, K.A.; Birmann, B.M.; Sampson, L.; Willett, W.C.; Feskanich, D. Consumption of artificial sweetener- and sugar-containing soda and risk of lymphoma and leukemia in men and women. Am. J. Clin. Nutr. 2012, 96, 1419–1428. [Google Scholar] [CrossRef] [PubMed]
- World Health Organization (WHO). Report on Cancer: Setting Priorities, Investing Wisely and Providing Care for All. Available online: https://apps.who.int/iris/handle/10665/330745 (accessed on 30 November 2020).
- Bero, L.; Chartres, N.; Diong, J.; Fabbri, A.; Ghersi, D.; Lam, J.; Lau, A.; McDonald, S.; Mintzes, B.; Sutton, P.; et al. The risk of bias in observational studies of exposures (ROBINS-E) tool: Concerns arising from application to observational studies of exposures. Syst. Rev. 2018, 7, 242. [Google Scholar] [CrossRef]
- The Newcastle-Ottawa Scale (NOS) for Assessing the Quality of Nonrandomised Studies in Meta-Analyses. Available online: http://www.ohri.ca/programs/clinical_epidemiology/oxford.asp (accessed on 2 November 2020).
- Stepien, M.; Duarte-Salles, T.; Fedirko, V.; Trichopoulou, A.; Lagiou, P.; Bamia, C.; Overvad, K.; Tjønneland, A.; Hansen, L.; Boutron-Ruault, M.C.; et al. Consumption of soft drinks and juices and risk of liver and biliary tract cancers in a European cohort. Eur. J. Nutr. 2014, 55, 7–20. [Google Scholar] [CrossRef] [PubMed]
- US Food and Drug Administration (FDA), Code of Federal Regulations Title 21. Available online: https://www.accessdata.fda.gov/scripts/cdrh/cfdocs/cfcfr/cfrsearch.cfm?fr=101.12 (accessed on 30 November 2020).
- Australian Food Composition Database. Available online: https://www.foodstandards.gov.au/science/monitoringnutrients/afcd/Pages/default.aspx (accessed on 30 November 2020).
- Miles, F.L.; Neuhouser, M.L.; Zhang, Z.F. Concentrated sugars and incidence of prostate cancer in a prospective cohort. Proc. Int. Astron. Union 2018, 120, 703–710. [Google Scholar] [CrossRef] [PubMed]
- USDA, Food Data Central. Available online: https://ndb.nal.usda.gov/download-datasets.html (accessed on 2 November 2020).
- Viechtbauer, W. Conducting meta-analyses in R with the metafor. J. Stat. Softw. 2010, 36, 1–48. [Google Scholar] [CrossRef]
- Ren, J.S.; Freedman, N.D.; Kamangar, F.; Dawsey, S.M.; Hollenbeck, A.R.; Schatzkin, A.; Abnet, C.C. Tea, coffee, carbonated soft drinks and upper gastrointestinal tract cancer risk in a large United States prospective cohort study. Eur. J. Cancer 2010, 46, 1873–1881. [Google Scholar] [CrossRef]
- Drake, I.; Sonestedt, E.; Gullberg, B.; Ahlgren, G.; Bjartell, A.; Wallström, P.; Wirfält, E. Dietary intakes of carbohydrates in relation to prostate cancer risk: A prospective study in the Malmö Diet and Cancer cohort. Am. J. Clin. Nutr. 2012, 96, 1409–1418. [Google Scholar] [CrossRef]
- Ellison, L.F. Tea and other beverage consumption and prostate cancer risk: A Canadian retrospective cohort study. Eur. J. Cancer Prev. 2000, 9, 125–130. [Google Scholar] [CrossRef] [PubMed]
- Lee, J.E.; Giovannucci, E.; Smith-Warner, S.A.; Spiegelman, D.; Willett, W.C.; Curhan, G.C. Total fluid intake and use of individual beverages and risk of renal cell cancer in two large cohorts. Cancer Epidemiol. Biomarkers Prev. 2006, 15, 1204–1211. [Google Scholar] [CrossRef] [PubMed]
- Ros, M.M.; Bas Bueno-de-Mesquita, H.B.; Büchner, F.L.; Aben, K.K.H.; Kampman, E.; Egevad, L.; Overvad, K.; Tjønneland, A.; Roswall, N.; Clavel-Chapelon, F.; et al. Fluid intake and the risk of urothelial cell carcinomas in the European Prospective Investigation into Cancer and Nutrition (EPIC). Int. J. Cancer 2011, 128, 2695–2708. [Google Scholar] [CrossRef] [PubMed]
- Inoue-Choi, M.; Robien, K.; Mariani, A.; Cerhan, J.R.; Anderson, K.E. Sugar-sweetened beverage intake and the risk of type I and type II endometrial cancer among postmenopausal women. Cancer Epidemiol. Biomarkers Prev. 2013, 22, 2384–2394. [Google Scholar] [CrossRef] [PubMed]
- McCullough, M.L.; Teras, L.R.; Shah, R.; Diver, W.R.; Gaudet, M.M.; Gapstur, S.M. Artificially and Sugar-Sweetened Carbonated Beverage Consumption Is Not Associated with Risk of Lymphoid Neoplasms in Older Men and Women. J. Nutr. 2014, 144, 2041–2049. [Google Scholar] [CrossRef] [PubMed]
- Larsson, S.C.; Bergkvist, L.; Wolk, A. Consumption of sugar and sugar-sweetened foods and the risk of pancreatic cancer in a prospective study. Am. J. Clin. Nutr. 2006, 84, 1171–1176. [Google Scholar] [CrossRef]
- Bao, Y.; Stolzenberg-Solomon, R.; Jiao, L.; Silverman, D.T.; Subar, A.F.; Park, Y.; Leitzmann, M.F.; Hollenbeck, A.; Schatzkin, A.; Michaud, D.S. Added sugar and sugar-sweetened foods and beverages and the risk of pancreatic cancer in the National Institutes of Health-AARP Diet and Health Study. Am. J. Clin. Nutr. 2008, 88, 431–440. [Google Scholar] [CrossRef] [PubMed]
- Mueller, N.T.; Odegaard, A.; Anderson, K.; Yuan, J.M.; Gross, M.; Koh, W.P.; Pereira, M.A. Soft drink and juice consumption and risk of pancreatic cancer: The singapore chinese health study. Cancer Epidemiol. Biomarkers Prev. 2010, 19, 447–455. [Google Scholar] [CrossRef]
- Nöthlings, U.; Murphy, S.P.; Wilkens, L.R.; Henderson, B.E.; Kolonel, L.N. Dietary glycemic load, added sugars, and carbohydrates as risk factors for pancreatic cancer: The Multiethnic Cohort Study. Am. J. Clin. Nutr. 2007, 86, 1495–1501. [Google Scholar] [CrossRef]
- Navarrete-Muñoz, E.M.; Wark, P.A.; Romaguera, D.; Bhoo-Pathy, N.; Michaud, D.; Molina-Montes, E.; Tjønneland, A.; Olsen, A.; Overvad, K.; Boutron-Ruault, M.C.; et al. Sweet-beverage consumption and risk of pancreatic cancer in the European Prospective Investigation into Cancer and Nutrition (EPIC). Am. J. Clin. Nutr. 2016, 104, 760–768. [Google Scholar] [CrossRef]
- Schernhammer, E.S.; Hu, F.B.; Giovannucci, E.; Michaud, D.S.; Colditz, G.A.; Stampfer, M.J.; Fuchs, C.S. Sugar-sweetened soft drink consumption and risk of pancreatic cancer in two prospective cohorts. Cancer Epidemiol. Biomarkers Prev. 2005, 14, 2098–2105. [Google Scholar] [CrossRef] [PubMed]
- Dubrow, R.; Darefsky, A.S.; Freedman, N.D.; Hollenbeck, A.R.; Sinha, R. Coffee, tea, soda, and caffeine intake in relation to risk of adult glioma in the NIH-AARP Diet and Health Study. Cancer Causes Control 2012, 23, 757–768. [Google Scholar] [CrossRef] [PubMed]
- Zamora-Ros, R.; Béraud, V.; Franceschi, S.; Cayssials, V.; Tsilidis, K.K.; Boutron-Ruault, M.C.; Weiderpass, E.; Overvad, K.; Tjønneland, A.; Eriksen, A.K.; et al. Consumption of fruits, vegetables and fruit juices and differentiated thyroid carcinoma risk in the European Prospective Investigation into Cancer and Nutrition (EPIC) study. Int. J. Cancer 2018, 142, 449–459. [Google Scholar] [CrossRef] [PubMed]
- Larsson, S.C.; Giovannucci, E.L.; Wolk, A. Sweetened Beverage Consumption and Risk of Biliary Tract and Gallbladder Cancer in a Prospective Study. J. Natl. Cancer Inst. 2016, 108. [Google Scholar] [CrossRef]
- Bassett, J.K.; Milne, R.L.; English, D.R.; Giles, G.G.; Hodge, A.M. Consumption of sugar-sweetened and artificially sweetened soft drinks and risk of cancers not related to obesity. Int. J. Cancer 2020, 146, 3329–3334. [Google Scholar] [CrossRef]
- Hirvonen, T.; Mennen, L.I.; de Bree, A.; Castetbon, K.; Galan, P.; Bertrais, S.; Arnault, N.; Hercberg, S. Consumption of Antioxidant-Rich Beverages and Risk for Breast Cancer in French Women. Ann. Epidemiol. 2006, 16, 503–508. [Google Scholar] [CrossRef]
- Makarem, N.; Bandera, E.V.; Lin, Y.; Jacques, P.F.; Hayes, R.B.; Parekh, N. Consumption of sugars, sugary foods, and sugary beverages in relation to adiposity-related cancer risk in the framingham offspring cohort (1991–2013). Cancer Prev. Res. 2018, 11, 347–358. [Google Scholar] [CrossRef]
- Romanos-Nanclares, A.; Toledo, E.; Gardeazabal, I.; Jiménez-Moleón, J.J.; Martínez-González, M.A.; Gea, A. Sugar-sweetened beverage consumption and incidence of breast cancer: The Seguimiento Universidad de Navarra (SUN) Project. Eur. J. Nutr. 2019, 58, 2875–2886. [Google Scholar] [CrossRef]
- Hodge, A.M.; Bassett, J.K.; Milne, R.L.; English, D.R.; Giles, G.G. Consumption of sugar-sweetened and artificially sweetened soft drinks and risk of obesity-related cancers. Public Health Nutr. 2018, 21, 1618–1626. [Google Scholar] [CrossRef]
- Nomura, S.J.O.; Dash, C.; Rosenberg, L.; Yu, J.; Palmer, J.R.; Adams-Campbell, L.L. Adherence to diet, physical activity and body weight recommendations and breast cancer incidence in the Black Women’s Health Study. Int. J. Cancer 2016, 139, 2738–2752. [Google Scholar] [CrossRef]
- Pacheco, L.S.; Anderson, C.A.M.; Lacey, J.V.; Giovannucci, E.L.; Lemus, H.; Araneta, M.R.G.; Sears, D.D.; Talavera, G.A.; Martinez, M.E. Sugar-sweetened beverages and colorectal cancer risk in the California Teachers Study. PLoS ONE 2019, 14, e0223638. [Google Scholar] [CrossRef] [PubMed]
- Chandran, U.; McCann, S.E.; Zirpoli, G.; Gong, Z.; Lin, Y.; Hong, C.C.; Ciupak, G.; Pawlish, K.; Ambrosone, C.B.; Bandera, E.V. Intake of energy-dense foods, fast foods, sugary drinks, and breast cancer risk in African American and European American women. Nutr. Cancer 2014, 66, 1187–1199. [Google Scholar] [CrossRef] [PubMed]
- Marzbani, B.; Nazari, J.; Najafi, F.; Marzbani, B.; Shahabadi, S.; Amini, M.; Moradinazar, M.; Pasdar, Y.; Shakiba, E.; Amini, S. Dietary patterns, nutrition, and risk of breast cancer: A case-control study in the west of Iran. Epidemiol. Health 2019, 41, e2019003. [Google Scholar] [CrossRef] [PubMed]
- Mayne, S.T.; Risch, H.A.; Dubrow, R.; Chow, W.H.; Gammon, M.D.; Vaughan, T.L.; Borchardt, L.; Schoenberg, J.B.; Stanford, J.L.; West, A.B.; et al. Carbonated soft drink consumption and risk of esophageal adenocarcinoma. J. Natl. Cancer Inst. 2006, 98, 72–75. [Google Scholar] [CrossRef][Green Version]
- Bruemmer, B.; White, E.; Vaughan, T.L.; Cheney, C.L. Fluid intake and the incidence of bladder cancer among middle-aged men and women in a three-county area of Western Washington. Nutr. Cancer 1997, 29, 163–168. [Google Scholar] [CrossRef]
- De Stefani, E.; Boffetta, P.; Deneo-Pellegrini, H.; Correa, P.; Ronco, A.L.; Brennan, P.; Ferro, G.; Acosta, G.; Mendilaharsu, M. Non-alcoholic beverages and risk of bladder cancer in Uruguay. BMC Cancer 2007, 7. [Google Scholar] [CrossRef] [PubMed]
- Hemelt, M.; Hu, Z.; Zhong, Z.; Xie, L.P.; Wong, Y.C.; Tam, P.C.; Cheng, K.K.; Ye, Z.; Bi, X.; Lu, Q.; et al. Fluid intake and the risk of bladder cancer: Results from the South and East China case-control study on bladder cancer. Int. J. Cancer 2010, 127, 638–645. [Google Scholar] [CrossRef] [PubMed]
- Radosavljević, V.; Janković, S.; Marinković, J.; Djokić, M. Fluid intake and bladder cancer. A case control study. Neoplasma 2003, 50, 234–238. [Google Scholar] [PubMed]
- Turati, F.; Bosetti, C.; Polesel, J.; Zucchetto, A.; Serraino, D.; Montella, M.; Libra, M.; Galfano, A.; La Vecchia, C.; Tavani, A. Coffee, Tea, Cola, and Bladder Cancer Risk: Dose and Time Relationships. Urology 2015, 86, 1179–1184. [Google Scholar] [CrossRef]
- Wang, J.; Wu, X.; Kamat, A.; Grossman, H.B.; Dinney, C.P.; Lin, J. Fluid intake, genetic variants of UDP-glucuronosyltransferases, and bladder cancer risk. Br. J. Cancer 2013, 108, 2372–2380. [Google Scholar] [CrossRef]
- Jain, M.G.; Hislop, G.T.; Howe, G.R.; Burch, J.D.; Ghadirian, P. Alcohol and other beverage use and prostate cancer risk among Canadian men. Int. J. Cancer 1998, 78, 707–711. [Google Scholar] [CrossRef]
- Sharpe, C.R.; Siemiatycki, J. Consumption of non-alcoholic beverages and prostate cancer risk. Eur. J. Cancer Prev. 2002, 11, 497–501. [Google Scholar] [CrossRef] [PubMed]
- Hu, J.; Mao, Y.; DesMeules, M.; Csizmadi, I.; Friedenreich, C.; Mery, L. Total fluid and specific beverage intake and risk of renal cell carcinoma in Canada. Cancer Epidemiol. 2009, 33, 355–362. [Google Scholar] [CrossRef]
- McLaughlin, C.C.; Mahoney, M.C.; Nasca, P.C.; Metzger, B.B.; Baptiste, M.S.; Field, N.A. Breast cancer and methylxanthine consumption. Cancer Causes Control 1992, 3, 175–178. [Google Scholar] [CrossRef]
- Maclure, M.; Willett, W. A case-control study of diet and risk of renal adenocarcinoma. Epidemiology 1990, 1, 430–440. [Google Scholar] [CrossRef]
- Herrero, R.; Potischman, N.; Brinton, L.A.; Reeves, W.C.; Brenes, M.M.; Tenorio, F.; De Britton, R.C.; Gaitan, E. A case-control study of nutrient status and invasive cervical cancer: I. Dietary indicators. Am. J. Epidemiol. 1991, 134, 1335–1346. [Google Scholar] [CrossRef] [PubMed]
- Verreault, R.; Chu, J.; Mandelson, M.; Shy, K. A case-control study of diet and invasive cervical cancer. Int. J. Cancer 1989, 43, 1050–1054. [Google Scholar] [CrossRef]
- King, M.G.; Olson, S.H.; Paddock, L.; Chandran, U.; Demissie, K.; Lu, S.E.; Parekh, N.; Rodriguez-Rodriguez, L.; Bandera, E.V. Sugary food and beverage consumption and epithelial ovarian cancer risk: A population-based case-control study. BMC Cancer 2013, 13, 94. [Google Scholar] [CrossRef] [PubMed]
- Leung, A.C.Y.; Cook, L.S.; Swenerton, K.; Gilks, B.; Gallagher, R.P.; Magliocco, A.; Steed, H.; Köbel, M.; Nation, J.; Brooks-Wilson, A.; et al. Tea, coffee, and caffeinated beverage consumption and risk of epithelial ovarian cancers. Cancer Epidemiol. 2016, 45, 119–125. [Google Scholar] [CrossRef]
- Yoon, J.S.; Kristal, A.R.; Wicklund, K.G.; Cushing-Haugen, K.L.; Rossing, M.A. Coffee, tea, colas, and risk of epithelial ovarian cancer. Cancer Epidemiol. Biomarkers Prev. 2008, 17, 712–716. [Google Scholar] [CrossRef][Green Version]
- Chan, J.M.; Wang, F.; Holly, E.A. Sweets, sweetened beverages, and risk of pancreatic cancer in a large population-based case-control study. Cancer Causes Control 2009, 20, 835–846. [Google Scholar] [CrossRef] [PubMed]
- Gallus, S.; Turati, F.; Tavani, A.; Polesel, J.; Talamini, R.; Franceschi, S.; La Vecchia, C. Soft drinks, sweetened beverages and risk of pancreatic cancer. Cancer Causes Control 2011, 22, 33–39. [Google Scholar] [CrossRef] [PubMed]
- Gold, E.B.; Gordis, L.; Diener, M.D.; Seltser, R.; Boitnott, J.K.; Bynum, T.E.; Hutcheon, D.F. Diet and other risk factors for cancer of the pancreas. Cancer 1985, 55, 460–467. [Google Scholar] [CrossRef]
- Lyon, J.L.; Mahoney, A.W.; French, T.K.; Moser, R. Coffee consumption and the risk of cancer of the exocrine pancreas: A case-control study in a low-risk population. Epidemiology 1992, 3, 164–170. [Google Scholar] [CrossRef]
- Potischman, N.; Coates, R.J.; Swanson, C.A.; Carroll, R.J.; Daling, J.R.; Brogan, D.R.; Gammon, M.D.; Midthune, D.; Curtin, J.; Brinton, L.A. Increased risk of early-stage breast cancer related to consumption of sweet foods among women less than age 45 in the United States. Cancer Causes Control 2002, 13, 937–946. [Google Scholar] [CrossRef] [PubMed]
- Mack, T.; Yu, M.; Henderson, B. Pancreas cancer and smoking, beverage consumption, and past medical history. J. Natl. Cancer Inst. 1986, 76, 49–60. [Google Scholar]
- Zvrko, E.; Gledović, Z.; Ljaljević, A. Risk factors for laryngeal cancer in Montenegro. Arh. Hig. Rada Toksikol. 2008, 59, 11–18. [Google Scholar] [CrossRef]
- Lissowska, J.; Pilarska, A.; Pilarski, P.; Samolczyk-Wanyura, D.; Piekarczyk, J.; Bardin-Mikolajczak, A.; Zatonski, W.; Herrero, R.; Muňoz, N.; Franceschi, S. Smoking, alcohol, diet, dentition and sexual practices in the epidemiology of oral cancer in Poland. Eur. J. Cancer Prev. 2003, 12, 25–33. [Google Scholar] [CrossRef] [PubMed]
- Kreimer, A.R.; Randi, G.; Herrero, R.; Castellsagué, X.; La Vecchia, C.; Franceschi, S. Diet and body mass, and oral and oropharyngeal squamous cell carcinomas: Analysis from the IARC multinational case-control study. Int. J. Cancer 2006, 118, 2293–2297. [Google Scholar] [CrossRef] [PubMed]
- Vinceti, M.; Bonvicini, F.; Pellacani, G.; Sieri, S.; Malagoli, C.; Giusti, F.; Krogh, V.; Bergomi, M.; Seidenari, S. Food intake and risk of cutaneous melanoma in an Italian population. Eur. J. Clin. Nutr. 2008, 62, 1351–1354. [Google Scholar] [CrossRef][Green Version]
- Luqman, M.; Javed, M.M.; Daud, S.; Raheem, N.; Ahmad, J.; Khan, A.U.H. Risk factors for lung cancer in the Pakistani population. Asian Pacific J. Cancer Prev. 2014, 15, 3035–3039. [Google Scholar] [CrossRef]
- Wu, A.H.; Yu, M.C.; Mack, T.M. Smoking, alcohol use, dietary factors and risk of small intestinal adenocarcinoma. Int. J. Cancer 1997, 70, 512–517. [Google Scholar] [CrossRef]
- Bener, A.; Moore, M.A.; Ali, R.; El Ayoubi, H.R. Impacts of family history and lifestyle habits on colorectal cancer risk: A case-control study in Qatar. Asian Pacific J. Cancer Prev. 2010, 11, 963–968. [Google Scholar]
- Mahfouz, E.M.; Sadek, R.R.; Abdel-Latief, W.M.; Mosallem, F.A.H.; Hassan, E.E. The role of dietary and lifestyle factors in the development of colorectal cancer: Case control study in Minia, Egypt. Cent. Eur. J. Public Health 2014, 22, 215–222. [Google Scholar] [CrossRef] [PubMed]
- Tayyem, R.F.; Bawadi, H.A.; Shehadah, I.; Bani-Hani, K.E.; Takruri, H.; Al-Jaberi, T.; Heath, D.D. Fast foods, sweets and beverage consumption and risk of colorectal cancer: A case-control study in Jordan. Asian Pacific J. Cancer Prev. 2018, 19, 261–269. [Google Scholar] [CrossRef]
- Theodoratou, E.; Farrington, S.M.; Tenesa, A.; McNeill, G.; Cetnarskyj, R.; Korakakis, E.; Din, F.V.N.; Porteous, M.E.; Dunlop, M.G.; Campbell, H. Associations between dietary and lifestyle risk factors and colorectal cancer in the Scottish population. Eur. J. Cancer Prev. 2014, 23, 8–17. [Google Scholar] [CrossRef]
- Murtaugh, M.A.; Ma, K.N.; Caan, B.J.; Slattery, M.L. Association of fluids from beverages with risk of rectal cancer. Nutr. Cancer 2004, 49, 25–31. [Google Scholar] [CrossRef]
- Ibiebele, T.I.; Hughes, M.C.; O’Rourke, P.; Webb, P.M.; Whiteman, D.C. Cancers of the esophagus and carbonated beverage consumption: A population-based case-control study. Cancer Causes Control 2008, 19, 577–584. [Google Scholar] [CrossRef]
- Turati, F.; Dalmartello, M.; Bravi, F.; Serraino, D.; Augustin, L.; Giacosa, A.; Negri, E.; Levi, F.; Vecchia, C. La Adherence to the world cancer research fund/american institute for cancer research recommendations and the risk of breast cancer. Nutrients 2020, 12, 607. [Google Scholar] [CrossRef] [PubMed]
- Chandran, U.; Hirshfield, K.M.; Bandera, E.V. The role of anthropometric and nutritional factors on breast cancer risk in African-American women. Public Health Nutr. 2012, 15, 738–748. [Google Scholar] [CrossRef] [PubMed]
- Li, N.; Petrick, J.L.; Steck, S.E.; Bradshaw, P.T.; McClain, K.M.; Niehoff, N.M.; Engel, L.S.; Shaheen, N.J.; Corley, D.A.; Vaughan, T.L.; et al. Dietary sugar/starches intake and Barrett’s esophagus: A pooled analysis. Eur. J. Epidemiol. 2017, 32, 1007–1017. [Google Scholar] [CrossRef] [PubMed]
- Khan, M.M.H.; Goto, R.; Kobayashi, K.; Suzumura, S.; Nagata, Y.; Sonoda, T.; Sakauchi, F.; Washio, M.; Mori, M. Dietary habits and cancer mortality among middle aged and older Japanese living in Hokkaido, Japan by cancer site and sex. Asian Pacific J. Cancer Prev. 2004, 5, 58–65. [Google Scholar]
- Yang, H.P.; Wentzensen, N.; Trabert, B.; Gierach, G.L.; Felix, A.S.; Gunter, M.J.; Hollenbeck, A.; Park, Y.; Sherman, M.E.; Brinton, L.A. Endometrial cancer risk factors by 2 main histologic subtypes. Am. J. Epidemiol. 2013, 177, 142–151. [Google Scholar] [CrossRef]
- O’Neil, C.E.; Nicklas, T.A.; Rampersaud, G.C.; Fulgoni, V.L. 100% Orange juice consumption is associated with better diet quality, improved nutrient adequacy, decreased risk for obesity, and improved biomarkers of health in adults: National Health and Nutrition Examination Survey, 2003–2006. Nutr. J. 2012, 11. [Google Scholar] [CrossRef]
- Salari-Moghaddam, A.; Milajerdi, A.; Surkan, P.J.; Larijani, B.; Esmaillzadeh, A. Caffeine, Type of Coffee, and Risk of Ovarian Cancer: A Dose-Response Meta-Analysis of Prospective Studies. J. Clin. Endocrinol. Metab. 2019, 104, 5349–5359. [Google Scholar] [CrossRef]
- Tsai, C.J.; Leitzmann, M.F.; Willett, W.C.; Giovannucci, E.L. Glycemic load, glycemic index, and carbohydrate intake in relation to risk of cholecystectomy in women. Gastroenterology 2005, 129, 105–112. [Google Scholar] [CrossRef]
- Randi, G.; Franceschi, S.; La Vecchia, C. Gallbladder cancer worldwide: Geographical distribution and risk factors. Int. J. Cancer 2006, 118, 1591–1602. [Google Scholar] [CrossRef] [PubMed]
- Toews, I.; Lohner, S.; Küllenberg De Gaudry, D.; Sommer, H.; Meerpohl, J.J. Association between intake of non-sugar sweeteners and health outcomes: Systematic review and meta-analyses of randomised and non-randomised controlled trials and observational studies. BMJ 2019, 364. [Google Scholar] [CrossRef] [PubMed]
- Ruppar, T. Meta-analysis: How to quantify and explain heterogeneity? Eur. J. Cardiovasc. Nurs. 2020, 19, 646–652. [Google Scholar] [CrossRef]
- Bucher, T.; Siegrist, M. Children’s and parents’ health perception of different soft drinks. Br. J. Nutr. 2015, 113, 526–535. [Google Scholar] [CrossRef]
- World Cancer Research Fund/American Institute for Cancer Research. Diet, Nutrition, Physical Activity and Cancer: A Global Perspective A Summary of the Third Expert Report. Available online: https://www.wcrf.org/dietandcancer/recommendations/limit-sugar-sweetened-drinks (accessed on 15 December 2020).
- Heyman, M.B.; Abrams, S.A. Fruit Juice in Infants, Children, and Adolescents: Current Recommendations. Am. Acad. Pediatrics 2017, 139, 20170967. [Google Scholar] [CrossRef] [PubMed]
- Salas, M.M.S.; Nascimento, G.G.; Vargas-Ferreira, F.; Tarquinio, S.B.C.; Huysmans, M.C.D.N.J.M.; Demarco, F.F. Diet influenced tooth erosion prevalence in children and adolescents: Results of a meta-analysis and meta-regression. J. Dent. 2015, 43, 865–875. [Google Scholar] [CrossRef] [PubMed]
- Pan, A.; Malik, V.S.; Schulze, M.B.; Manson, J.A.E.; Willett, W.C.; Hu, F.B. Plain-water intake and risk of type 2 diabetes in young and middle-aged women. Am. J. Clin. Nutr. 2012, 95, 1454–1460. [Google Scholar] [CrossRef] [PubMed]
- Aune, D.; Giovannucci, E.; Boffetta, P.; Fadnes, L.T.; Keum, N.N.; Norat, T.; Greenwood, D.C.; Riboli, E.; Vatten, L.J.; Tonstad, S. Fruit and vegetable intake and the risk of cardiovascular disease, total cancer and all-cause mortality-A systematic review and dose-response meta-analysis of prospective studies. Int. J. Epidemiol. 2017, 46, 1029–1056. [Google Scholar] [CrossRef] [PubMed]
- World Health Organization. Obesity and Overweight. Available online: https://www.who.int/news-room/fact-sheets/detail/obesity-and-overweight (accessed on 23 January 2020).
- Wild, S.; Bchir, M.B.; Roglic, G.; Green, A.; Sci, M.; Sicree, R.; King, H. Global Prevalence of Diabetes Estimates for the year 2000 and projections for 2030. Diabetes Care 2004, 27, 1047–1053. [Google Scholar] [CrossRef] [PubMed]


| Breast Cancer (Breast, Pre- and Post-Menopausal) | |||||||||||
|---|---|---|---|---|---|---|---|---|---|---|---|
| Source | Country, Study Name | Cancer Type | Study Design | Population Follow-Up (Years) | Cases | Age (Mean/SD or Range) | Sex (%) | Dietary Assessment Method | Type and Amount of Beverages Intake + | HR/RR/OR (95% CI) | Adjustments |
| Chandran et al., 2006 [57] | US, WCHS | Breast | PB case-control | 3148 | 1558 | 20–75 | F (100) | 125-item FFQ | SSB: ≥152 vs. <152 mL/day | OR: 0.97 (0.74–1.27) (AA) OR:1.31 (0.91–1.89) (EA) OR: 1.17 (0.79–1.74) (AA) OR: 0.95 (0.58–1.56) (EA) OR: 0.76 (0.51–1.12) (AA) OR: 2.05 (1.13–3.7) (EA) | Age, ethnicity, country, education, age at menarche, menopause and first birth, MS, parity, BF status, history of benign breast disease, family history of BC, HRT, OC use, BMI, and study site. |
| Pre-M | 797 | SSB: ≥152 vs. <152 mL/day | |||||||||
| Post-M | 761 | SSB: ≥152 vs. <152 mL/day | |||||||||
| Chazelas et al., 2019 [23] | France, NNS | Breast | Cohort | 101,257 5.1 (median) | 693 | 42.2/14.4 | F (78) | 24H-DR | SFJ: >123 vs. <38.1 mL/day (cut-off) SFJ: increase by 100 mL/day SSB: >57.1 vs. <13.6 mL/day (cut-off) SSB: increase by 100 mL/day ASB: >11.6 vs. <4.6 mL/day (cut-off) ASB: increase by 10 mL/day FJ: >81.9 vs. <17.0 mL/day (cut-off) FJ: increase by 100 mL/day SFJ: >123 vs. <38.1 mL/day (cut-off) SFJ: increase by 100 mL/day SSB: >57.1 vs. <13.6 mL/day (cut-off) SSB: increase by 100 mL/day ASB: >11.6 vs. <4.6 mL/day (cut-off) ASB: increase by 10 mL/day FJ: >81.9 vs. <17.0 mL/day (cut-off) FJ: increase by 100 mL/day SFJ: >123 vs. <38.1 mL/day (cut-off) SFJ: increase by 100 mL/day SSB: >57.1 vs. <13.6 mL/day (cut-off) SSB: increase by 100 mL/day ASB: >11.6 vs. <4.6 mL/day (cut-off) ASB: increase by 10 mL/day FJ: >81.9 vs. <17.0 mL/day (cut-off) FJ: increase by 100 mL/day | HR: 1.37 (1.08–1.73) HR: 1.22 (1.07–1.39) HR: 1.10 (0.87–1.39) HR: 1.23 (1.03–1.48) HR: 1.33 (0.98–1.75) HR: 0.97 (0.86–1.09) HR: 1.13 (0.91–1.39) HR: 1.15 (0.97–1.35) HR: 1.28 (1.09–1.83) HR: 1.26 (1.04–1.51) HR: 1.68 (1.45–1.74) HR: 1.34 (1.15–1.70) HR: 1.23 (0.52–2.53) HR: 0.95 (0.81–1.13) HR: 0.98 (0.67–1.43) HR: 1.10 (0.85–1.41) HR: 1.44 (1.05–1.99) HR: 1.19 (0.98–1.44) HR: 0.99 (0.72–1.39) HR: 1.08 (0.79–1.47) HR: 1.10 (0.55–2.12) HR: 1.01 (0.86–1.18) HR: 1.24 (0.95–1.61) HR: 1.19 (0.96–1.48) | Smoking, education, PA, BMI, and height. |
| Pre-M | 283 | ||||||||||
| Post-M | 410 | ||||||||||
| Hirvonen et al., 2006 [51] | France, SUVIMAX | Breast | Cohort | 4396 6.6 | 95 | 35–60 | F (100) | 24H-DR | FJ: >150 mL/day vs. none | RR: 1.29 (0.80–2.09) | Age, smoking, number of children, OC use, family history of BC, and MS. |
| Makarem et al., 2018 [52] | US | Breast | Cohort | 3184 4 | 128 | 54.3 | F (53) | FFQ | SFJ: >324 vs. <135 mL/day (cut-off) SSB: >51.4 mL/day vs. none FJ: >180 vs. <38.6 mL/day (cut-off) | HR: 1.00 (0.65–1.57) HR: 1.04 (0.64–1.71) HR: 1.03 (0.67–1.62) | Age, smoking, BMI, EI, alcohol, PA, education, MS, nº of live births, WC, DM and CVD, antioxidant use, energy from fat, and diet soda intake. |
| Marzbani et al., 2019 [58] | Iran | Breast | HB case-control | 620 | 212 | 40.2 | F (100) | 11-item healthcare form | SB 7: favorable intake vs. ≤1 time/month | OR: 2.8 (1.9–4.3) | Age, education, and BMI |
| McLaughlin et al., 1992 [69] | US | Breast | PB case-control | 3234 | 1617 | 56.7 | F (100) | SQ-interview | SB 2: ever vs. never | OR: 1.08 (0.92–1.26) | Age, alcohol, country, race, MS, age at first live birth, diagnosis of benign cancers, and family history of BC. |
| Potischman et al., 2002 [80] | US | Breast | PB case-control | 2019 | 568 | 20–44 | F (100) | 100-item FFQ | SSB: ≥320 mL/day vs. none | OR: 1.09 (0.8–1.5) | Age at diagnosis, study site, race, education, alcohol consumption, years of OC use, smoking, BMI, and EI. |
| Romanos-Nanclares et al., 2019 [53] | Spain | Breast | Cohort | 10,713 2 | 100 | 33.0 (median) | F (100) | FFQ | SSB: >47.1 vs. <11 mL/day | HR: 1.36 (0.74–2.50) | Age, height, family history of BC, smoking, PA, BMI, age at menarche and menopause, MS, HRT, number of pregnancies >6 month and before 30 years old, months of BF, alcohol, education, DM, GI, EI, U-P food and coffee consumption, and Med-diet adherence. |
| Pre-M | 57 | SSB: ≥11 mL/day vs. none | HR: 1.16 (0.66–2.07) | ||||||||
| Post-M | 43 | SSB: >47.1 vs. <11 mL/day | HR: 2.12 (1.01–4.41) | ||||||||
| Hodge et al., 2018 [54] | Australia, MCCS | Post-M | Cohort | 35,593 19 | 946 | 54.6 | F (100) | 121-item FFQ | SSB: ≥200 vs. <6.7 mL/day ASB: ≥200 vs. <6.7 mL/day | HR: 1.11 (0.85–1.45) HR: 0.95 (0.73–1.25) | Socioeconomic indexes, country of birth, alcohol intake, smoking, PA, Med-diet score, and sex. ASB also for SSB consumption and WC. |
| Nomura et al., 2016 [55] | US, BWHS | Breast Pre-M Post-M | Cohort | 49,103 13.8 | 1827 678 826 | 21–69 | F (100) | FFQ | SSB: ≥250 mL/day vs. none SSB: ≥250 mL/day vs. none SSB: ≥250 mL/day vs. none | HR: 0.71 (0.50–1.02) HR: 1.72 (0.91–3.23) HR: 1.11 (0.77–1.61) | Age, geographic region of residence, EI, smoking, family history of BC, education, MS, OC use, parity, HRT, BMI, alcohol, PA, and sedentary time. |
| Colorectal and Rectal Cancer | |||||||||||
| Source | Country, Study Name | Cancer Type | Study Design | Population Follow-Up (Years) | Cases | Age (Mean/SD or Range) | Sex (%) | Dietary Assessment Method | Type and Amount of Beverages Intake + | HR/RR/OR (95% CI) | Adjustments |
| Bener et al., 2010 [88] | Qatar | Colorectal | HB case-control | 428 | 146 | 53.4 | M (58) | DQ | SB: ≥330 vs. ≤47.1 mL/day | OR: 1.62 (1.19–2.17) | Not reported |
| Chazelas et al., 2019 [23] | France | Colorectal | Cohort | 101,257 5.1 (median) | 166 | 42.2 (14.4) | F (78) | 24H-DR | SFJ: >123 vs. <38.1 mL/day (F); >141.7 vs. <46.1 mL/day (M) (cut-off) increase by 100 mL/day SSB: >57.1 vs. <13.6 mL/day (F); >65.5 vs. < 14.0 mL/day (M) (cut-off) increase by 100 mL/day ASB: >11.6 vs. <4.6 mL/day (F); >7.9 vs. < 2.7 mL/day (M) (cut-off) increase by 10 mL/day FJ: >81.9 vs. <17.0 mL/day (F); >97.8 vs. <19.9 mL/day (M) (cut-off) increase by 100 mL/day | HR: 1.07 (0.63–1.80) | Smoking, education, PA, BMI, and height. |
| HR: 1.10 (0.84–1.46) | |||||||||||
| HR: 1.01 (0.59–1.71) | |||||||||||
| HR: 1.11 (0.72–1.71) | |||||||||||
| HR: 0.80 (0.44–1.46) | |||||||||||
| HR: 1.02 (0.94–1.10) | |||||||||||
| HR: 1.19 (0.78–1.82) | |||||||||||
| HR: 1.05 (0.75–1.46) | |||||||||||
| Hodge et al., 2018 [54] | Australia, MCCS | Colorectal | Cohort | 35,593 19 | 1055 | 54.6 | M/F | 121-item FFQ | SSB: ≥200 vs. <6.7 mL/day ASB: ≥200 vs. <6.7 mL/day | HR: 1.28 (1.04–1.57) HR: 0.79 (0.60–1.06) | Socioeconomic indexes, country, alcohol, smoking, PA, Med-diet score, and sex. ASB also for SSB consumption and WC. |
| Makarem et al., 2018 [52] | US | Colorectal | Cohort | 3184 4 | 68 | 54.3 | F (53) | FFQ | SFJ: >362.6 vs. <154.3 mL/day (cut-off) SSB: >180 vs. <25.7 mL/day (cut-off) FJ: >180 vs. < 48.9 mL/day (cut-off) | HR: 1.39 (0.68–2.82) HR: 0.96 (0.51–1.82) HR: 1.66 (0.88–3.12) | Age, smoking, BMI, EI, alcohol, PA, education, MS, nº of live births, WC, DM and CVD, antioxidant use, energy from fat, and diet soda intake. |
| Mahfouz et al., 2014 [89] | Egypt | Colorectal | HB case-control | 450 1 | 150 | <20–>60 | F (52) | DQ | SB: daily vs. not daily FJ: daily vs. not daily | OR: 4.6 (1.9–11.01) OR: 0.18 (0.09–0.36) | Not reported |
| Pacheco et al., 2019 [56] | US | Colorectal | Cohort | 99,798 20.1 (median) | 1318 | 52.0 (13.5) | F (100) | FFQ | SSB: ≥60 mL/day vs. never/rare | HR: 1.14 (0.86–1.53) | Age, BMI, EI, smoking, alcohol, family history of CR polyps, multivitamin use, and HT. |
| Tayyem et al., 2018 [90] | Jordan | Colorectal | HB case-control | 501 2 | 220 | 52 | F (51) | Q-DQ | SB: daily vs. rarely OJ: daily vs. rarely | OR: 1.39 (0.73–2.63) OR: 1.07 (0.45–2.55) | Age, sex, work status, income, PA, marital status, EI, education, other diseases, and history of CR cancer. |
| Theodoratou et al., 2014 [91] | Scotland | Colorectal | PB case-control | 4838 7.0 | 2062 | 64.3 | M/F | FFQ | SSB: increase by 330 mL/day FJ: increase by 200 mL/day | OR: 1.12 (1.05–1.19) OR: 1.19 (1.11–1.27) | Age, sex, BMI, PA, family history of CR cancer, EI, NSAIDs, eggs, FJ, SSB, white fish, coffee, and magnesium intake. |
| Murtaugh et al., 2004 [92] | US | Rectal | PB case-control | 2157 4 | 952 | 30–79 | M (57) | Interview | SSB: yes vs. no (M) SSB: yes vs. no (F) ASB: yes vs. no (M) ASB: yes vs. no (F) J: >449 vs. ≤58.3 mL/day (M); J: >596.6 vs. ≤44.6 mL/day (F) | OR: 1.00 (0.80–1.26) OR: 0.96 (0.73–1.27) OR: 1.28 (0.98–1.68) OR: 0.90 (0.67–1.22) OR: 0.92 (0.63–1.34) OR: 1.56 (1.00–2.41) | Age, PA, EI, and dietary fiber and calcium intake. |
| Esophageal Cancers (Esophagus-Gastric Junction, Esophageal Adenocarcinoma, Squamous Cell Carcinoma) | |||||||||||
| Source | Country, Study Name | Cancer Type | Study Design | Population Follow-Up (Years) | Cases | Age (Mean/SD or Range) | Sex (%) | Dietary Assessment Method | Type and Amount of Beverages Intake + | HR/RR/OR (95% CI) | Adjustments |
| Ibiebele et al., 2008 [93] | Australia | AEGJ | PB case-control | 2341 4 | 325 | 18–79 | M (71) | FF | SB 7: ≥375 mL/day vs. none SSB 7: yes vs. no ASB 7: yes vs. no SB 7: ≥375 mL/day vs. none SSB 7: yes vs. no ASB 7: yes vs. no SB 7: ≥375 mL/day vs. none SSB 7: yes vs. no ASB 7: yes vs. no | OR: 1.07 (0.67–1.73) OR: 0.63 (0.43–0.92) OR: 0.77 (0.46–1.29) OR: 0.94 (0.53–1.66) OR: 1.20 (0.79–1.81) OR: 0.71 (0.37–1.37) OR: 0.40 (0.20–0.78) OR: 0.70 (0.47–1.03) OR: 0.46 (0.25–0.85) | Age, sex, BMI, EI, alcohol, smoking, education, heartburn, and acid reflux symptoms. |
| EAC | 294 | ||||||||||
| SCC | 238 | ||||||||||
| Mayne et al., 2006 [59] | US | EAC | PB case-control | 1782 | 228 | 65 Q1, 59.3 Q4 | M (78 Q1, 82 Q4) | Proxy and self-interviewed | SSB 7: ≥355 vs. 10.7 mL/day | OR: 0.47 (0.29–0.76) | Age, sex, center, race, proxy interview status, BMI, EI, alcohol and meat intake, cigarettes/day, education, income, and frequency of reflux symptoms. |
| SCC | 206 | SSB 7: ≥355 vs. 10.7 mL/day | OR: 0.85 (0.48–1.52) | ||||||||
| Ren et al., 2010 [34] | US, NIH-AARP-DHS | EAC | Cohort | 481,563 2 | 305 | 50–71 | M (59) | 124-item FFQ | SB: ≥355 vs. ≤355 mL/day | HR: 1.11 (0.66–1.85) | Age, sex, smoking, alcohol, EI, BMI, education, ethnicity, PA, and daily intake of fruit, vegetables, red meat, and white meat. |
| SCC | 123 | SB: ≥355 vs. ≤355 mL/day | HR: 0.85 (0.46–1.56) | ||||||||
| Stomach Cancers (Gastric Cardia, Gastric Noncardia) | |||||||||||
| Source | Country, Study Name | Cancer Type | Study Design | Population Follow-Up (Years) | Cases | Age (Mean/SD or Range) | Sex (%) | Dietary Assessment Method | Type and Amount of Beverages Intake + | HR/RR/OR (95% CI) | Adjustments |
| Hodge et al., 2018 [54] | Australia, MCCS | Gastric cardia | Cohort | 35,593 19 | 165 | 54.6 | M/F | 121-item FFQ | SSB: ≥200 vs. <6.7 mL/day ASB: ≥200 vs. 6.7 mL/day | HR: 1.17 (0.73–1.89) HR: 1.03 (0.53–1.98) | Socioeconomic indexes, country, alcohol, smoking, PA, Med-diet score, and sex. ASB also for SSB consumption and WC. |
| Mayne et al., 2006 [59] | US | Gastric cardia Gastric noncardia | PB case-control | 1782 | 255 | 65 Q1, 59.3 Q4 | M (78 Q1, 82 Q4) | Proxy and self-interviewed | SSB 7: ≥355 vs. <10.7 mL/day | OR: 0.74 (0.46–1.16) | Age, sex, center, race, proxy interview status, BMI, EI, alcohol and meat intake cigarettes/day, education, incomes, and frequency of reflux symptoms. |
| 352 | SSB 7: ≥355 vs. <10.7 mL/day | OR: 0.65 (0.43–0.98) | |||||||||
| Ren et al., 2010 [34] | US, NIH-AARP-DHS | Gastric cardia Gastric noncardia | Cohort | 481,563 2 | 231 | 50–71 | M (59) | 124-item FFQ | SB: ≤355 vs. ≥355 mL/day | HR: 0.89 (0.55–1.45) | Age, sex, smoking, alcohol, EI, BMI, education, ethnicity, PA and daily intake of fruit, vegetables, and white meat. |
| 224 | SB: ≥355 vs. ≤355 mL/day | HR: 0.75 (0.45–1.24) | |||||||||
| Pancreatic Cancer | |||||||||||
| Source | Country, Study Name | Cancer Type | Study Design | Population Follow-Up (Years) | Cases | Age (Mean/SD or Range) | Sex (%) | Dietary Assessment Method | Type and Amount of Beverages Intake + | HR/RR/OR (95% CI) | Adjustments |
| Bao et al., 2008 [42] | US, NIH-AARP-DHS | Pancreatic | Cohort | 487,922 7.2 | 1258 | 50–71 | F (41) | 124-item FFQ | SB: 816.9 mL/day (median) vs. none SSB: 512.8 mL/day (median) vs. none ASB: 816.9 mL/day (median) vs. none | RR: 1.07 (0.86–1.33) RR: 1.01 (0.77–1.31) RR: 1.11 (0.86–1.44) | Age, sex, race, education, BMI, alcohol, smoking, PA, EI, and foliate intake. SSB and ASB were mutually adjusted. |
| Chan et al., 2009 [76] | US, SFB | Pancreatic | PB case-control | 2233 | 532 | 21–85 | M (53) | 131-item FFQ | SB: ≥355 mL/day vs. none SB 7: ≥355 mL/day vs. none SSB 7: ≥355 mL/day vs. none ASB 7: ≥355 mL/day vs. none SSB 4: ≥355 mL/day vs. none | OR: 1.0 (0.7–1.3) OR: 1.1 (0.8–1.5) OR: 0.9 (0.6–1.3) OR: 1.5 (1.1–2.1) OR: 1.0 (0.6–1.8) | Age, sex, EI, BMI, race, education, smoking, history of DM, PA, red and white meat, fruit and vegetables, eggs, dairy, whole and refine grained, and sweets. SSB and ASB were mutually adjusted. |
| Gallus et al., 2011 [77] | Italy | Pancreatic | HB case-control | 978 7 | 326 | 63 (median) | M (53) | FFQ | SB 7: ≥150 vs. <150 mL/day | OR: 1.02 (0.72–1.44) | Age, sex, study center, education, BMI, smoking, alcohol, EI, family history of pancreatic cancer, and DM. |
| Gold et al., 1985 [78] | US | Pancreatic | HB, PB case-control | 676 | 274 | 66.1 | F (53) | Interview | ASB: ever vs. never | OR: 0.66 (0.38–1.2) | Religion, occupation, smoking, and alcohol. |
| Larsson et al., 2006 [41] | Sweden, SMC, COSM | Pancreatic | Cohort | 77,797 7.2 | 131 | 60.8 | F (45) | FFQ | SB: ≥500 mL/day vs. none | HR: 1.93 (1.18–3.14) | Age, sex, education, smoking, BMI, and EI. |
| Lyon et al., 1992 [79] | US | Pancreatic | PB case-control | 512 | 149 | 40–79 | M/F | DQ | SB (caff): ever vs. never | OR: 1.31 (0.89–1.94) | Unadjusted. |
| Mack et al., 1986 [81] | US | Pancreatic | PB case-control | 980 | 490 | 18–65 | M (58) | Proxy and direct Interview | SB 7: ≥1650 vs. <1320 mL/day | RR: 2.6 (0.9–7.4) | Not reported |
| Mueller et al., 2010 [43] | China and Singapore, SCHS | Pancreatic | Cohort | 60,524 14 | 140 | 56.5 | F (56) | FFQ | SB: ≥67.7 mL/day vs. none J 5: ≥67.7 mL/day vs. none | HR: 1.87 (1.10–3.15) HR: 1.31 (0.74–2.30) | Age, sex, smoking, BMI, alcohol, EI, PA, DM, education, added sugar, and candy. SB and J were mutually adjusted. |
| Nothlings et al., 2007 [44] | US | Pancreatic | Cohort | 162,150 8 | 434 | 59.8 | F (55) | FFQ | SSB: ≥151.4 mL/2000 kcal/day vs. none FJ: ≥120 vs. < 9.4 mL/2000 kcal/day | RR: 1.07 (0.82,1.41) RR: 1.08 (0.83,1.41) | Age, sex, smoking, BMI, EI, time on study, race, family history of pancreatic cancer, intake of red, and processed meat. |
| Navarrete-Muñoz et al., 2016 [45] | 10 European countries †, EPIC | Pancreatic | Cohort | 477,206 11.4 | 865 | 51 | F (70) | DQ- country specific | SB: >196.4 vs. 0.1–13.1 mL/day SB: increase by 100 mL/day SSB: >121.4 vs. 0.1-4.5 mL/day SSB: increase by 100 mL/day ASB: >92.2 vs. 0.1-2.0 mL/day ASB: increase by 10 mL/day FJ 6: >123.1 vs. 0.1-8.3 mL/day FJ 6: increase by 100 mL/day | HR: 0.90 (0.68–1.19) HR: 1.02 (0.98–1.06) HR: 0.90 (0.65–1.25) HR: 1.02 (0.97–1.08) HR: 0.99 (0.61–1.60) HR: 1.02 (0.96–1.08) HR: 0.74 (0.57–0.97) HR: 0.91 (0.84–0.98) | Age, sex, smoking, BMI, alcohol, EI, study center, PA, and DM. FJ and SB were mutually adjusted. |
| Schernhammer et al., 2005 [46] | US, HPFS, NHS | Pancreatic | Cohort | 136,587 14 HPFS, 20 NHS | 379 | 53.7 | F (65) | FFQ | SSB: <143.6 vs. > 11.2 mL/day ASB: <143.6 vs. > 11.2 mL/day | RR: 1.13 (0.81–1.58) RR: 1.02 (0.79–1.32) | Age, sex, smoking, BMI, follow-up cycle, PA, DM, and other soft drink intake. |
| Genitourinary Cancers (Prostate, Renal Cell, Urinary Bladder, Urothelial Cell) | |||||||||||
| Source | Country, Study Name | Cancer Type | Study Design | Population Follow-Up (Years) | Cases | Age (Mean/SD or Range) | Sex (%) | Dietary Assessment Method | Type and Amount of Beverages Intake + | HR/RR/OR (95% CI) | Adjustments |
| Bruemmer et al., 1997 [60] | US | Bladder | PB case-control | 620 | 215 | 45–65 | M (62) | Interview | SSB: >240 vs. < 8 mL/day | OR: 0.4 (0.2–1.1) (M) OR: 5.7 (1.2–26.9) (F) OR: 1.6 (0.7–3.6) (M) OR: 2.3 (0.8–6.3) (F) | Age, country, and smoking. |
| ASB: >240 < 8 mL/day | |||||||||||
| De Stefani et al., 2007 [61] | Uruguay | Bladder | HB case-control | 756 | 255 | 30–89 | M (88) | 64-item FFQ | SB: ≥142 vs. <142 mL/day | OR: 1.1 (0.7–1.7) | Age, sex, residence, education, familiar history of UBC, BMI, occupation, smoking, intake of mate, coffee, tea, and milk. |
| Hemelt et al., 2010 [62] | China | Bladder | HB case-control | 792 3 | 400 | 65.8 | M (79) | DQ | SB: consumers vs. none FJ: daily vs. none | OR: 2.01 (1.10–3.68) OR: 0.66 (0.26–1.66) | Age, sex, smoking, and frequency and duration of smoking. |
| Radosavljević et al., 2003 [63] | Serbia | Bladder | HB case-control | 260 | 130 | 64.9 | M (79) | 101-item FFQ | SB: >15.7 mL/day (mean) vs. none FJ: >11.6 mL/day (mean) vs. none | OR: 4.73 (2.72–8.18) OR: 0.30 (0.18–0.50) | Smoking |
| Turati et al., 2015 [64] | Italy | Bladder | HB case-control | 1355 | 665 | 67 (median) | M (76) | DQ | SB 2: ≥47 mL/day vs. none | OR: 1.04 (0.73–1.49) | Age, sex, study center, year of interview, smoking, education, alcohol, BMI, and family history of UBC and cystitis. |
| Wang, 2013 [65] | US | Bladder | HB case-control | 2306 | 1007 | 64.4 | M (78) | FFQ | SB: ≥255.6 mL/day vs. none SSB: ≥126 mL/day vs. none ASB: ≥309.6 mL/day vs. none | OR: 1.34 (1.05–1.70) OR: 1.27 (1.02–1.58) OR: 1.06 (0.85–1.32) | Age, sex, ethnicity, EI, and smoking. |
| Chazelas et al., 2019 [23] | France | Prostate | Cohort | 101,257 5.1 (median) | 291 | 42.2/4.4 | M (100) | 24H-DR | SFJ: >141.7 vs. <46.1 mL/day (cut-off) SFJ: increase by 100 mL/day SSB: >65.5 vs. <14.0 mL/day (cut-off) SSB: increase by 100 mL/day ASB: >7.9 vs. <2.7 mL/day (cut-off) ASB: increase by 10 mL/day FJ: >97.8 vs. <19.9 mL/day (cut-off) FJ: increase by 100 mL/day | HR: 1.39 (0.96–2.02) HR: 1.10 (0.92–1.31) HR: 1.19 (0.83–1.72) HR: 1.24 (0.95–1.62) HR: 1.33 (1.01–1.75) HR: 0.57 (0.24–1.34) HR: 1.04 (0.76–1.42) HR: 0.97 (0.79–1.2) | Smoking, education, PA, BMI, and height. |
| Drake et al., 2012 [35] | Sweden, MDC | Prostate | Cohort | 8128 14.9 | 817 | 45–73 | M (100) | 168-item FFQ, 7-d menu book Interview | SSB: 297.8 mL/day (median) vs. none FJ: 200 mL/day (median) vs. none | HR: 1.13 (0.92–1.38) HR: 0.99 (0.81–1.22) | Age, year of study entry, time of data collection, EI, height, WC, PA, smoking, education, birth in Sweden, alcohol, calcium and selenium intake, and risk by death from all causes except PC. |
| Ellison et al., 2000 [36] | Canada, NCSS | Prostate | Cohort | 3400 23 | 201 | 50–84 | M (100) | FFQ | SB 2: ≥100 mL/day vs. none SB 2: ≥any vs. none | RR: 1.29 (0.74–2.26) RR:1.09 (0.78–1.35) | Age, alcohol, smoking, BMI, fiber, and EI. |
| Hodge et al., 2018 [54] | Australia, MCCS | Prostate | Cohort | 35,593 19 | 433 | 54.6 | M (100) | 121-item FFQ | SSB: ≥200 vs. <6.7 mL/day ASB: ≥200 vs. <6.7 mL/day | HR: 1.08 (0.78–1.50) HR: 0.81 (0.49–1.33) | Socioeconomic indexes, country of birth, alcohol, smoking, PA, and Med-diet score. ASB also for SSB consumption and WC. |
| Jain et al., 1998 [66] | Canada | Prostate | PB case-control | 1253 | 617 | 69.8 | M (100) | Q-DH | SB 2: >200 mL/day vs. none | OR: 0.79 (0.53–1.17) | Age, EI |
| Makarem et al., 2018 [52] | US | Prostate | Cohort | 3184 4 | 157 | 54.3 | M (100) | FFQ | SFJ: >401 vs. <212.1 mL/day (cut-off) SSB: >180 vs. <25.7 mL/day (cut-off) FJ: >180 vs. <48.9 mL/day (cut-off) | HR: 1.06 (1.03–1.09) HR: 1.38 (0.80–2.38) HR: 1.03 (1.01–1.06) | Age, smoking, BMI, EI, alcohol, PA, education, WC, DM, CVD, antioxidant use, and energy from fat and diet soda intake. |
| Miles et al., 2018 [31] | US | Prostate | Cohort | 22,720 9 | 1996 | 65.6 (5.9) | M (100) | FFQ | SSB: >183 vs. <6 mL/day (cut-off) FJ: >190 vs. <24 mL/day (cut-off) | HR: 1.21 (1.06–1.39) HR: 1.07 (0.94–1.22) | Age, sex, smoking, BMI, EI, DM, education, race, family history of PC, and PSA screens. |
| Sharpe et al., 2002 [67] | Canada | Prostate | PB case-control | 875 | 399 | 61.5 | M (100) | Interviews or DQ | SB 7: daily drank vs. never drank weekly | OR: 1.0 (0.7–1.4) | Age, ethnicity, socioeconomic status, BMI, cumulative cigarette smoking, and alcohol. |
| Hodge et al., 2018 [54] | Australia, MCCS | Renal cell | Cohort | 35,593 19 | 146 | 54.6 | M/F | 121-item FFQ | SSB: ≥200 vs. <6.7 mL/day ASB: ≥200 vs. <6.7 mL/day | HR: 1.48 (0.87–2.53) HR: 0.92 (0.46–1.84) | Socioeconomic indexes, country of birth, alcohol, smoking, PA, Med-diet score, and sex. ASB also for SSB consumption and WC |
| Hu et al., 2009 [68] | Canada | Renal cell | PB case-control | 6177 | 1138 | 20–80 | M (51) | FFQ | SB: >230 mL/day vs. none SB: increase by 230 md J: >236 vs. ≤23 mL/day J: increase by 118 mL/day | OR: 1.26 (0.96–1.67) OR: 1.05 (0.97–1.13) OR: 1.53 (1.18–1.99) OR: 1.08 (1.04–1.13) | 10-year age groups, province, education, BMI, sex, EI, smoking, intake of alcohol meat, vegetables, and fruits. |
| Lee et al., 2006 [37] | US | Renal cell | Cohort | 136,587 14 HPFS 20 NHS | 248 | 53.7 | F (65) | FFQ | SB: ≥670 vs. <47.9 mL/day SSB: increase by 335 mL/day ASB: increase by 335 mL/day FJ: increase by 335 mL/day | RR: 1.03 (0.64–1.68) RR: 0.95 (0.69–1.31) RR: 0.97 (0.82–1.15) RR: 1.06 (0.88–1.28) | BMI, EI, alcohol, smoking, history of HT, DM, multivitamin use, and parity. |
| Maclure and Willet, 1990 [70] | US | Renal cell | PB case-control | 430 | 203 | 30–>80 | M (67) | FFQ | SB: >480 vs. <68.6 mL/day ASB: >480 vs. <68.6 mL/day FJ: ≥ 480 vs. ≤ 34.3 mL/day | OR: 2.6 (1.4–4.8) OR: 2.7 (1.1–6.5) OR: 0.56 (0.22–1.4) | Age, sex, body weight/height, EI, and education |
| Ros et al., 2011 [38] | 10 European countries †, EPIC | Urothelial cell | Cohort | 233,236 9.3 | 513 | 25–70 | F (71) | DQ-country specific | SB: ≥99 vs. <8 mL/day (M); ≥20 vs. <8 mL/day (F) FJ: ≥72 vs. <8 mL/day (M); ≥79 vs. 8 mL/day (F) | HR: 1.03 (0.83–1.30) HR: 1.32 (1.05–1.66) | Smoking, EI from fat and nonfat sources. Stratified by age at entry, sex, and center. |
| Gynecological Cancers (Cervical, Endometrial, Epithelial Ovarian, Ovarian) | |||||||||||
| Source | Country, Study Name | Cancer Type | Study Design | Population Follow-Up (Years) | Cases | Age (Mean/SD or Range) | Sex (%) | Dietary Assessment Method | Type and Amount of Beverages Intake + | HR/RR/OR (95% CI) | Adjustments |
| Herrero et al., 1991 [71] | Colombia, Costa Rica, Mexico and Panama | Cervical | HB, PB case-control | 2033 | 622 | 46.5 | F (100) | FFQ | FJ: >240 vs. <0.8 mL/day | OR: 0.90 (0.7–1.2) | Age, study site, age at 1st intercourse, number of sexual partners and pregnancies, presence of HPV 16/18, interval since last Pap smear, and number of household facilities. |
| Verreault et al. 1989 [72] | US | Cervical | PB case-control | 416 | 189 | 20–74 | F (100) | 66-items FFQ | FJ: ≥ 355 vs. ≤ 48 mL/day | RR: 0.3 (0.2–0.6) | Age, education, smoking, frequency of Pap smears, use of barrier and OC, history of cervical-vaginal infection, age at first intercourse, and number of sexual partners. |
| Inoue-Choi et al., 2013 [39] | US | Endometrial type I | Cohort | 23,039 14 | 506 | 61.6 | F (100) | FFQ | SFJ: >424.3 vs. ≤55.7 mL/day SSB: >87.4 mL/day vs. none ASB: >144 mL/day vs. none FJ: >288 vs. ≤20.6 mL/day SFJ: >424.3 vs. ≤55.7 mL/day SSB: >87.4 mL/day vs. none ASB: >144 mL/day vs. none FJ: >288 vs. ≤20.6 mL/day | HR: 1.48 (1.09–2.00) HR: 1.78 (1.32–2.40) HR: 0.77 (0.59–1.01) HR: 1.16 (0.87–1.56) HR: 1.09 (0.55–2.15) HR: 1.31 (0.63–2.69) HR: 0.89 (0.48–1.68) HR: 0.97 (0.50–1.88) | Age, smoking, BMI, PA, alcohol, HRT, age at menarche and at menopause, number of live births, DM, and coffee intake. |
| Endometrial type II | 89 | ||||||||||
| Hodge et al., 2018 [54] | Australia, MCCS | Endometrial | Cohort | 35,593 19 | 167 | 54.6 | F (100) | 121-item FFQ | SSB: ≥200 vs. <6.7 mL/day ASB: ≥200 vs. <6.7 mL/day SSB: ≥200 vs. <6.7 mL/day ASB: ≥200 vs. <6.7 mL/day | HR: 1.02 (0.54–1.91) HR: 0.81 (0.42–1.55) HR: 1.35 (0.71–2.56) HR: 1.37 (0.72–2.61) | Socioeconomic indexes, country of birth, alcohol, smoking, PA, Med-diet score, and sex. ASB also for SSB consumption and WC. |
| Ovarian | 130 | ||||||||||
| King et al., 2013 [73] | US | Epithelial ovarian | PB case-control | 595 7 | 205 | >21 | F (100) | FFQ and Interview | SSB: ≥151.2 vs. <21.6 mL/2000 kcal/day SSB: increase by 360 mL/day | OR: 1.31 (0.77–2.24) OR: 1.63 (0.94–2.83) | Age, education, race, age at menarche, MS, parity, OC use, HRT, BMI, smoking, PA, DM, tubal ligation, intake of fiber, fat, and saturated fat. |
| Leung et al., 2016 [74] | Canada | Epithelial ovarian | PB case-control | 2111 11 | 524 | 40–79 | F (100) | FFQ and Interview | SB: >9.9 mL/day vs. none | OR: 0.97 (0.72–1.31) | Age, race, education, BMI, smoking, alcohol, history of ovarian/breast cancer, OC use, parity, MS, HRT, and study site. |
| Song et al., 2008 [75] | US | Epithelial ovarian | PB case-control | 2050 3 | 781 | 35–74 | F (100) | FFQ | SB 3 (caff): ≥720 mL/day vs. none SB 3 (not caff): ≥720 mL/day vs. none | OR: 1.51 (1.03–2.22) OR: 2.60 (1.25–5.39) | Age, BMI, education, smoking, race, country, years of diagnosis, number of pregnancies, OC use, hysterectomy, and family history of breast/ovarian cancer. |
| Hepatobiliary Cancers (Biliary Tract, Gallbladder, Liver) | |||||||||||
| Source | Country, Study Name | Cancer Type | Study Design | Population Follow-Up (Years) | Cases | Age (Mean/SD or Range) | Sex (%) | Dietary Assessment Method | Type and Amount of Beverages Intake + | HR/RR/OR (95% CI) | Adjustments |
| Stepien et al., 2014 [28] | 10 European countries †, EPIC | Biliary tract | Cohort | 477,206 11.4 | 236 | 51 | F (70) | DQ-country specific | SB: 282.9 mL/day vs. none FJ 1: 171.7 mL/day vs. none SB: 282.9 mL/day vs. none FJ 1: 171.7 mL/day vs. none SB: 282.9 mL/day vs. none SB: increase by 300 mL/wk SSB: increase by 330 mL/wk ASB: increase by 330 mL/wk FJ 1: 171.4 mL/day vs. none FJ 1: increase by 200 mL/wk | HR: 0.96 (0.90–1.00) HR: 0.99 (0.95–1.03) HR: 0.97 (0.90–1.06) HR: 1.04 (1.00–1.08) HR: 1.83 (1.11–3.02) HR: 1.05 (1.02–1.07) HR: 1.00 (0.95–1.06) HR: 1.06 (1.03–1.09) HR: 1.38 (0.80–2.38) HR: 1.03 (1.01–1.06) | BMI, alcohol, EI, PA, DM, and education. |
| IHBT | 66 | ||||||||||
| HCC | 191 | ||||||||||
| Larsson et al., 2016 [49] | Sweden, SMC, COSM | IHBT EHBT Gallbladder | Cohort | 70,832 13.4 | 21 127 71 | 45–83 | M (56) | 96-item FFQ | SB: ≥400 mL/day vs. none SB: ≥400 mL/day vs. none SB: ≥400 mL/day vs. none | HR: 1.69 (0.41–7.03) HR: 1.79 (1.02–3.13) HR: 2.24 (1.02–4.89) | Age, sex, education, smoking, BMI, dietary protein intake, and EI. |
| Hematologic Cancers (Leukemia, Lymphoma, Myeloma) | |||||||||||
| Source | Country, Study Name | Cancer Type | Study Design | Population Follow-Up (Years) | Cases | Age (Mean/SD or Range) | Sex (%) | Dietary Assessment Method | Type and Amount of Beverages Intake + | HR/RR/OR (95% CI) | Adjustments |
| Schernhammer et al., 2012 [24] | US, HPFS, NHS | Leukemia | Cohort | 136,587 14 HPFS 20 NHS | 339 | 53.7 | F (65) | FFQ | SSB: ≥335 mL/day vs. none ASB: ≥335 mL/day vs. none SSB: ≥335 mL/day vs. none ASB: ≥335 mL/day vs. none SSB: ≥335 mL/day vs. none ASB: ≥335 mL/day vs. none | RR: 1.06 (0.56–2.00) RR: 1.42 (1.00–2.02) RR: 1.47 (0.76–2.83) RR: 1.29 (0.89–1.89) RR: 1.34 (0.98–1.83) RR: 1.13 (0.94–1.34) | Age, BMI, EI, PA, alcohol, race, fruit and vegetables consumption, menopause, and HT. SSB were adjusted for use of ASB and vice-versa. |
| Multiple myeloma | 285 | ||||||||||
| NHL | 1324 | ||||||||||
| McCullough et al., 2014 [40] | US, CPS-II NCH | NHL | Cohort | 100,442 10 | 1196 | 47–95 | F (57) | Willett FFQ | ASB: >355 mL/day vs. none SSB: >355 mL/day vs. none | RR: 0.92 (0.73–1.17) RR: 1.10 (0.77–1.58) | Education, race, WC, PA, BMI, EI, DM, family history of cancer, HTR and NSAIDs use, cholesterol-lowering medication, intake of alcohol, read and processed meat, milk, saturated fat, fruits and vegetables, and tea and coffee. |
| Upper Aerodigestive Cancers (Larynx, Oral Cavity, Oropharyngeal Squamous Cell, Pharynx) | |||||||||||
| Source | Country, Study Name | Cancer Type | Study Design | Population Follow-Up (Years) | Cases | Age (Mean/SD or Range) | Sex (%) | Dietary Assessment Method | Type and Amount of Beverages Intake + | HR/RR/OR (95% CI) | Adjustments |
| Zvrko et al., 2008 [82] | Montenegro | Larynx | HB case-control | 216 2 | 108 | 59.9 (9.7) | M (82) | DQ | SB: yes vs. no | OR: 0.38 (0.16–0.92) | Age, sex, smoking, alcohol, coffee, diet, personal and familiar medical history, education, housing and work conditions, and exposure to toxic components. |
| Ren et al., 2010 [34] | US, NIH-AARP-DHS | Larynx Pharynx Oral cavity | Cohort | 481,563 2 | 307 178 391 | 50–71 | M (59) | 124-item FFQ | SB: ≥355 vs. ≤355 mL/day SB: ≥355 vs. ≤355 mL/day SB: ≥355 vs. ≤355 mL/day | HR: 0.82 (0.55–1.23) HR: 0.76 (0.46–1.25) HR: 0.77 (0.54–1.09) | Age, sex, smoking, alcohol drinking, BMI, EI, education, ethnicity, PA, intake of fruit, vegetables, and red and white meat. |
| Lissowska et al., 2003 [83] | Poland | Oral cavity | HB case-control | 246 | 122 | 23–80 | M (64) | 25-item DQ | FJ: >57 vs. <28.6 mL/day | OR: 0.35 (0.15–0.80) | Age, sex, residence, drinking, and smoking habit. |
| Kreimer et al., 2006 [84] | 9 countries ‡, IARC-MOCS | OOSC | HB case-control | 3402 | 1670 | NR | M/F | FFQ | FJ: height vs. low intake | OR: 0.8 (0.6–1.1) | Age, sex, country, education, BMI, smoking, chewing, and alcohol. |
| Other Cancers | |||||||||||
| Source | Country, Study Name | Cancer Type | Study Design | Population Follow-Up (Years) | Cases | Age (Mean/SD or Range) | Sex (%) | Dietary Assessment Method | Type and Amount of Beverages Intake + | HR/RR/OR (95% CI) | Adjustments |
| Vincenti et al., 2008 [85] | Italy | Cutaneous melanoma | PB case-control | 118 | 59 | 56 | F (53) | 188-item FFQ | FJ (no OJ): increase by 10 mL/day OJ: increase by 10 mL/day | RR: 0.95 (0.87–1.03) RR: 0.94 (0.88–1.00) | EI, family history of melanoma, skin type, history of sunlight exposure, and sunburns. |
| Dubrow et al., 2012 [47] | US | Glioma | Cohort | 545,771 10 | 904 | 62.8 (median) | M (60) | FFQ | SB: >720 mL/day vs. none | HR: 0.87 (0.65–1.15) | Age, sex, race, EI, height, fruit and vegetables intake, and nitrite intake from plants |
| Luqman et al., 2014 [86] | Pakistan | Lung | HB case-control | 1200 | 400 | <40–>70 | M (73) | DQ | J: yes vs. no | OR: 0.3 (0.3–0.4) | Not reported |
| Wu A. et al., 1997 [87] | US | Small intestine | PB case-control | 1034 | 36 | 30–65 | M (69) | Interview | SSB 7: daily vs. never | OR: 3.6 (1.3–9.8) | Age, ethnicity, and sex. |
| Zamora-Ros et al., 2018 [48] | 10 European countries †, EPIC | Thyroid | Cohort | 477,206 11.4 | 748 | 51 | F (70) | DQ- country specific | FJ 1: > 94 vs. < 1 mL/day FJ 1: increase by 50 mL/day | HR: 1.23 (0.98–1.53) HR: 1.02 (0.99–1.06) | Age, sex, smoking status, BMI, EI, alcohol, PA, education, center, menopausal status and type, OC use, and infertility problems. |
| Overall Cancers | |||||||||||
| Source | Country, Study Name | Cancer Type | Study Design | Population Follow-Up (Years) | Cases | Age (Mean/SD or Range) | Sex (%) | Dietary Assessment Method | Type and Amount of Beverages Intake + | HR/RR/OR (95% CI) | Adjustments |
| Bassett et al., 2020 [50] | Australia, MCCS | Non-obesity related * | Cohort | 35,109 19 | 4789 | 27–76 | F (61) | 121-item FFQ | SSB: >375 vs. none or < 12.5 mL/day ASB: >375 vs. none or < 12.5 mL/day | HR: 1.02 (0.86–1.21) HR: 1.23 (1.02–1.48) | Alcohol, country of birth, Med-diet score, PA, socio-economic position, sex, and smoking. ASB also adjusted for SSB intake. |
| Makarem et al., 2018 [52] | US | Breast, Colorectal, Prostate | Cohort | 3184 4 | 565 | 54.3 | F (53) | FFQ | SFJ: >501 vs. <73.2 mL/day SSB:>180 mL/day vs. none FJ: >216 vs. <23 mL/day (cut-off) | HR: 1.28 (0.97–1.70) HR: 1.00 (0.79–1.27) HR: 1.05 (0.80–1.38) | Age, sex, EI, alcohol, smoking, and BMI. |
| Hodge et al., 2018 [54] | Australia, MCCS | Obesity-related | Cohort | 35,593 19 | 3283 | 54.6 | F (100) | 121-item FFQ | SSB: ≥200 vs. <6.7 mL/day ASB: ≥200 vs. <6.7 mL/day | HR: 1.14 (0.93–1.39) HR: 1.00 (0.79–1.27) | Socioeconomic indexes, country of birth, alcohol, smoking, PA, Med-diet score, and sex. ASB also for SSB consumption and WC. |
| Chazelas et al., 2019 [23] | France, NNS | Breast, Colorectal, Prostate | Cohort | 101,257 5.1 (median) | 2193 | 42.2/14.4 | F (78) | 24H-DR | SFJ: >141.7 vs. <46.1 mL/day (cut-off) SFJ: increase by 100 mL/day SSB: >65.5 vs. <14.0 mL/day (cut-off) SSB: increase by 100 mL/day ASB: >7.9 vs. <2.7 mL/day (cut-off) ASB: increase by 10 mL/day FJ: >97.8 vs. <19.9 mL/day (cut-off) FJ: increase by 100 mL/day | HR: 1.30 (1.17–1.52) HR: 1.18 (1.10–1.27) HR: 1.06 (1.02–1.21) HR: 1.19 (1.08–1.32) HR: 1.00 (0.84–1.19) HR: 1.02 (0.94–1.10) HR: 1.14 (1.01–1.29) HR: 1.12 (1.03–1.23) | Smoking, education, PA, BMI, and height. |
| Cancer Type | Exposure | N° of Studies | RR (95% CI) | I2 (%) | Tau2 | p within Group + | 95% PI | |
|---|---|---|---|---|---|---|---|---|
| Cohort | Case-Control | |||||||
| Breast | SSB | 4 | 3 | 1.14 (1.01−1.30) | 0.0 | 0.0073 | 0.69 | 0.88, 1.47 |
| Breast | FJ | 3 | 0 | 1.13 (0.93−1.38) | 0.0 | 0.0017 | 0.79 | 0.52, 2.46 |
| Breast Pre-M | SSB | 3 | 2 | 1.37 (0.99−1.88) | 55.7 | 0.0358 | 0.06 | 0.68, 2.76 |
| Breast Post-M | SSB | 4 | 2 | 1.18 (0.79−1.75) | 54.8 | 0.1080 | 0.05 | 0.43, 3.23 |
| Colorectal | SSB | 4 | 0 | 1.18 (0.99−1.41) | 0.0 | 0.0039 | 0.71 | 0.82, 1.69 |
| Colorectal | FJ | 2 | 2 | 0.79 (0.16−3.87) | 88.5 | 0.8629 | <0.001 | 0.008, 73.94 |
| Colorectal * | FJ | 2 | 1 | 1.29 (0.78−2.12) | 0.0 | 0.0120 | 0.63 | 0.17, 9.81 |
| Colorectal | SB | 0 | 3 | 2.02 (0.45−9.01) | 62.9 | 0.2711 | 0.07 | 0.00, 5753.1 |
| Colorectal * | SB | 0 | 2 | 1.57 (0.74−3.35) | 0.0 | 0.0010 | 0.67 | – |
| Bladder | SB | 0 | 5 | 1.66 (0.78−3.56) | 83.4 | 0.3226 | <0.001 | 0.22, 12.37 |
| Bladder * | SB | 0 | 4 | 1.27 (0.85−1.90) | 25.3 | 0.0425 | 0.26 | 0.45, 3.60 |
| Prostate | SSB | 5 | 0 | 1.18 (1.10−1.27) | 0.0 | 0.0012 | 0.92 | 1.03, 1.35 |
| Prostate | FJ | 4 | 0 | 1.03 (1.01−1.05) | 0.0 | 0.0001 | 0.93 | 0.98, 1.09 |
| Prostate | SB | 1 | 2 | 0.97 (0.56−1.69) | 2.9 | 0.0241 | 0.36 | 0.07, 12.7 |
| Renal cell | SB | 1 | 2 | 1.44 (0.46−4.50) | 65.4 | 0.1559 | 0.056 | 0.00, 604.16 |
| Pancreatic | SB | 4 | 4 | 1.28 (0.95−1.72) | 58.6 | 0.0962 | 0.02 | 0.56, 2.90 |
| Pancreatic | SSB | 4 | 2 | 1.01 (0.92−1.11) | 0.0 | 0.0016 | 0.92 | 0.87, 1.17 |
| Pancreatic | ASB | 3 | 2 | 1.07 (0.77−1.48) | 43.6 | 0.0480 | 0.13 | 0.48, 2.36 |
Publisher’s Note: MDPI stays neutral with regard to jurisdictional claims in published maps and institutional affiliations. |
© 2021 by the authors. Licensee MDPI, Basel, Switzerland. This article is an open access article distributed under the terms and conditions of the Creative Commons Attribution (CC BY) license (http://creativecommons.org/licenses/by/4.0/).
Share and Cite
Llaha, F.; Gil-Lespinard, M.; Unal, P.; de Villasante, I.; Castañeda, J.; Zamora-Ros, R. Consumption of Sweet Beverages and Cancer Risk. A Systematic Review and Meta-Analysis of Observational Studies. Nutrients 2021, 13, 516. https://doi.org/10.3390/nu13020516
Llaha F, Gil-Lespinard M, Unal P, de Villasante I, Castañeda J, Zamora-Ros R. Consumption of Sweet Beverages and Cancer Risk. A Systematic Review and Meta-Analysis of Observational Studies. Nutrients. 2021; 13(2):516. https://doi.org/10.3390/nu13020516
Chicago/Turabian StyleLlaha, Fjorida, Mercedes Gil-Lespinard, Pelin Unal, Izar de Villasante, Jazmín Castañeda, and Raul Zamora-Ros. 2021. "Consumption of Sweet Beverages and Cancer Risk. A Systematic Review and Meta-Analysis of Observational Studies" Nutrients 13, no. 2: 516. https://doi.org/10.3390/nu13020516
APA StyleLlaha, F., Gil-Lespinard, M., Unal, P., de Villasante, I., Castañeda, J., & Zamora-Ros, R. (2021). Consumption of Sweet Beverages and Cancer Risk. A Systematic Review and Meta-Analysis of Observational Studies. Nutrients, 13(2), 516. https://doi.org/10.3390/nu13020516