Ultra-Performance Liquid Chromatography-Ion Mobility Separation-Quadruple Time-of-Flight MS (UHPLC-IMS-QTOF MS) Metabolomics for Short-Term Biomarker Discovery of Orange Intake: A Randomized, Controlled Crossover Study

 , , , , and
Abstract
:1. Introduction
2. Materials and Methods
2.1. Subjects and Study Design
2.2. Chemicals and Reagents
2.3. Sample Treatment
2.4. Instrumentation
2.4.1. UHPLC Conditions
2.4.2. IMS-QTOF Set Up
2.5. Data Processing and Statistical Analysis
2.6. Elucidation Workflow
3. Results
3.1. Participants and Experimental Setup
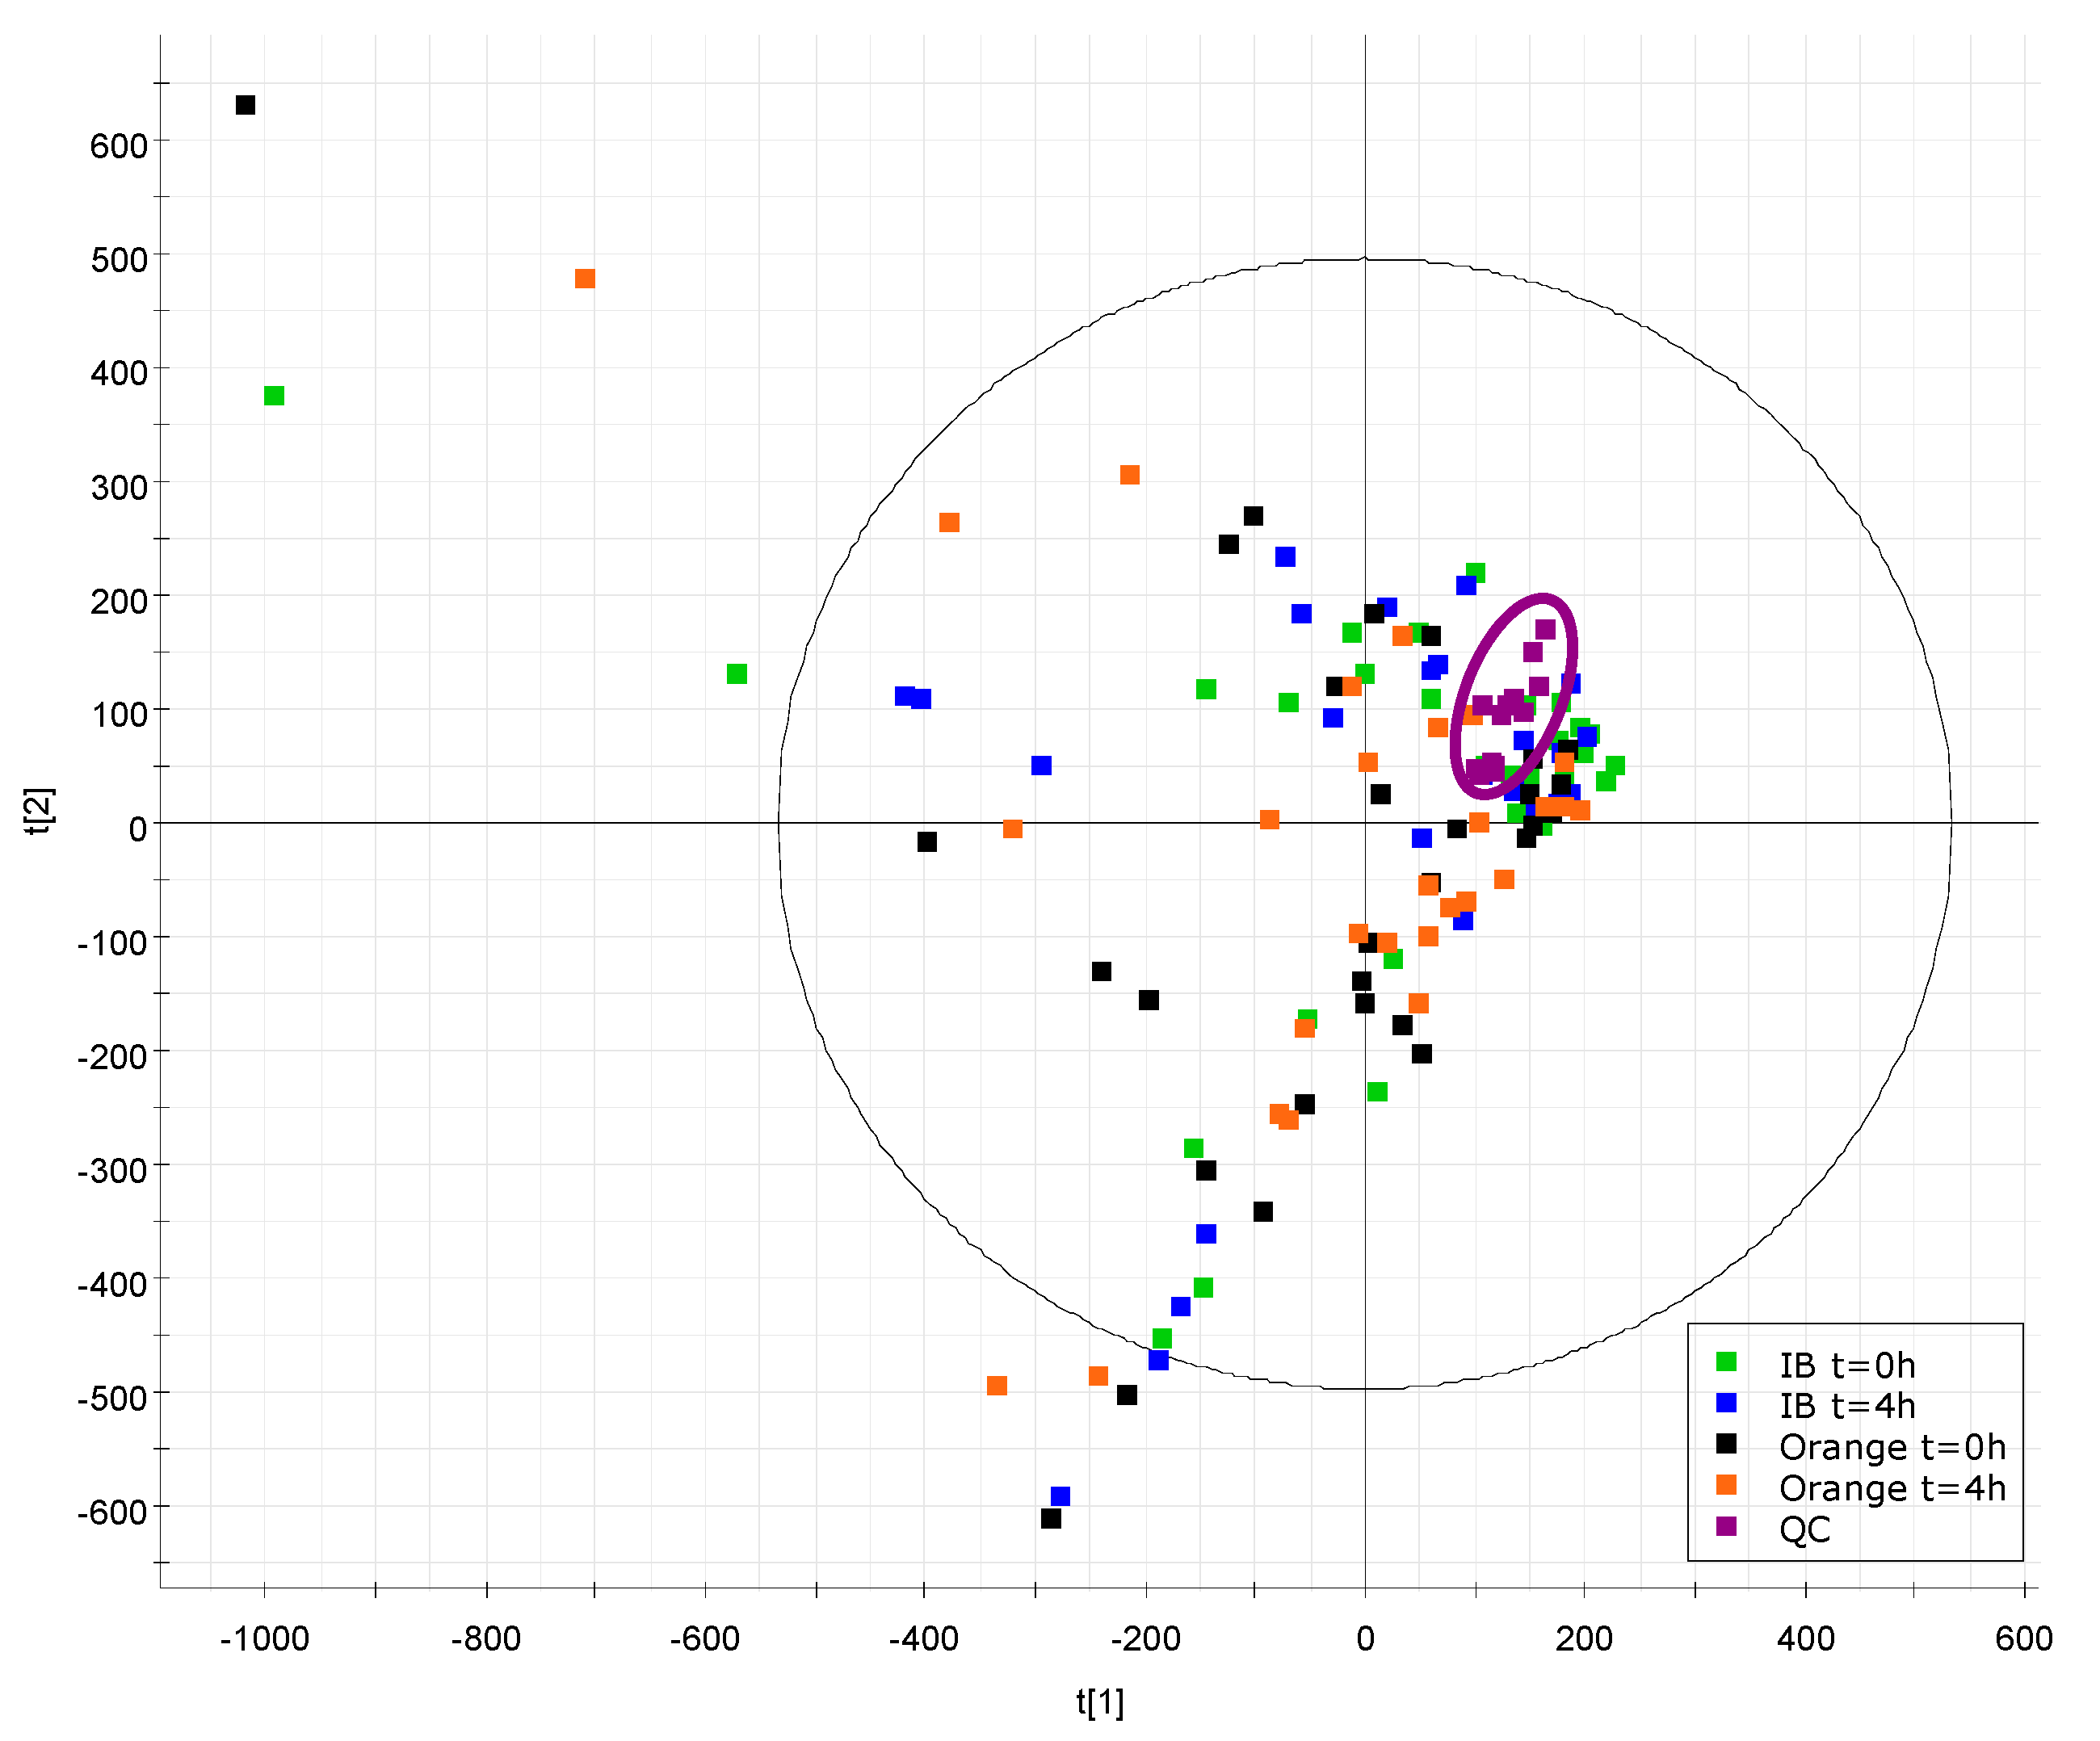
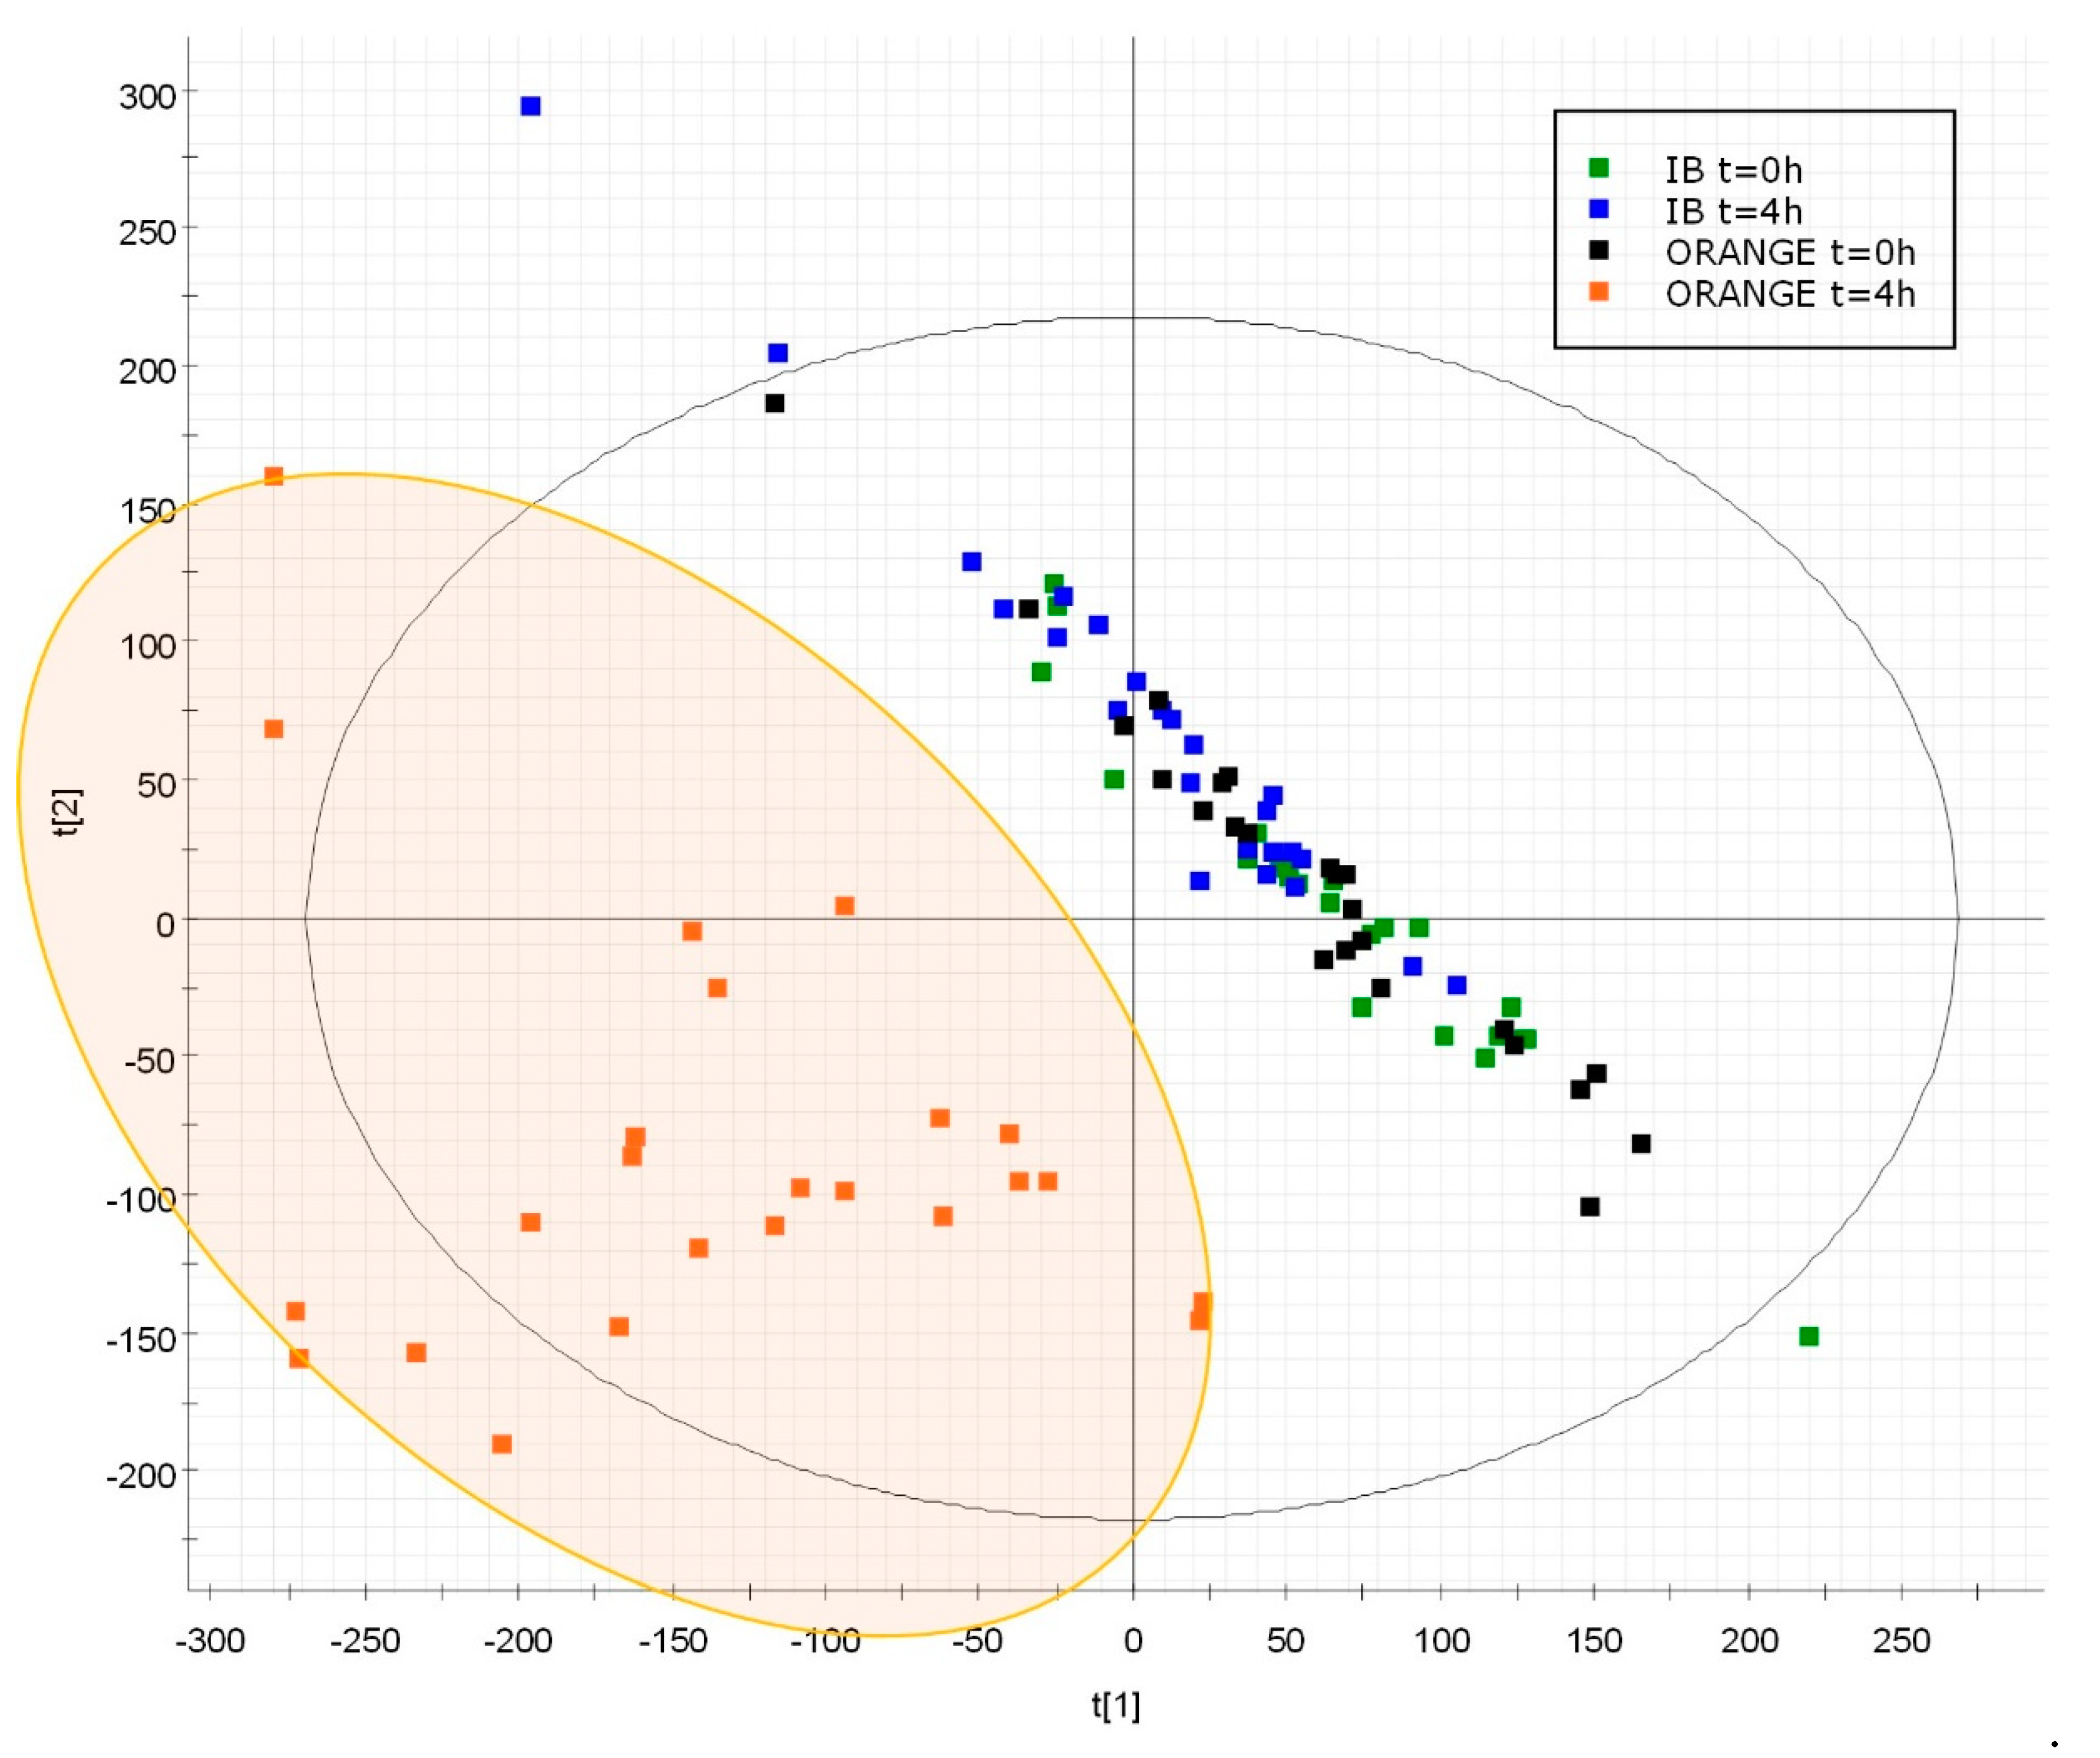
3.2. Data Processing and Analysis
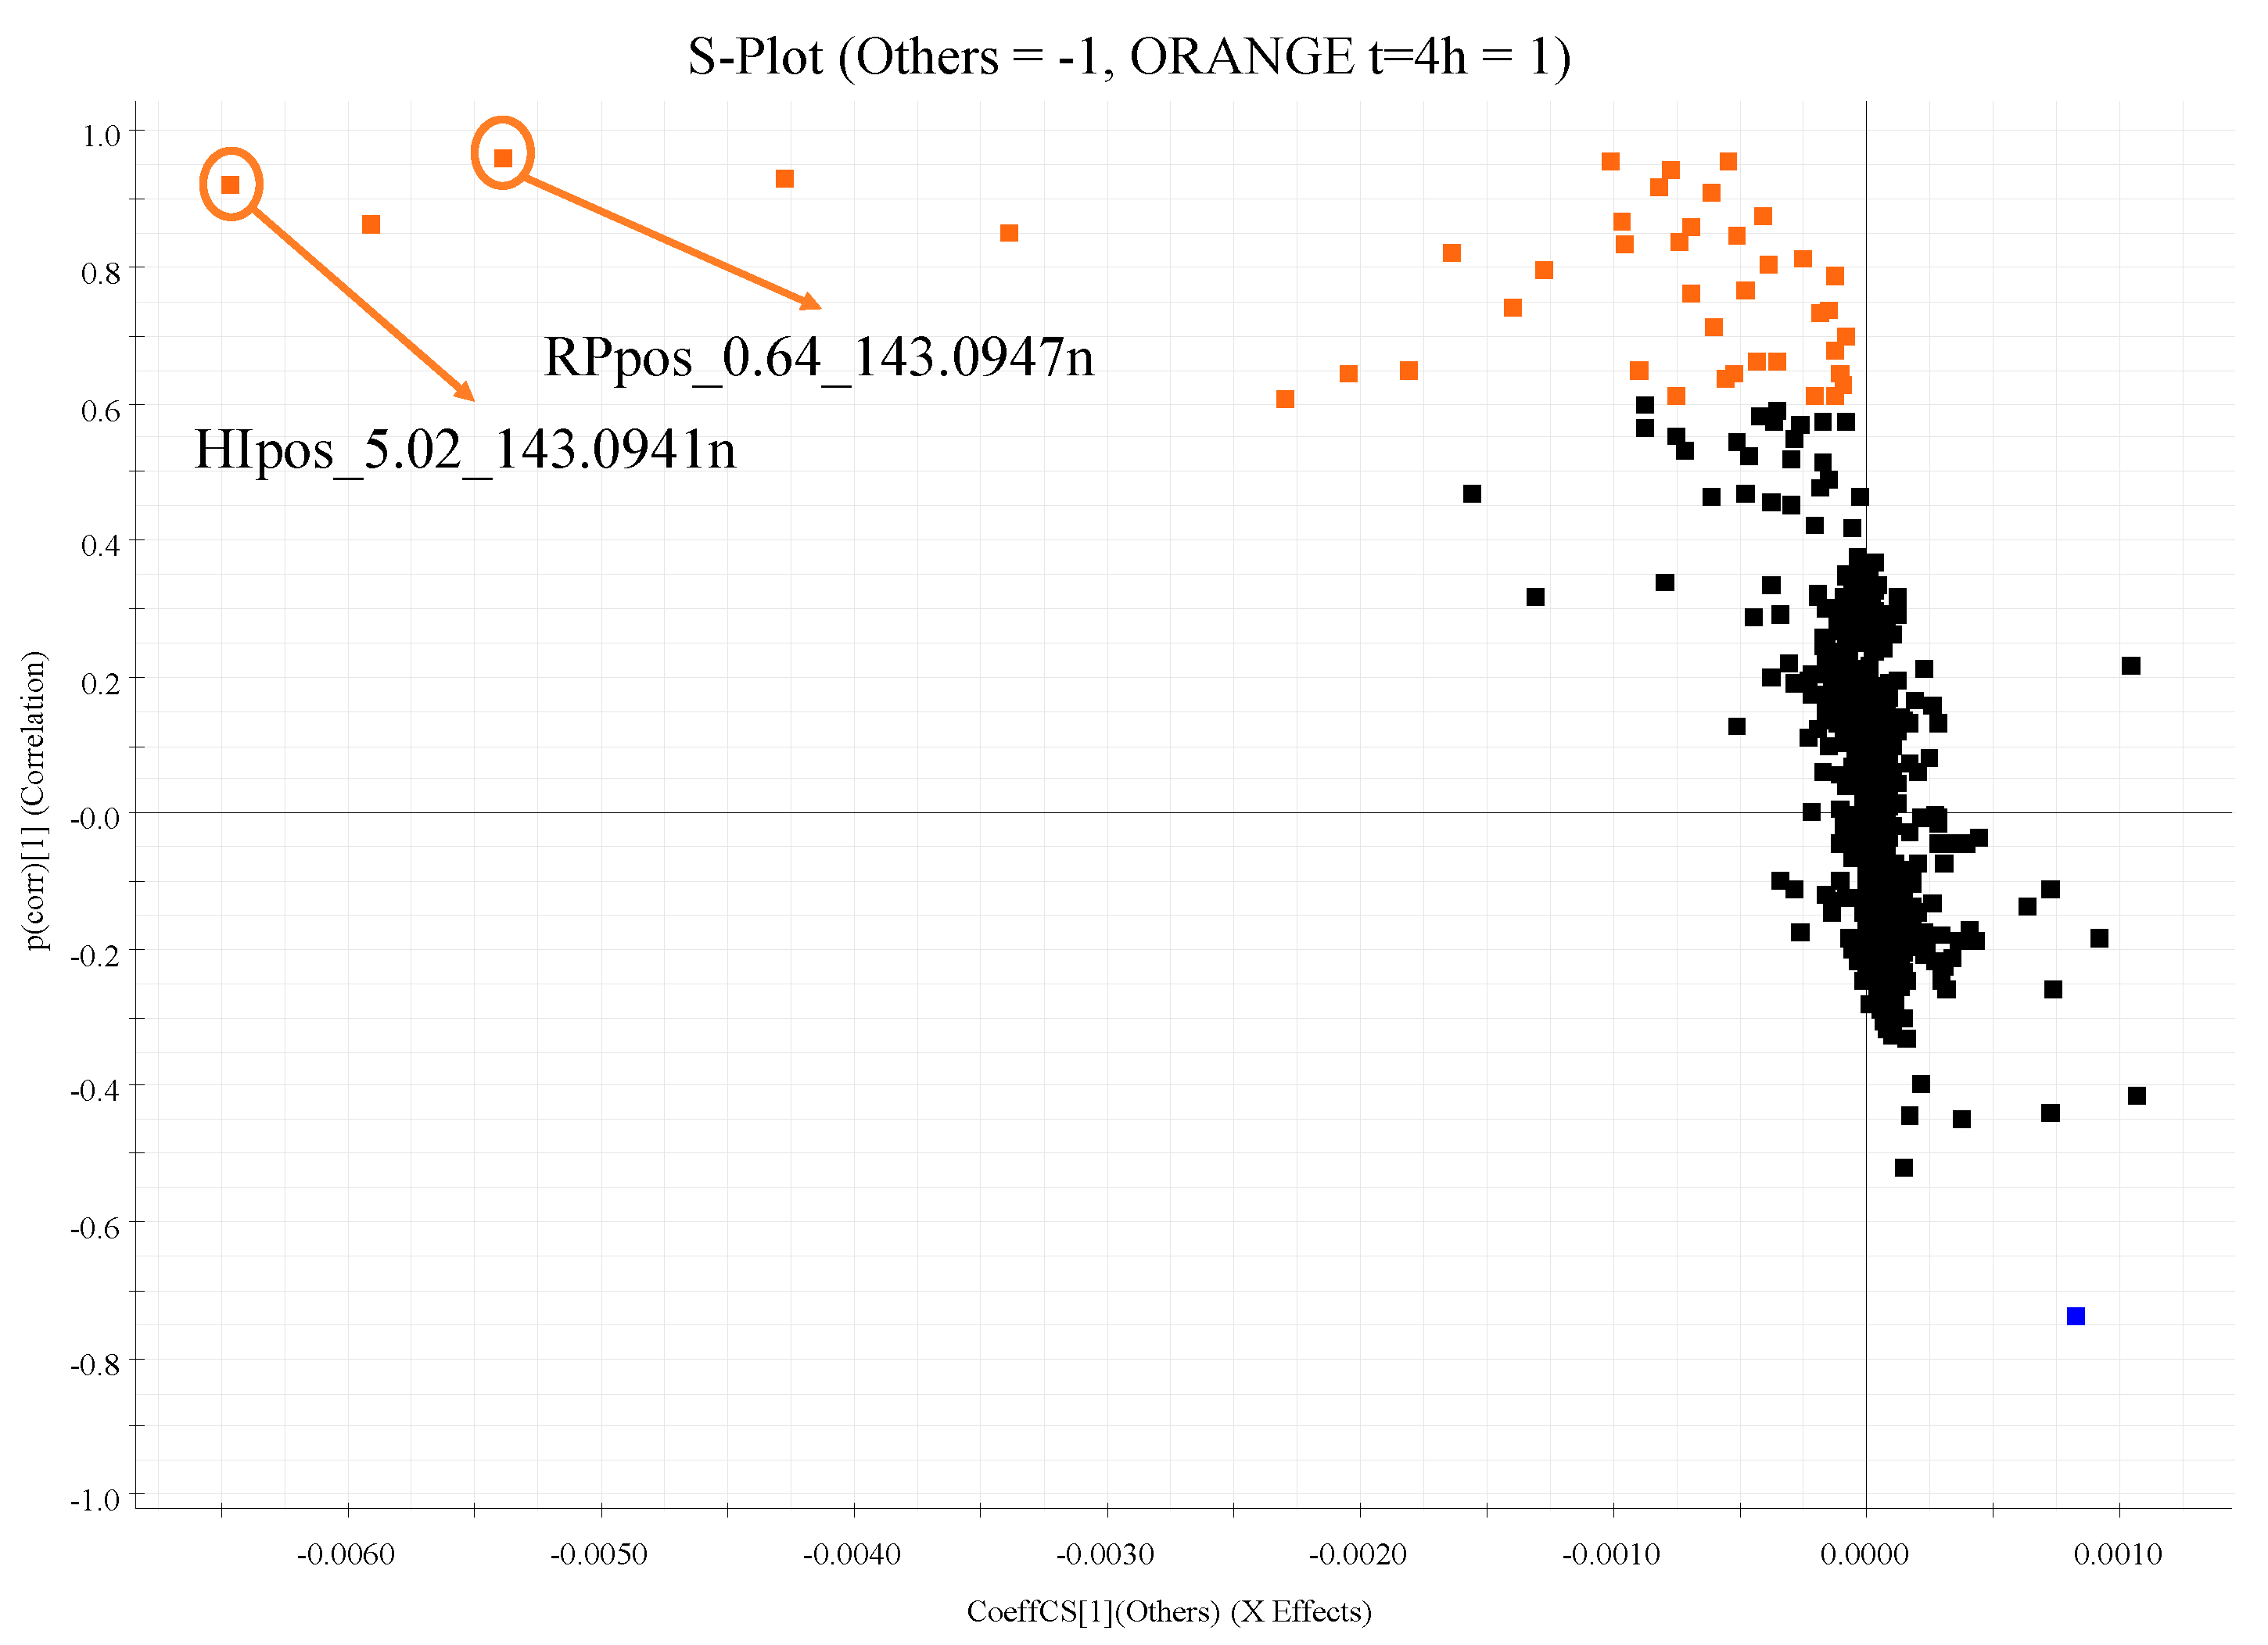
3.3. Elucidation Process
4. Conclusions
Supplementary Materials
Author Contributions
Funding
Conflicts of Interest
References
- Picó, C.; Serra, F.; Rodríguez, A.M.; Keijer, J.; Palou, A. Biomarkers of Nutrition and Health: New Tools for New Approaches. Nutrients 2019, 11, 1092. [Google Scholar] [CrossRef] [Green Version]
- Naska, A.; Lagiou, A.; Lagiou, P. Dietary assessment methods in epidemiological research: Current state of the art and future prospects. F1000Research 2017, 6, 926. [Google Scholar] [CrossRef] [Green Version]
- Subar, A.F.; Freedman, L.S.; Tooze, J.A.; Kirkpatrick, S.I.; Boushey, C.; Neuhouser, M.L.; Thompson, F.E.; Potischman, N.; Guenther, P.M.; Tarasuk, V.; et al. Addressing Current Criticism Regarding the Value of Self-Report Dietary Data. J. Nutr. 2015, 145, 2639–2645. [Google Scholar] [CrossRef] [Green Version]
- Falomir, Z.; Arregui, M.; Madueño, F.; Corella, D.; Coltell, Ó. Automation of Food Questionnaires in Medical Studies: A state-of-the-art review and future prospects. Comput. Biol. Med. 2012, 42, 964–974. [Google Scholar] [CrossRef] [Green Version]
- Conrad, J.; Nöthlings, U. Innovative approaches to estimate individual usual dietary intake in large-scale epidemiological studies. Proc. Nutr. Soc. 2017, 76, 213–219. [Google Scholar] [CrossRef]
- Sébédio, J.-L. Metabolomics, Nutrition, and Potential Biomarkers of Food Quality, Intake, and Health Status. In Advances in Food and Nutrition Research; Elsevier: Amsterdam, The Netherlands, 2017; Volume 82, pp. 83–116. [Google Scholar]
- Brouwer-Brolsma, E.M.; Brennan, L.; Drevon, C.A.; van Kranen, H.; Manach, C.; Dragsted, L.O.; Roche, H.M.; Andres-Lacueva, C.; Bakker, S.J.L.; Bouwman, J.; et al. Combining traditional dietary assessment methods with novel metabolomics techniques: Present efforts by the Food Biomarker Alliance. Proc. Nutr. Soc. 2017, 76, 619–627. [Google Scholar] [CrossRef] [Green Version]
- O’Gorman, A.; Brennan, L. The role of metabolomics in determination of new dietary biomarkers. Proc. Nutr. Soc. 2017, 76, 295–302. [Google Scholar] [CrossRef] [PubMed]
- Woodside, J.V.; Draper, J.; Lloyd, A.; McKinley, M.C. Use of biomarkers to assess fruit and vegetable intake. Proc. Nutr. Soc. 2017, 76, 308–315. [Google Scholar] [CrossRef] [PubMed] [Green Version]
- Dragsted, L.O.; Gao, Q.; Scalbert, A.; Vergères, G.; Kolehmainen, M.; Manach, C.; Brennan, L.; Afman, L.A.; Wishart, D.S.; Andres Lacueva, C.; et al. Validation of biomarkers of food intake—critical assessment of candidate biomarkers. Genes Nutr. 2018, 13, 14. [Google Scholar] [CrossRef] [Green Version]
- Ulaszewska, M.M.; Weinert, C.H.; Trimigno, A.; Portmann, R.; Andres Lacueva, C.; Badertscher, R.; Brennan, L.; Brunius, C.; Bub, A.; Capozzi, F.; et al. Nutrimetabolomics: An Integrative Action for Metabolomic Analyses in Human Nutritional Studies. Mol. Nutr. Food Res. 2019, 63, 1–38. [Google Scholar] [CrossRef] [PubMed]
- Praticò, G.; Gao, Q.; Scalbert, A.; Vergères, G.; Kolehmainen, M.; Manach, C.; Brennan, L.; Pedapati, S.H.; Afman, L.A.; Wishart, D.S.; et al. Guidelines for Biomarker of Food Intake Reviews (BFIRev): How to conduct an extensive literature search for biomarker of food intake discovery. Genes Nutr. 2018, 13, 1–14. [Google Scholar] [CrossRef] [PubMed] [Green Version]
- Maruvada, P.; Lampe, J.W.; Wishart, D.S.; Barupal, D.; Chester, D.N.; Dodd, D.; Djoumbou-Feunang, Y.; Dorrestein, P.C.; Dragsted, L.O.; Draper, J.; et al. Perspective: Dietary Biomarkers of Intake and Exposure—Exploration with Omics Approaches. Adv. Nutr. 2019, 200–215. [Google Scholar] [CrossRef]
- Harris, J.E.; Raynor, H.A. Crossover Designs in Nutrition and Dietetics Research. J. Acad. Nutr. Diet. 2017, 117, 1023–1030. [Google Scholar] [CrossRef] [PubMed] [Green Version]
- Guasch-Ferré, M.; Bhupathiraju, S.N.; Hu, F.B. Use of Metabolomics in Improving Assessment of Dietary Intake. Clin. Chem. 2018, 64, 82–98. [Google Scholar] [CrossRef] [PubMed] [Green Version]
- Heinzmann, S.S.; Brown, I.J.; Chan, Q.; Bictash, M.; Dumas, M.E.; Kochhar, S.; Stamler, J.; Holmes, E.; Elliott, P.; Nicholson, J.K. Metabolic profiling strategy for discovery of nutritional biomarkers: Proline betaine as a marker of citrus consumption. Am. J. Clin. Nutr. 2010, 92, 436–443. [Google Scholar] [CrossRef] [PubMed] [Green Version]
- Lloyd, A.J.; Beckmann, M.; Favé, G.; Mathers, J.C.; Draper, J. Proline betaine and its biotransformation products in fasting urine samples are potential biomarkers of habitual citrus fruit consumption. Br. J. Nutr. 2011, 106, 812–824. [Google Scholar] [CrossRef] [Green Version]
- Gibbons, H.; Michielsen, C.J.R.; Rundle, M.; Frost, G.; McNulty, B.A.; Nugent, A.P.; Walton, J.; Flynn, A.; Gibney, M.J.; Brennan, L. Demonstration of the utility of biomarkers for dietary intake assessment; proline betaine as an example. Mol. Nutr. Food Res. 2017, 61, 1–8. [Google Scholar] [CrossRef] [Green Version]
- Atkinson, W.; Downer, P.; Lever, M.; Chambers, S.T.; George, P.M. Effects of orange juice and proline betaine on glycine betaine and homocysteine in healthy male subjects. Eur. J. Nutr. 2007, 46, 446–452. [Google Scholar] [CrossRef]
- Lang, R.; Lang, T.; Bader, M.; Beusch, A.; Schlagbauer, V.; Hofmann, T. High-Throughput Quantitation of Proline Betaine in Foods and Suitability as a Valid Biomarker for Citrus Consumption. J. Agric. Food Chem. 2017, 65, 1613–1619. [Google Scholar] [CrossRef]
- Guertin, K.A.; Moore, S.C.; Sampson, J.N.; Huang, W.Y.; Xiao, Q.; Stolzenberg-Solomon, R.Z.; Sinha, R.; Cross, A.J. Metabolomics in nutritional epidemiology: Identifying metabolites associated with diet and quantifying their potential to uncover diet-disease relations in populations. Am. J. Clin. Nutr. 2014, 100, 208–217. [Google Scholar] [CrossRef] [Green Version]
- D’Angelo, S.; Gormley, I.C.; McNulty, B.A.; Nugent, A.P.; Walton, J.; Flynn, A.; Brennan, L. Combining biomarker and food intake data: Calibration equations for citrus intake. Am. J. Clin. Nutr. 2019, 110, 977–983. [Google Scholar] [CrossRef] [PubMed]
- May, D.H.; Navarro, S.L.; Ruczinski, I.; Hogan, J.; Ogata, Y.; Schwarz, Y.; Levy, L.; Holzman, T.; McIntosh, M.W.; Lampe, J.W. Metabolomic profiling of urine: Response to a randomised, controlled feeding study of select fruits and vegetables, and application to an observational study. Br. J. Nutr. 2013, 110, 1760–1770. [Google Scholar] [CrossRef] [PubMed] [Green Version]
- Mazzilli, K.M.; McClain, K.M.; Lipworth, L.; Playdon, M.C.; Sampson, J.N.; Clish, C.B.; Gerszten, R.E.; Freedman, N.D.; Moore, S.C. Identification of 102 Correlations between Serum Metabolites and Habitual Diet in a Metabolomics Study of the Prostate, Lung, Colorectal, and Ovarian Cancer Trial. J. Nutr. 2019, 1–10. [Google Scholar] [CrossRef] [PubMed]
- Rangel-Huerta, O.D.; Aguilera, C.M.; Perez-de-la-Cruz, A.; Vallejo, F.; Tomas-Barberan, F.; Gil, A.; Mesa, M.D. A serum metabolomics-driven approach predicts orange juice consumption and its impact on oxidative stress and inflammation in subjects from the BIONAOS study. Mol. Nutr. Food Res. 2017, 61, 1–12. [Google Scholar] [CrossRef] [PubMed]
- Garcia-Perez, I.; Posma, J.M.; Gibson, R.; Chambers, E.S.; Hansen, T.H.; Vestergaard, H.; Hansen, T.; Beckmann, M.; Pedersen, O.; Elliott, P.; et al. Objective assessment of dietary patterns by use of metabolic phenotyping: A randomised, controlled, crossover trial. Lancet Diabetes Endocrinol. 2017, 5, 184–195. [Google Scholar] [CrossRef] [Green Version]
- Wang, Y.; Gapstur, S.M.; Carter, B.D.; Hartman, T.J.; Stevens, V.L.; Gaudet, M.M.; McCullough, M.L. Untargeted metabolomics identifies novel potential biomarkers of habitual food intake in a cross-sectional study of postmenopausal women. J. Nutr. 2018, 148, 932–943. [Google Scholar] [CrossRef]
- Playdon, M.C.; Sampson, J.N.; Cross, A.J.; Sinha, R.; Guertin, K.A.; Moy, K.A.; Rothman, N.; Irwin, M.L.; Mayne, S.T.; Stolzenberg-Solomon, R.; et al. Comparing metabolite profiles of habitual diet in serum and urine. Am. J. Clin. Nutr. 2016, 104, 776–789. [Google Scholar] [CrossRef] [Green Version]
- Milenkovic, D.; Morand, C.; Cassidy, A.; Konic-Ristic, A.; Tomás-Barberán, F.; Ordovas, J.M.; Kroon, P.; De Caterina, R.; Rodriguez-Mateos, A. Interindividual Variability in Biomarkers of Cardiometabolic Health after Consumption of Major Plant-Food Bioactive Compounds and the Determinants Involved. Adv. Nutr. 2017, 8, 558–570. [Google Scholar]
- Bader, M.; Lang, T.; Lang, R.; Hofmann, T. Synephrine as a Specific Marker for Orange Consumption. J. Agric. Food Chem. 2017, 65, 4853–4858. [Google Scholar] [CrossRef]
- Collins, C.; McNamara, A.E.; Brennan, L. Role of metabolomics in identification of biomarkers related to food intake. Proc. Nutr. Soc. 2019, 78, 189–196. [Google Scholar] [CrossRef] [PubMed]
- Puiggròs, F.; Solà, R.; Bladé, C.; Salvadó, M.J.; Arola, L. Nutritional biomarkers and foodomic methodologies for qualitative and quantitative analysis of bioactive ingredients in dietary intervention studies. J. Chromatogr. A 2011, 1218, 7399–7414. [Google Scholar] [CrossRef] [PubMed]
- Dettmer, K.; Aronov, P.A.; Hammock, B.D. Mass Spectrometry-Based Metabolomics. Mass Spectrom. Rev. 2007, 26, 51–78. [Google Scholar] [CrossRef]
- Cevallos-Cevallos, J.M.; Reyes-De-Corcuera, J.I.; Etxeberria, E.; Danyluk, M.D.; Rodrick, G.E. Metabolomic analysis in food science: A review. Trends Food Sci. Technol. 2009, 20, 557–566. [Google Scholar] [CrossRef]
- Nicholson, J.K.; Wilson, I.D. High resolution proton magnetic resonance spectroscopy of biological fluids. Prog. Nucl. Magn. Reson. Spectrosc. 1989, 21, 449–501. [Google Scholar] [CrossRef]
- Nicholson, J.K.; Lindon, J.C. Metabonomics. Nature 2008, 455, 1054–1056. [Google Scholar] [CrossRef] [PubMed]
- Estabrooks, P.A.; Serrano, E.; Savla, J.; Hedrick, V.E.; Davy, B.M.; Dietrich, A.M. Dietary biomarkers: Advances, limitations and future directions. Nutr. J. 2012, 11, 1. [Google Scholar]
- De Vijlder, T.; Valkenborg, D.; Lemière, F.; Romijn, E.P.; Laukens, K.; Cuyckens, F. A tutorial in small molecule identification via electrospray ionization-mass spectrometry: The practical art of structural elucidation. Mass Spectrom. Rev. 2017, 37, 607–629. [Google Scholar] [CrossRef]
- Ardrey, R.E. Liquid Chromatography-Mass Spectrometry: An Introduction; Willey Editorial: Hoboken, NJ, USA, 2003. [Google Scholar]
- Fenaille, F.; Barbier Saint-Hilaire, P.; Rousseau, K.; Junot, C. Data acquisition workflows in liquid chromatography coupled to high resolution mass spectrometry-based metabolomics: Where do we stand? J. Chromatogr. A 2017, 1526, 1–12. [Google Scholar] [CrossRef]
- Kaufmann, A.; Walker, S. Comparison of linear intrascan and interscan dynamic ranges of Orbitrap and ion-mobility time-of-flight mass spectrometers. Rapid Commun. Mass Spectrom. 2017, 31, 1915–1926. [Google Scholar] [CrossRef]
- Gabelica, V.; Marklund, E. Fundamentals of ion mobility spectrometry. Curr. Opin. Chem. Biol. 2018, 42, 51–59. [Google Scholar] [CrossRef]
- D’Atri, V.; Causon, T.; Hernandez-Alba, O.; Mutabazi, A.; Veuthey, J.L.; Cianferani, S.; Guillarme, D. Adding a new separation dimension to MS and LC–MS: What is the utility of ion mobility spectrometry? J. Sep. Sci. 2018, 41, 20–67. [Google Scholar] [CrossRef] [PubMed]
- Mairinger, T.; Causon, T.J.; Hann, S. The potential of ion mobility–mass spectrometry for non-targeted metabolomics. Curr. Opin. Chem. Biol. 2018, 42, 9–15. [Google Scholar] [CrossRef] [PubMed]
- Bijlsma, L.; Bade, R.; Celma, A.; Mullin, L.; Cleland, G.; Stead, S.; Hernandez, F.; Sancho, J.V. Prediction of Collision Cross-Section Values for Small Molecules: Application to Pesticide Residue Analysis. Anal. Chem. 2017, 89, 6583–6589. [Google Scholar] [CrossRef] [PubMed]
- Barragán, R.; Coltell, O.; Portolés, O.; Asensio, E.M.; Sorlí, J.V.; Ortega-Azorín, C.; González, J.I.; Sáiz, C.; Fernández-Carrión, R.; Ordovas, J.M.; et al. Bitter, sweet, salty, sour and umami taste perception decreases with age: Sex-specific analysis, modulation by genetic variants and taste-preference associations in 18 to 80 year-old subjects. Nutrients 2018, 10, 1539. [Google Scholar] [CrossRef] [Green Version]
- Rossato, L.G.; Costa, V.M.; Limberger, R.P.; de Bastos, M.L.; Remião, F. Synephrine: From trace concentrations to massive consumption in weight-loss. Food Chem. Toxicol. 2011, 49, 8–16. [Google Scholar] [CrossRef]
- Parhiz, H.; Roohbakhsh, A.; Soltani, F.; Rezaee, R.; Iranshahi, M. Antioxidant and anti-inflammatory properties of the citrus flavonoids hesperidin and hesperetin: An updated review of their molecular mechanisms and experimental models. Phyther. Res. 2015, 29, 323–331. [Google Scholar] [CrossRef]
- Haaz, S.; Fontaine, K.R.; Cutter, G.; Limdi, N.; Perumean-Chaney, S.; Allison, D.B. Citrus aurantium and synephrine alkaloids in the treatment of overweight and obesity: An update. Obes. Rev. 2006, 7, 79–88. [Google Scholar] [CrossRef]
- Matsumoto, H.; Ikoma, Y.; Sugiura, M.; Yano, M.; Hasegawa, Y. Identification and Quantification of the Conjugated Metabolites Derived from Orally Administered Hesperidin in Rat Plasma. J. Agric. Food Chem. 2004, 52, 6653–6659. [Google Scholar] [CrossRef]
- Yang, C.Y.; Tsai, S.Y.; Chao, P.D.L.; Yen, H.F.; Chien, T.M.; Hsiu, S.L. Determination of hesperetin and its conjugate metabolites in serum and urine. J. Food Drug Anal. 2002, 10, 143–148. [Google Scholar] [CrossRef]
- Kusu, F.; Matsumoto, K.; Arai, K.; Takamura, K. Determination of Synephrine Enantiomers in Food and Conjugated Synephrine in Urine by High-Performance Liquid Chromatography with Electrochemical Detection. Anal. Biochem. 1996, 235, 191–194. [Google Scholar] [CrossRef]
- Nelson, B.C.; Putzbach, K.; Sharpless, K.E.; Sander, L.C. Mass spectrometric determination of the predominant adrenergic protoalkaloids in bitter orange (Citrus aurantium). J. Agric. Food Chem. 2007, 55, 9769–9775. [Google Scholar] [CrossRef] [PubMed]
- Pujos-Guillot, E.; Hubert, J.; Martin, J.F.; Lyan, B.; Quintana, M.; Claude, S.; Chabanas, B.; Rothwell, J.A.; Bennetau-Pelissero, C.; Scalbert, A.; et al. Mass spectrometry-based metabolomics for the discovery of biomarkers of fruit and vegetable intake: Citrus fruit as a case study. J. Proteome Res. 2013, 12, 1645–1659. [Google Scholar] [CrossRef]
- Gattuso, G.; Barreca, D.; Gargiulli, C.; Leuzzi, U.; Caristi, C. Flavonoid Composition of Citrus Juices. Molecules 2007, 12, 1641–1673. [Google Scholar] [CrossRef] [PubMed] [Green Version]
- Servillo, L.; Giovane, A.; Balestrieri, M.L.; Bata-Csere, A.; Cautela, D.; Castaldo, D. Betaines in fruits of citrus genus plants. J. Agric. Food Chem. 2011, 59, 9410–9416. [Google Scholar] [CrossRef] [PubMed]


| Characteristics | Total (n = 30) | Men (n = 22) | Women (n = 8) |
|---|---|---|---|
| Age (years) | 25.0 ± 0.5 | 25.4 ± 0.6 | 23.8 ± 0.9 |
| BMI (Kg/m2) | 25.0 ± 1.0 | 25.8 ± 1.3 | 22.6 ± 1.1 |
| SBP (mm Hg) | 124 ± 3 | 129 ± 3 | 111 ± 3 |
| DBP (mm Hg) | 74 ± 2 | 75 ± 2 | 74 ± 2 |
| Total cholesterol (mg/dL) | 186.7 ± 5.9 | 191.4 ± 6.8 | 172.3 ± 11.6 |
| LDL-C (mg/dL) | 121.5 ± 4.6 | 126.8 ± 5.0 | 104.9 ± 8.8 |
| HDL-C (mg/dL) | 57.5 ± 2.7 | 53.6 ± 2.7 | 68.2 ± 5.4 |
| Triglycerides (mg/dL) | 75.4 ± 7.5 | 83.6 ± 9.7 | 52.8 ± 3.4 |
| Fasting glucose (mg/dL) | 86.7 ± 1.1 | 88.2 ± 1.3 | 82.7 ± 1.6 |
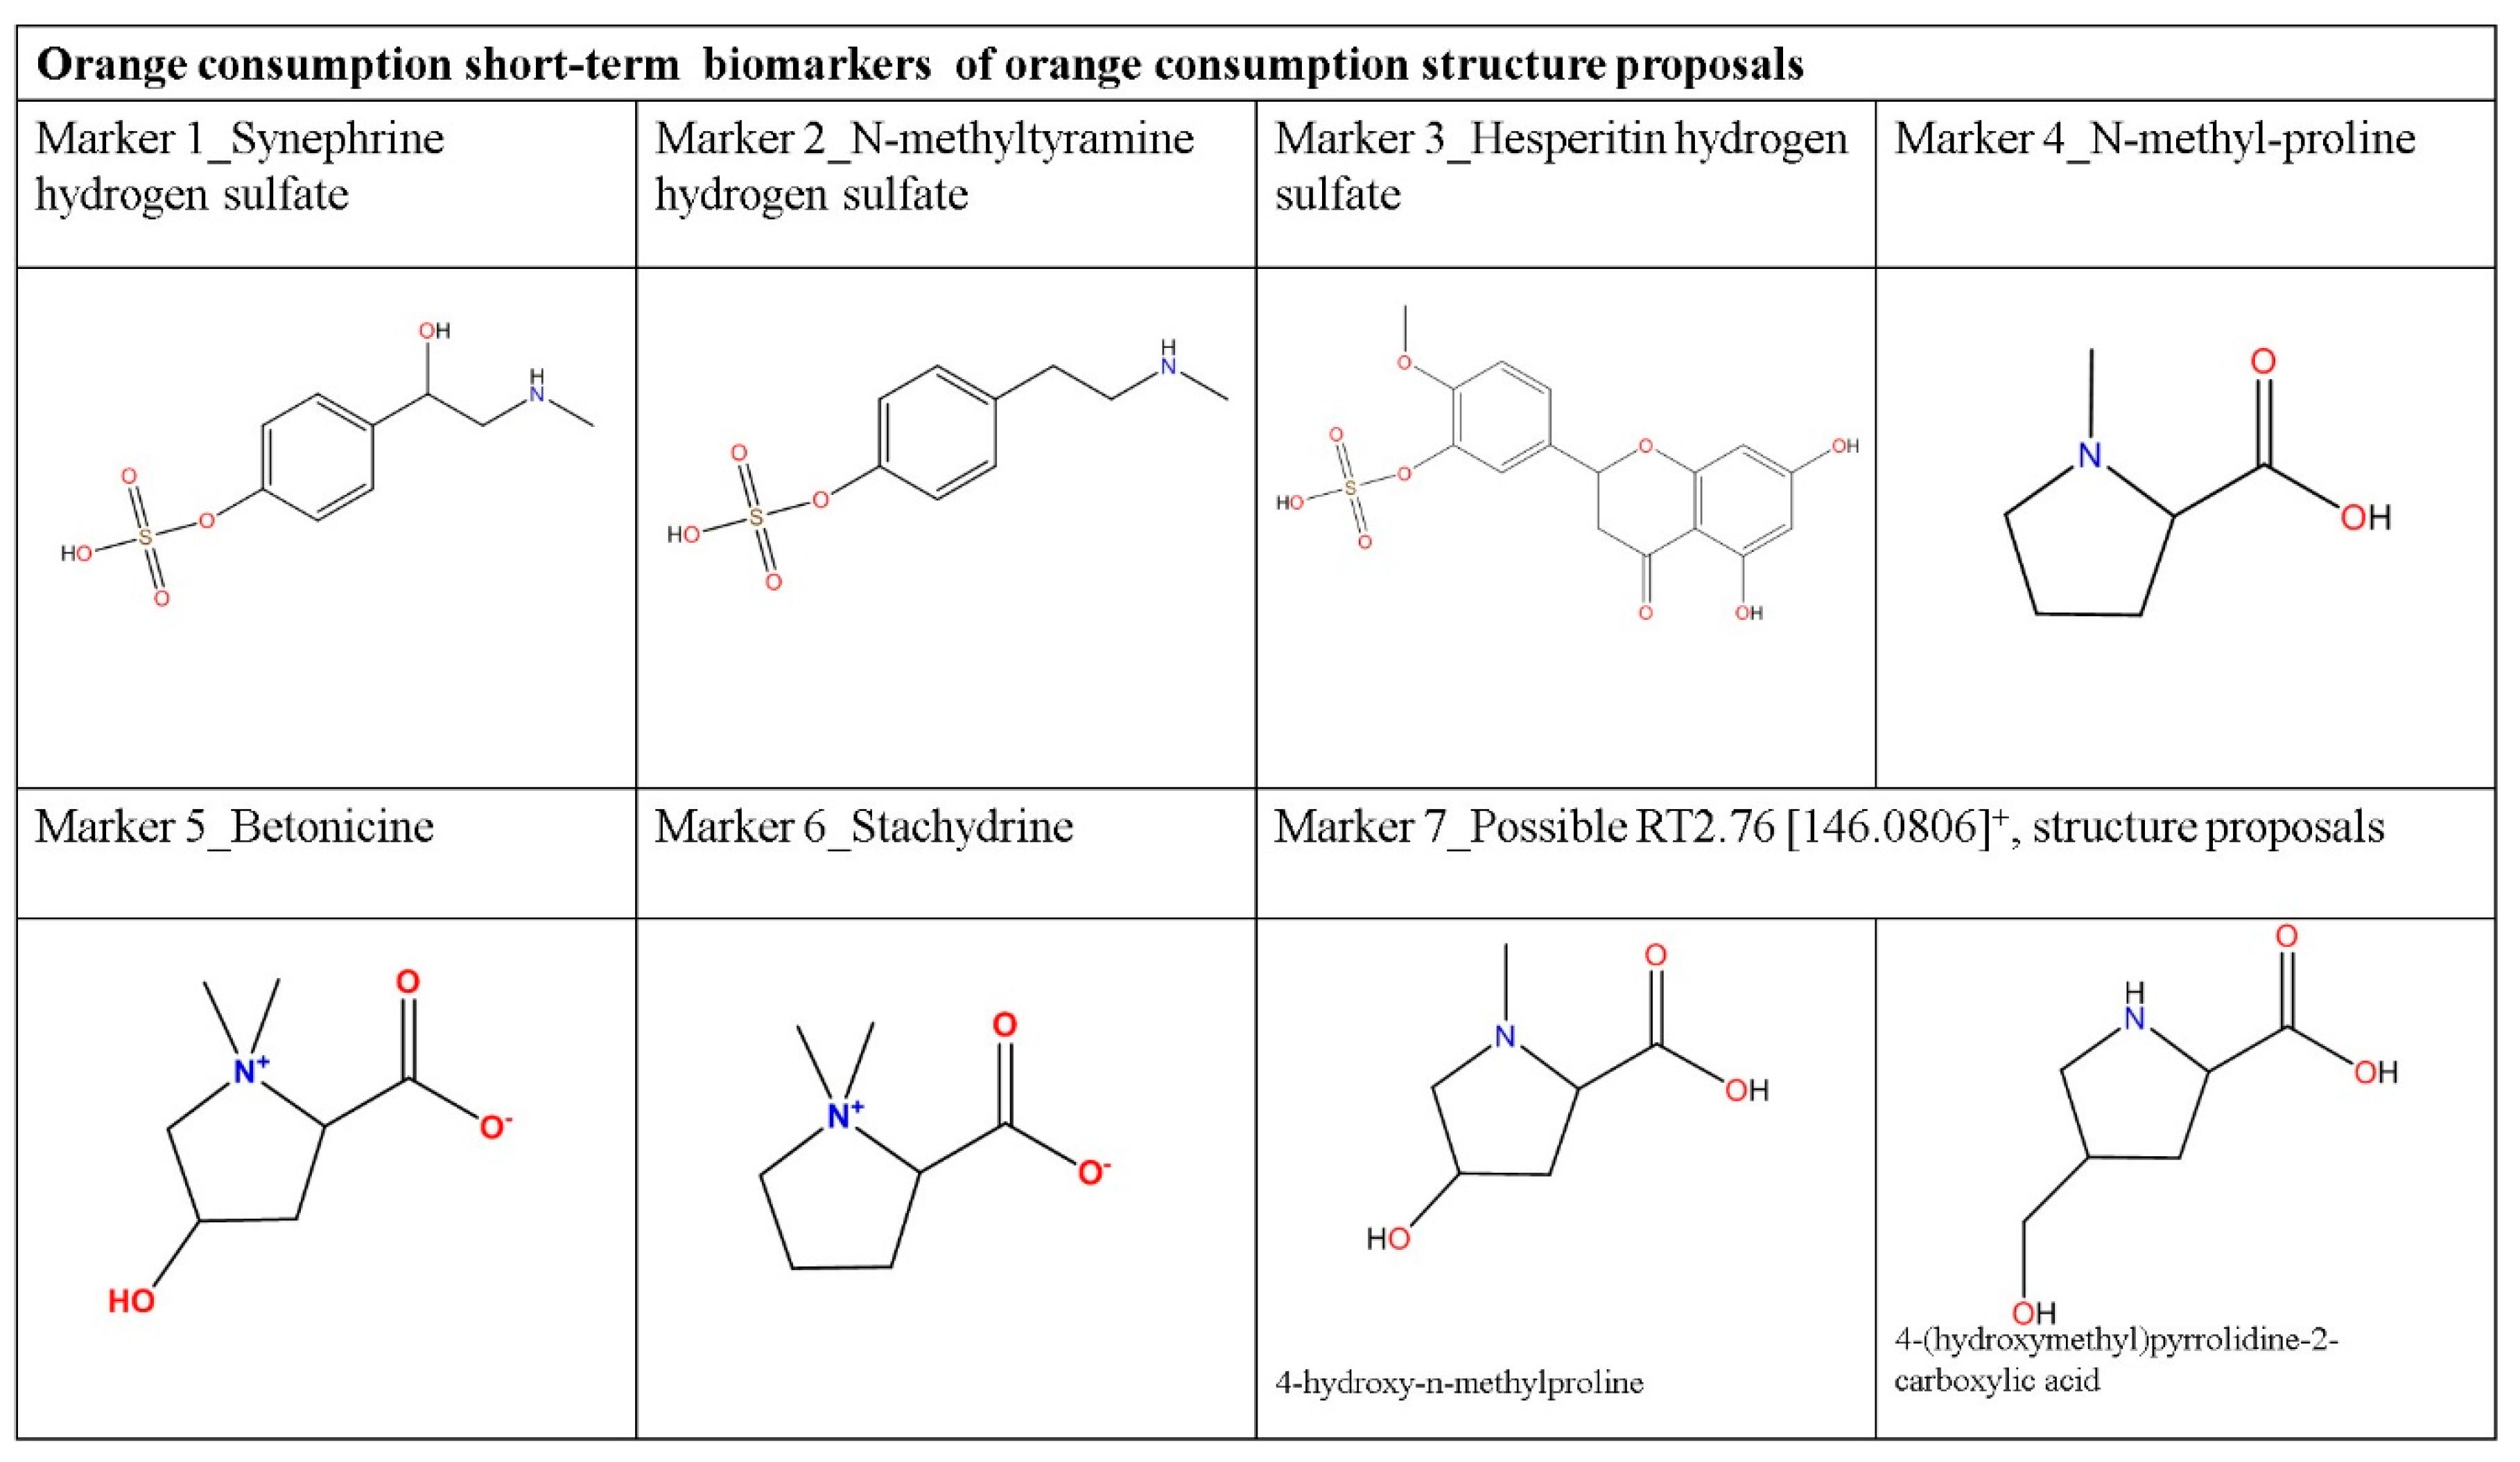
| No. | Compound | Elemental Composition | P[corr] | Feature | Rt (min) | Experimental Neutral Mass (Da) | Theoretical Neutral Mass (Da) | Mass Error (mDa/ppm) | CCS (Å2) de/protonated Molecule m/z | Predicted CCS (Å2) Protonated Molecule m/z1 | CCS Delta Error (%) | Adducts Detected |
|---|---|---|---|---|---|---|---|---|---|---|---|---|
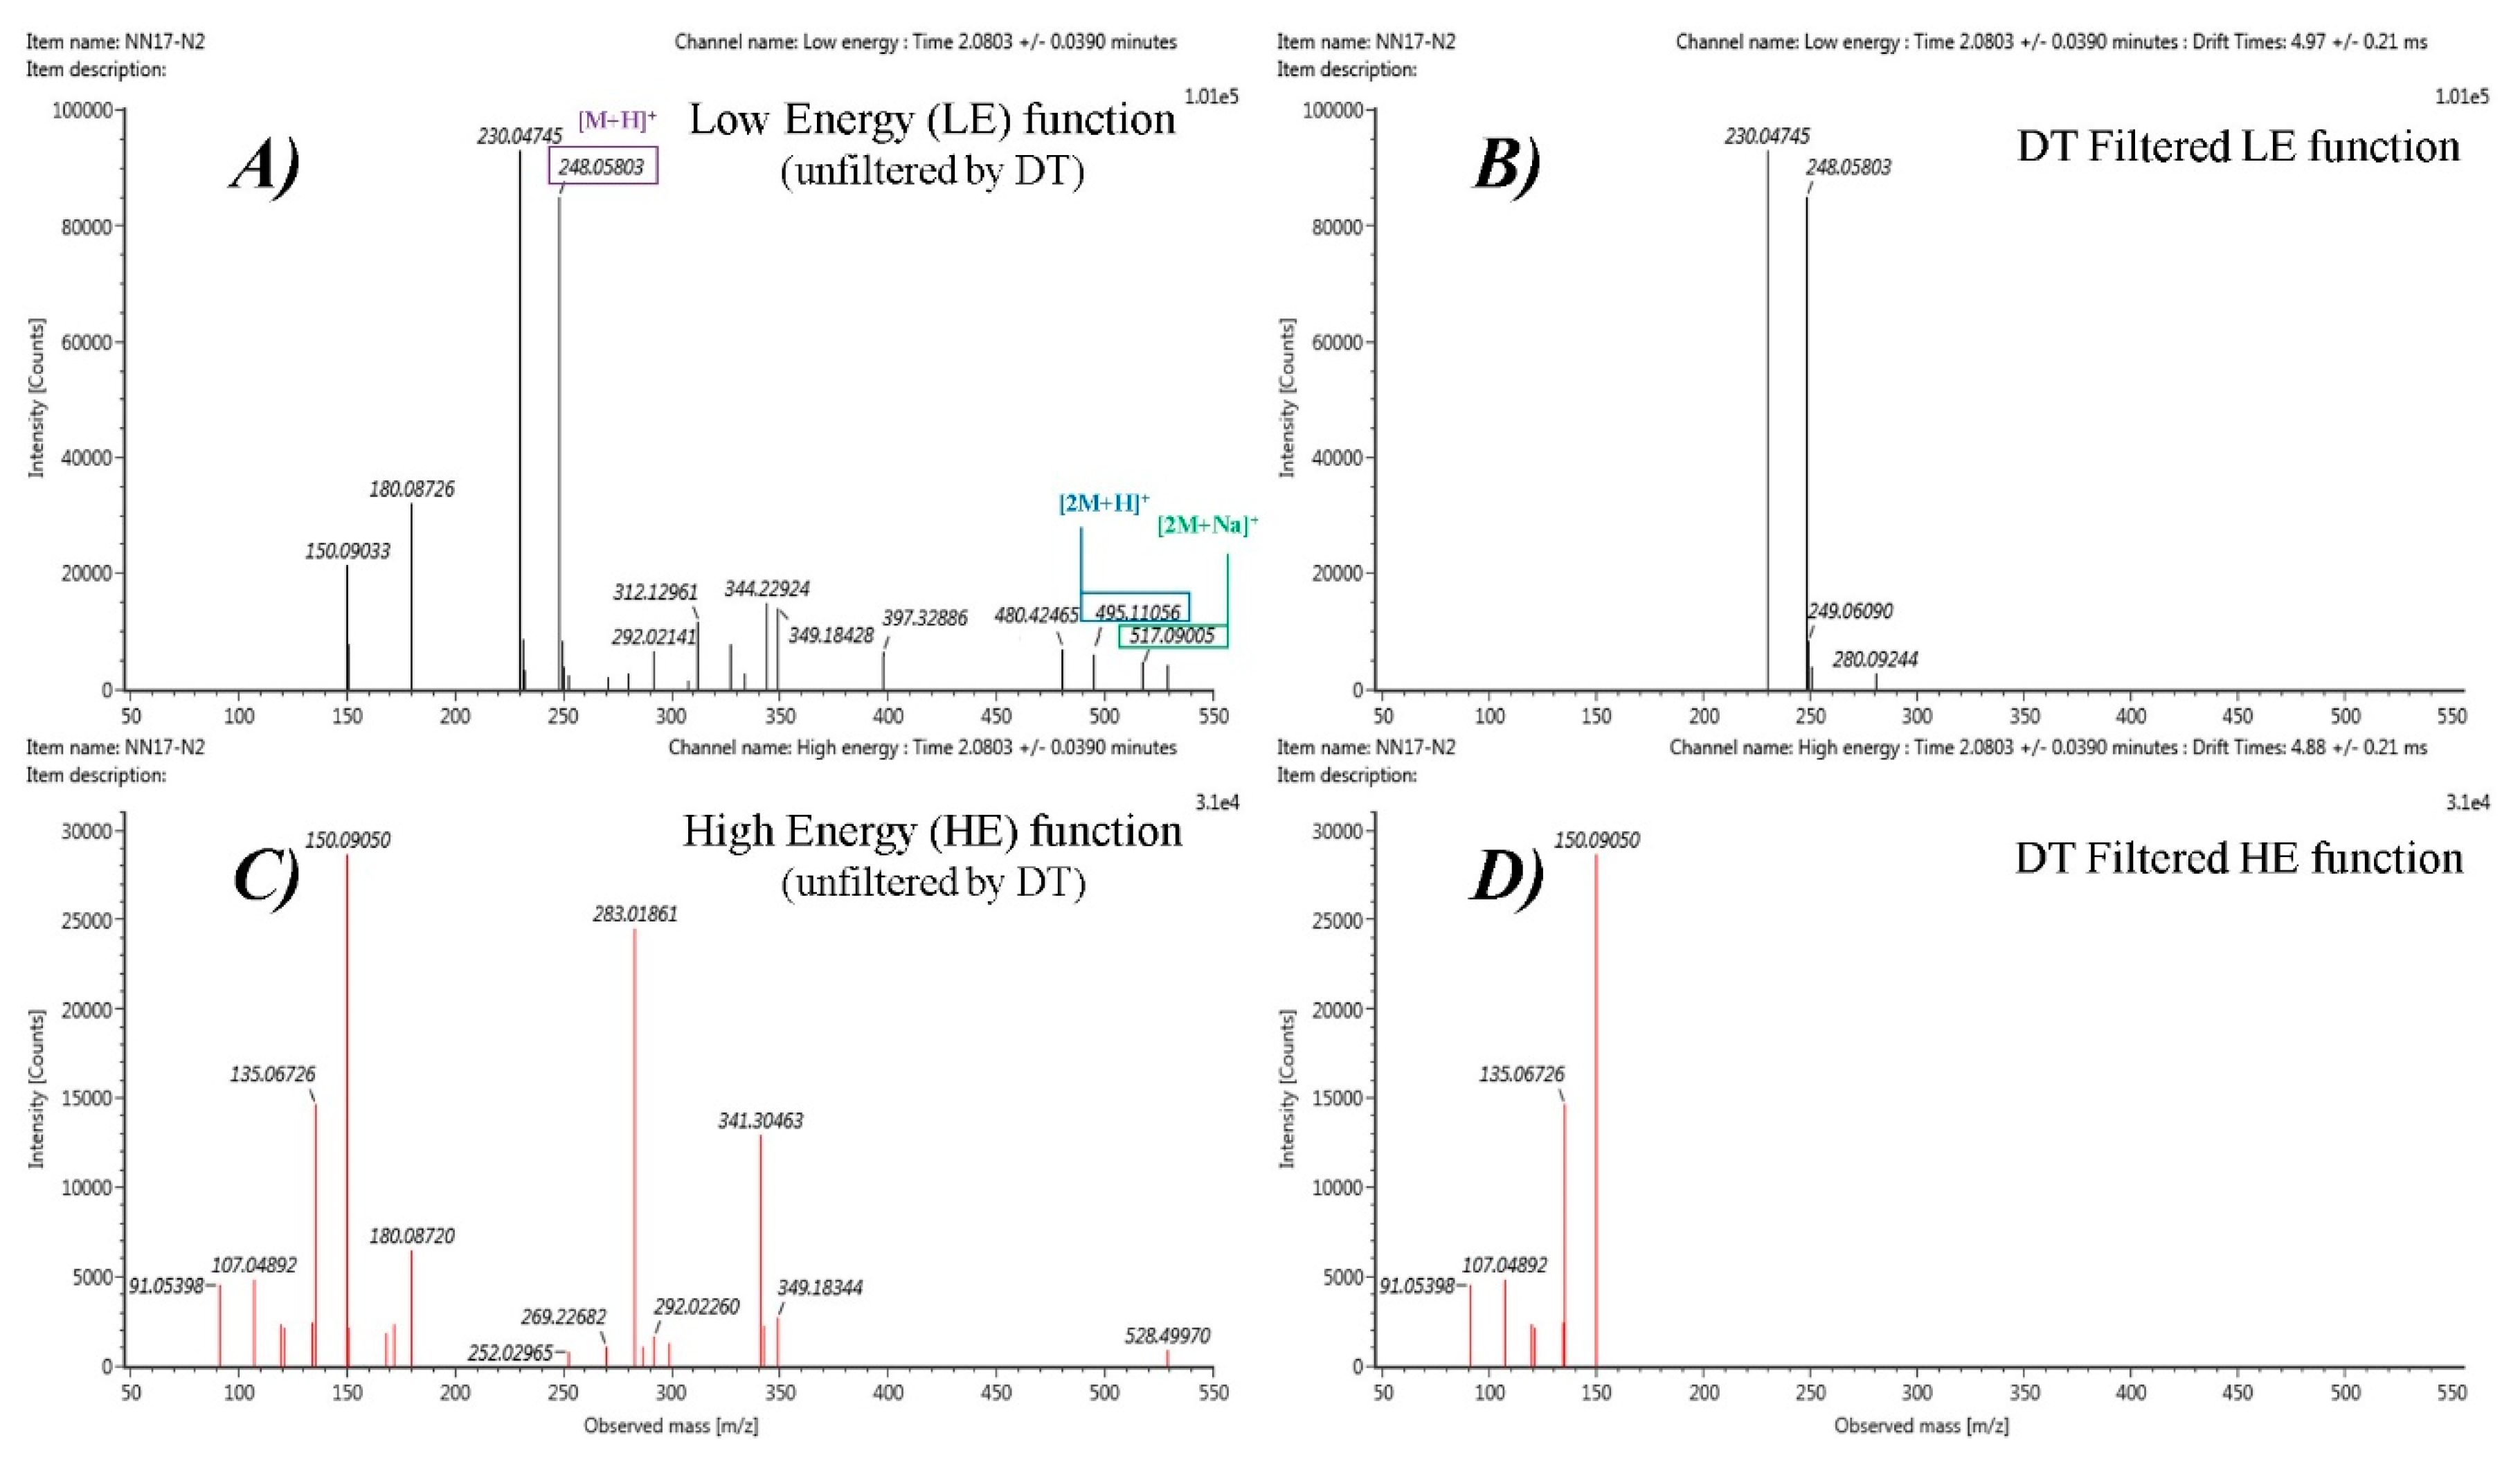
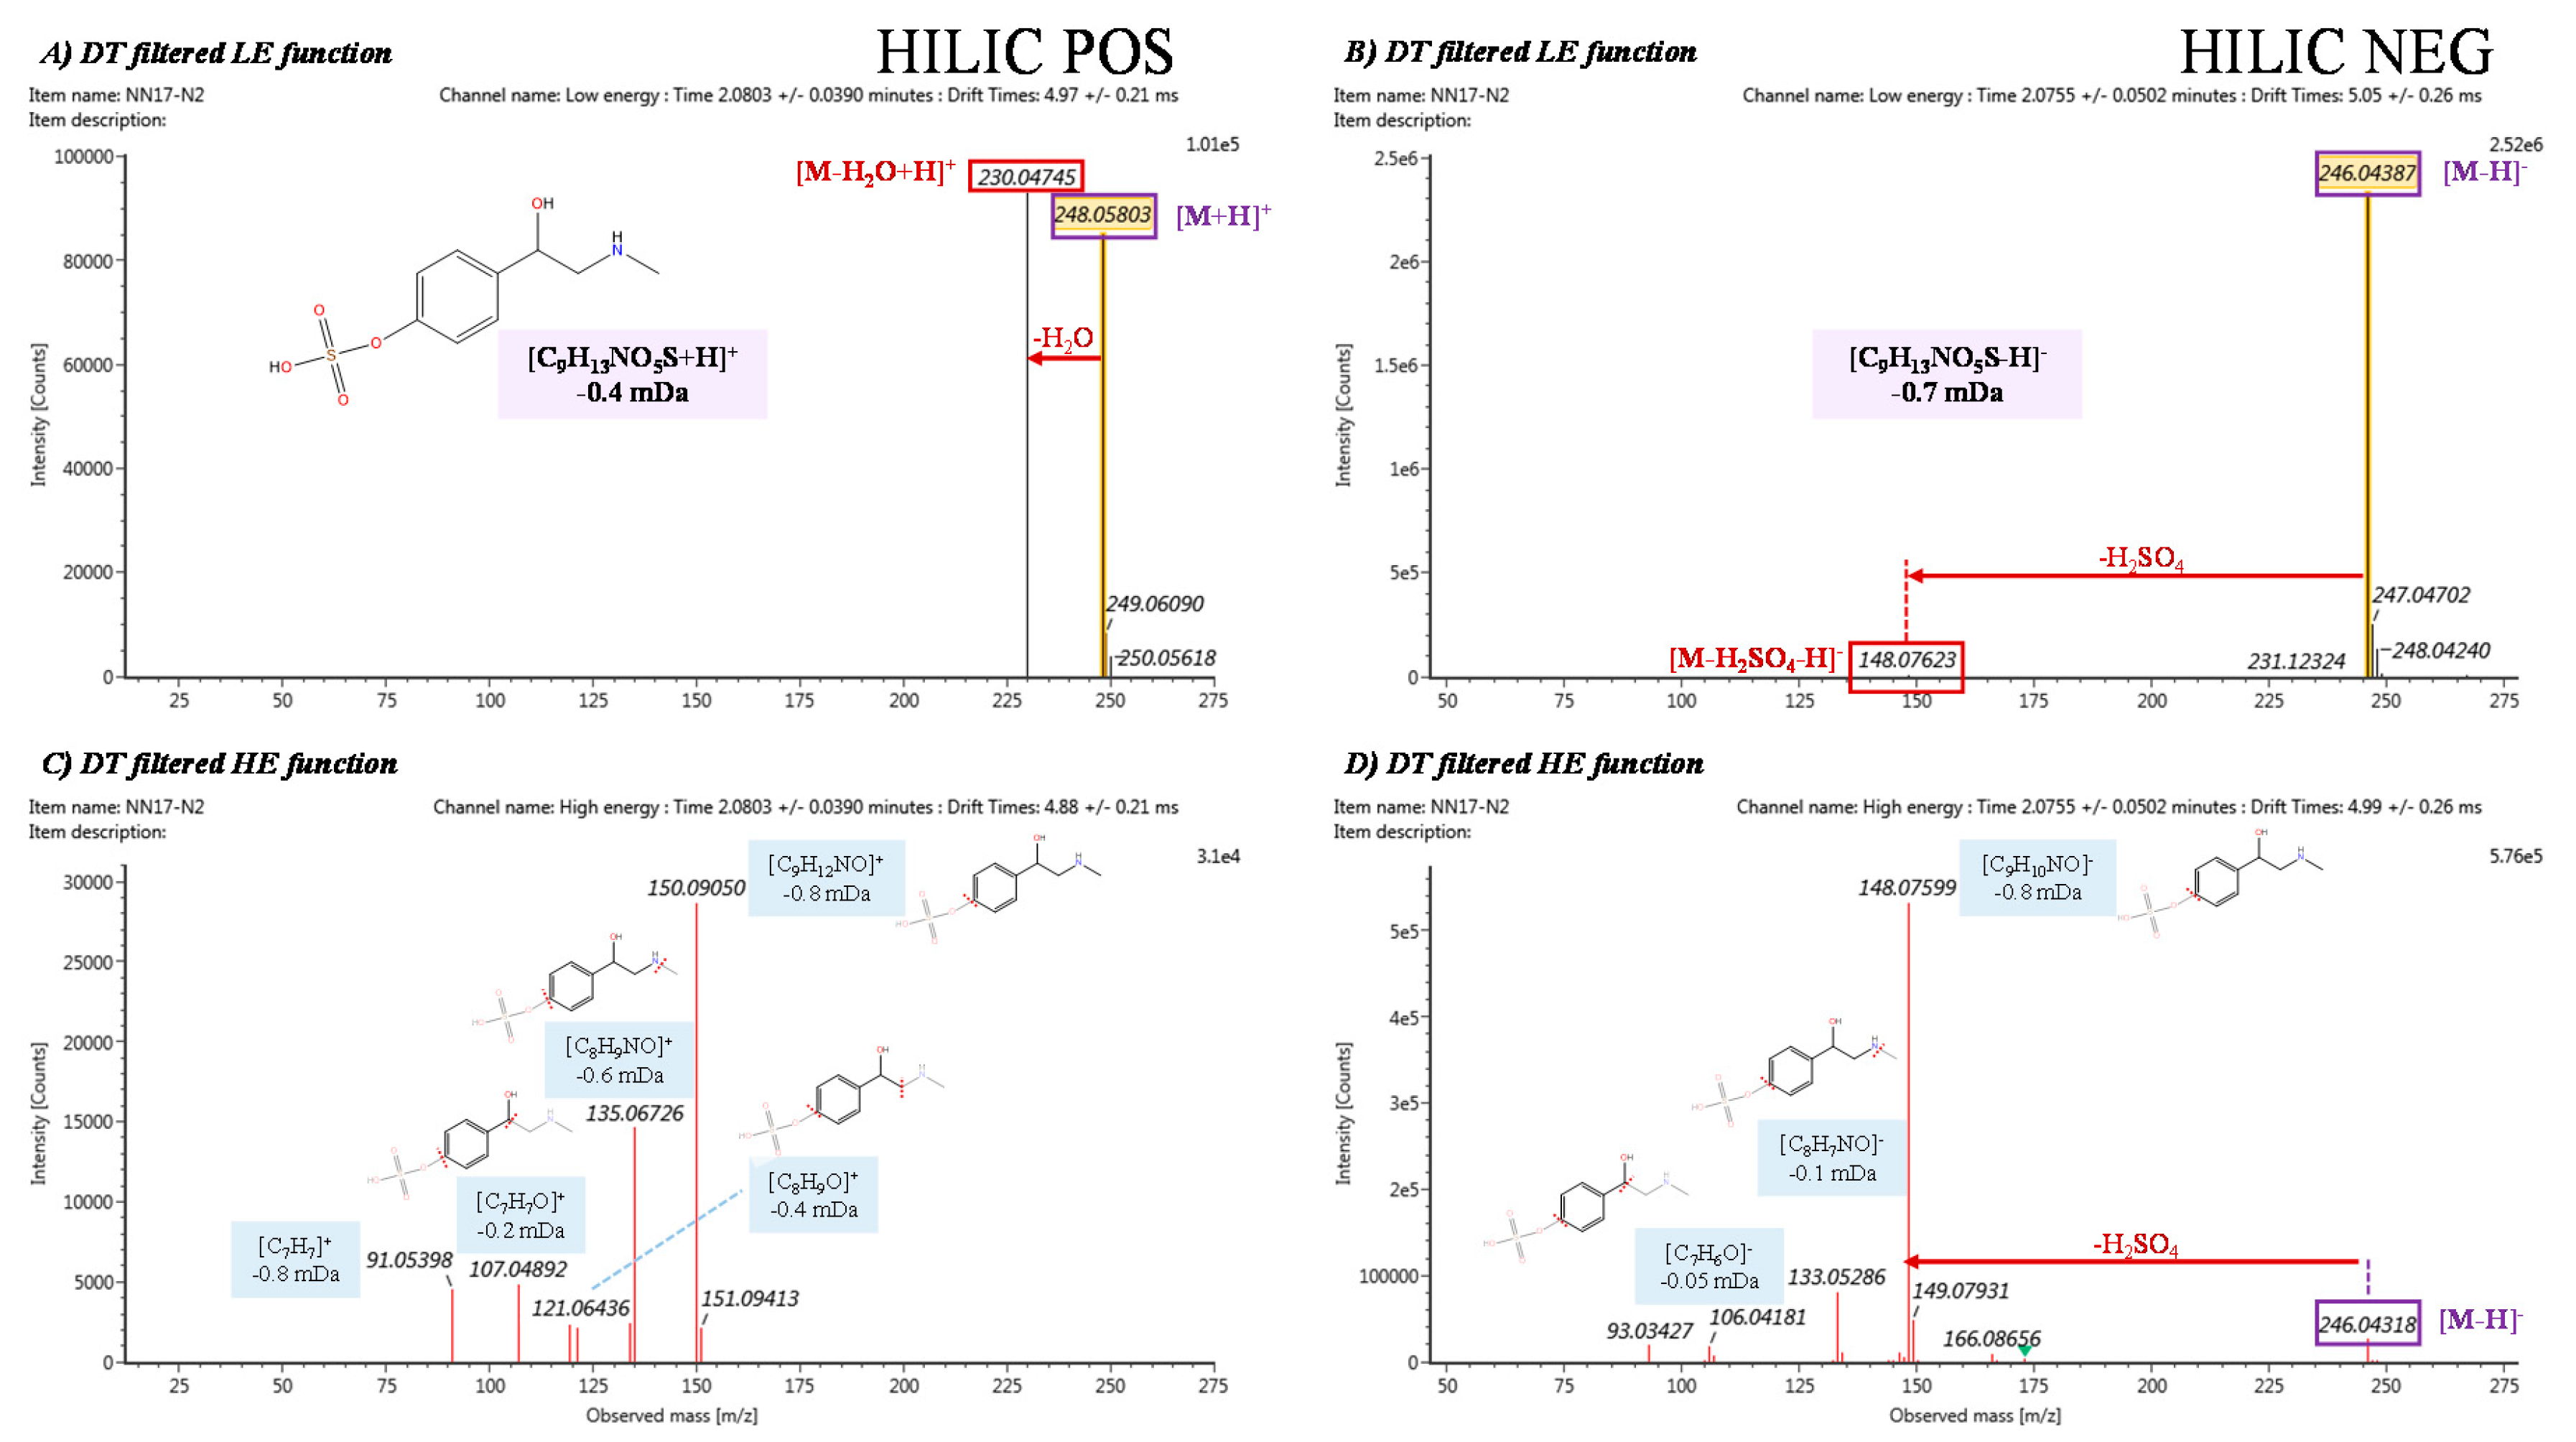
| 1 | Synephrime hydrogen sulfate | C9H13NO5S | 0.64 | HIPOS_2.17_247.0510n | 2.17 | 247.0510 | 247.0514 | −0.4/−1.6 | 158.27 | 149.79 | −5.36 | [M+H]+ [M-H2O+H]+ [2M+H]+ [2M+Na]+ |
| 0.86 | HINEG_2.22_246.0434m/z | 2.22 | 247.0507 | 247.0514 | −0.7/−2.8 | 155.40 | --- | --- | [M-H]− [(M-H+Na)-Cl]− [2M-H]− [2M-2H+Na]− | |||
| 2 | N-methyltyramine hydrogen sulfate | C9H13NO4S | 0.63 | HIPOS_1.89_232.0629m/z | 1.89 | 231.0556 | 231.0565 | −0.9/−3.9 | 154.00 | 146.16 | −5.09 | [M+H]+ |
| 0.82 | HINEG_1.89_230.0483m/z | 1.89 | 231.0556 | 231.0565 | −0.9/−3.9 | 154.49 | --- | --- | [M-H]− | |||
| 3 | Hesperitin hydrogen sulfate | C16H14O9S | 0.61 | HINEG_0.58_381.0279m/z | 0.58 | 382.0352 | 382.0359 | −0.7/−1.8 | 175.63 | --- | --- | [M-H]− |
| 0.57 | HIPOS_0.57_383.0430m/z | 0.57 | 382.0357 | 382.0359 | −0.2/−0.52 | 172.50 | 186.02 | −7.83 | [M+H]+ | |||
| 4 | N-methyl-proline | C6H11NO2 | 0.84 | HIPOS_4.73_130.0856m/z | 4.73 | 129.0783 | 129.0790 | −0.7/−5.4 | 127.17 | 124.4 | −2.18 | [M+H]+ |
| 5 | Betonicine | C7H13NO3 | 0.93 | HIPOS_4.79_159.0890n | 4.79 | 159.0890 | 159.0895 | −0.5/−3.1 | 129.02 | 130.25 | +0.95 | [M+H]+ [M+Na]+ [M+K]+ [2M+Na]+ |
| 0.92 | RPPOS_0.66_160.0970m/z | 0.66 | 159.0897 | 159.0895 | +0.2/+1.3 | 129.02 | 130.25 | +0.95 | [M+H]+ [M+Na]+ | |||
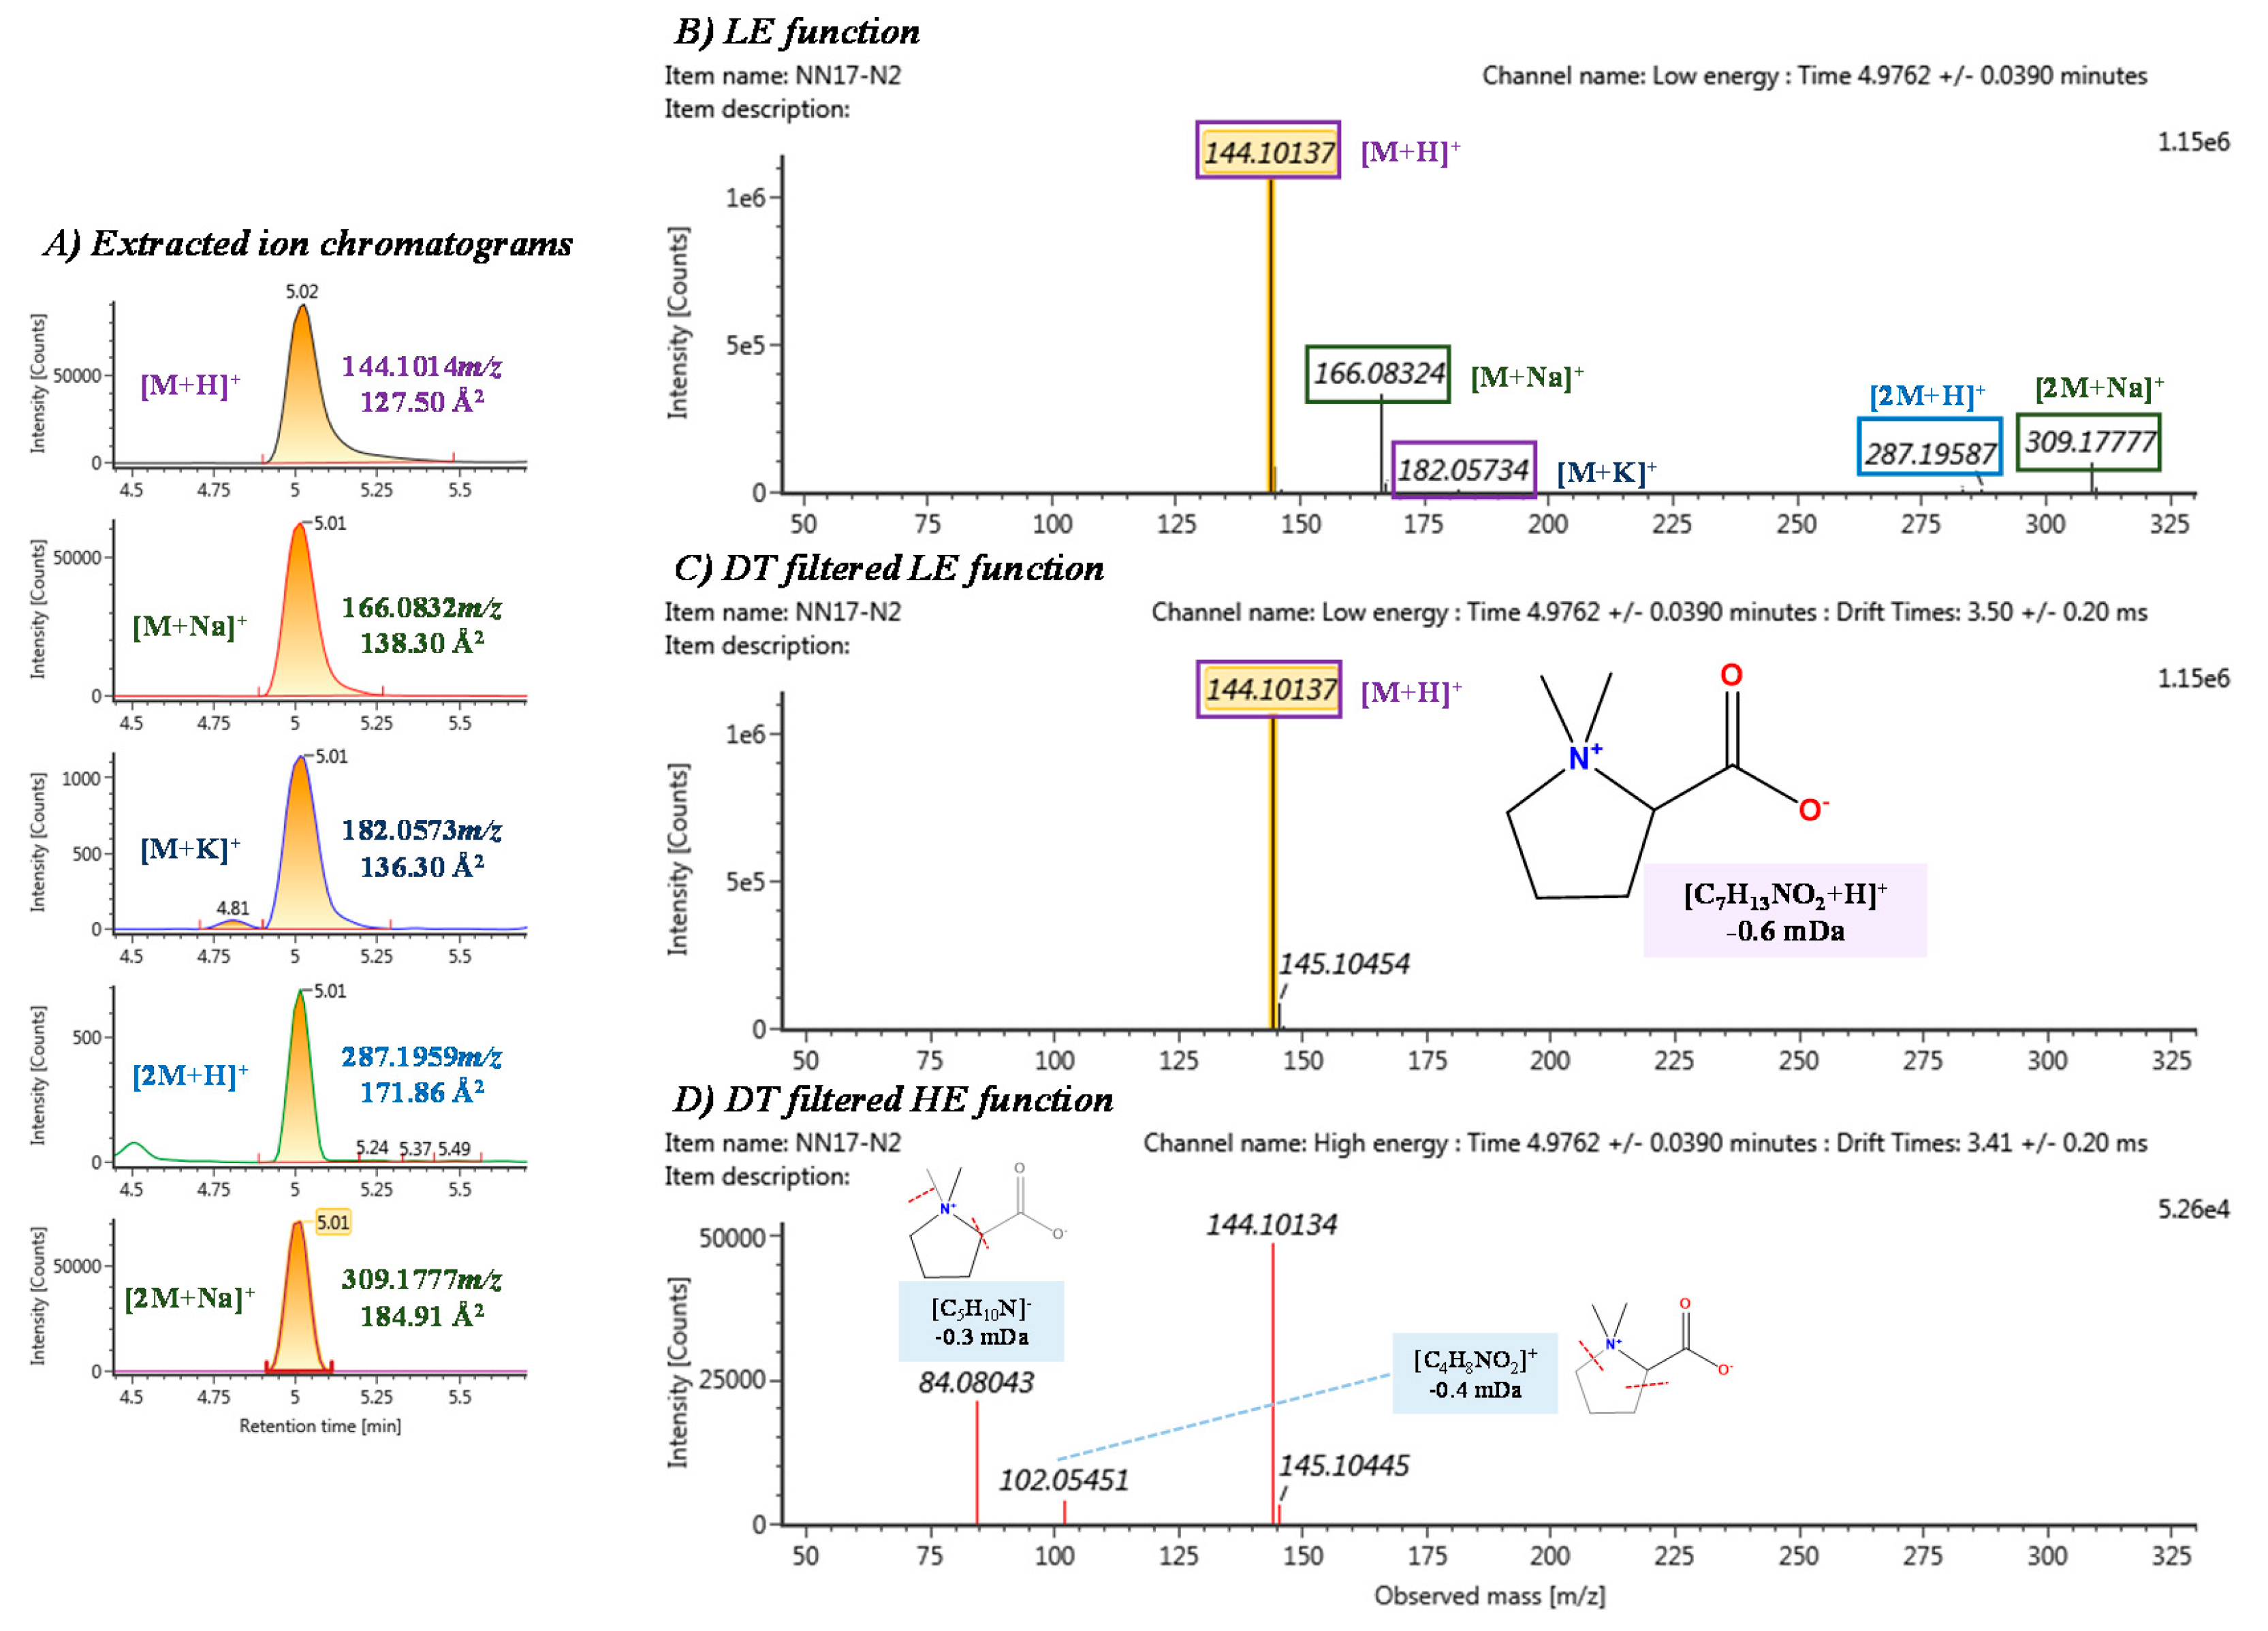
| 6 | Stachydrine | C7H13NO2 | 0.92 | HIPOS_5.02_143.0941n | 5.02 | 143.0941 | 143.0946 | −0.5/−3.5 | 127.17 | 127.55 | +0.30 | [M+H]+ [M+Na]+ [M+K]+ [2M+H]+ [2M+Na]+ |
| 0.96 | RPPOS_0.64_143.0947n | 0.64 | 143.0947 | 143.0946 | +0.1/+0.7 | 127.18 | 127.55 | +0.29 | [M+H]+ [M+Na]+ | |||
| 7 | unknown | C6H11NO3 | 0.65 | HIPOS_2.76_146.0806m/z | 2.76 | 145.0733 | 145.0739 | −0.6/−4.1 | 123.81 | 127.11/127.03 | +2.66/+2.60 | [M+H]+ |
| No. | Compound | Related Compounds Found in the Literature | Citrus Fruit and/or Product Consumed | Bio Fluid Sample | Analysis Platform | Literature on Detection as Metabolite | Literature Demonstrating the Presence in Citrus |
|---|---|---|---|---|---|---|---|
| 1 | Synephrime hydrogen sulfate | Synephrine and/or other phase I/II metabolites | orange juice | urine | LC-MS/MS LC-ECD | [30,52] | [49,53] |
| 2 | N-methyltyramine hydrogen sulfate | N-methyltyramine and/or other phase I/II metabolites | orange, grapefruit, orange juice | urine | LC-HRMS | [54] | [49,53] |
| 3 | Hesperitin hydrogen sulfate | Hesperitin and/or other phase I/II metabolites | orange, grapefruit, orange juice | urine | LC-HRMS LC-MS/MS | [17,54] | [55] |
| 4 | N-methyl-proline | orange juice | urine | LC-HRMS | [21,25,27,28] | [56] | |
| 5 | Betonicine | orange, grapefruit, orange juice | plasma, urine | FIA-HRMS LC-HRMS LC-MS/MS | [17,19,25,28,54] | [56] | |
| 6 | Stachydrine | orange, grapefruit, orange juice, grapefruit juice | plasma, serum, urine | FIA-HRMS LC-M/MS LC-HRMS 1H NMR | [16,17,18,19,20,21,23,24,25,27,28,54] | [56] | |
| 7 | Unknown | NA | NA | NA | NA | NA | NA |
© 2020 by the authors. Licensee MDPI, Basel, Switzerland. This article is an open access article distributed under the terms and conditions of the Creative Commons Attribution (CC BY) license (http://creativecommons.org/licenses/by/4.0/).
Share and Cite
Lacalle-Bergeron, L.; Portolés, T.; López, F.J.; Sancho, J.V.; Ortega-Azorín, C.; Asensio, E.M.; Coltell, O.; Corella, D. Ultra-Performance Liquid Chromatography-Ion Mobility Separation-Quadruple Time-of-Flight MS (UHPLC-IMS-QTOF MS) Metabolomics for Short-Term Biomarker Discovery of Orange Intake: A Randomized, Controlled Crossover Study. Nutrients 2020, 12, 1916. https://doi.org/10.3390/nu12071916
Lacalle-Bergeron L, Portolés T, López FJ, Sancho JV, Ortega-Azorín C, Asensio EM, Coltell O, Corella D. Ultra-Performance Liquid Chromatography-Ion Mobility Separation-Quadruple Time-of-Flight MS (UHPLC-IMS-QTOF MS) Metabolomics for Short-Term Biomarker Discovery of Orange Intake: A Randomized, Controlled Crossover Study. Nutrients. 2020; 12(7):1916. https://doi.org/10.3390/nu12071916
Chicago/Turabian StyleLacalle-Bergeron, Leticia, Tania Portolés, Francisco J. López, Juan Vicente Sancho, Carolina Ortega-Azorín, Eva M. Asensio, Oscar Coltell, and Dolores Corella. 2020. "Ultra-Performance Liquid Chromatography-Ion Mobility Separation-Quadruple Time-of-Flight MS (UHPLC-IMS-QTOF MS) Metabolomics for Short-Term Biomarker Discovery of Orange Intake: A Randomized, Controlled Crossover Study" Nutrients 12, no. 7: 1916. https://doi.org/10.3390/nu12071916