Amino Acid Plasma Profiles from a Prolonged-Release Protein Substitute for Phenylketonuria: A Randomized, Single-Dose, Four-Way Crossover Trial in Healthy Volunteers

 , ,
, , 
Abstract
1. Introduction
2. Materials and Methods
2.1. Subjects
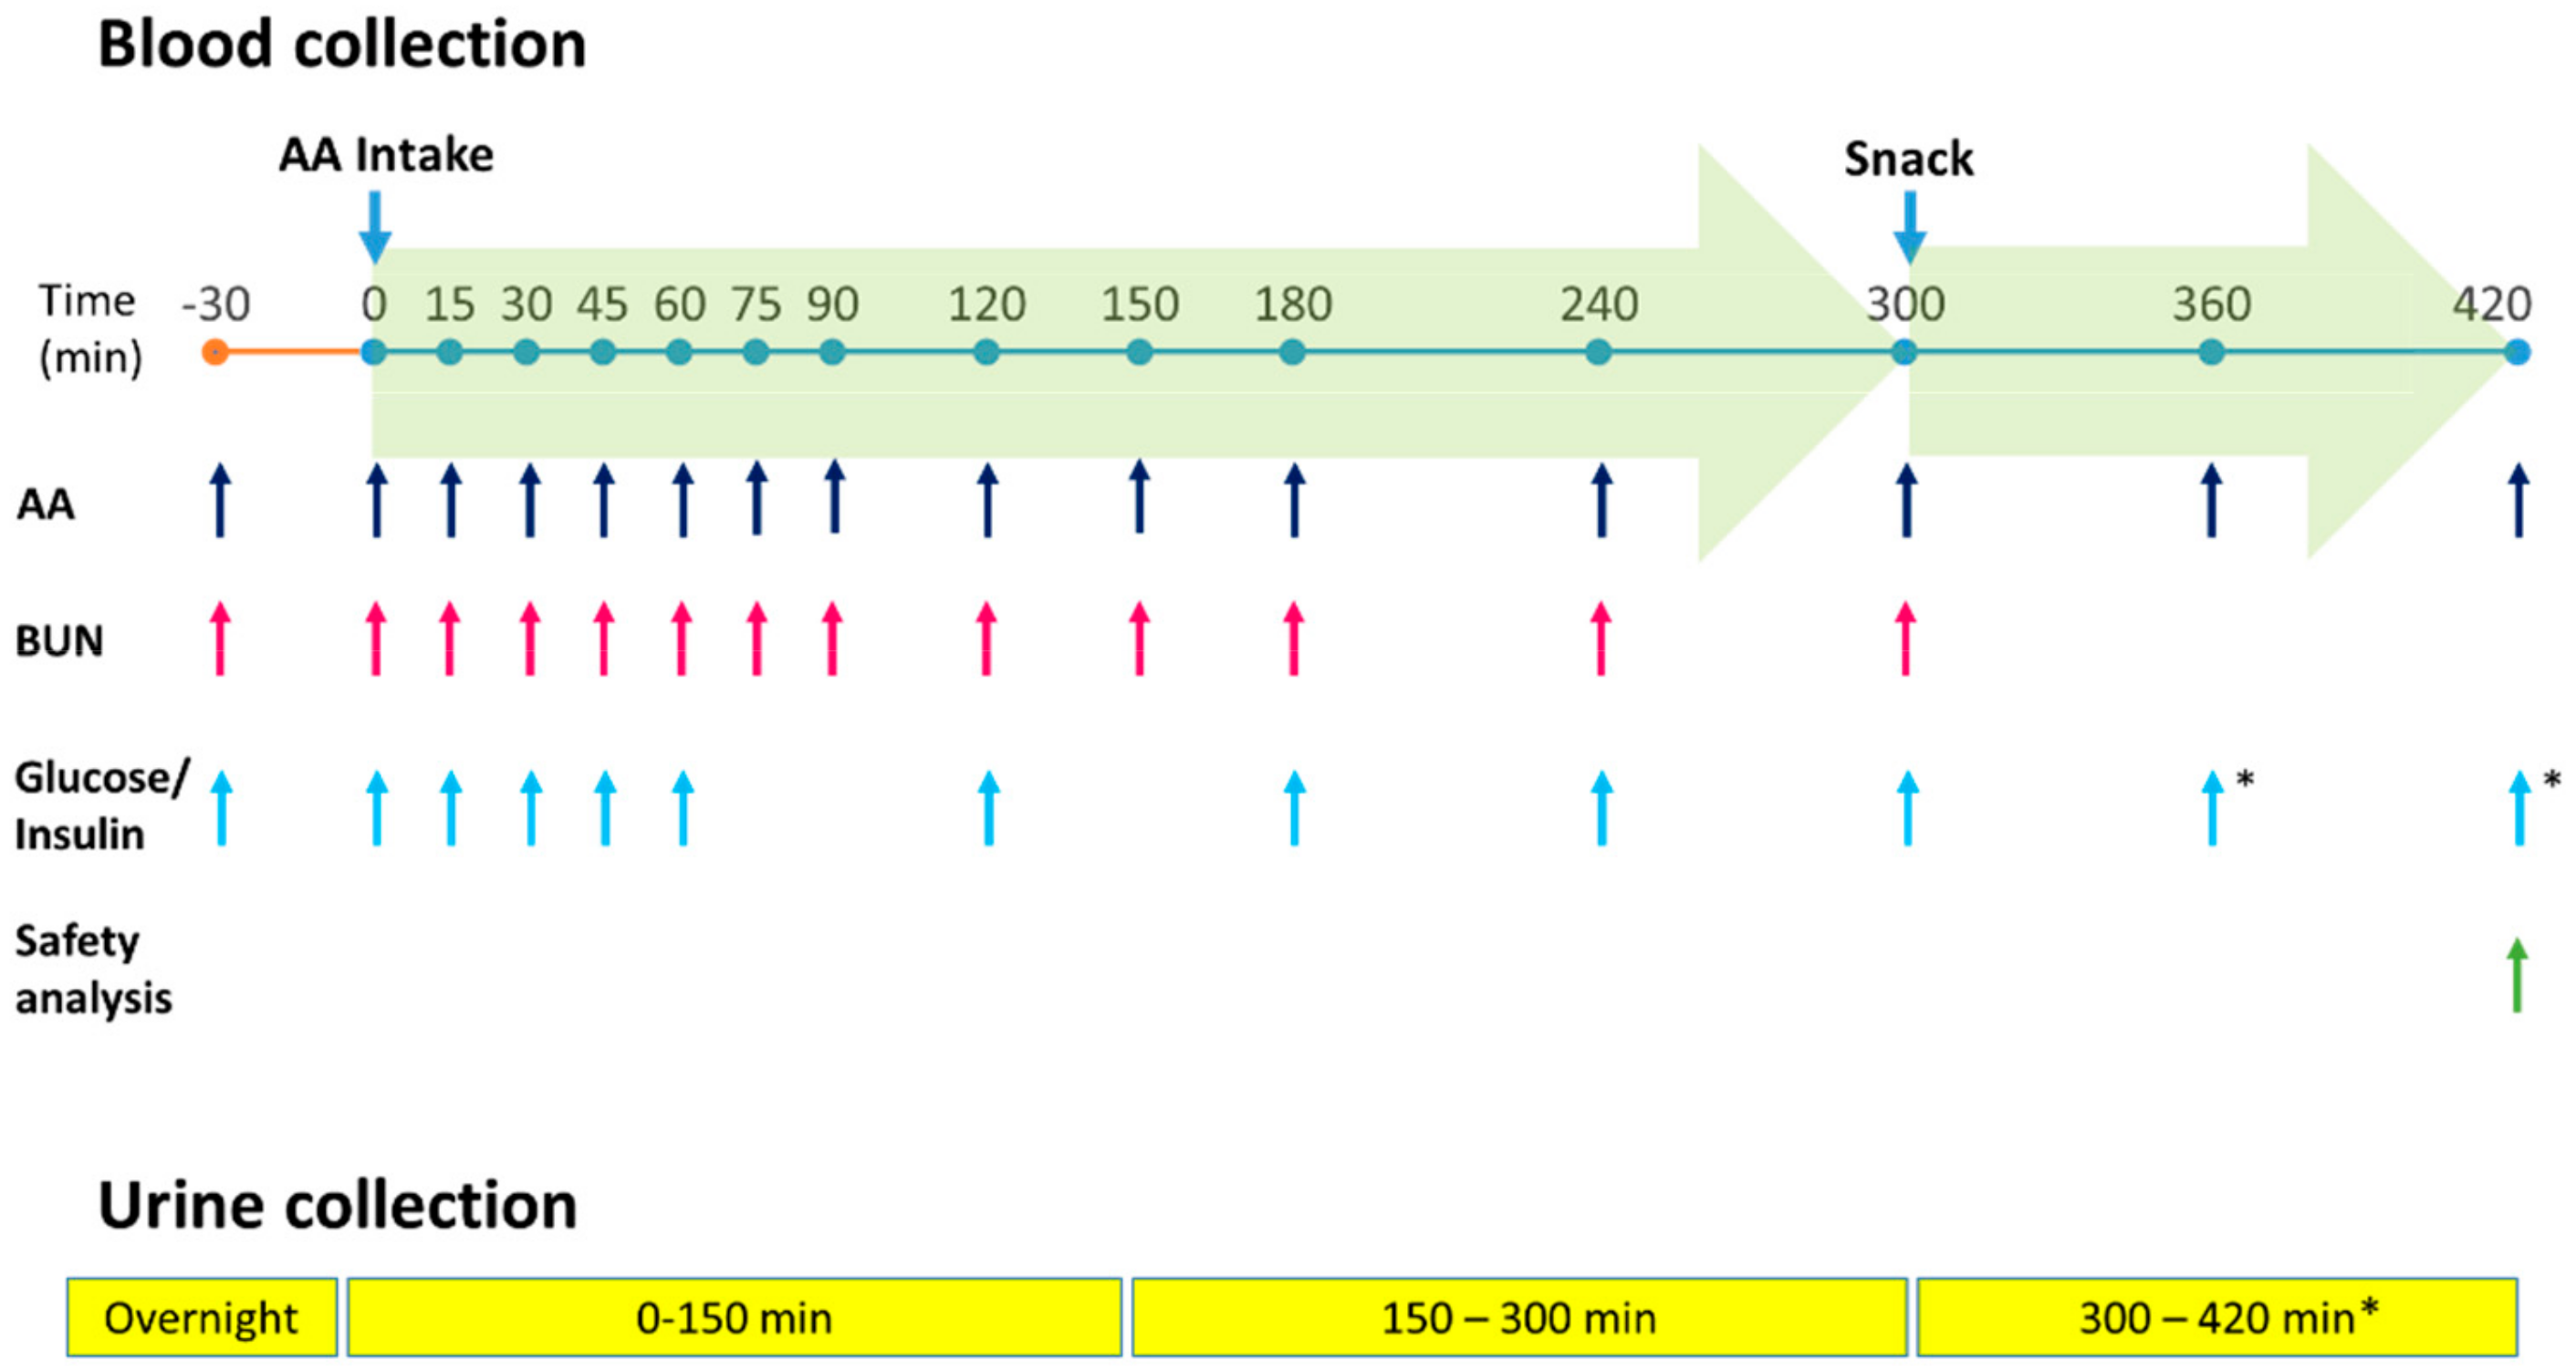
2.2. Study Design
2.3. Primary Endpoints
- 1)
- Superiority in terms of the Cmax in plasma essential amino acids (EAAs) and
- 2)
- Bioequivalence in terms of plasma AUC of the EAAs over the first 5 h after product intake (AUC0-300min); the AUC cut-off was set at 5 h to avoid potential changes in plasma AAs after the snack was administered.
2.4. Secondary Endpoints
- 1)
- Cmax of these AA groups in plasma;
- 2)
- Their bioequivalence in terms of plasma AUC over the first 7 hours after product intake (AUC0-420 min);
- 3)
- Their plasma concentration at the last measured time point (Clast).
2.5. Secondary Comparisons
2.6. Safety Assessments
2.7. Statistical Analysis
3. Results
3.1. Kinetic Outcomes
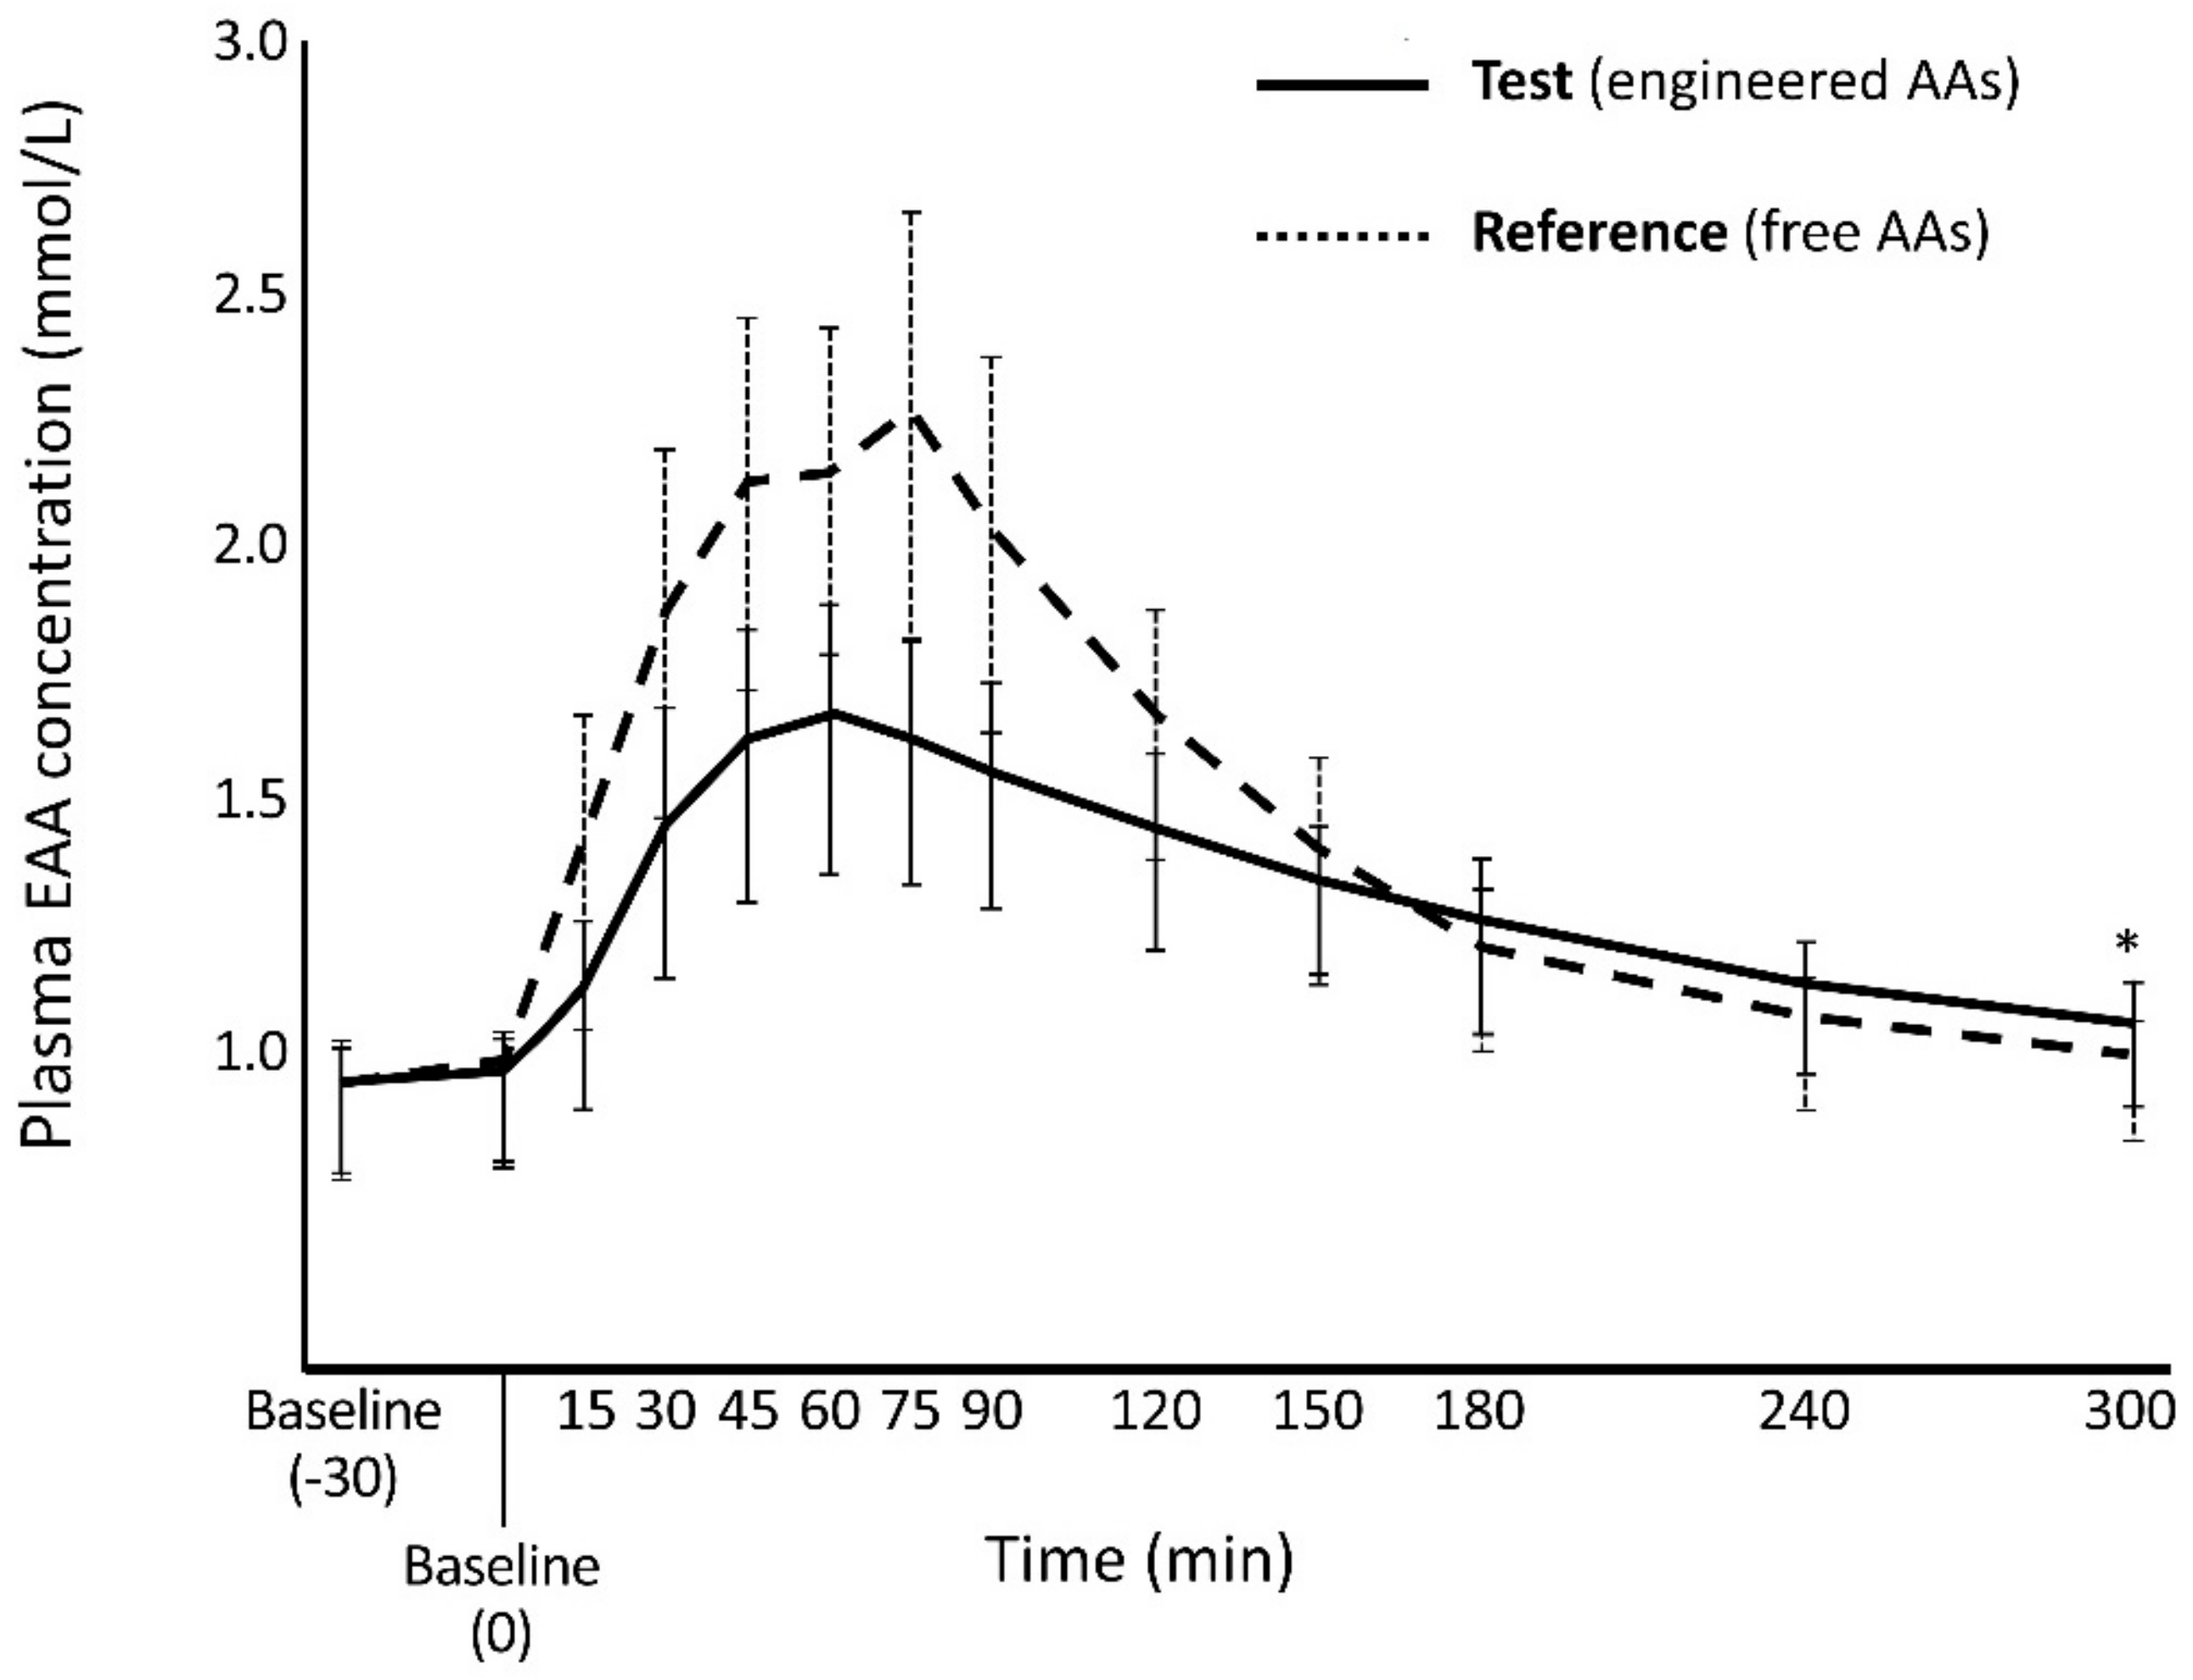
3.1.1. Primary Endpoints
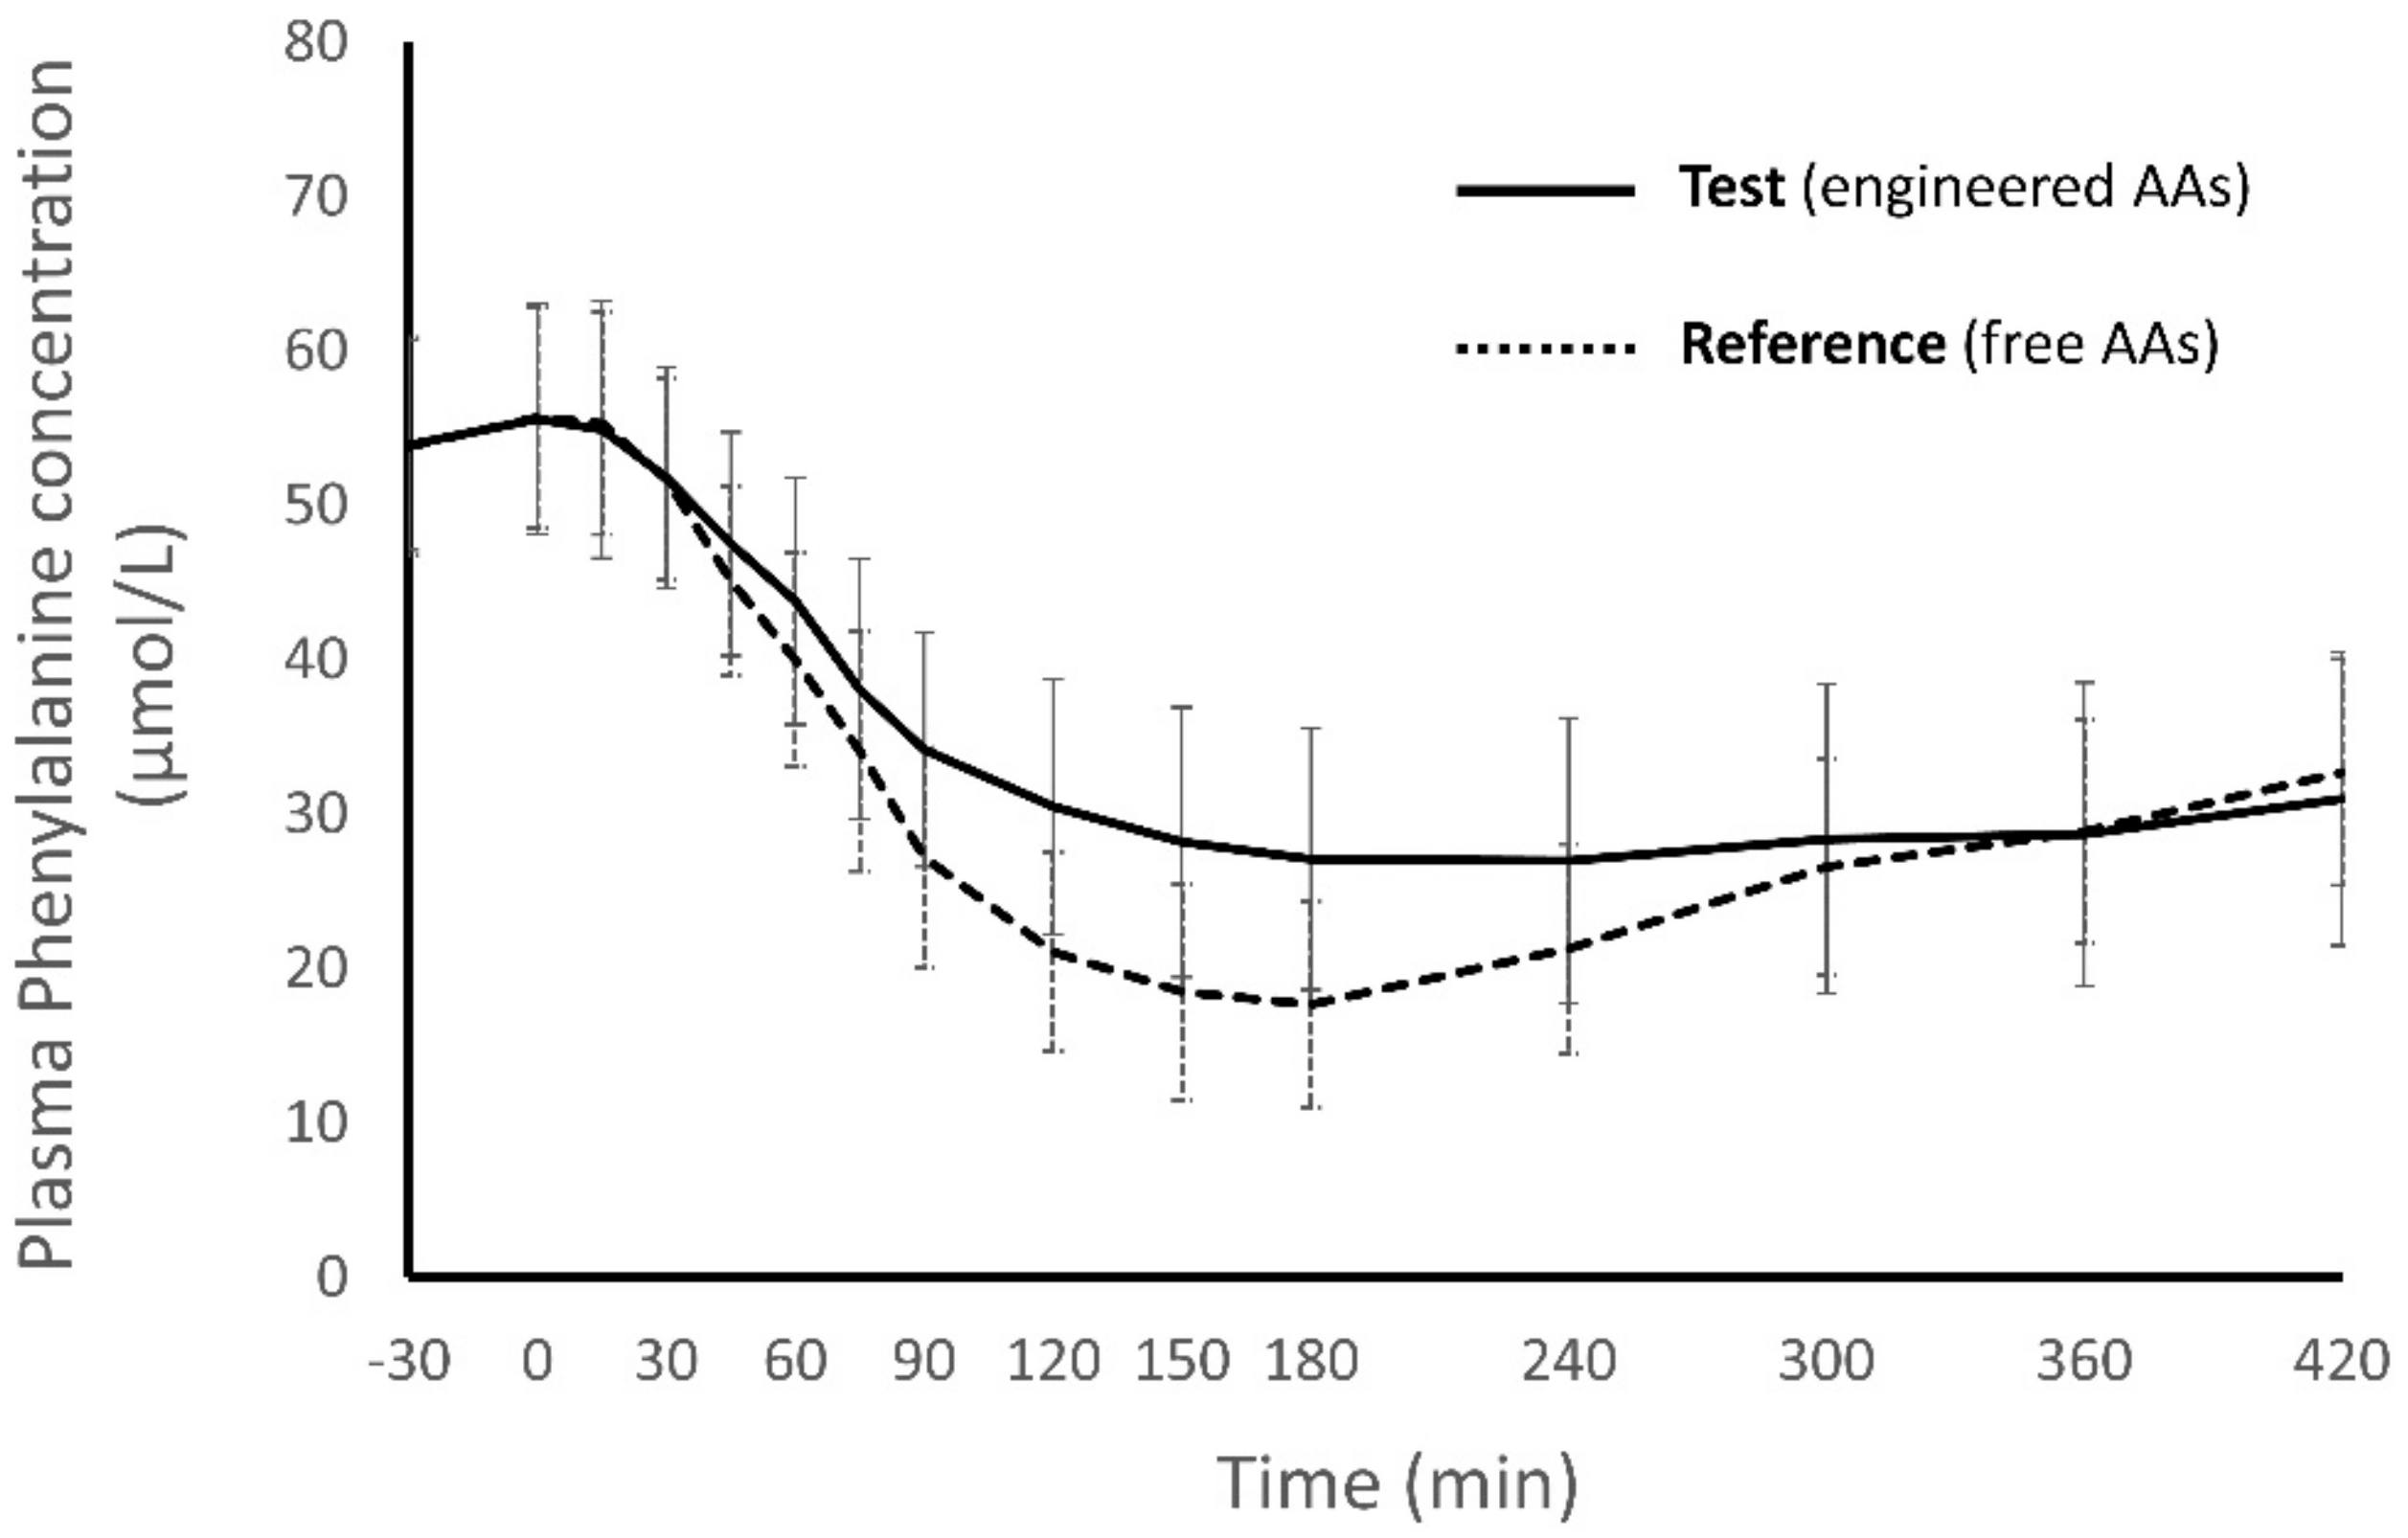
3.1.2. Secondary Endpoints
3.1.3. Secondary Comparisons
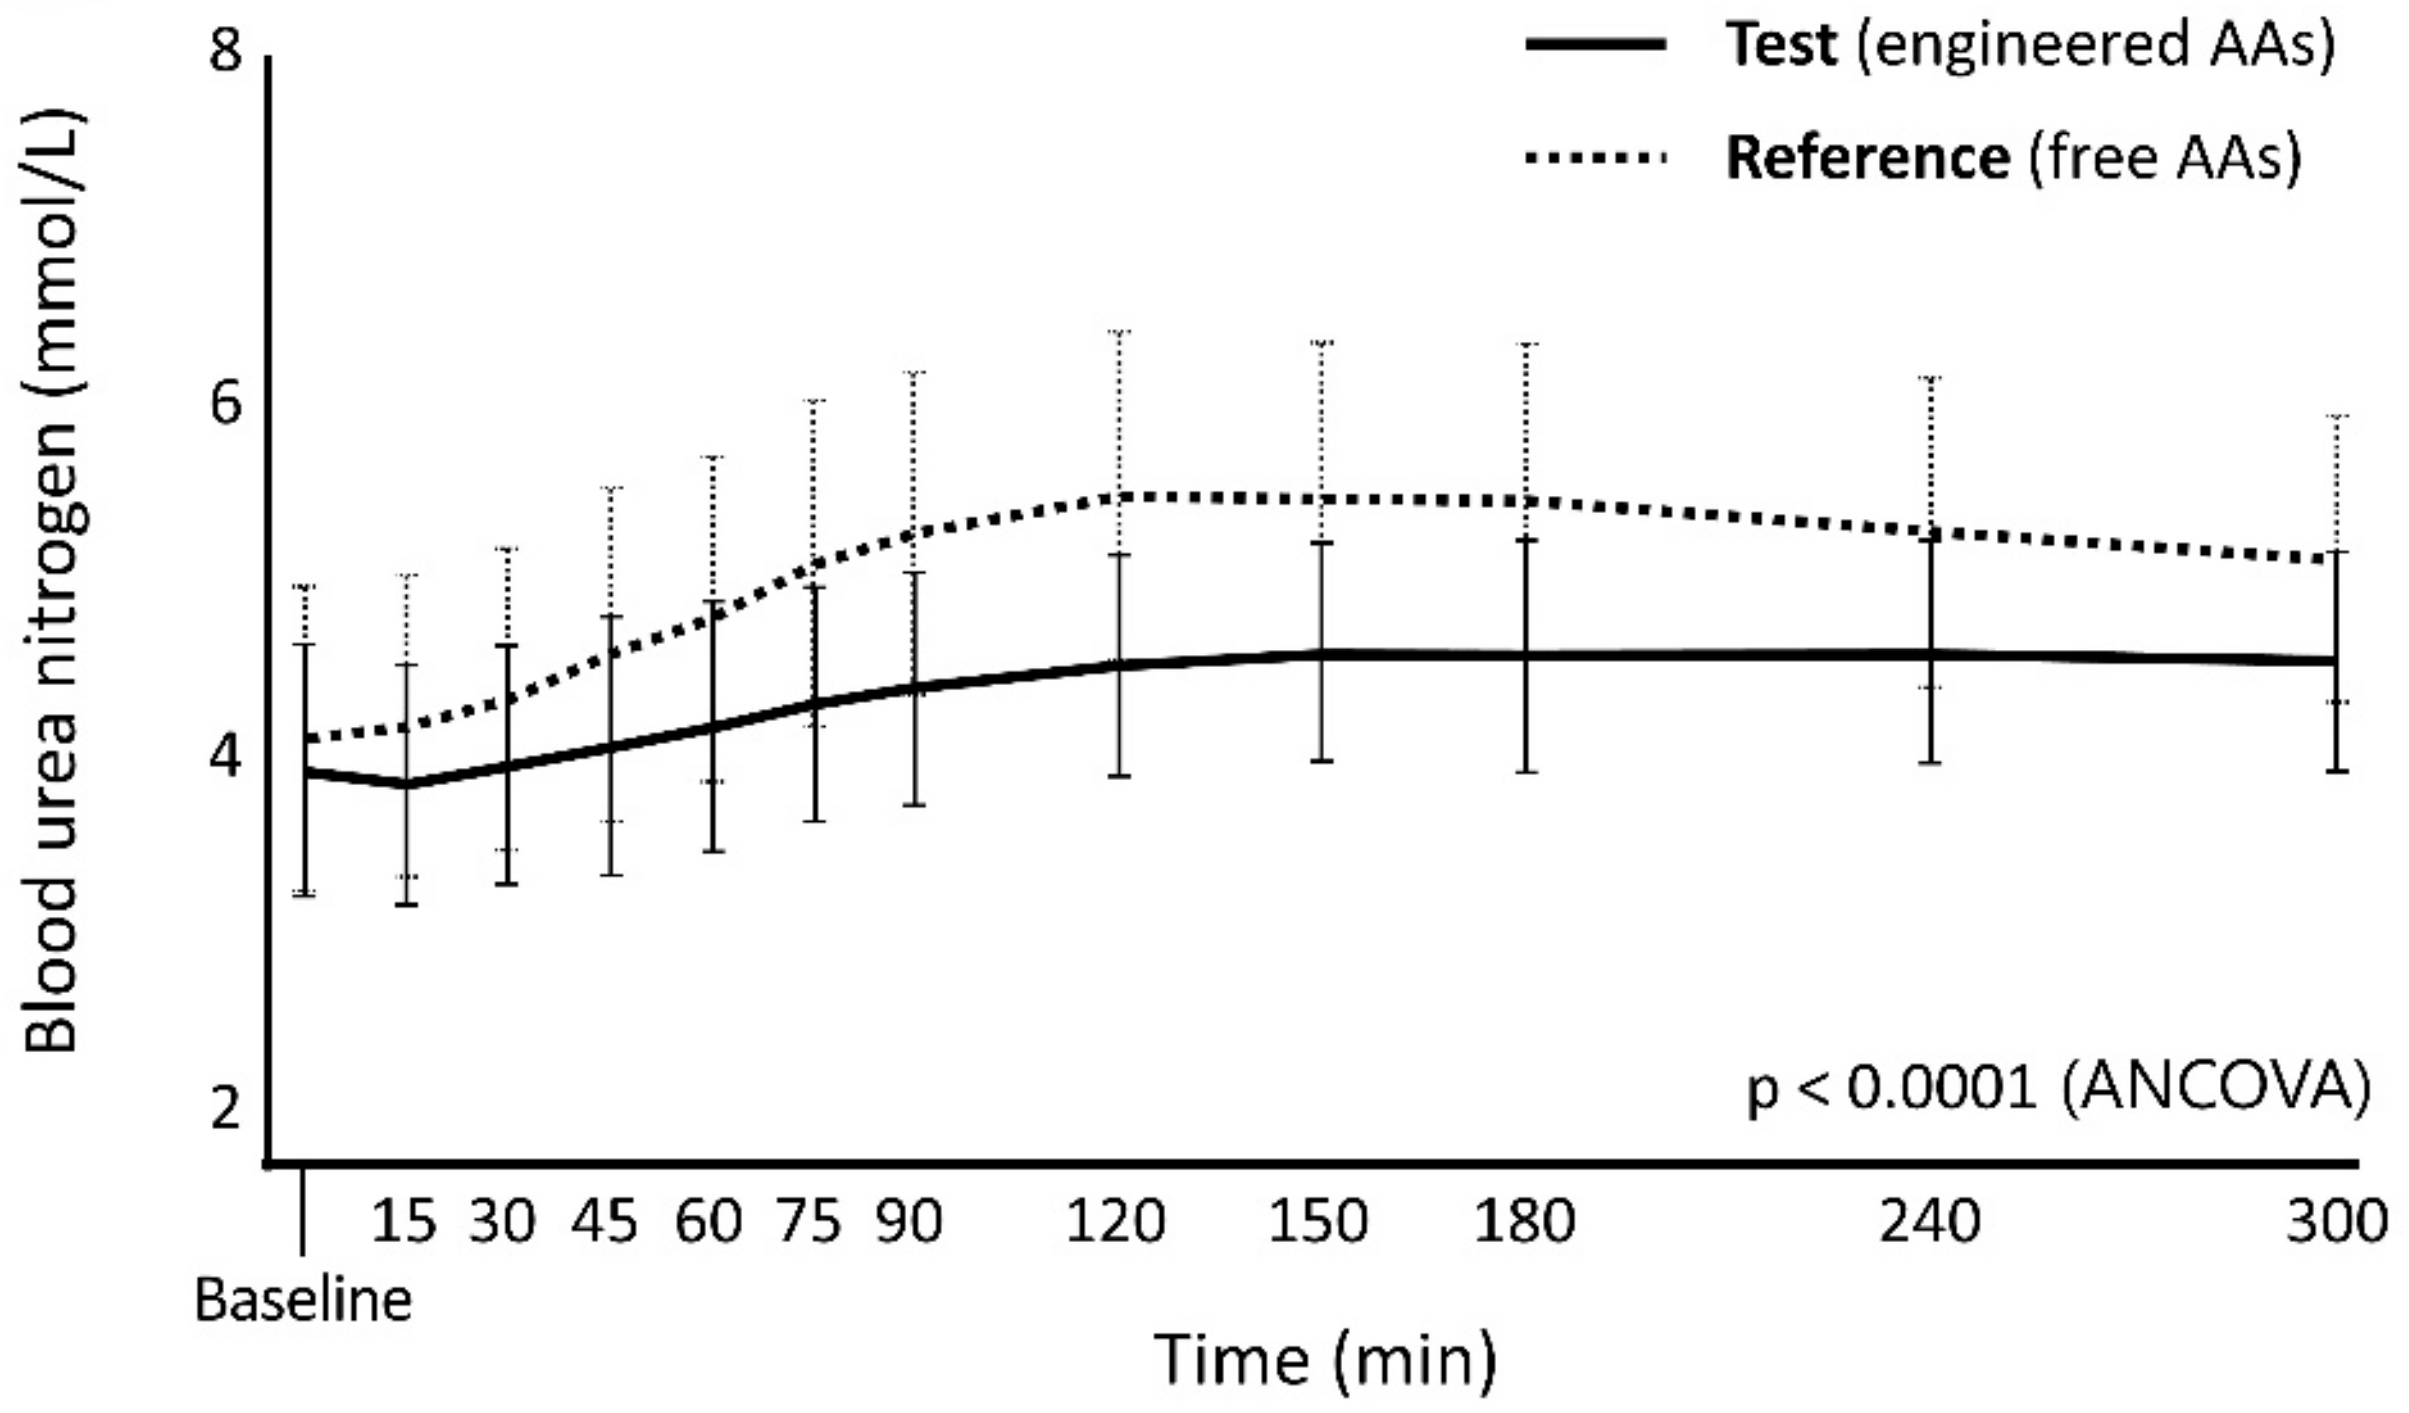
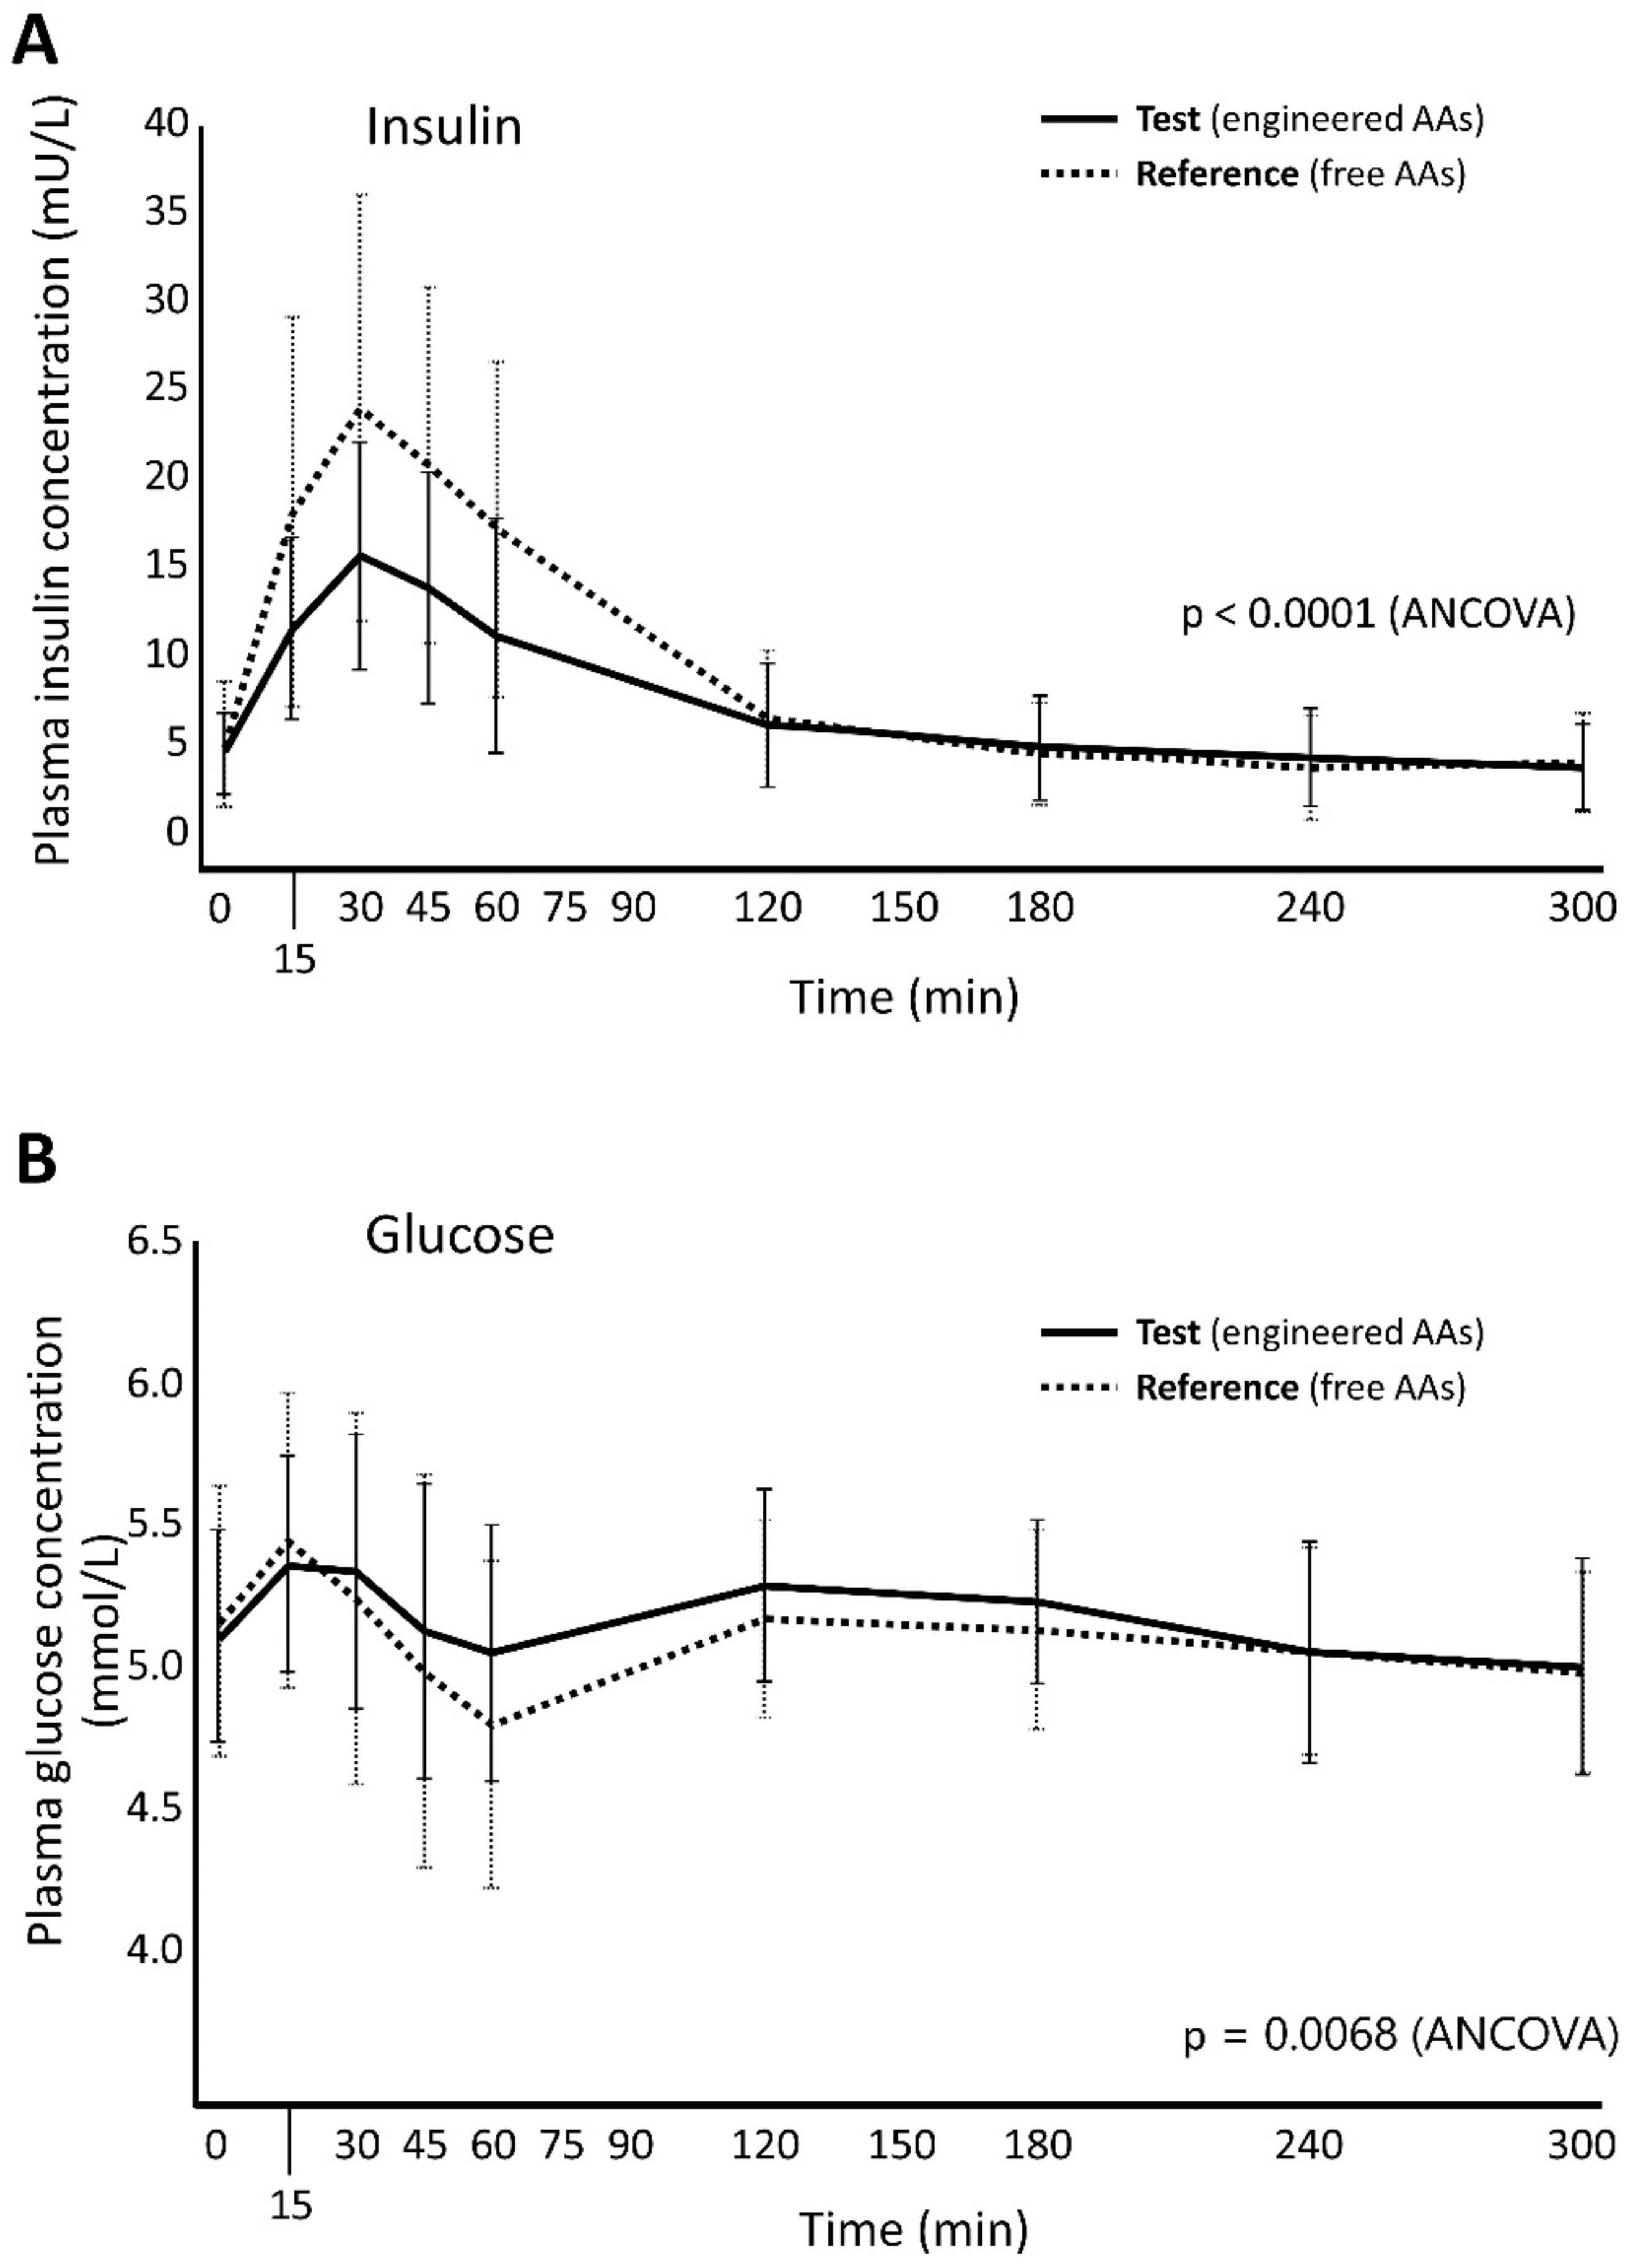
3.2. Markers of Metabolism
3.3. Safety Profile
4. Discussion
5. Conclusions
Supplementary Materials
Author Contributions
Funding
Acknowledgments
Conflicts of Interest
References
- Waters, D.; Adeloye, D.; Woolham, D.; Wastnedge, E.; Patel, S.; Rudan, I. Global birth prevalence and mortality from inborn errors of metabolism: A systematic analysis of the evidence. J. Glob. Health 2018, 8, 021102. [Google Scholar] [CrossRef] [PubMed]
- Sanderson, S.; Green, A.; A Preece, M.; Burton, H. The incidence of inherited metabolic disorders in the West Midlands, UK. Arch. Dis. Child. 2006, 91, 896–899. [Google Scholar] [CrossRef] [PubMed]
- Van Wegberg, A.M.J.; Macdonald, A.; Ahring, K.; Bélanger-Quintana, A.; Blau, N.; Bosch, A.M.; Burlina, A.; Campistol, J.; Feillet, F.; Giżewska, M.; et al. The complete European guidelines on phenylketonuria: Diagnosis and treatment. Orphanet J. Rare Dis. 2017, 12, 162. [Google Scholar] [CrossRef] [PubMed]
- Morris, A.A.M.; Kozich, V.; Santra, S.; Andria, G.; Ben-Omran, T.I.M.; Chakrapani, A.B.; Crushell, E.; Henderson, M.J.; Hochuli, M.; Huemer, M.; et al. Guidelines for the diagnosis and management of cystathionine beta-synthase deficiency. J. Inherit. Metab. Dis. 2016, 40, 49–74. [Google Scholar] [CrossRef]
- Frazier, D.M.; Allgeier, C.; Homer, C.S.; Marriage, B.J.; Ogata, B.; Rohr, F.; Splett, P.L.; Stembridge, A.; Singh, R. Nutrition management guideline for maple syrup urine disease: An evidence and consensus-based approach. Mol. Genet. Metab. 2014, 112, 210–217. [Google Scholar] [CrossRef]
- Van Spronsen, F.J.; Van Rijn, M.; Meyer, U.; Das, A. Dietary Considerations in Tyrosinemia Type I. In Plant Promoters and Transcription Factors; Springer Science and Business Media: Berlin/Heidelberg, Germany, 2017; Volume 959, pp. 197–204. [Google Scholar]
- Gokmen-Ozel, H.; Macdonald, A.; Daly, A.; Ashmore, C.; Preece, M.A.; Hendriksz, C.; Vijay, S.; Chakrapani, A. Dietary practices in glutaric aciduria type 1 over 16 years. J. Hum. Nutr. Diet. 2012, 25, 514–519. [Google Scholar] [CrossRef]
- Molema, F.; Gleich, F.; Burgard, P.; Van Der Ploeg, A.T.; Summar, M.L.; Chapman, K.A.; Barić, I.; Lund, A.M.; Kölker, S.; Williams, M.; et al. Evaluation of dietary treatment and amino acid supplementation in organic acidurias and urea-cycle disorders: On the basis of information from a European multicenter registry. J. Inherit. Metab. Dis. 2019, 42, 1162–1175. [Google Scholar] [CrossRef]
- Ney, D.M.; Etzel, M.R. Designing medical foods for inherited metabolic disorders: Why intact protein is superior to amino acids. Curr. Opin. Biotechnol. 2017, 44, 39–45. [Google Scholar] [CrossRef]
- Gropper, S.S.; Gropper, D.M.; Acosta, P.B. Plasma Amino Acid Response to Ingestion of L-Amino Acids and Whole Protein. J. Pediatr. Gastroenterol. Nutr. 1993, 16, 143–150. [Google Scholar] [CrossRef]
- Jones, B.J.; Lees, R.; Andrews, J.; Frost, P.; Silk, D.B. Comparison of an elemental and polymeric enteral diet in patients with normal gastrointestinal function. Gut 1983, 24, 78–84. [Google Scholar] [CrossRef]
- Boirie, Y.; Dangin, M.; Gachon, P.; Vasson, M.-P.; Maubois, J.-L.; Beaufrère, B. Slow and fast dietary proteins differently modulate postprandial protein accretion. Proc. Natl. Acad. Sci. USA 1997, 94, 14930–14935. [Google Scholar] [CrossRef] [PubMed]
- Dangin, M.; Boirie, Y.; Garcia-Rodenas, C.; Gachon, P.; Fauquant, J.; Callier, P.; Ballèvre, O.; Beaufrere, B. The digestion rate of protein is an independent regulating factor of postprandial protein retention. Am. J. Physiol. Metab. 2001, 280, E340–E348. [Google Scholar] [CrossRef] [PubMed]
- Hennermann, J.B.; Roloff, S.; Gellermann, J.; Vollmer, I.; Windt, E.; Vetter, B.; Plöckinger, U.; Mönch, E.; Querfeld, U. Chronic kidney disease in adolescent and adult patients with phenylketonuria. J. Inherit. Metab. Dis. 2012, 36, 747–756. [Google Scholar] [CrossRef] [PubMed]
- Singh, R.; Cunningham, A.C.; Mofidi, S.; Douglas, T.D.; Frazier, D.M.; Hook, D.G.; Jeffers, L.; McCune, H.; Moseley, K.D.; Ogata, B.; et al. Updated, web-based nutrition management guideline for PKU: An evidence and consensus based approach. Mol. Genet. Metab. 2016, 118, 72–83. [Google Scholar] [CrossRef] [PubMed]
- Van Spronsen, F.J.; Van Wegberg, A.M.; Ahring, K.; Bélanger-Quintana, A.; Blau, N.; Bosch, A.M.; Burlina, A.; Campistol, J.; Feillet, F.; Giżewska, M.; et al. Key European guidelines for the diagnosis and management of patients with phenylketonuria. Lancet Diabetes Endocrinol. 2017, 5, 743–756. [Google Scholar] [CrossRef]
- Macdonald, A.; Singh, R.H.; Rocha, J.C.; Van Spronsen, F.J. Optimising amino acid absorption: Essential to improve nitrogen balance and metabolic control in phenylketonuria. Nutr. Res. Rev. 2018, 32, 70–78. [Google Scholar] [CrossRef]
- Giarratana, N.; Gallina, G.; Panzeri, V.; Frangi, A.; Canobbio, A.; Reiner, G. A New Phe-Free Protein Substitute Engineered to Allow a Physiological Absorption of Free Amino Acids for Phenylketonuria. J. Inborn Errors Metab. Screen. 2018, 6, 232640981878378. [Google Scholar] [CrossRef]
- European Medicines Agency. Guideline on the Investigation of Bioequivalence. Available online: https://www.ema.europa.eu/en/investigation-bioequivalence (accessed on 15 January 2020).
- US FDA. Bioavailability and Bioequivalence Studies Submitted in NDAs or INDs—General Considerations FDA. Available online: https://www.fda.gov/regulatory-information/search-fda-guidance-documents/bioavailability-and-bioequivalence-studies-submitted-ndas-or-inds-general-considerations (accessed on 15 January 2020).
- Flint, A.; Raben, A.; Blundell, J.; Astrup, A. Reproducibility, power and validity of visual analogue scales in assessment of appetite sensations in single test meal studies. Int. J. Obes. 2000, 24, 38–48. [Google Scholar] [CrossRef]
- Gropper, S.S.; Acosta, P.B. Effect of Simultaneous Ingestion of L-Amino Acids and Whole Protein on Plasma Amino Acid and Urea Nitrogen Concentrations in Humans. J. Parenter. Enter. Nutr. 1991, 15, 48–53. [Google Scholar] [CrossRef]
- Lacroix, M.; Bos, C.; Léonil, J.; Airinei, G.; Luengo, C.; Daré, S.; Benamouzig, R.; Fouillet, H.; Fauquant, J.; Tomé, D.; et al. Compared with casein or total milk protein, digestion of milk soluble proteins is too rapid to sustain the anabolic postprandial amino acid requirement. Am. J. Clin. Nutr. 2006, 84, 1070–1079. [Google Scholar] [CrossRef]
- Metges, C.C.; E El-Khoury, A.; Selvaraj, A.B.; Tsay, R.H.; Atkinson, A.; Regan, M.M.; Bequette, B.J.; Young, V.R. Kinetics of L-[1-(13)C]leucine when ingested with free amino acids, unlabeled or intrinsically labeled casein. Am. J. Physiol. Metab. 2000, 278, E1000–E1009. [Google Scholar] [CrossRef]
- Mönch, E.; Herrmann, M.E.; Brösicke, H.; Schöffer, A.; Keller, M. Utilisation of amino acid mixtures in adolescents with phenylketonuria. Eur. J. Nucl. Med. Mol. Imaging 1996, 155, S115–S120. [Google Scholar] [CrossRef] [PubMed]
- Pennings, B.; Boirie, Y.; Senden, J.M.; Gijsen, A.P.; Kuipers, H.; Van Loon, L.J.C. Whey protein stimulates postprandial muscle protein accretion more effectively than do casein and casein hydrolysate in older men. Am. J. Clin. Nutr. 2011, 93, 997–1005. [Google Scholar] [CrossRef]
- Reitelseder, S.; Agergaard, J.; Doessing, S.; Helmark, I.C.; Lund, P.; Kristensen, N.B.; Frystyk, J.; Flyvbjerg, A.; Schjerling, P.; Van Hall, G.; et al. Whey and casein labeled with l-[1–13C]leucine and muscle protein synthesis: Effect of resistance exercise and protein ingestion. Am. J. Physiol. Metab. 2011, 300, E231–E242. [Google Scholar] [CrossRef]
- Van Spronsen, F.J.; Van Dijk, T.; Smit, G.P.; Van Rijn, M.; Reijngoud, D.-J.; Berger, R.; Heymans, H.S. Large daily fluctuations in plasma tyrosine in treated patients with phenylketonuria. Am. J. Clin. Nutr. 1996, 64, 916–921. [Google Scholar] [CrossRef]
- Van Spronsen, F.J.; Van Rijn, M.; Bekhof, J.; Koch, R.; Smit, P.G. Phenylketonuria: Tyrosine supplementation in phenylalanine-restricted diets. Am. J. Clin. Nutr. 2001, 73, 153–157. [Google Scholar] [CrossRef] [PubMed]
- Grünert, S.C.; Brichta, C.M.; Krebs, A.; Clement, H.-W.; Rauh, R.; Fleischhaker, C.; Hennighausen, K.; Sass, J.O.; Schwab, K.O. Diurnal variation of phenylalanine and tyrosine concentrations in adult patients with phenylketonuria: Subcutaneous microdialysis is no adequate tool for the determination of amino acid concentrations. Nutr. J. 2013, 12, 60. [Google Scholar] [CrossRef]
- MacDonald, A.; Rylance, G.W.; Asplin, D.; Hall, S.K.; Booth, I.W. Does a single plasma phenylalanine predict quality of control in phenylketonuria? Arch. Dis. Child. 1998, 78, 122–126. [Google Scholar] [CrossRef]
- Giordano, M.; Castellino, P.; DeFronzo, R.A. Differential responsiveness of protein synthesis and degradation to amino acid availability in humans. Diabetes 1996, 45, 393–399. [Google Scholar] [CrossRef]
- Atherton, P.; Etheridge, T.; Watt, P.W.; Wilkinson, D.; Selby, A.; Rankin, D.; Smith, K.; Rennie, M.J. Muscle full effect after oral protein: Time-dependent concordance and discordance between human muscle protein synthesis and mTORC1 signaling. Am. J. Clin. Nutr. 2010, 92, 1080–1088. [Google Scholar] [CrossRef]
- Floyd, J.C.; Fajans, S.S.; Conn, J.W.; Knopf, R.F.; Rüll, J. Stimulation of insulin secretion by amino acids. J. Clin. Investig. 1966, 45, 1487–1502. [Google Scholar] [CrossRef] [PubMed]
- Weigel, C.; Rauh, M.; Kiener, C.; Rascher, W.; Knerr, I. Effects of Various Dietary Amino Acid Preparations for Phenylketonuric Patients on the Metabolic Profiles along with Postprandial Insulin and Ghrelin Responses. Ann. Nutr. Metab. 2007, 51, 352–358. [Google Scholar] [CrossRef] [PubMed]
- Flint, A.; Gregersen, N.T.; Gluud, L.L.; Møller, B.K.; Raben, A.; Tetens, I.; Verdich, C.; Astrup, A. Associations between postprandial insulin and blood glucose responses, appetite sensations and energy intake in normal weight and overweight individuals: A meta-analysis of test meal studies. Br. J. Nutr. 2007, 98, 17–25. [Google Scholar] [CrossRef]
- Rosén, L.A.; Ostman, E.; Björck, I. Effects of cereal breakfasts on postprandial glucose, appetite regulation and voluntary energy intake at a subsequent standardized lunch; focusing on rye products. Nutr. J. 2011, 10, 7. [Google Scholar] [CrossRef] [PubMed]
- Krog-Mikkelsen, I.; Sloth, B.; Dimitrov, D.; Tetens, I.; Björck, I.; Flint, A.; Holst, J.J.; Astrup, A.; Elmståhl, H.; Raben, A. A Low Glycemic Index Diet Does Not Affect Postprandial Energy Metabolism but Decreases Postprandial Insulinemia and Increases Fullness Ratings in Healthy Women. J. Nutr. 2011, 141, 1679–1684. [Google Scholar] [CrossRef] [PubMed]
- US FDA. Select Committee on GRAS Substances (SCOGS) Opinion: Cellulose Acetate (Packaging) and Ethyl Cellulose (Packaging). Available online: http://wayback.archive-it.org/7993/20171031061136/https://www.fda.gov/Food/IngredientsPackagingLabeling/GRAS/SCOGS/ucm261248.htm (accessed on 15 January 2020).
- US FDA. Select Committee on GRAS Substances (SCOGS) Opinion: Alginates. Available online: http://wayback.archive-it.org/7993/20171031063235/https://www.fda.gov/Food/IngredientsPackagingLabeling/GRAS/SCOGS/ucm260857.htm (accessed on 15 January 2020).
- Van Rijn, M.; Hoeksma, M.; Sauer, P.; Szczerbak, B.; Gross, M.; Reijngoud, D.-J.; Van Spronsen, F. Protein metabolism in adult patients with phenylketonuria. Nutrition 2007, 23, 445–453. [Google Scholar] [CrossRef]
- Thompson, G.N.; Pacy, P.J.; E Watts, R.W.; Halliday, D. Protein Metabolism in Phenylketonuria and Lesch-Nyhan Syndrome. Pediatr. Res. 1990, 28, 240–246. [Google Scholar] [CrossRef] [PubMed]


| EAA Cmax mmol/L, Mean (SD) | Cmax Ratio | p-Value ‡ | |
| Test | Reference | ||
| 1.77 (0.253) | 2.44 (0.368) | 0.726 | <0.0001 |
| EAA AUC0-300min (mmol/L) min, Mean (SD) | AUC0-300min Ratio | 90% CI | |
| Test | Reference | ||
| 396 (45.0) | 444 (46.2) | 0.890 | 0.865, 0.915 * |
| AA Group | Cmax mmol/L, Mean (SD) | Cmax Ratio | p-Value ‡ | |
|---|---|---|---|---|
| Test | Reference | |||
| LNAAs | 1.27 (0.175) | 1.87 (0.301) | 0.677 | <0.0001 |
| BCAAs | 0.693 (0.106) | 1.20 (0.221) | 0.579 | <0.0001 |
| Total AAs | 3.57 (0.468) | 4.59 (0.576) | 0.775 | <0.0001 |
| AA Group | AUC0–420min (mmol/L) *min, Mean (SD) | AUC0–420min Ratio | 90% CI | |
|---|---|---|---|---|
| Test | Reference | |||
| EAAs | 509 (57.1) | 549 (55.1) | 0.924 | 0.900, 0.950 * |
| LNAAs | 385 (43.2) | 424 (43.9) | 0.908 | 0.885, 0.932 * |
| BCAAs | 206 (28.3) | 240 (29.6) | 0.860 | 0.836, 0.885 * |
| Total AAs | 1106 (129) | 1176 (97.2) | 0.937 | 0.909, 0.966 * |
| AA Group | Clast mmol/L, Mean (SD) | Clast Ratio | p-Value ‡ | |
|---|---|---|---|---|
| Test | Reference | |||
| EAAs | 0.822 (0.119) | 0.780 (0.0882) | 1.054 | 0.0158 |
| LNAAs | 0.628 (0.0920) | 0.595 (0.0677) | 1.055 | 0.0123 |
| BCAAs | 0.316 (0.0596) | 0.281 (0.0525) | 1.126 | 0.0001 |
| Total AAs | 2.09 (0.275) | 2.06 (0.207) | 1.012 | 0.5658 |
| AA Group | Cmax mmol/L, Mean (SD) | Comparisons | |||||
|---|---|---|---|---|---|---|---|
| Test vs. MP | Test vs. Casein | ||||||
| Test | MP | Casein | Cmax Ratio | p-Value ‡ | Cmax Ratio | p-Value ‡ | |
| EAAs | 1.77 (0.253) | 2.12 (0.314) | 2.18 (0.379) | 0.835 | <0.0001 | 0.818 | <0.0001 |
| LNAAs | 1.27 (0.175) | 1.64 (0.226) | 1.68 (0.282) | 0.775 | <0.0001 | 0.759 | <0.0001 |
| BCAAs | 0.693 (0.106) | 1.043 (0.149) | 1.03 (0.189) | 0.664 | <0.0001 | 0.676 | <0.0001 |
| Total AAs | 3.57 (0.468) | 4.11 (0.585) | 4.16 (0.613) | 0.870 | <0.0001 | 0.860 | <0.0001 |
| AA Group | AUC0–420min (mmol/L) *min, Mean (SD) | Comparisons | |||||
|---|---|---|---|---|---|---|---|
| Test vs. MP | Test vs. Casein | ||||||
| Test | MP | Casein | AUC0–420min Ratio | 90% CI | AUC0–420min Ratio | 90% CI | |
| EAAs | 509 (57.2) | 556 (54.6) | 543 (55.4) | 0.917 | 0.892, 0.942 * | 0.936 | 0.910, 0.961 * |
| LNAAs | 385 (43.2) | 435 (39.0) | 422 (40.3) | 0.887 | 0.864, 0.910 * | 0.911 | 0.888, 0.935 * |
| BCAAs | 207 (28.3) | 263 (26.1) | 248 (27.3) | 0.758 | 0.763, 0.807 | 0.829 | 0.806, 0.852 * |
| Total AAs | 1106 (129) | 1170 (123) | 1160 (122) | 0.945 | 0.917, 0.974 * | 0.952 | 0.923, 0.981 * |
| Statistics | Test | Reference | Casein | MP |
|---|---|---|---|---|
| LSM, mmol 95% CI | 40.1 36.0, 44.2 | 45.6 41.6, 49.6 | 43.7 39.7, 47.7 | 39.9 35.8, 43.9 |
| Comparisons with Test | LSM Difference | 95% CI | p-Value | |
| vs Reference | −5.52 | −9.52, −1.52 | 0.0074 * | |
| vs Casein | −3.62 | −7.61, 0.37 | 0.075 | |
| vs MP | 0.203 | −3.85, 4.25 | 0.92 |
| Parameter | AUC0-300min Mean (SD) | Ratio of Geometric LSM (90% CI) | |||||
|---|---|---|---|---|---|---|---|
| Test | Reference | MP | Casein | Test vs. Reference | Test vs. MP | Test vs. Casein | |
| BUN, (mmol/L) *min | 1357 (201) | 1573 (266) | 1423 (241) | 1476 (292) | 0.868 (0.837, 0.900) | 0.957 (0.923, 0.993) | 0.927 (0.894, 0.962) |
| Insulin, (U/L) *min | 2.14 (1.01) | 2.70 (1.38) | 2.59 (1.08) | 2.60 (1.34) | 0.785 (0.716, 0.861) | 0.803 (0.732, 0.880) | 0.819 (0.748, 0.898) |
| Glucose, (mmol/L) *min | 1621 (91) | 1609 (93) | 1610 (86) | 1600 (111) | 1.005 (0.992, 1.019) | 1.006 (0.992, 1.019) | 1.012 (0.999, 1.026) |
© 2020 by the authors. Licensee MDPI, Basel, Switzerland. This article is an open access article distributed under the terms and conditions of the Creative Commons Attribution (CC BY) license (http://creativecommons.org/licenses/by/4.0/).
Share and Cite
Scheinin, M.; Barassi, A.; Junnila, J.; Lovró, Z.; Reiner, G.; Sarkkinen, E.; MacDonald, A. Amino Acid Plasma Profiles from a Prolonged-Release Protein Substitute for Phenylketonuria: A Randomized, Single-Dose, Four-Way Crossover Trial in Healthy Volunteers. Nutrients 2020, 12, 1653. https://doi.org/10.3390/nu12061653
Scheinin M, Barassi A, Junnila J, Lovró Z, Reiner G, Sarkkinen E, MacDonald A. Amino Acid Plasma Profiles from a Prolonged-Release Protein Substitute for Phenylketonuria: A Randomized, Single-Dose, Four-Way Crossover Trial in Healthy Volunteers. Nutrients. 2020; 12(6):1653. https://doi.org/10.3390/nu12061653
Chicago/Turabian StyleScheinin, Mika, Anna Barassi, Jouni Junnila, Zsófia Lovró, Giorgio Reiner, Essi Sarkkinen, and Anita MacDonald. 2020. "Amino Acid Plasma Profiles from a Prolonged-Release Protein Substitute for Phenylketonuria: A Randomized, Single-Dose, Four-Way Crossover Trial in Healthy Volunteers" Nutrients 12, no. 6: 1653. https://doi.org/10.3390/nu12061653
APA StyleScheinin, M., Barassi, A., Junnila, J., Lovró, Z., Reiner, G., Sarkkinen, E., & MacDonald, A. (2020). Amino Acid Plasma Profiles from a Prolonged-Release Protein Substitute for Phenylketonuria: A Randomized, Single-Dose, Four-Way Crossover Trial in Healthy Volunteers. Nutrients, 12(6), 1653. https://doi.org/10.3390/nu12061653