Review

The Association between Sleep Duration and Metabolic Syndrome: The NHANES 2013/2014

1
Department of Surgery, Westchester Medical Center, School of Medicine, New York Medical College, New York, NY 10595, USA
2
Henry M Jackson Foundation for the advancement of Military Medicine, Bethesda, MD 20817, USA
3
Department of Epidemiology, School of Public Health, Indiana University, Bloomington, IN 47404, USA
*
Author to whom correspondence should be addressed.
Nutrients 2019, 11(11), 2582; https://doi.org/10.3390/nu11112582
Submission received: 27 August 2019 / Revised: 10 October 2019 / Accepted: 15 October 2019 / Published: 26 October 2019

Abstract

:
Background: We aimed to assess the association of sleep with metabolic syndrome in the 2013/2014 National Health and Nutrition Examination Survey (NHANES). Methods: Sample size included 2737 out of 2013 and 2014 NHANES surveys. Cross-sectional study of metabolic syndrome and sleep duration was conducted. Metabolic syndrome was defined according to NCEP ATPIII (National Cholesterol Education Program Adult Treatment Panel III) criteria. Metabolic syndrome severity score was calculated based on actual measurement of each component, adjusted for sex and race. The generalized additive model (GAM) was built to assess the smooth relationship between metabolic syndrome/metabolic syndrome severity score and sleep duration. Adjustment of models were done for age, sex, race, and sitting time. The value of effective degree of freedom (EDF) formed by the GAM model shows the degree of curvature of the relationship. A value of 1 for EDF is translated as the linear shape of relationship. Values larger than one denote a more complex relationship between the response variable and the predicting one. Results: There was a U-shaped association between sleep duration and metabolic syndrome in univariable GAM (EDF = 2.43, p = 0.06) and multivariable GAM (EDF = 2.03, p = 0.20). The lowest risk of metabolic syndrome was observed in people sleeping 7 hours/night. There was a significant U-shaped association between sleep duration and metabolic syndrome severity score in multivariable GAM (EDF = 2.94, p = 0.0004). Similarly, the lowest mean metabolic syndrome severity score was observed in people sleeping 7 hours/night. There was an effect modification of sex and sleep duration indicating strong U-shaped relationship of metabolic syndrome severity score and sleep duration in women (EDF = 3.43, p = 0.00002) and semi-linear association in men (EDF = 1.76, p = 0.04). Conclusion: Short and long sleep duration was associated with higher risk of metabolic syndrome and higher scores of metabolic syndrome severity score in women. Short sleep duration was associated with higher risk of metabolic syndrome and higher scores of metabolic syndrome severity score in men.

1. Introduction

The recommend daily duration of sleep for adults is 7–8 hours [1]. Sleeping <7 hours could be detrimental for overall well-being, health, and performance [2]. Literature shows some associations between metabolic syndrome and sleep duration [3,4,5,6,7,8]. The associations were not consistent for both genders. The association of short and/or long sleep duration was also insignificant in some other studies [9,10,11,12,13]. Overall, no universal agreements were found on the significance of associations for both short and long sleep durations. Moreover, the long duration of sleep was defined differently in various studies, more than 7, 8, 9, or 10 hours. The inconsistencies justified further studies along with the application of more sophisticated methods of analysis to draw the non-linear associations of metabolic syndrome and sleep.

2. Methods

The current study was conducted to assess the association of sleep duration and metabolic syndrome prevalence in the National Health and Nutrition Examination Survey (NHANES) 2013/2014.

2.1. Population

National Center for Health Statistics is run by the Centers for Disease Control and Prevention (CDC). NHANES began about 60 years ago and aimed to assess health and nutritional status of people in the United States. NHANES focused on various populations and different health topics. The prevalence of major diseases and their risk factors were measured in order to evaluate the relationship of nutritional status and health promotion, to advance national biological standards, and to plan new health programs and services. The surveys in NHANES covered a sample size of 5000 per year who were representative of the US nation. They were selected from various counties across the US, 15 of which are visited each year. The surveys are unique because they include both interviews and physical examinations. The latter involves clinical, physiological, and laboratory evaluations managed by trained medical personnel. The current study covered 10,175 interviews and physical examinations. The dataset included demographic, socioeconomic, dietary, and health-related information. Information about sleep was gathered in 6464 people of which, components of metabolic syndrome were recorded in 2840 people. Metabolic syndrome was defined when 3 or more of the following findings were present according to NCEP ATPIII criteria: [14] central obesity, high fasting glucose, high serum triglyceride, high serum high density lipoprotein (HDL) cholesterol, and high blood pressure. Metabolic syndrome severity score was calculated according to the formulae presented by Lee, Gurka, and DeBoer [15].

2.2. Data Analysis

The data were examined and outliers that were out of range of mean ± 2SD (standard deviation) for sleep duration, were deleted. Due to the low number of the sample size and in order to have better smoothing function in GAM, people sleeping 10 hours were regrouped into the 9-hour sleeping category. The descriptive characteristics for each variable were analyzed. Presence of metabolic syndrome was treated as categorical outcome. Metabolic syndrome severity score was calculated and treated as continuous outcome.
Assuming the U-shape association cardio-metabolic outcomes and sleep duration in the literature, a penalized smoothing spline was employed [16]. Non-linear relationship of sleep with metabolic syndrome/metabolic syndrome severity score was assessed through generalized additive models (GAM). In our analysis, we fit 5 GAM models to NHANES data. The first three models used metabolic syndrome (yes/no) as a binary response whereas the fourth and fifth models used metabolic syndrome severity score as the response which is continuous.
ResponsePredictor
Model 1: Metabolic Syndrome (Yes/No)Smooth(Sleep)
Model 2: Metabolic Syndrome (Yes/No)Age, Sex, Race, Sitting, smooth(Sleep)
Model 3: Metabolic Syndrome (Yes/No)Age, Race, Sitting, smooth(Sleep*Sex)
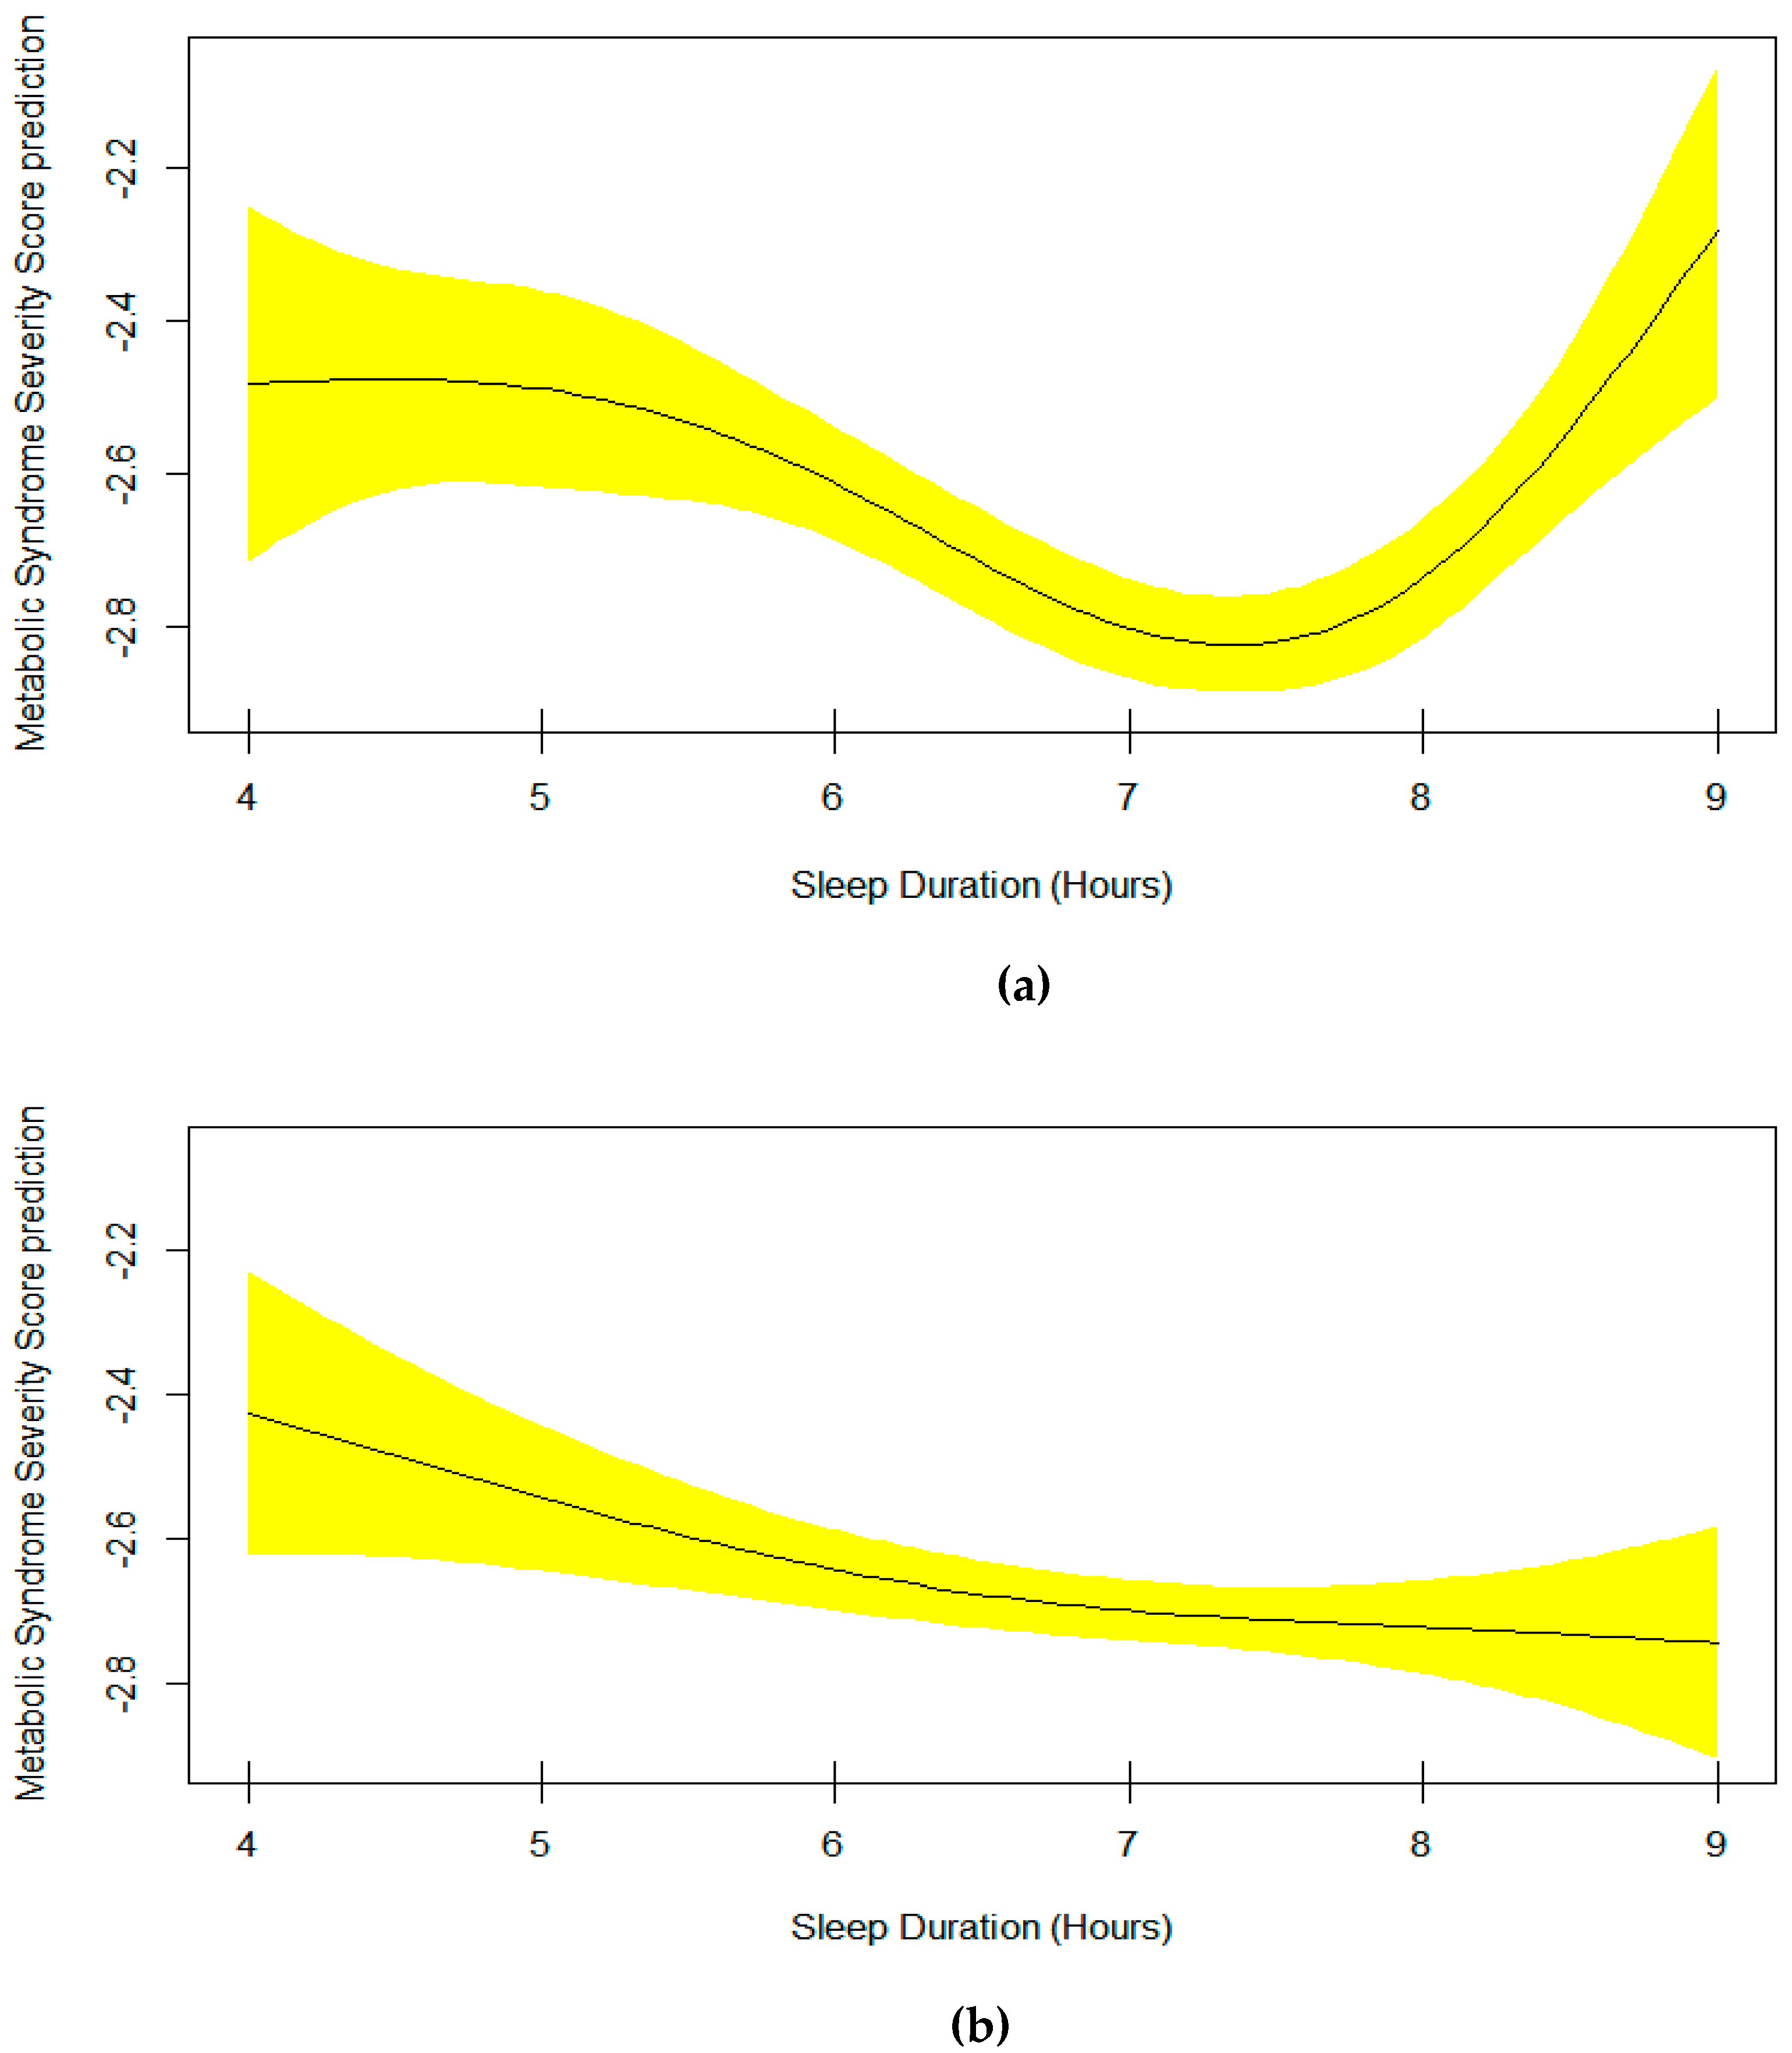
Model 4: Metabolic Syndrome Severity ScoreAge, Sex, Race, Sitting, smooth(Sleep)
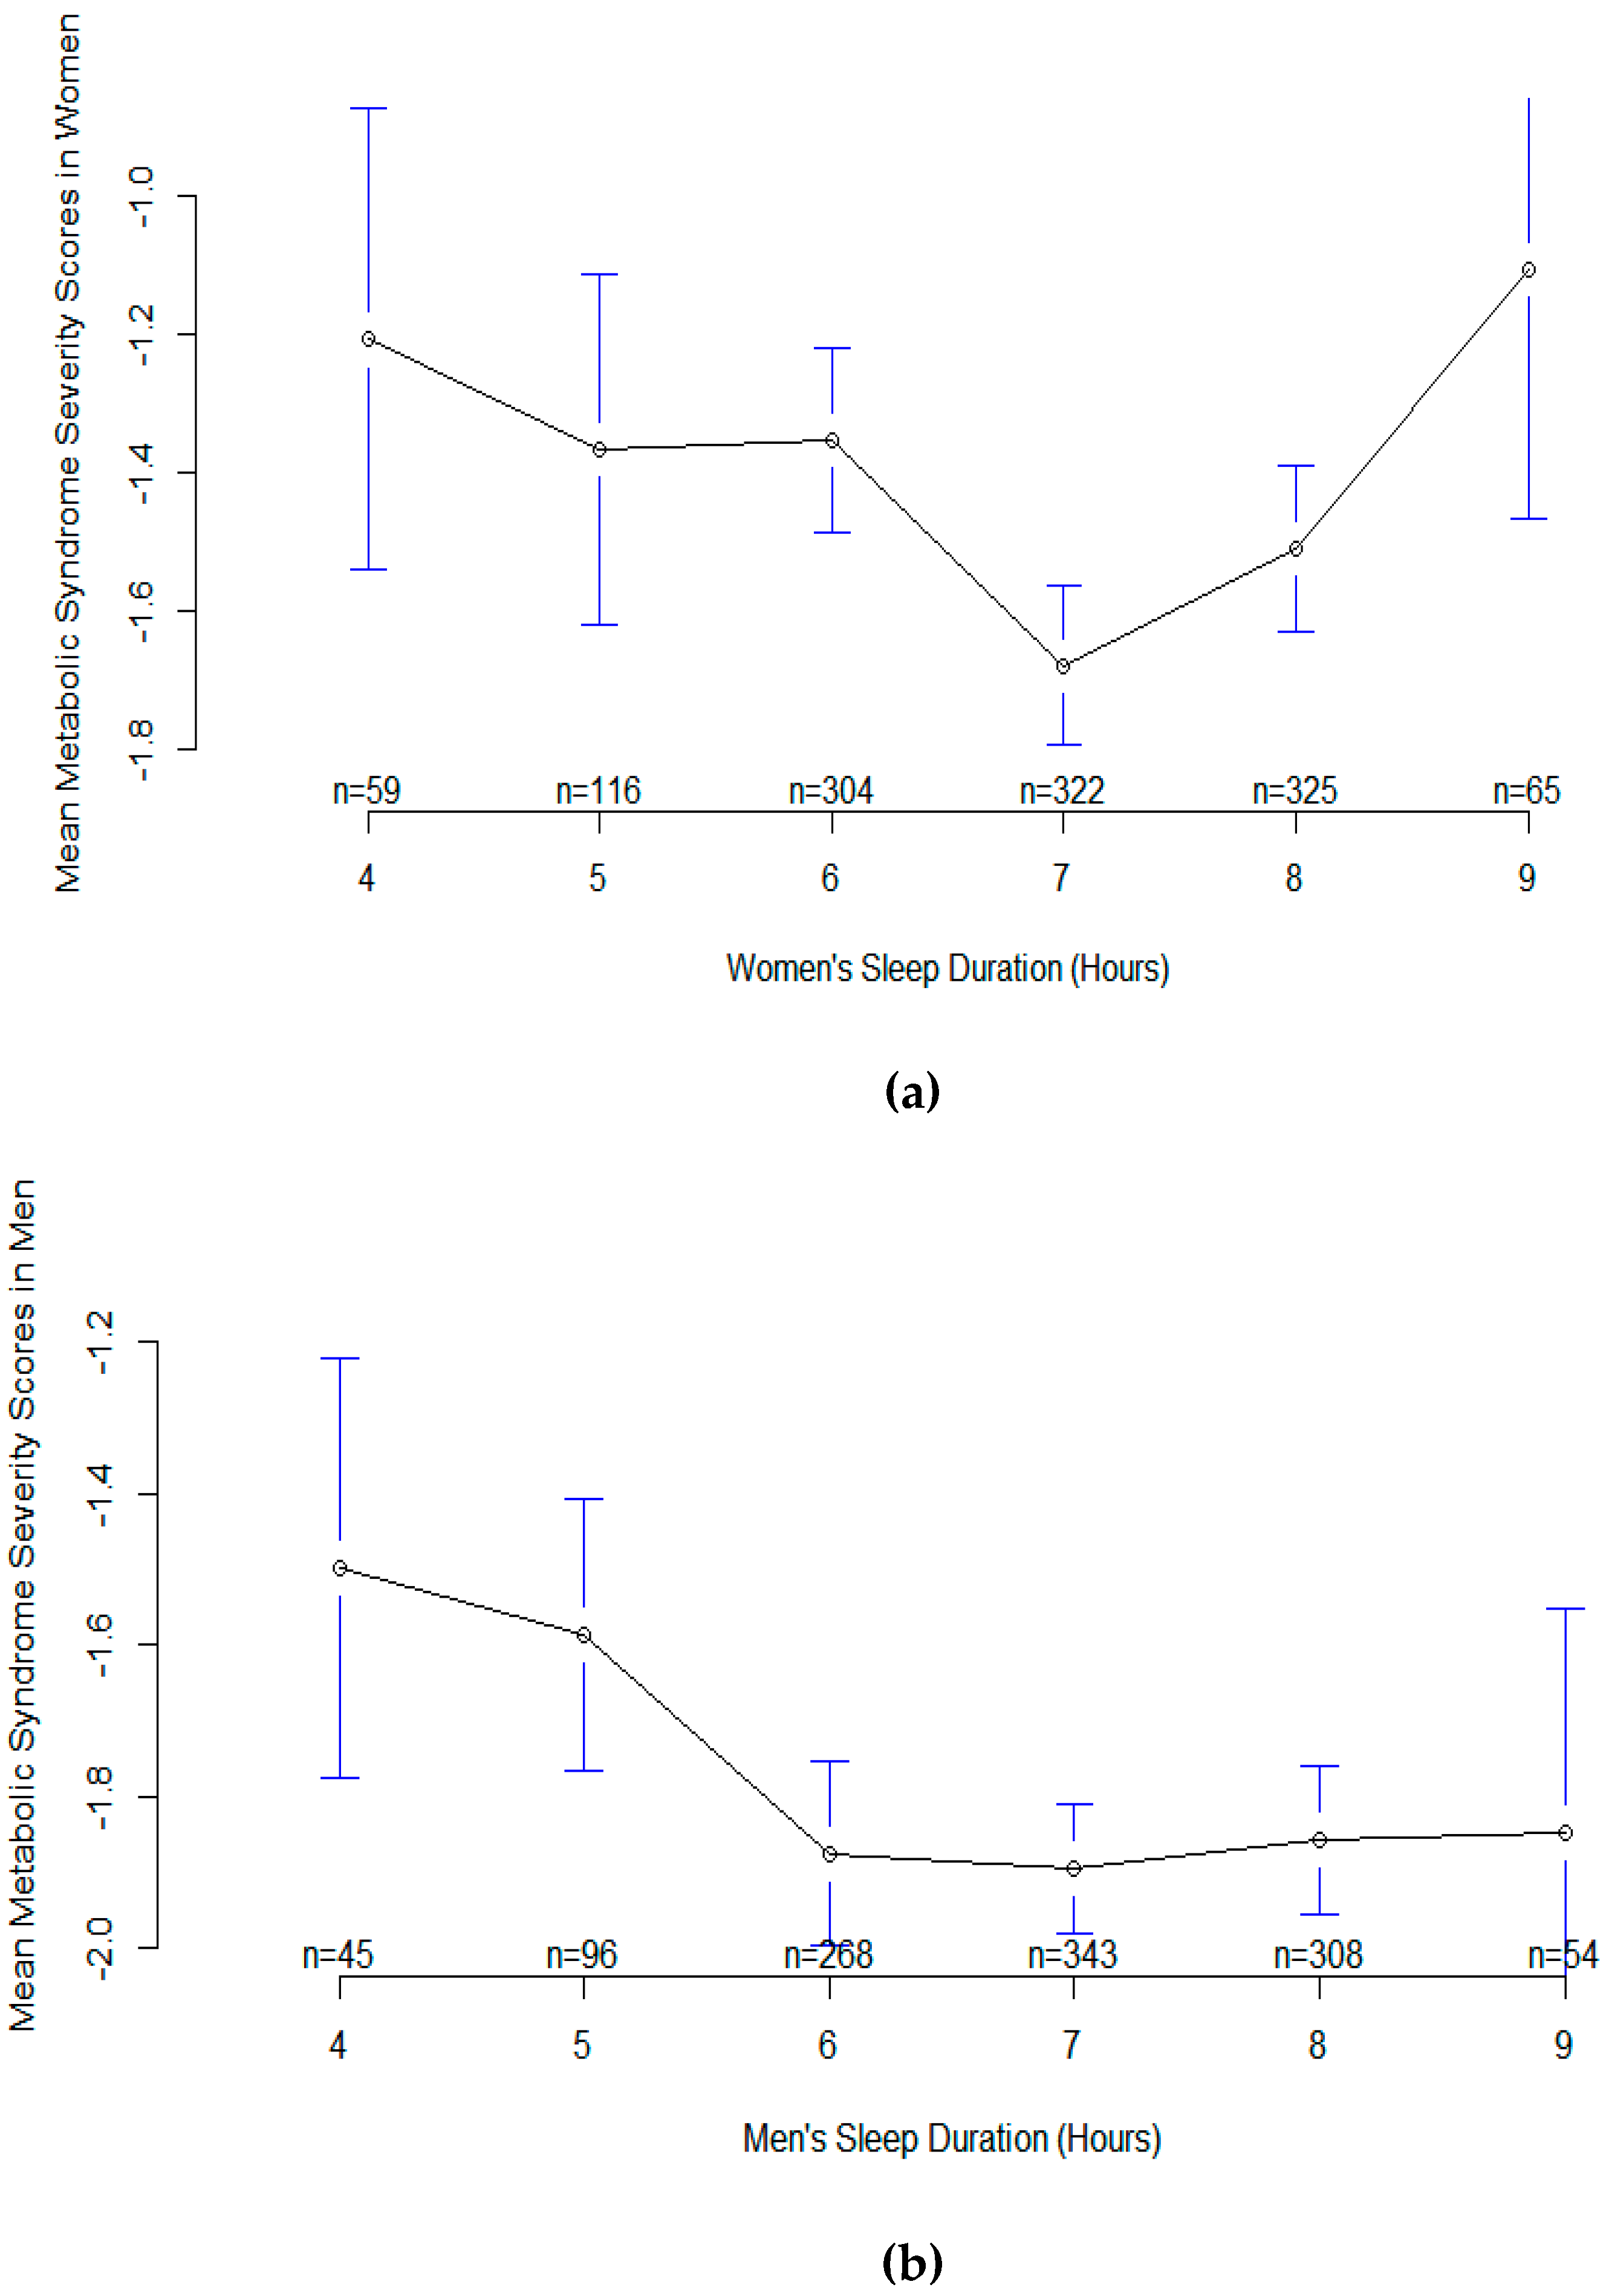
Model 5: Metabolic Syndrome Severity ScoreAge, Race, Sitting, smooth(Sleep*Sex)
Model 1 used metabolic syndrome (yes/no) as a binary response and a smoothing spline function of sleep as a univariable predictor. Model 2 was a multivariable version of model 1; it used metabolic syndrome (yes/no) as a binary response but the predictor variables were age, sex, race, sitting time, smooth(sleep). Model 3 was similar to model 2 but the interaction between sex and the smoothing function of sleep was added to the model. Model 4 was similar to model 2 but used the continuous response variable of metabolic syndrome severity score as the response variable; it used age, sex, race, sitting time, smooth(sleep) as predictor functions. Model 5 was similar to model 4 but the interaction between sex and the smoothing function of sleep was added to the model.
GAM is an extension of the generalized linear model which allows the evaluation for the curvilinear relationship of the outcome and the predictors. Model assumptions where assessed by investigating the normality of residuals, homoscedasticity, and residual symmetry. Age, sex, race, and sitting time were applied to adjust GAM models. Since waist circumference and body mass index (BMI) showed very strong correlation (r = 0.91, p < 0.0001) and waist circumference is part of the dependent variable (metabolic syndrome), it was not appropriate to consider BMI among confounders and further adjust the model for BMI. If the model was adjusted for BMI, it would remove any association existed between waist circumference and other independent variables (age, sex, race, sitting time, and sleep duration).
The reported values of effective degree of freedom (EDF) output demonstrate the degree of curvature of the smooth. Value of 1 is the sign of linear pattern of relationship. Value of EDF >1 is the sign of a more complex relationship between metabolic syndrome and sleep duration. The basic residual plots were checked to assure good compliance with model assumptions. The predicted smooth functions along with the confidence intervals were plotted in univariable and multivariable GAM models. A p-value less 0.05 was considered significant. Statistical analyses were carried out using R-3.4.3 [17].

3. Results

Our sample contained 2737 people, with the age range of 18–80 years. The mean (SD) age was 47.7 (18.3) years and 52.3% were women. A total of 61% of the sample were married, 44% had household income >$45,000/year, and 53% were educated in college or above. The mean (SD) duration of sleep was 6.82 (1.22). Characteristics of study subjects according to metabolic syndrome are presented in Table 1. About 31.5% had metabolic syndrome. Subjects with metabolic syndrome were significantly younger than those without metabolic syndrome. Also, they were significantly different in terms of age, ethnicity, marital status, education, smoking, household size, depression, diastolic and systolic blood pressure, HDL-cholesterol, fasting blood glucose, triglyceride, and waist circumference (Table 1). White and Asian races had the highest and the lowest prevalence of metabolic syndrome compared to other ethnicities. Women had higher prevalence of metabolic syndrome than men. Low educated people also had higher prevalent metabolic syndrome.
Model 1 which used metabolic syndrome (yes/no) as a binary response, and a smoothing spline function of sleep as a univariable predictor is shown in the upper plot in Figure 1. Model 2, which was a multivariable version of model 1 but further adjusted for additional variables, is shown in Table 2 and the lower plot in Figure 1. Technically, Table 2 presents the output of the multivariable generalized additive model for metabolic syndrome. It includes the smoothing estimate for sleep duration in association with metabolic syndrome adjusted for age, sex, and sitting time. An EDF of 2.03 indicates a non-linear fit between sleep duration and metabolic syndrome. Plot of predicted smooth association of metabolic syndrome and sleep duration, which also includes 95% confidence intervals, is shown in Figure 1. The plot shows a U-shape association of sleep duration and the risk of metabolic syndrome in both univariable and multivariable GAM models. The lowest risk is observed in those sleeping 7–7.5 hours per night. Furthermore, evaluation of effect modification of sex and sleep duration by using multivariable GAM model 3 revealed 2 different smoothing shapes; U-shaped in women and linear in men (Figure 2).
Table 3 presents the output of the multivariable generalized additive model 4 for the metabolic syndrome severity score. It includes the smoothing estimate for sleep duration in association with metabolic syndrome severity score adjusted for age, sex, race, and sitting time. A significant EDF of 2.94 indicates a non-linear fit between sleep duration and metabolic syndrome severity score. The plot of predicted smooth association of metabolic syndrome severity score and sleep duration which includes 95% confidence intervals is shown in Figure 3. The plot shows a significant U-shape association of sleep duration and the metabolic syndrome severity score. The lowest mean score is observed in those sleeping 7–7.5 hours per night. Also, the mean plot of metabolic syndrome severity score according to sleep duration is demonstrated in Figure 4. Interestingly, the sample size for every specific sleep duration is demonstrated on X-axis. The lowest mean metabolic syndrome severity score is observed in those sleeping 7 hours/day (Figure 4). Remarkably, people sleeping 5 hours or 9 hours show almost similar mean metabolic syndrome severity scores (Figure 4).
Furthermore, evaluation of effect modification of sex and sleep duration by using the multivariable GAM model 5 showed two different smoothing patterns for metabolic syndrome severity score; U-shaped in women (EDF = 3.43, p = 0.00002) and semi-linear in men (EDF = 1.76, p = 0.04) (Figure 5). The association was significant for both genders. Short sleep duration showed similar relationships with metabolic syndrome severity score in men and women. But the pattern of long sleep duration was different; sharply increased metabolic syndrome severity score in women and no change or slightly decreased metabolic syndrome severity score in men (Figure 5). Also, the mean plot of metabolic syndrome severity score according to sleep duration is demonstrated in Figure 6. Again, the sample size for every specific sleep duration is demonstrated on X-axis. The lowest mean metabolic syndrome severity scores for both men and women were observed in people sleeping 7 hours per day (Figure 6) although the metabolic syndrome severity scores for sleep durations of 6, 7, 8, and 9 hours in men were more or less similar.

4. Discussion

Few studies evaluated the relationship of sleep duration and cardiometabolic outcomes in the NHANES database. We evaluated the cross-sectional association of sleep duration and metabolic syndrome/metabolic syndrome severity score through the generalized additive model. In both univariable and multivariable metabolic syndrome/metabolic syndrome severity score models, EDF was greater than 2, indicating the curved association of sleep and metabolic syndrome/metabolic syndrome severity score. This means assuming linearity for the association of sleep duration with metabolic syndrome/metabolic syndrome severity score is not appropriate. The lowest risk of metabolic syndrome was observed in people sleeping 7 hours per night. Similarly, the mean score of those sleeping less than 7 hours or more than 7 hours was higher than that in those sleeping 7 hours. We may be able to predict the risk of metabolic syndrome or the score of metabolic syndrome severity score through the final models having age, sex, race, sitting time, and sleep duration. Short sleep duration had similar association with risk of metabolic syndrome in men and women. Nevertheless, models with effect modification of sex showed remarkably stronger association of long sleep duration and metabolic syndrome severity score in women vs. men. The possible mechanisms of association of sleep and metabolic syndrome have been discussed elsewhere. In summary, stage 3 is the most important stage of sleep since the growth hormone (GH) and GH releasing hormone (GHRH) are released at this time. They induce fat burning, bone building, and general repair and regeneration. The longest part of stage 3 in sleep takes place before midnight. Delayed sleep onset until midnight or later, would suppress the largest GH pulse. Sleep restriction induces high levels of ghrelin and low levels of leptin. Ghrelin stimulates appetite whereas leptin does the reverse. Advanced glycation end products (AGEs) are significantly increased in chronic sleep insufficiency and are also associated with insulin resistance in males with chronic sleep insufficiency. Sleep insufficiency increases sympathetic activity and pro-inflammatory cytokines, both of which increase insulin resistance. Accumulations of extracellular β amyloid protein plaques and intracellular tau neurofibrillary tangles in brain tissues start immediately after one night of sleep insufficiency. These plaques and tangles are neurotoxins that potentiate each other’s destructive effects on the structures and functions of brain cells and cause neuronal death. The consequence is a global decrease in cognition and decision making, manifested in increased consumption of fatty foods and unhealthy snacks in late sleepers. High levels of β amyloid and proteins might lead to sleep fragmentation, worsening of sleep quality, and daytime somnolence. Concentration will be more difficult, and performance will be reduced [18].
The main strengths of the current study were the method of analysis and the employment of the metabolic syndrome severity score. Application of the generalized additive model to explore the nonlinear association of sleep and metabolic syndrome/metabolic syndrome severity score improved the risk adjustment compared to linear models or categorization of linear terms [19,20]. Categorizing the sleep duration, using dummy variables on categories for adjusting the risk and using linear/logistic regression for nonlinear associations may induce some residual confounding [21,22,23,24,25,26]. In addition, calculating the metabolic syndrome severity score improved the strength of association because first, it provided a continuous measure of risk of metabolic status whereas metabolic syndrome is just a categorical measure of yes or no; second, the metabolic syndrome severity score is sex and race specific whereas in metabolic syndrome only HDL-cholesterol and waist circumference are sex specific; third, all five components of metabolic syndrome actually contribute in the score calculation, whether they are high, borderline, or low, whereas in metabolic syndrome, only the high components defined based on one-point threshold are considered to diagnose metabolic syndrome [27]. Imagine a person with three borderline components and two high components vs. a person with three high components and two normal components. The metabolic condition of the first person could be worse than the metabolic condition of the second one. But according to the definition of metabolic syndrome, only the second one would be diagnosed with metabolic syndrome, not the first one. This shortcoming would be tackled by calculating the metabolic syndrome severity score which includes the actual measurements of all five components. The precision of the metabolic syndrome severity score in predicting the risk of health outcomes has been demonstrated by other studies [28,29,30,31,32,33]. Interestingly, investigation on the components of metabolic syndrome in NHANES 2013/2014 demonstrated significant U-shape association of sleep duration and triglyceride levels and reverse U-shape association of sleep duration and HDL cholesterol [34]. Similar findings on the association of sleep duration and metabolic syndrome/metabolic syndrome severity score/metabolic syndrome components were observed in two other datasets, the Reasons for Geographic and Racial Differences in Stroke (REGARDS) and the Jackson Heart Study [35].
The limitations of the current study are as follows: Its cross-sectional design prohibits inferring the causal association metabolic syndrome and sleep duration. Quality of sleep such as difficulty initiating or maintaining sleep, regularity/irregularity of sleep-wake schedules, and excessive daytime sleepiness 14 were not regularly assessed in NHANES surveys. Seasonal variations in duration of sleep and recall bias might induce information bias. BMI could have been potentially considered as an additional confounder in the final model in our study because it is associated with both metabolic syndrome and sleep duration. But, as mentioned above, BMI showed very strong correlation with waist circumference (r = 0.91, p < 0.0001) and since waist circumference is part of the definition of metabolic syndrome, the final model was not further adjusted for BMI. Then, it was not possible to separate the relationship of central obesity and sleep duration vs. the relationship of general obesity (i.e., BMI) and sleep duration. Finally, having the detail of dietary intake related to metabolic syndrome may improve the evaluation of metabolic syndrome and sleep association.
Given the current prevalent lack of enough sleep and the growing prevalence and incidence of metabolic syndrome and obesity, finding the U-shaped relationship of sleep duration and metabolic syndrome may target sleep as a serious risk factor for cardiovascular outcomes. Longitudinal studies may improve the reliability and the generalizability of findings.

Author Contributions

Conceptualization, A.S., D.K. and A.B.; methodology, A.S., D.K. and A.B.; software, A.S. and D.K.; validation, A.S., D.K. and A.B.; formal analysis, A.S. and D.K.; investigation, A.S.; resources, A.S. and A.B.; data curation, A.S. and D.K.; writing—original draft preparation, A.S.; writing—review and editing, D.K. and A.B.; supervision, A.B.

Funding

This research received no external funding.

Conflicts of Interest

The authors declared that they have no conflict of interest.

References

  1. Hirshkowitz, M.; Whiton, K.; Albert, S.M.; Alessi, C.; Bruni, O.; DonCarlos, L.; Hazen, N.; Herman, J.; Hillard, P.J.A.; Katz, E.S.; et al. National Sleep Foundation’s updated sleep duration recommendations: Final report. Sleep Health 2015, 1, 233–243. [Google Scholar] [CrossRef] [PubMed]
  2. Panel, C.C.; Watson, N.F.; Badr, M.S.; Belenky, G.; Bliwise, D.L.; Buxton, O.M.; Buysse, D.; Dinges, D.F.; Gangwisch, J.; Grandner, M.A.; et al. Joint consensus statement of the American Academy of Sleep Medicine and Sleep Research Society on the recommended amount of sleep for a healthy adult: Methodology and discussion. Sleep 2015, 38, 1161–1183. [Google Scholar]
  3. Ostadrahimi, A.; Nikniaz, Z.; Faramarzi, E.; Mohammadpoorasl, A.; Ansarin, K.; Somi, M.H. Does long sleep duration increase risk of metabolic syndrome in Azar cohort study population? Health Promot. Perspect. 2018, 8, 290. [Google Scholar] [CrossRef] [PubMed]
  4. Hemati, Z.; Mozafarian, N.; Heshmat, R.; Ahadi, Z.; Motlagh, M.E.; Ziaodini, H.; Taheri, M.; Aminaee, T.; Qorbani, M.; Kelishadi, R. Association of sleep duration with metabolic syndrome and its components in children and adolescents; a propensity score-matched analysis: The CASPIAN-V study. Diabetol. Metab. Syndr. 2018, 10, 78. [Google Scholar] [CrossRef]
  5. Kim, C.E.; Shin, S.; Lee, H.-W.; Lim, J.; Lee, J.-K.; Shin, A.; Kang, D. Association between sleep duration and metabolic syndrome: A cross-sectional study. BMC Public Health 2018, 18, 720. [Google Scholar] [CrossRef]
  6. Itani, O.; Kaneita, Y.; Tokiya, M.; Jike, M.; Murata, A.; Nakagome, S.; Otsuka, Y.; Ohida, T. Short sleep duration, shift work, and actual days taken off work are predictive life-style risk factors for new-onset metabolic syndrome: A seven-year cohort study of 40,000 male workers. Sleep Med. 2017, 39, 87–94. [Google Scholar] [CrossRef]
  7. Deng, H.-B.; Tam, T.; Zee, B.C.-Y.; Chung, R.Y.-N.; Su, X.; Jin, L.; Chan, T.-C.; Chang, L.-Y.; Yeoh, E.-K.; Lao, X.Q. Short sleep duration increases metabolic impact in healthy adults: A population-based cohort study. Sleep 2017, 40, zsx130. [Google Scholar] [CrossRef]
  8. Fernandez-Mendoza, J.; He, F.; LaGrotte, C.; Vgontzas, A.N.; Liao, D.; Bixler, E.O. Impact of the metabolic syndrome on mortality is modified by objective short sleep duration. J. Am. Heart Assoc. 2017, 6, e005479. [Google Scholar] [CrossRef]
  9. Chaput, J.-P.; McNeil, J.; Després, J.-P.; Bouchard, C.; Tremblay, A. Short sleep duration as a risk factor for the development of the metabolic syndrome in adults. Prev. Med. 2013, 57, 872–877. [Google Scholar] [CrossRef]
  10. Stefani, K.M.; Kim, H.C.; Kim, J.; Oh, K.; Suh, I. The influence of sex and age on the relationship between sleep duration and metabolic syndrome in Korean adults. Diabetes Res. Clin. Pract. 2013, 102, 250–259. [Google Scholar] [CrossRef]
  11. Sung, V.; Beebe, D.W.; VanDyke, R.; Fenchel, M.C.; Crimmins, N.A.; Kirk, S.; Hiscock, H.; Amin, R.; Wake, M. Does sleep duration predict metabolic risk in obese adolescents attending tertiary services? A cross-sectional study. Sleep 2011, 34, 891–898. [Google Scholar] [PubMed]
  12. Wu, J.; Xu, G.; Shen, L.; Zhang, Y.; Song, L.; Yang, S.; Yang, H.; Liang, Y.; Wu, T.; Wang, Y. Daily sleep duration and risk of metabolic syndrome among middle-aged and older Chinese adults: Cross-sectional evidence from the Dongfeng–Tongji cohort study. BMC Public Health 2015, 15, 178. [Google Scholar] [CrossRef] [PubMed]
  13. Xi, B.; He, D.; Zhang, M.; Xue, J.; Zhou, D. Short sleep duration predicts risk of metabolic syndrome: A systematic review and meta-analysis. Sleep Med. Rev. 2014, 18, 293–297. [Google Scholar] [CrossRef] [PubMed]
  14. Kasper, D.L.; Fauci, A.S.; Hauser, S.L.; Longo, D.L.; Jameson, J.L.; Loscalzo, J. Harrison’s Manual of Medicine; McGraw-Hill Medical: New York, NY, USA, 2013. [Google Scholar]
  15. Lee, A.M.; Gurka, M.J.; DeBoer, M.D. A MetS severity score to estimate risk in adolescents and adults: Current evidence and future potential. Expert Rev. Cardiovasc. Ther. 2016, 14, 411–413. [Google Scholar] [CrossRef] [PubMed]
  16. Ruppert, D.; Wand, M.P.; Carroll, R.J. Semiparametric regression during 2003–2007. Electron. J. Stat. 2009, 3, 1193. [Google Scholar] [CrossRef] [PubMed]
  17. Wood, S.N. Generalized Additive Models: An Introduction with R; Chapman and Hall/CRC Press: Boca Raton, FL, USA, 2006. [Google Scholar]
  18. Smiley, A.; Wolter, S.; Nissan, D. Mechanisms of Association of Sleep and Metabolic Syndrome. J. Med. Clin. Res. Rev. 2019, 3, 1–9. [Google Scholar] [CrossRef]
  19. Benedetti, A.; Abrahamowicz, M. Using generalized additive models to reduce residual confounding. Stat. Med. 2004, 23, 3781–3801. [Google Scholar] [CrossRef]
  20. Moore, L.; Hanley, J.A.; Turgeon, A.F.; Lavoie, A. A comparison of generalized additive models to other common modeling strategies for continuous covariates: Implications for risk adjustment. J. Biomet. Biostat. 2011, 2, 109. [Google Scholar] [CrossRef]
  21. Austin, P.C.; Brunner, L.J. Inflation of the type I error rate when a continuous confounding variable is categorized in logistic regression analyses. Stat. Med. 2004, 23, 1159–1178. [Google Scholar] [CrossRef]
  22. Boucher, K.M.; Slattery, M.L.; Berry, T.D.; Quesenberry, C.; Anderson, K. Statistical methods in epidemiology: A comparison of statistical methods to analyze dose–response and trend analysis in epidemiologic studies. J. Clin. Epidemiol. 1998, 51, 1223–1233. [Google Scholar] [CrossRef]
  23. Brenner, H.; Blettner, M. Controlling for continuous confounders in epidemiologic research. Epidemiology 1997, 8, 429–434. [Google Scholar] [CrossRef] [PubMed]
  24. Broussard, J.; Brady, M.J. The impact of sleep disturbances on adipocyte function and lipid metabolism. Best Pract. Res. Clin. Endocrinol. Metab. 2010, 24, 763–773. [Google Scholar] [CrossRef] [PubMed] [Green Version]
  25. Cochran, W.G. The effectiveness of adjustment by subclassification in removing bias in observational studies. Biometrics 1968, 24, 295–313. [Google Scholar] [CrossRef] [PubMed]
  26. Rothman, K.J.; Greenland, S.; Lash, T.L. Modern Epidemiology, 3rd ed.; Wolters Kluwer Health/Lippincott Williams & Wilkins: Philadelphia, PA, USA, 2008. [Google Scholar]
  27. Gurka, M.J.; Golden, S.H.; Musani, S.K.; Sims, M.; Vishnu, A.; Guo, Y.; Cardel, M.; Pearson, T.A.; DeBoer, M.D. Independent associations between a metabolic syndrome severity score and future diabetes by sex and race: The Atherosclerosis Risk in Communities Study and Jackson Heart Study. Diabetologia 2017, 60, 1261–1270. [Google Scholar] [CrossRef]
  28. Dimitrov, B.D.; Bahchevanov, K.M.; Atanassova, P.A.; Mitkov, M.D.; Massaldjieva, R.I.; Chompalov, K.A.; Hadzhipetrov, G.K. Metabolic syndrome severity score: Range and associations with cardiovascular risk factors. Arch. Med. Sci. Atheroscler. Dis. 2016, 1, e90. [Google Scholar] [CrossRef]
  29. Guo, Y.; Musani, S.K.; Sims, M.; Pearson, T.A.; DeBoer, M.D.; Gurka, M.J. Assessing the added predictive ability of a metabolic syndrome severity score in predicting incident cardiovascular disease and type 2 diabetes: The Atherosclerosis Risk in Communities Study and Jackson Heart Study. Diabetol. Metab. Syndr. 2018, 10, 42. [Google Scholar] [CrossRef]
  30. Gurka, M.J.; Filipp, S.L.; Musani, S.K.; Sims, M.; DeBoer, M.D. Use of BMI as the marker of adiposity in a metabolic syndrome severity score: Derivation and validation in predicting long-term disease outcomes. Metabolism 2018, 83, 68–74. [Google Scholar] [CrossRef]
  31. Huh, J.H.; Lee, J.H.; Moon, J.S.; Sung, K.C.; Kim, J.Y.; Kang, D.R. Metabolic Syndrome Severity Score in Korean Adults: Analysis of the 2010–2015 Korea National Health and Nutrition Examination Survey. J. Korean Med. Sci. 2019, 34, e48. [Google Scholar] [CrossRef]
  32. Lee, K. Moderation Effect of Handgrip Strength on the Associations of Obesity and Metabolic Syndrome With Fatty Liver in Adolescents. J. Clin. Densitom. 2019. [Google Scholar] [CrossRef]
  33. Masson, W.; Epstein, T.; Huerín, M.; Lobo, L.M.; Molinero, G.; Angel, A.; Masson, G.; Millán, D.; De Francesca, S.; Vitagliano, L.; et al. Cardiovascular risk stratification in patients with metabolic syndrome Without diabetes or cardiovascular disease: Usefulness of metabolic syndrome severity score. High Blood Press. Cardiovasc. Prev. 2017, 24, 297–303. [Google Scholar] [CrossRef]
  34. Smiley, A.; King, D.; Harezlak, J.; Dinh, P.; Bidulescu, A. The association between sleep duration and lipid profiles: The NHANES 2013–2014. J. Diabetes Metab. Disord. 2018, 8, 1–8. [Google Scholar] [CrossRef]
  35. Smiley, A. Association of Sleep and Metabolic Syndrome/Metabolic Syndrome Components among Participants in Jackson Heart Study (JHS) and the Reasons for Geographic and Racial Differences in Stroke (REGARDS). Ph.D. Thesis, Indiana University, Bloomington, IN, USA, June 2019. [Google Scholar]
Figure 1. Plots of estimated smoothing spline function of sleep duration with 95% confidence band for the generalized additive model when the response variable was metabolic syndrome. (a) Model 1 shows the univariable smooth function of sleep duration (EDF = 2.428, p = 0.06). (b) Model 2 represents the multivariable smooth function of sleep duration (EDF = 2.03, p = 0.20).
Nutrients 11 02582 g001
Figure 2. Effect modification of sex and sleep duration in the multivariable generalized additive model 3. (a) EDF was 2.57 (p = 0.06) in female model (upper plot), (b) EDF was 1.002 (p = 0.80) in male model (lower plot).
Nutrients 11 02582 g002
Figure 3. Plots of estimated smoothing spline function of sleep duration with 95% confidence band for the multivariable generalized additive model 4 when the response variable was metabolic syndrome severity score (EDF = 2.94, p = 0.0004).
Nutrients 11 02582 g003
Figure 4. Plots of sleep duration vs. mean metabolic syndrome severity score.
Nutrients 11 02582 g004
Figure 5. Effect modification of sex and sleep duration in the multivariable generalized additive model 5 when the response variable was the metabolic syndrome severity score. (a) EDF was 3.43 (p = 0.00002) in the female model (upper plot), (b) EDF was 1.76 (p = 0.04) in the male model (lower plot).
Nutrients 11 02582 g005
Figure 6. Plots of sleep duration vs. mean metabolic syndrome severity score in women (upper plot) and men (lower plot). (a) Plot of sleep duration vs. mean metabolic syndrome severity score in women. (b) Plot of sleep duration vs. mean metabolic syndrome severity score in men.
Nutrients 11 02582 g006
Table 1. Characteristics of participants in the National Health and Nutrition Examination Survey (NHANES) 2013/2014 according to metabolic syndrome.
Participants’ CharacteristicsMetabolic Syndrome
No, n = 1735Yes, n = 793p
Age, Years, Mean (SD)48.5 (18.6)46.5 (17.6)0.02
Sex, n (%)Male836 (33.1%)376 (14.9%)0.0001
Female899 (35.6%)417 (16.5%)
Ethnicity, n (%)Hispanic364 (14.4%)186 (6.9%)0.0001
White729 (28.8%)388 (15.3%)
Black345 (13.6%)142 (5.6%)
Asian250 (9.9%)55 (2.2%)
Multiracial47 (1.9%)16 (0.6%)
Marital Status, n (%)Married or Living with partner972 (40.7%)495 (20.7%)0.0001
Widowed104 (4.3%)69 (2.9%)
Divorced or Separated191 (8.0%)130 (5.4%)
Never married345 (14.4%)85 (3.6%)
Education, n (%)<9th grade104 (4.1%)79 (3.1%)0.0001
9–11th grade201 (8.0%)138 (5.5%)
High school334 (13.2%)173 (6.8%)
Some college481 (19.0%)247 (9.8%)
≥College graduate490 (19.4%)141 (5.6%)
Sitting, Minutes/Day, Mean (SD)434 (527)470 (709)0.1
Sleep Duration, Hours, Mean (SD)6.82 (1.2)6.80 (1.3)0.6
Diastolic Blood Pressure, mmHg, Mean (SD)67.5 (11.2)71.5 (14.5)0.0001
Systolic Blood Pressure, mmHg, Mean (SD)117.5 (15.7)130.5 (17.8)0.0001
Fasting Blood Glucose, mg/dL, Mean (SD)98.2 (21)123.5 (46)0.0001
High Density Lipoprotein, mg/dL, Mean (SD)58.5 (15)44.0 (13)0.0001
Triglyceride, mg/dL, Mean (SD)93.2 (52)193.7 (129)0.0001
Waist Circumference, cm, Mean (SD)92.5 (14.4)110.1 (14.9)0.0001
Table 2. Association of metabolic syndrome and independent variables measured by the multivariable generalized additive model 2.
R2 = 0.064
n = 2527
Outcome: Metabolic Syndrome
Bp
Age0.030.0001
Sex
MaleReference Group
Female0.040.60
Race
HispanicReference Group
White−0.120.30
Black−0.320.01
Asian−0.880.0001
Multiracial−0.250.40
Sitting0.000070.30
SleepSmooth Curve, EDF = 2.030.20
Table 3. Association of metabolic syndrome severity score and independent variables measured by the multivariable generalized additive model 3.
R2 = 0.19
n = 2305
Outcome: Metabolic Syndrome
Bp
Age0.0130.0001
Sex
MaleReference Group
Female0.380.0001
Race
HispanicReference Group
White0.350.0001
Black0.950.0001
Asian0.090.20
Multiracial0.270.04
Sitting0.000090.004
SleepSmooth Curve, EDF = 2.940.0004

