An Increase in Fat Mass Index Predicts a Deterioration of Running Speed


 ,
,
Abstract
:1. Introduction
2. Subjects and Methods
2.1. City Run: the “Course de l’Escalade”
2.2. Body Composition: Bioelectrical Impedance Analysis (BIA)
2.3. Data Merging
2.4. Statistics
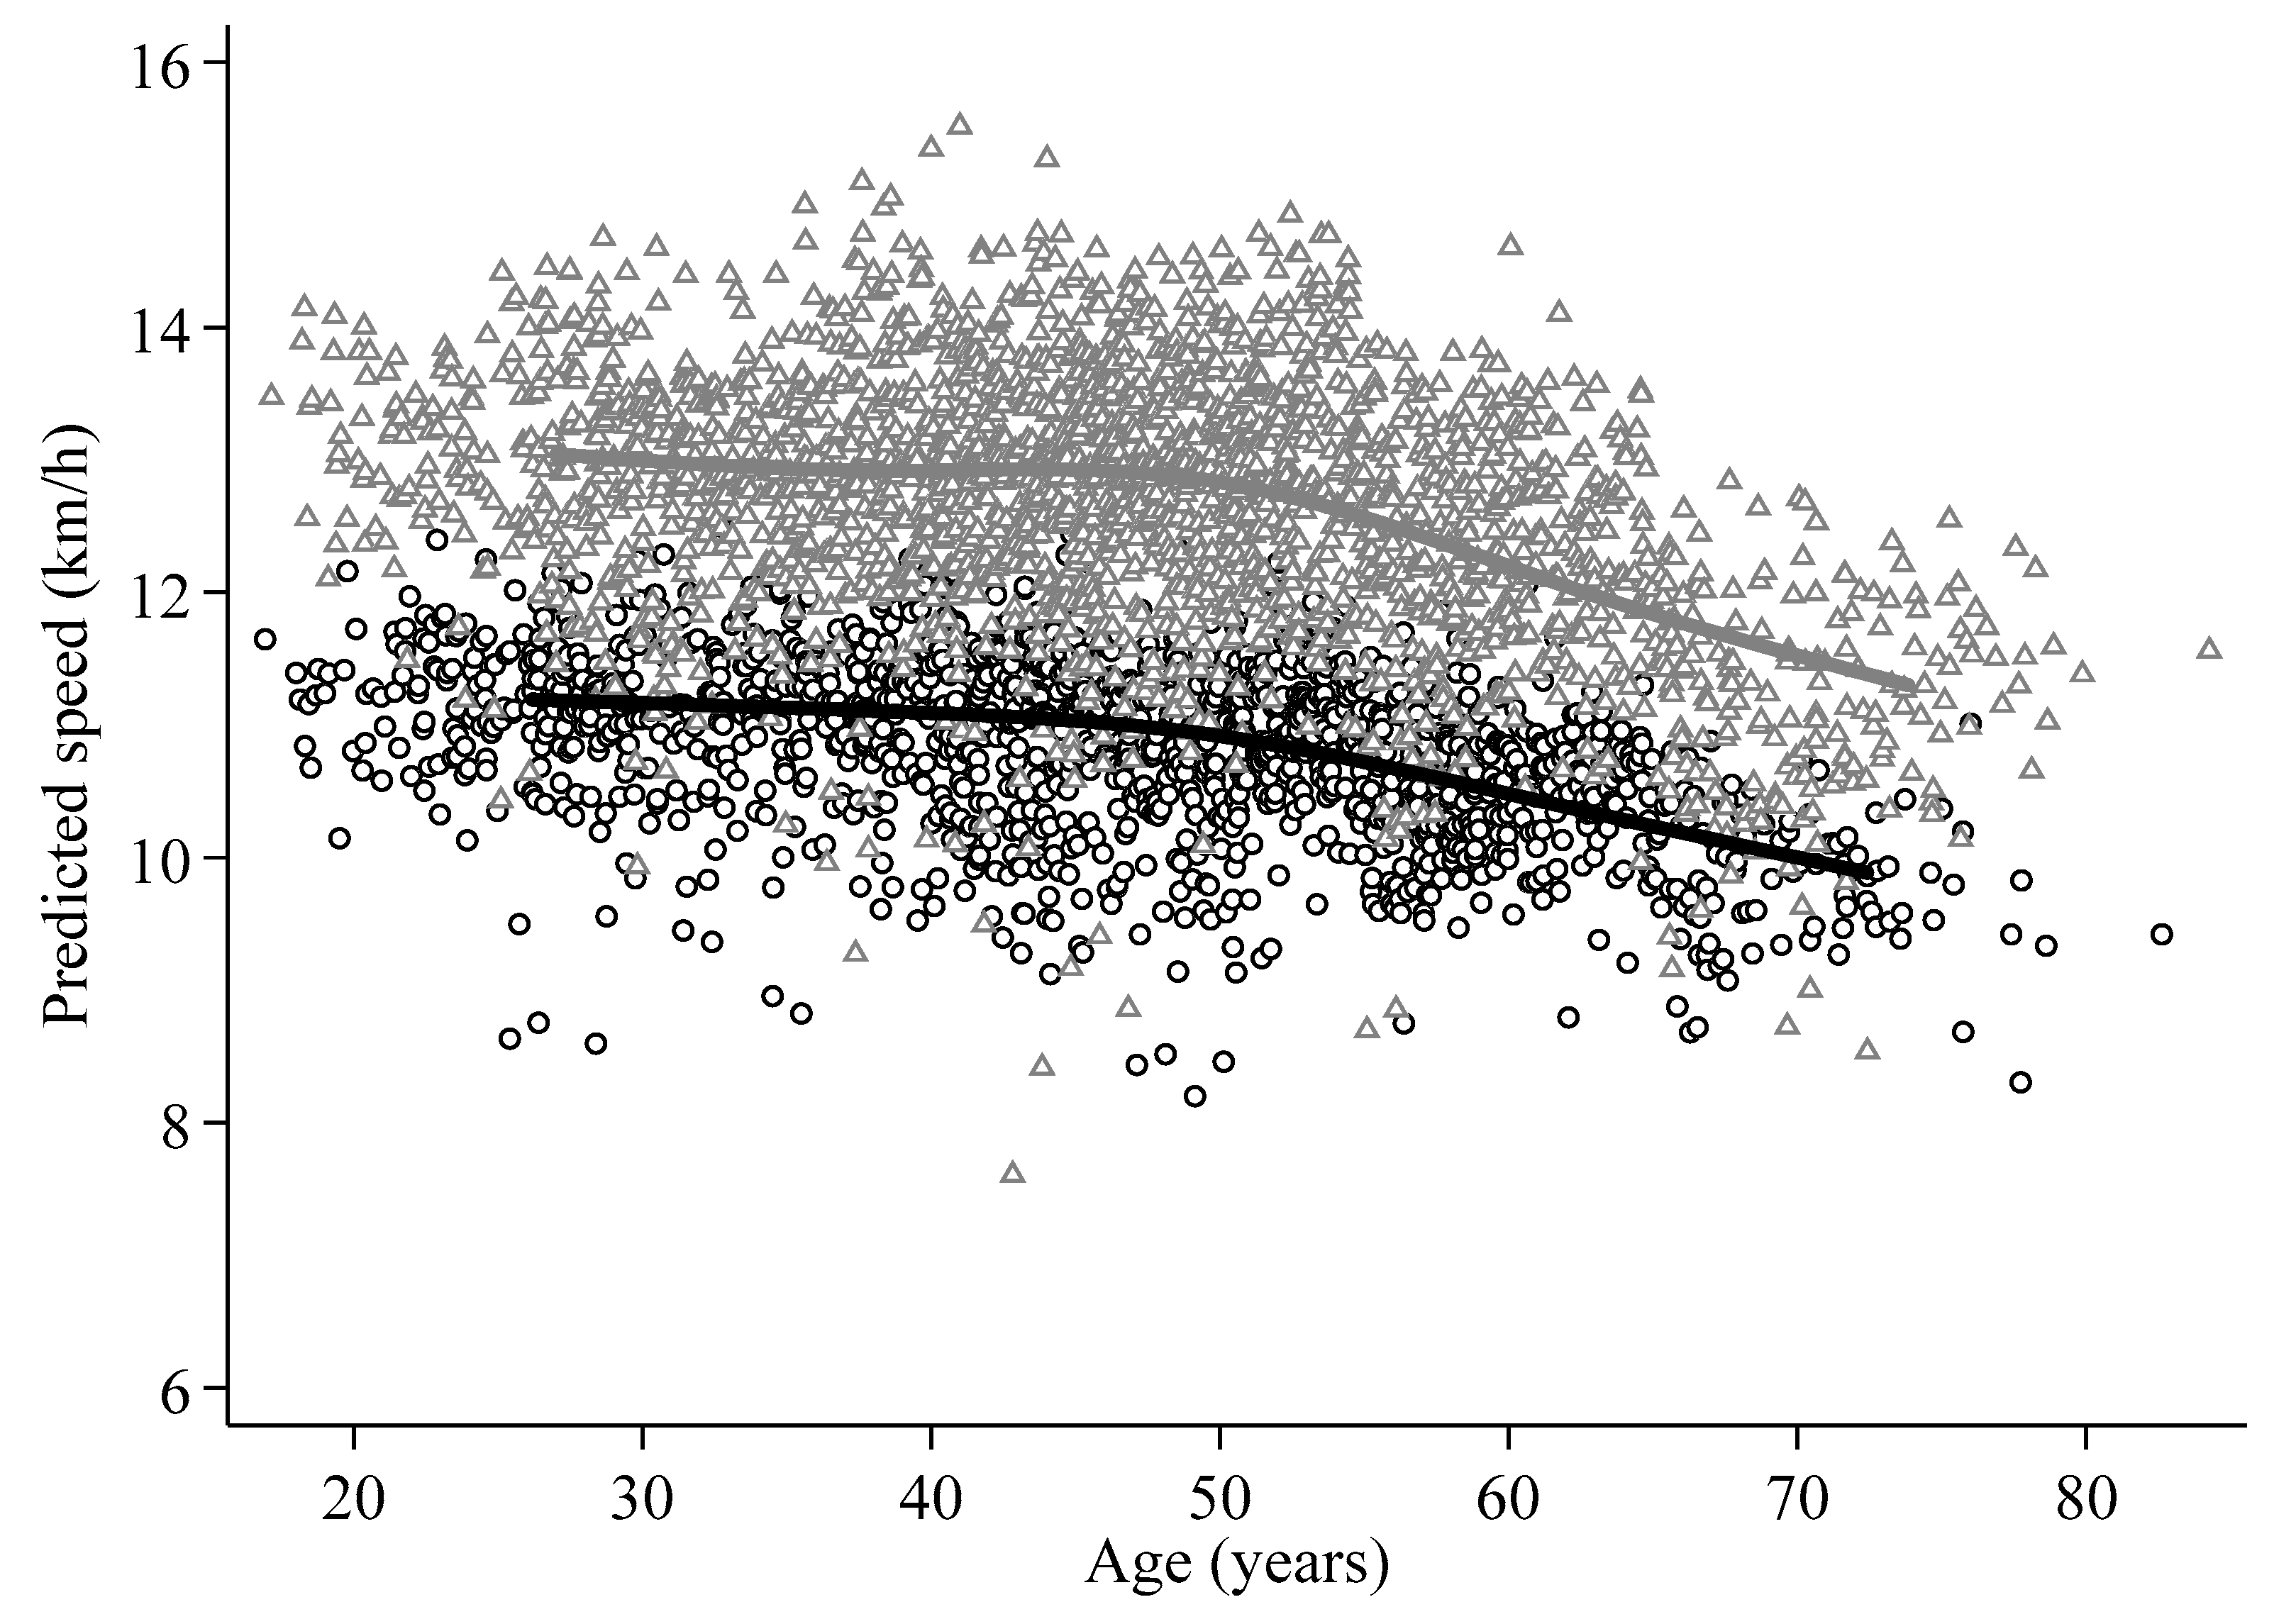
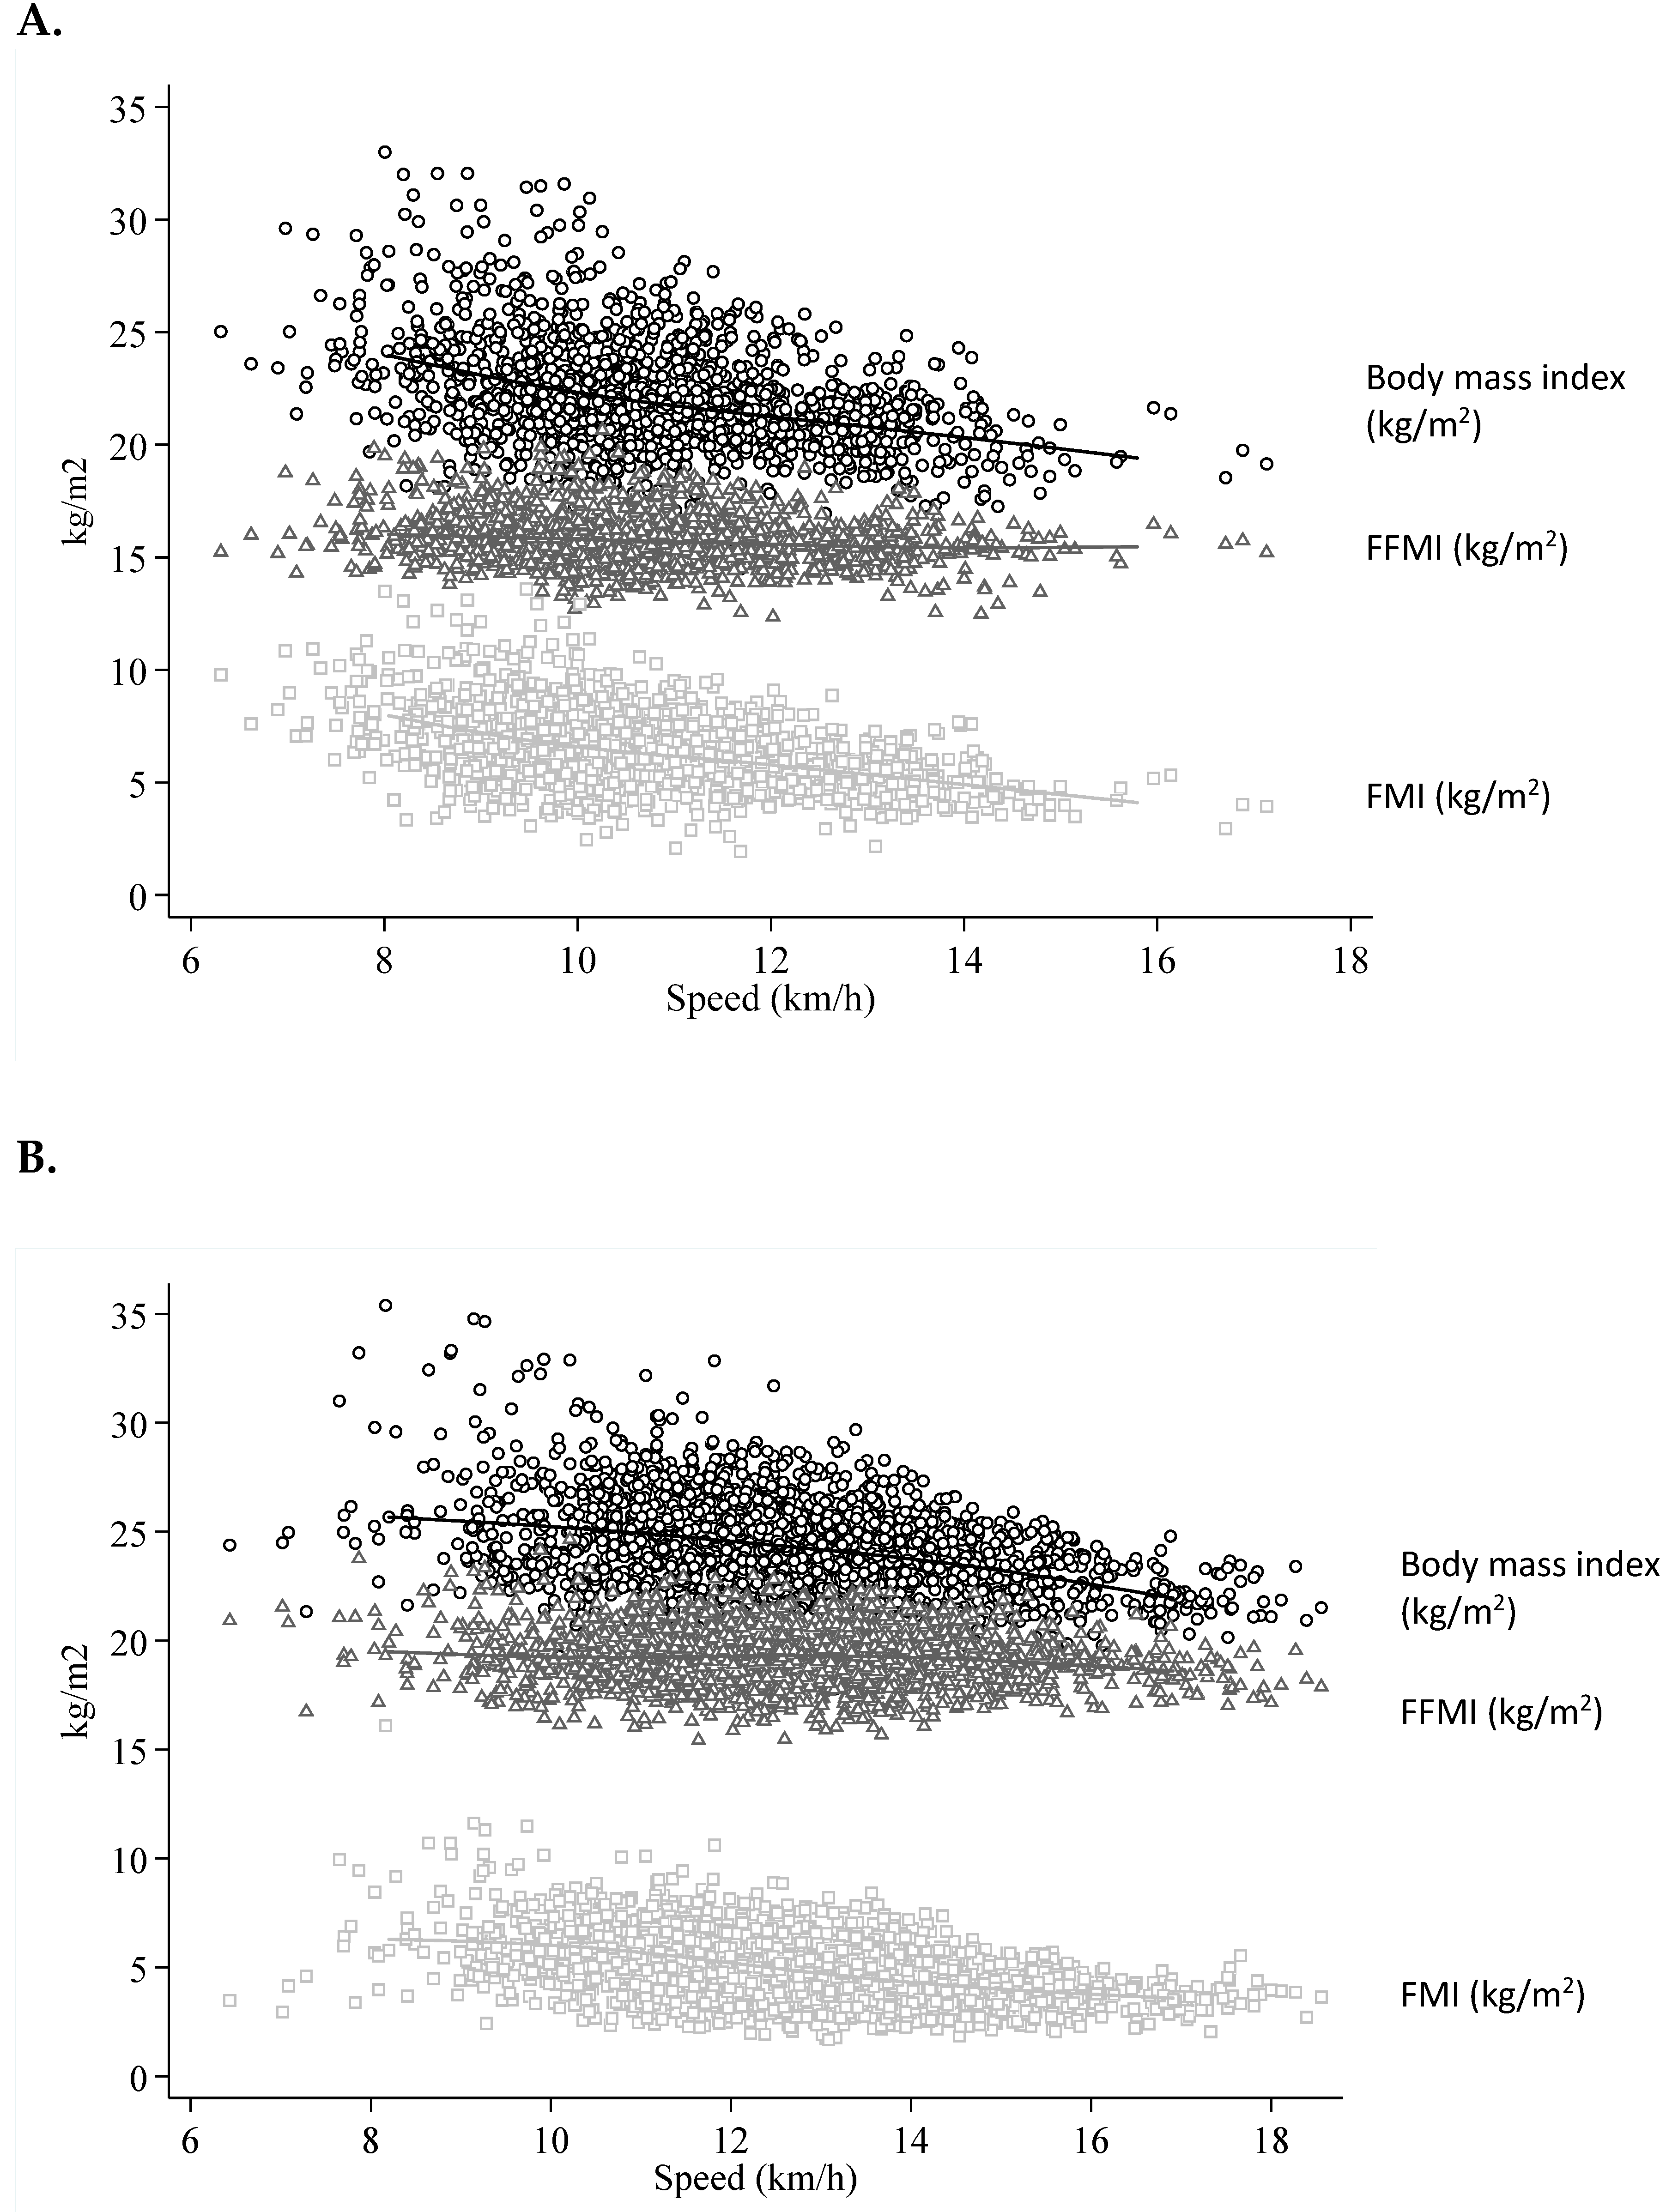
3. Results
4. Discussion
5. Conclusions
Supplementary Materials
Author Contributions
Funding
Acknowledgments
Conflicts of Interest
Abbreviations:
| FMI | fat mass index |
| FFMI | fat-free mass |
| BIA | bioelectrical impedance analysis |
References
- Cerutti, B.; Kayser, B. Effects of increased participation on veteran running performance. J. Sports Sci. 2018, 36, 797–801. [Google Scholar] [CrossRef] [PubMed]
- Chatton, A.; Kayser, B. Self-reported health, physical activity and socio-economic status of middle-aged and elderly participants to a popular road running race in Switzerland: Better off than the general population? Swiss Med. Wkly. 2013, 143, w13710. [Google Scholar] [CrossRef] [PubMed]
- Latorre-Roman, P.A.; Izquierdo-Sanchez, J.M.; Salas-Sanchez, J.; Garcia-Pinillos, F. Comparative analysis between two models of active aging and its influence on body composition, strength levels and quality of life: Long-distance runners versus bodybuilders practitioners. Nutr. Hosp. 2015, 31, 1717–1725. [Google Scholar] [PubMed]
- Helms, E.R.; Fitschen, P.J.; Aragon, A.A.; Cronin, J.; Schoenfeld, B.J. Recommendations for natural bodybuilding contest preparation: Resistance and cardiovascular training. J. Sports Med. Phys. Fit. 2015, 55, 164–178. [Google Scholar]
- Keating, S.E.; Johnson, N.A.; Mielke, G.I.; Coombes, J.S. A systematic review and meta-analysis of interval training versus moderate-intensity continuous training on body adiposity. Obes. Rev. Off. J. Int. Assoc. Stud. Obes. 2017, 18, 943–964. [Google Scholar] [CrossRef] [PubMed]
- Maillard, F.; Pereira, B.; Boisseau, N. Effect of High-Intensity Interval Training on Total, Abdominal and Visceral Fat Mass: A Meta-Analysis. Sports Med. 2018, 48, 269–288. [Google Scholar] [CrossRef] [PubMed]
- Mattila, V.M.; Tallroth, K.; Marttinen, M.; Pihlajamaki, H. Physical fitness and performance. Body composition by DEXA and its association with physical fitness in 140 conscripts. Med. Sci. Sports Exerc. 2007, 39, 2242–2247. [Google Scholar] [CrossRef] [PubMed]
- Salinero, J.J.; Soriano, M.L.; Lara, B.; Gallo-Salazar, C.; Areces, F.; Ruiz-Vicente, D.; Abian-Vicen, J.; Gonzalez-Millan, C.; Del Coso, J. Predicting race time in male amateur marathon runners. J. Sports Med. Phys. Fit. 2017, 57, 1169–1177. [Google Scholar]
- Rust, C.A.; Knechtle, B.; Knechtle, P.; Rosemann, T. Similarities and differences in anthropometry and training between recreational male 100-km ultra-marathoners and marathoners. J. Sports Sci. 2012, 30, 1249–1257. [Google Scholar] [CrossRef] [PubMed]
- Herrmann, F.R.; Graf, C.; Karsegard, V.L.; Mareschal, J.; Achamrah, N.; Delsoglio, M.; Schindler, M.; Pichard, C.; Genton, L. Running performance in a timed city run and body composition: A prospective study in over 3000 runners. Nutrition 2019. accepted. [Google Scholar]
- Ravnholt, T.; Tybirk, J.; Jorgensen, N.R.; Bangsbo, J. High-intensity intermittent “5-10-15” running reduces body fat, and increases lean body mass, bone mineral density, and performance in untrained subjects. Eur. J. Appl. Physiol. 2018, 118, 1221–1230. [Google Scholar] [CrossRef] [PubMed]
- Macpherson, R.E.; Hazell, T.J.; Olver, T.D.; Paterson, D.H.; Lemon, P.W. Run sprint interval training improves aerobic performance but not maximal cardiac output. Med. Sci. Sports Exerc. 2011, 43, 115–122. [Google Scholar] [CrossRef] [PubMed]
- Trappe, S.W.; Costill, D.L.; Vukovich, M.D.; Jones, J.; Melham, T. Aging among elite distance runners: A 22-yr longitudinal study. J. Appl. Physiol. 1996, 80, 285–290. [Google Scholar] [CrossRef] [PubMed]
- Everman, S.; Farris, J.W.; Bay, R.C.; Daniels, J.T. Elite Distance Runners: A 45-Year Follow-up. Med. Sci. Sports Exerc. 2018, 50, 73–78. [Google Scholar] [CrossRef] [PubMed]
- Korhonen, M.T.; Mero, A.A.; Alen, M.; Sipila, S.; Hakkinen, K.; Liikavainio, T.; Vitasalo, J.T.; Haverinen, M.T.; Suominen, H. Biomechanical and skeletal muscle determinants of maximum running speed with aging. Med. Sci. Sports Exerc. 2009, 41, 844–856. [Google Scholar] [CrossRef] [PubMed]
- Kyle, U.G.; Genton, L.; Slosman, D.O.; Pichard, C. Fat-free and fat mass percentiles in 5225 healthy subjects aged 15 to 98 years. Nutrition 2001, 17, 534–541. [Google Scholar] [CrossRef]
- Archive Météo Genève. Available online: https://www.meteoblue.com/fr/meteo/prevision/archive/gen%C3%A8ve_suisse-26606462006-2018 (accessed on 6 March 2018).
- Kyle, U.G.; Bosaeus, I.; De Lorenzo, A.D.; Deurenberg, P.; Elia, M.; Gomez, J.M.; Heitmann, B.L.; Kent-Smith, L.; Melchior, J.C.; Pirlich, M.; et al. Bioelectrical impedance analysis—Part I: Review of principles and methods. Clin. Nutr. 2004, 23, 1226–1243. [Google Scholar] [CrossRef] [PubMed]
- Kyle, U.G.; Genton, L.; Karsegard, L.; Slosman, D.O.; Pichard, C. Single prediction equation for bioelectrical impedance analysis in adults aged 20–94 years. Nutrition 2001, 17, 248–253. [Google Scholar] [CrossRef]
- Panissa, V.L.; Julio, U.F.; Franca, V.; Lira, F.S.; Hofmann, P.; Takito, M.Y.; Franchini, E. Sex-Related Differences in Self-Paced All Out High-Intensity Intermittent Cycling: Mechanical and Physiological Responses. J. Sports Sci. Med. 2016, 15, 372–378. [Google Scholar] [PubMed]
- Pollock, M.L.; Mengelkoch, L.J.; Graves, J.E.; Lowenthal, D.T.; Limacher, M.C.; Foster, C.; Wilmore, J.H. Twenty-year follow-up of aerobic power and body composition of older track athletes. J. Appl. Physiol. 1997, 82, 1508–1516. [Google Scholar] [CrossRef] [PubMed]


| All | Women | Men | ||||||||||||||
|---|---|---|---|---|---|---|---|---|---|---|---|---|---|---|---|---|
| Variables | n | % | Mean | SD | n | % | Mean | SD | n | % | Mean | SD | p * | |||
| Continuous | ||||||||||||||||
| Number of BIA measurements | 886 | 100 | 4.5 | ± | 3.0 | 377 | 43 | 4.0 | ± | 2.7 | 509 | 57 | 4.8 | ± | 3.1 | <0.001 |
| Age at measurement [years] | 886 | 100 | 41.7 | ± | 12.0 | 377 | 43 | 41.1 | ± | 12.2 | 509 | 57 | 42.0 | ± | 11.9 | 0.265 |
| Body weight [kg] | 886 | 100 | 68.2 | ± | 11.2 | 377 | 43 | 59.2 | ± | 8.0 | 509 | 57 | 74.8 | ± | 8.2 | <0.001 |
| Height [cm] | 886 | 100 | 170.9 | ± | 9.5 | 377 | 43 | 163.4 | ± | 6.7 | 509 | 57 | 176.4 | ± | 7.1 | <0.001 |
| Body mass index [kg/m2] | 886 | 100 | 23.2 | ± | 2.5 | 377 | 43 | 22.1 | ± | 2.5 | 509 | 57 | 24.0 | ± | 2.1 | <0.001 |
| Fat-free mass index [kg/m2] | 886 | 100 | 17.7 | ± | 2.1 | 377 | 43 | 15.7 | ± | 1.2 | 509 | 57 | 19.2 | ± | 1.3 | <0.001 |
| Fat mass index [kg/m2] | 886 | 100 | 5.6 | ± | 1.7 | 377 | 43 | 6.4 | ± | 1.7 | 509 | 57 | 4.9 | ± | 1.4 | <0.001 |
| Fat mass [%] | 886 | 100 | 23.7 | ± | 6.3 | 377 | 43 | 28.7 | ± | 4.9 | 509 | 57 | 20.1 | ± | 4.5 | <0.001 |
| Running speed [km/h] | 886 | 100 | 12.0 | ± | 1.9 | 377 | 43 | 10.9 | ± | 1.6 | 509 | 57 | 12.9 | ± | 1.7 | <0.001 |
| Categorical | ||||||||||||||||
| Age [years] | 0.262 | |||||||||||||||
| 16–24 | 75 | 8 | 39 | 10 | 36 | 7 | ||||||||||
| 25–34 | 197 | 22 | 84 | 222 | 113 | 22 | ||||||||||
| 35–44 | 280 | 32 | 116 | 31 | 164 | 32 | ||||||||||
| 45–54 | 212 | 24 | 90 | 24 | 122 | 24 | ||||||||||
| 55–64 | 97 | 11 | 38 | 10 | 59 | 12 | ||||||||||
| ≥65 | 26 | 3 | 11 | 3 | 15 | 3 | ||||||||||
| Body mass index [kg/m2] | ||||||||||||||||
| <18.5 | 11 | 1 | 10 | 2 | 1 | 1 | <0.001 | |||||||||
| 18.5–24.9 | 685 | 77 | 326 | 87 | 357 | 70 | ||||||||||
| 25–29.9 | 184 | 21 | 38 | 10 | 146 | 28 | ||||||||||
| > or = 30 | 8 | 1 | 3 | 1 | 5 | 1 | ||||||||||
| Year of measurement [years] | 0.042 | |||||||||||||||
| 1999–2001 | 283 | 32 | 111 | 30 | 171 | 34 | ||||||||||
| 2002–2004 | 191 | 22 | 76 | 20 | 115 | 22 | ||||||||||
| 2005–2007 | 131 | 15 | 56 | 15 | 75 | 15 | ||||||||||
| 2008–2010 | 128 | 14 | 58 | 15 | 70 | 14 | ||||||||||
| 2011–2013 | 81 | 9 | 43 | 11 | 38 | 7 | ||||||||||
| 2014–2016 | 73 | 8 | 33 | 9 | 40 | 8 |
| Model 1 | Model 2 | Model 3 | Model 4 | Model 5 | ||||||||||||||||
|---|---|---|---|---|---|---|---|---|---|---|---|---|---|---|---|---|---|---|---|---|
| ß | 95% CI | p | ß | 95% CI | p | ß | 95% CI | p | ß | 95% CI | p | ß | 95% CI | p | ||||||
| Age [years] | ||||||||||||||||||||
| 15–24 | 0.00 | 0.00 | 0.00 | 0.00 | 0.00 | |||||||||||||||
| 25–34 | −0.07 | −0.34 | 0.20 | 0.615 | −0.02 | −0.28 | 0.25 | 0.904 | −0.07 | −0.34 | 0.21 | 0.636 | −0.03 | −0.29 | 0.23 | 0.814 | −0.03 | −0.29 | 0.23 | 0.821 |
| 35–44 | −0.06 | −0.38 | 0.25 | 0.687 | −0.05 | −0.35 | 0.24 | 0.720 | −0.06 | −0.37 | 0.25 | 0.708 | −0.11 | −0.40 | 0.18 | 0.460 | −0.11 | −0.40 | 0.18 | 0.469 |
| 45–54 | −0.20 | −0.54 | 0.13 | 0.232 | −0.17 | −0.49 | 0.14 | 0.279 | −0.19 | −0.53 | 0.14 | 0.253 | −0.25 | −0.56 | 0.06 | 0.108 | −0.25 | −0.56 | 0.06 | 0.114 |
| 55–64 | −0.51 | −0.88 | −0.14 | 0.007 | −0.51 | −0.86 | −0.16 | 0.004 | −0.51 | −0.88 | −0.14 | 0.007 | −0.58 | −0.93 | −0.24 | 0.001 | −0.58 | −0.92 | −0.24 | 0.001 |
| ≥65 | −1.08 | −1.52 | −0.63 | <0.001 | −1.11 | −1.53 | −0.69 | <0.001 | −1.08 | −1.53 | −0.64 | <0.001 | −1.17 | −1.58 | −0.76 | <0.001 | −1.16 | −1.57 | −0.75 | <0.001 |
| Body mass index [kg/m2] | −0.21 | −0.24 | −0.17 | <0.001 | ||||||||||||||||
| Fat−free mass index [kg/m2] | −0.05 | −0.12 | 0.02 | 0.163 | −0.01 | 0.80 | −0.07 | 0.056 | ||||||||||||
| Fat mass index [kg/m2] | −0.31 | −0.35 | −0.27 | <0.001 | −0.31 | −0.35 | −0.27 | <0.001 | ||||||||||||
| Year of measurement [years] | ||||||||||||||||||||
| 1999–2001 | 0.00 | 0.00 | 0.00 | 0.00 | 0.00 | |||||||||||||||
| 2002–2004 | 0.01 | −0.13 | 0.16 | 0.858 | 0.02 | −0.12 | 0.16 | 0.811 | 0.03 | −0.12 | 0.18 | 0.687 | −0.09 | −0.23 | 0.05 | 0.216 | −0.08 | −0.23 | 0.06 | 0.239 |
| 2005–2007 | −0.11 | −0.26 | 0.04 | 0.163 | −0.03 | −0.17 | 0.12 | 0.740 | −0.09 | −0.24 | 0.07 | 0.273 | −0.12 | −0.26 | 0.03 | 0.114 | −0.11 | −0.26 | 0.03 | 0.132 |
| 2008–2010 | −0.16 | −0.41 | 0.08 | 0.194 | −0.03 | −0.27 | 0.21 | 0.793 | −0.13 | −0.38 | 0.12 | 0.320 | −0.19 | −0.42 | 0.05 | 0.117 | −0.18 | −0.42 | 0.06 | 0.136 |
| 2011–2013 | −0.57 | −0.81 | −0.33 | <0.001 | −0.43 | −0.66 | −0.19 | <0.001 | −0.54 | −0.78 | −0.29 | <0.001 | −0.55 | −0.78 | −0.32 | <0.001 | −0.55 | −0.78 | −0.31 | <0.001 |
| 2014–2016 | −0.54 | −0.76 | −0.31 | <0.001 | −0.38 | −0.60 | −0.16 | 0.001 | −0.52 | −0.74 | −0.29 | <0.001 | −0.44 | −0.65 | −0.23 | <0.001 | −0.43 | −0.65 | −0.22 | <0.001 |
| Temperature [°C] | −0.02 | −0.03 | 0.00 | 0.027 | −0.02 | −0.03 | 0.00 | 0.037 | −0.02 | −0.03 | 0.00 | 0.045 | −0.02 | −0.04 | −0.01 | 0.001 | −0.02 | −0.04 | −0.01 | 0.001 |
| Relative humidity [%] | 0.00 | 0.00 | 0.01 | 0.192 | 0.01 | 0.00 | 0.01 | 0.057 | 0.00 | 0.00 | 0.01 | 0.151 | 0.00 | 0.00 | 0.01 | 0.194 | 0.00 | 0.00 | 0.01 | 0.188 |
| Model 1 | Model 2 | Model 3 | Model 4 | Model 5 | ||||||||||||||||
|---|---|---|---|---|---|---|---|---|---|---|---|---|---|---|---|---|---|---|---|---|
| ß | 95% CI | p | ß | 95% CI | p | ß | 95% CI | p | ß | 95% CI | p | ß | 95% CI | p | ||||||
| Age [years] | ||||||||||||||||||||
| 15–24 | 0.00 | 0.00 | 0.00 | 0.00 | 0.00 | |||||||||||||||
| 25–34 | 0.12 | −0.15 | 0.39 | 0.369 | 0.24 | 0.00 | 0.49 | 0.054 | 0.13 | −0.14 | 0.40 | 0.337 | 0.24 | −0.01 | 0.49 | 0.064 | 0.26 | 0.01 | 0.50 | 0.042 |
| 35–44 | 0.27 | −0.03 | 0.58 | 0.079 | 0.47 | 0.19 | 0.75 | 0.001 | 0.29 | −0.01 | 0.59 | 0.061 | 0.44 | 0.16 | 0.72 | 0.002 | 0.48 | 0.20 | 0.76 | 0.001 |
| 45–54 | 0.25 | −0.08 | 0.58 | 0.144 | 0.50 | 0.19 | 0.81 | 0.001 | 0.29 | −0.04 | 0.62 | 0.090 | 0.40 | 0.10 | 0.71 | 0.010 | 0.48 | 0.18 | 0.79 | 0.002 |
| 55–64 | −0.36 | −0.73 | 0.01 | 0.056 | −0.13 | −0.47 | 0.21 | 0.453 | −0.34 | −0.70 | 0.03 | 0.073 | −0.22 | −0.56 | 0.12 | 0.211 | −0.14 | −0.48 | 0.19 | 0.405 |
| ≥65 | −1.28 | −1.72 | −0.84 | <0.001 | −1.03 | −1.44 | −0.63 | <0.001 | −1.27 | −1.70 | −0.83 | <0.001 | −1.11 | −1.52 | −0.71 | <0.001 | −1.04 | −1.44 | −0.64 | <0.001 |
| Body mass index [kg/m2] | −0.35 | −0.38 | −0.31 | <0.001 | ||||||||||||||||
| Fat-free mass index [kg/m2] | −0.16 | −0.22 | −0.10 | <0.001 | −0.20 | −0.26 | −0.15 | <0.001 | ||||||||||||
| Fat mass index [kg/m2] | −0.42 | −0.47 | −0.38 | <0.001 | −0.43 | −0.48 | −0.39 | <0.001 | ||||||||||||
| Year of measurement [years] | ||||||||||||||||||||
| 1999–2001 | 0.00 | 0.00 | 0.00 | 0.00 | 0.00 | |||||||||||||||
| 2002–2004 | −0.25 | −0.39 | −0.11 | <0.001 | −0.25 | −0.38 | −0.12 | <0.001 | −0.19 | −0.33 | −0.05 | 0.006 | −0.39 | −0.52 | −0.26 | <0.001 | −0.32 | −0.45 | −0.19 | <0.001 |
| 2005–2007 | −0.37 | −0.52 | −0.22 | <0.001 | −0.23 | −0.37 | −0.09 | 0.001 | −0.30 | −0.45 | −0.15 | <0.001 | −0.38 | −0.52 | −0.24 | <0.001 | −0.30 | −0.43 | −0.16 | <0.001 |
| 2008–2010 | −0.66 | −0.89 | −0.42 | <0.001 | −0.45 | −0.66 | −0.23 | <0.001 | −0.53 | −0.77 | −0.29 | <0.001 | −0.72 | −0.94 | −0.50 | <0.001 | −0.57 | −0.79 | −0.35 | <0.001 |
| 2011–2013 | −1.21 | −1.44 | −0.97 | <0.001 | −0.91 | −1.12 | −0.69 | <0.001 | −1.08 | −1.31 | −0.84 | <0.001 | −1.16 | −1.38 | −0.94 | <0.001 | −1.01 | −1.23 | −0.79 | <0.001 |
| 2014–2016 | −1.19 | −1.40 | −0.97 | <0.001 | −0.96 | −1.16 | −0.76 | <0.001 | −1.11 | −1.33 | −0.89 | <0.001 | −1.09 | −1.29 | −0.89 | <0.001 | −1.00 | −1.20 | −0.80 | <0.001 |
| Temperature [°C] | −0.03 | −0.04 | −0.01 | 0.001 | −0.03 | −0.04 | −0.01 | <0.001 | −2.68 | −0.04 | −0.01 | 0.007 | −0.04 | −0.05 | −0.02 | <0.001 | −0.03 | −0.05 | −0.02 | <0.001 |
| Relative humidity [%] | 0.00 | 0.00 | 0.01 | 0.218 | 0.01 | 0.00 | 0.01 | 0.014 | 1.97 | 0.00 | 0.01 | 0.048 | 0.00 | 0.00 | 0.01 | 0.559 | 0.00 | 0.00 | 0.01 | 0.115 |
© 2019 by the authors. Licensee MDPI, Basel, Switzerland. This article is an open access article distributed under the terms and conditions of the Creative Commons Attribution (CC BY) license (http://creativecommons.org/licenses/by/4.0/).
Share and Cite
Genton, L.; Mareschal, J.; Karsegard, V.L.; Achamrah, N.; Delsoglio, M.; Pichard, C.; Graf, C.; Herrmann, F.R. An Increase in Fat Mass Index Predicts a Deterioration of Running Speed. Nutrients 2019, 11, 701. https://doi.org/10.3390/nu11030701
Genton L, Mareschal J, Karsegard VL, Achamrah N, Delsoglio M, Pichard C, Graf C, Herrmann FR. An Increase in Fat Mass Index Predicts a Deterioration of Running Speed. Nutrients. 2019; 11(3):701. https://doi.org/10.3390/nu11030701
Chicago/Turabian StyleGenton, Laurence, Julie Mareschal, Véronique L. Karsegard, Najate Achamrah, Marta Delsoglio, Claude Pichard, Christophe Graf, and François R. Herrmann. 2019. "An Increase in Fat Mass Index Predicts a Deterioration of Running Speed" Nutrients 11, no. 3: 701. https://doi.org/10.3390/nu11030701
APA StyleGenton, L., Mareschal, J., Karsegard, V. L., Achamrah, N., Delsoglio, M., Pichard, C., Graf, C., & Herrmann, F. R. (2019). An Increase in Fat Mass Index Predicts a Deterioration of Running Speed. Nutrients, 11(3), 701. https://doi.org/10.3390/nu11030701