Evaluation of New Technology-Based Tools for Dietary Intake Assessment—An ILSI Europe Dietary Intake and Exposure Task Force Evaluation

 , , ,
, , ,
Abstract
1. Introduction
2. Materials and Methods
2.1. Inclusion Criteria and Search Strategy
2.2. Evaluation Criteria and Data Extraction
3. Results
3.1. Search Results
3.2. Characteristics of Included Studies
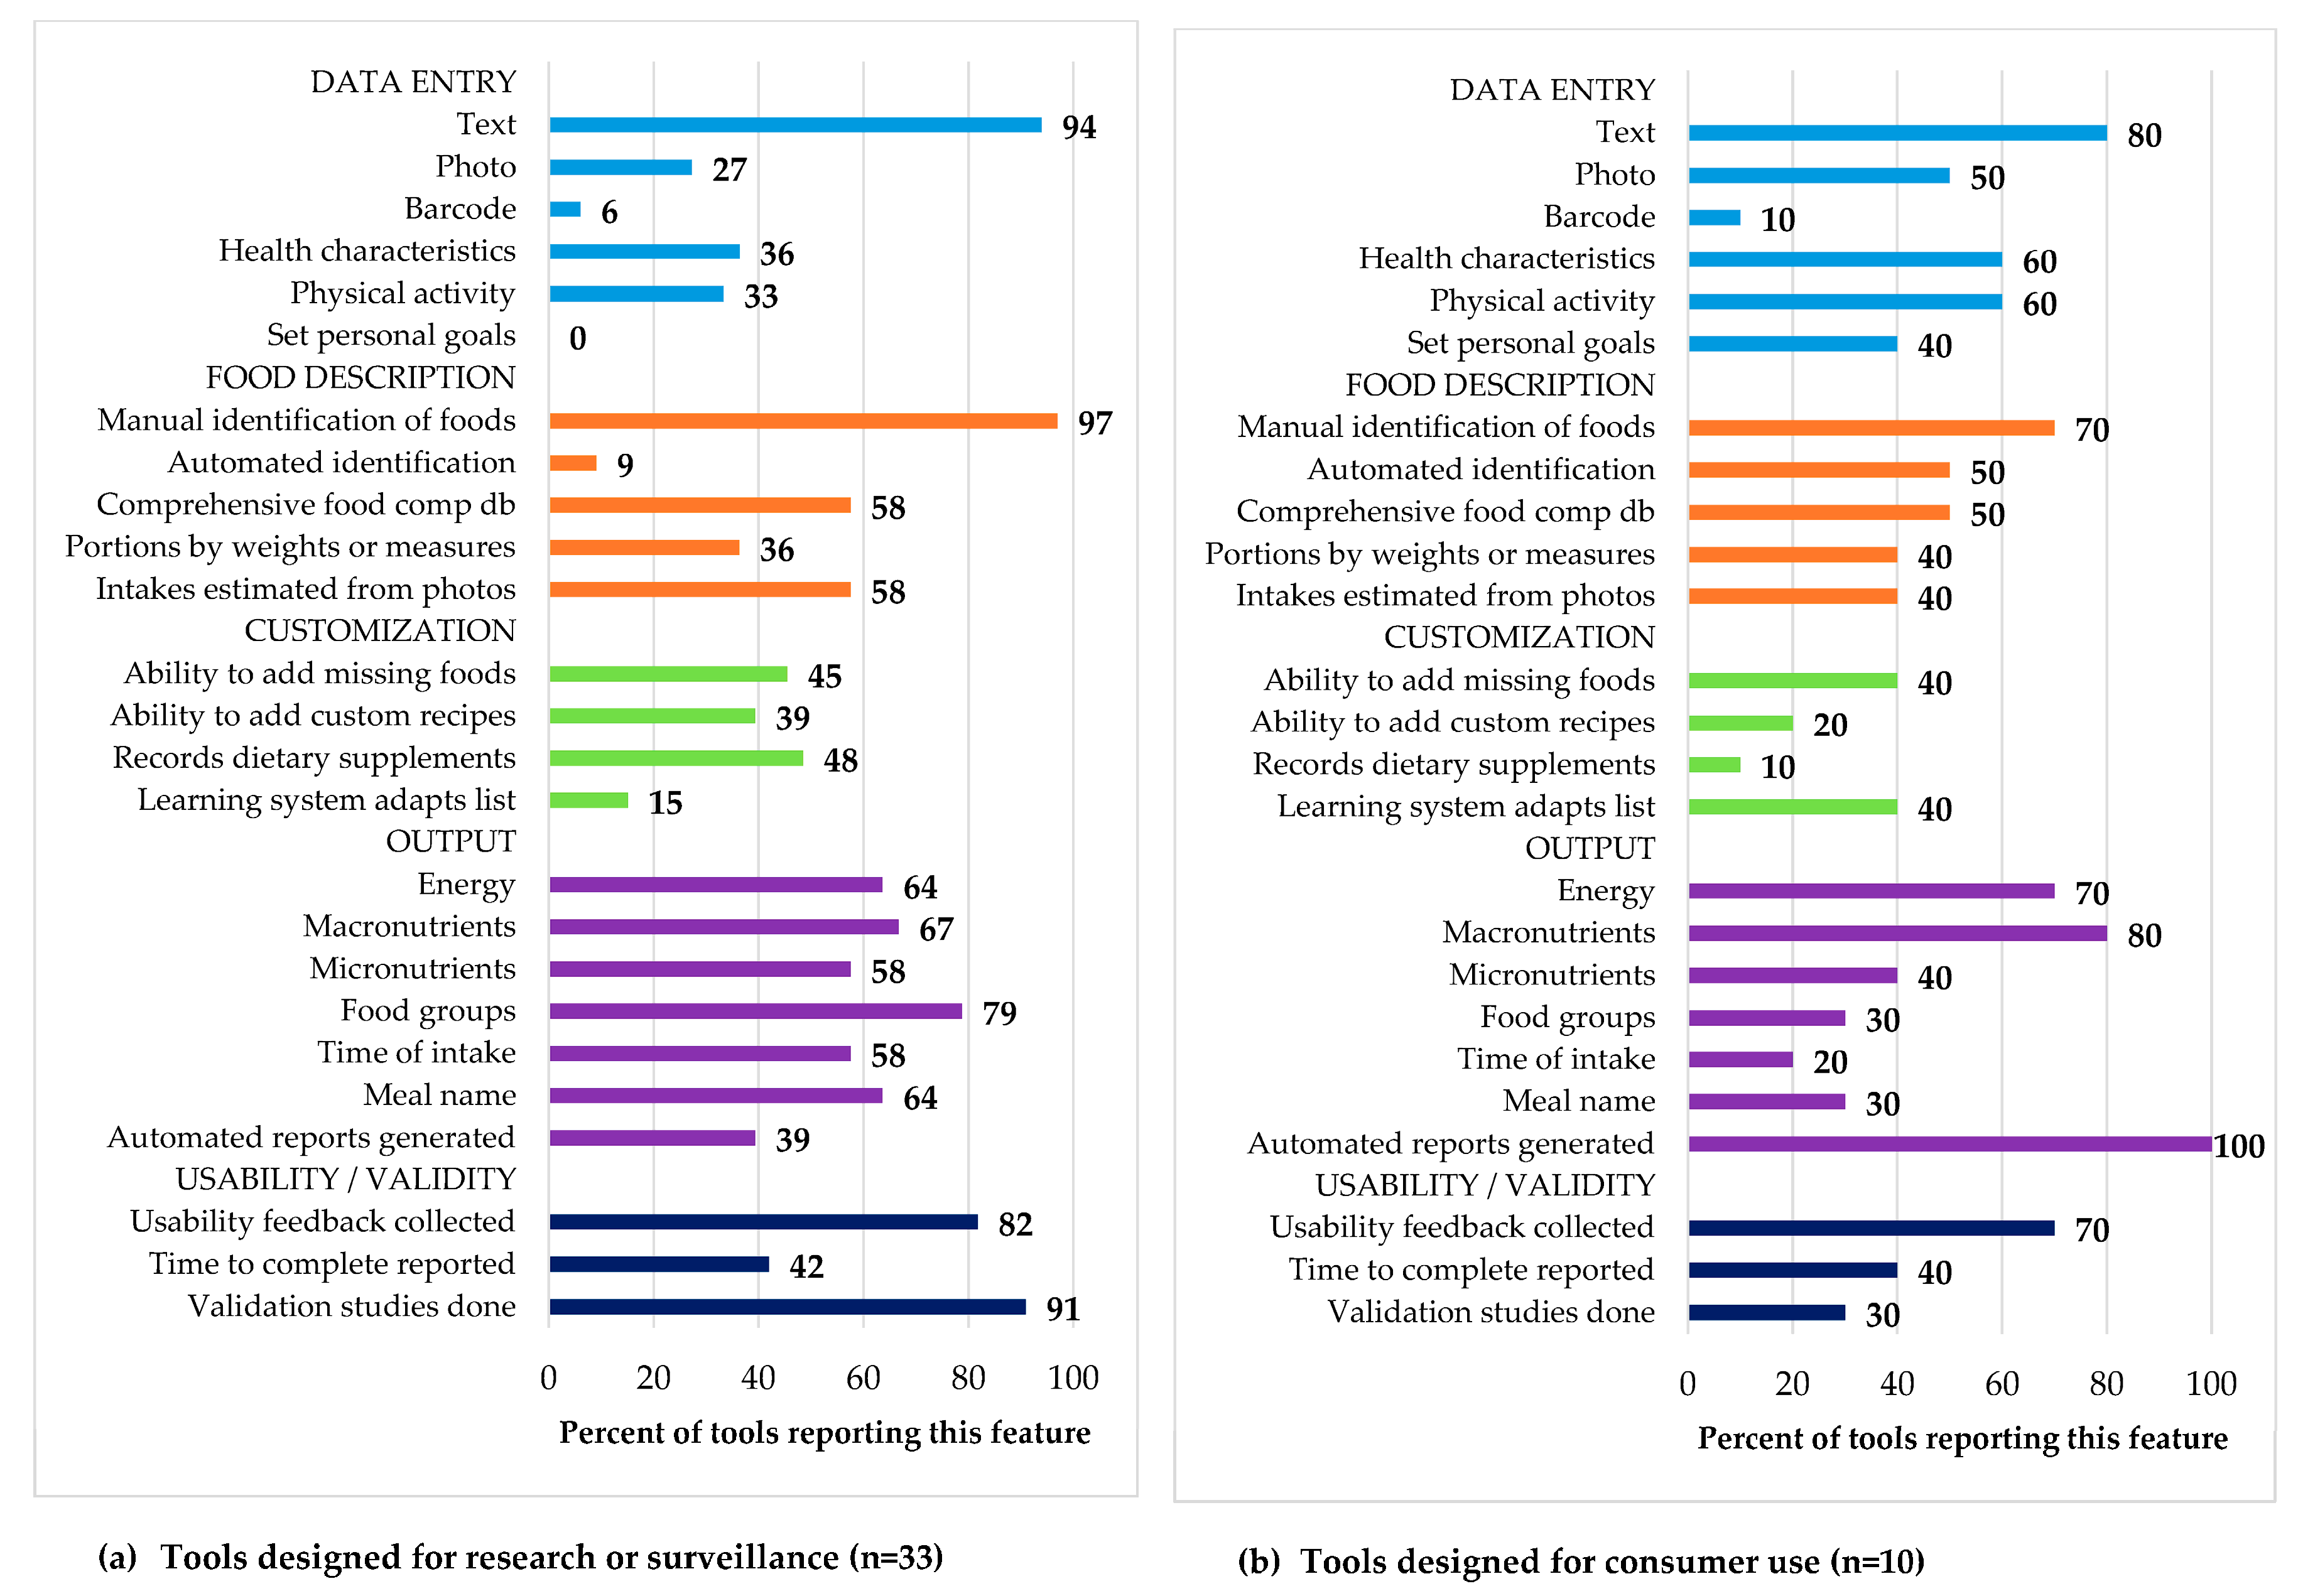
3.3. Comparison of Tools Used for Research versus Those for Consumer Use
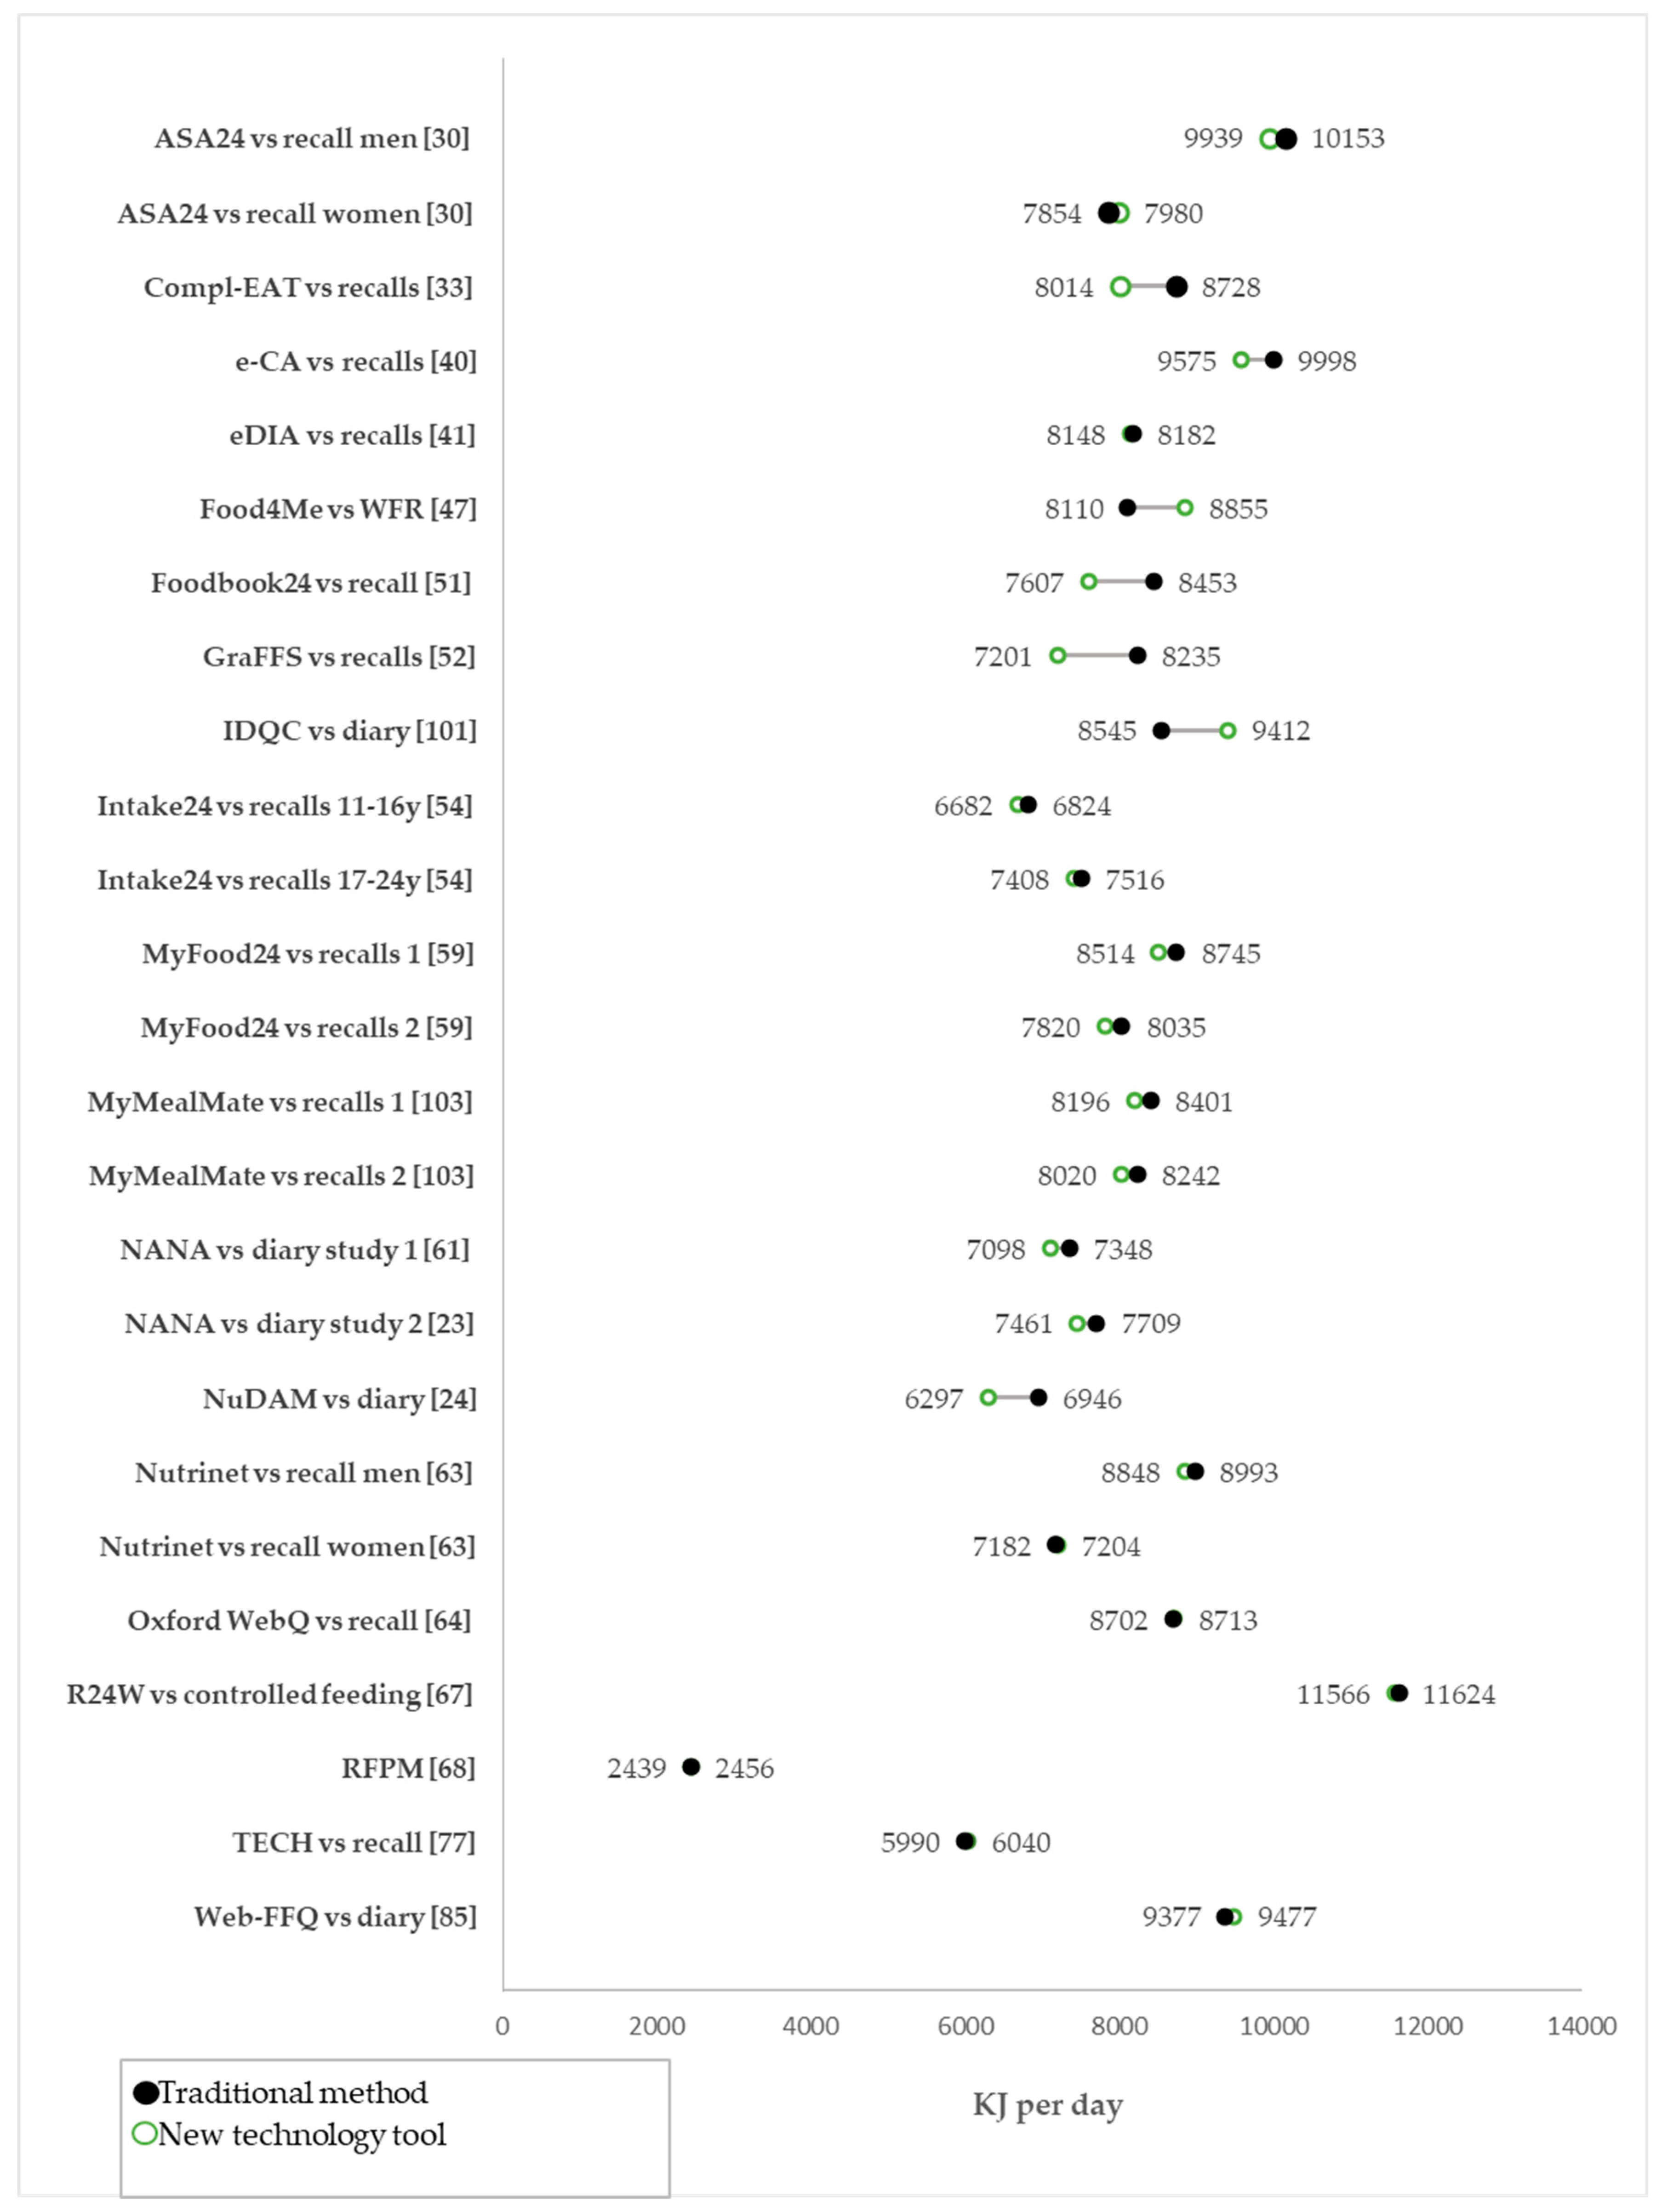
3.4. Validation Studies
4. Discussion
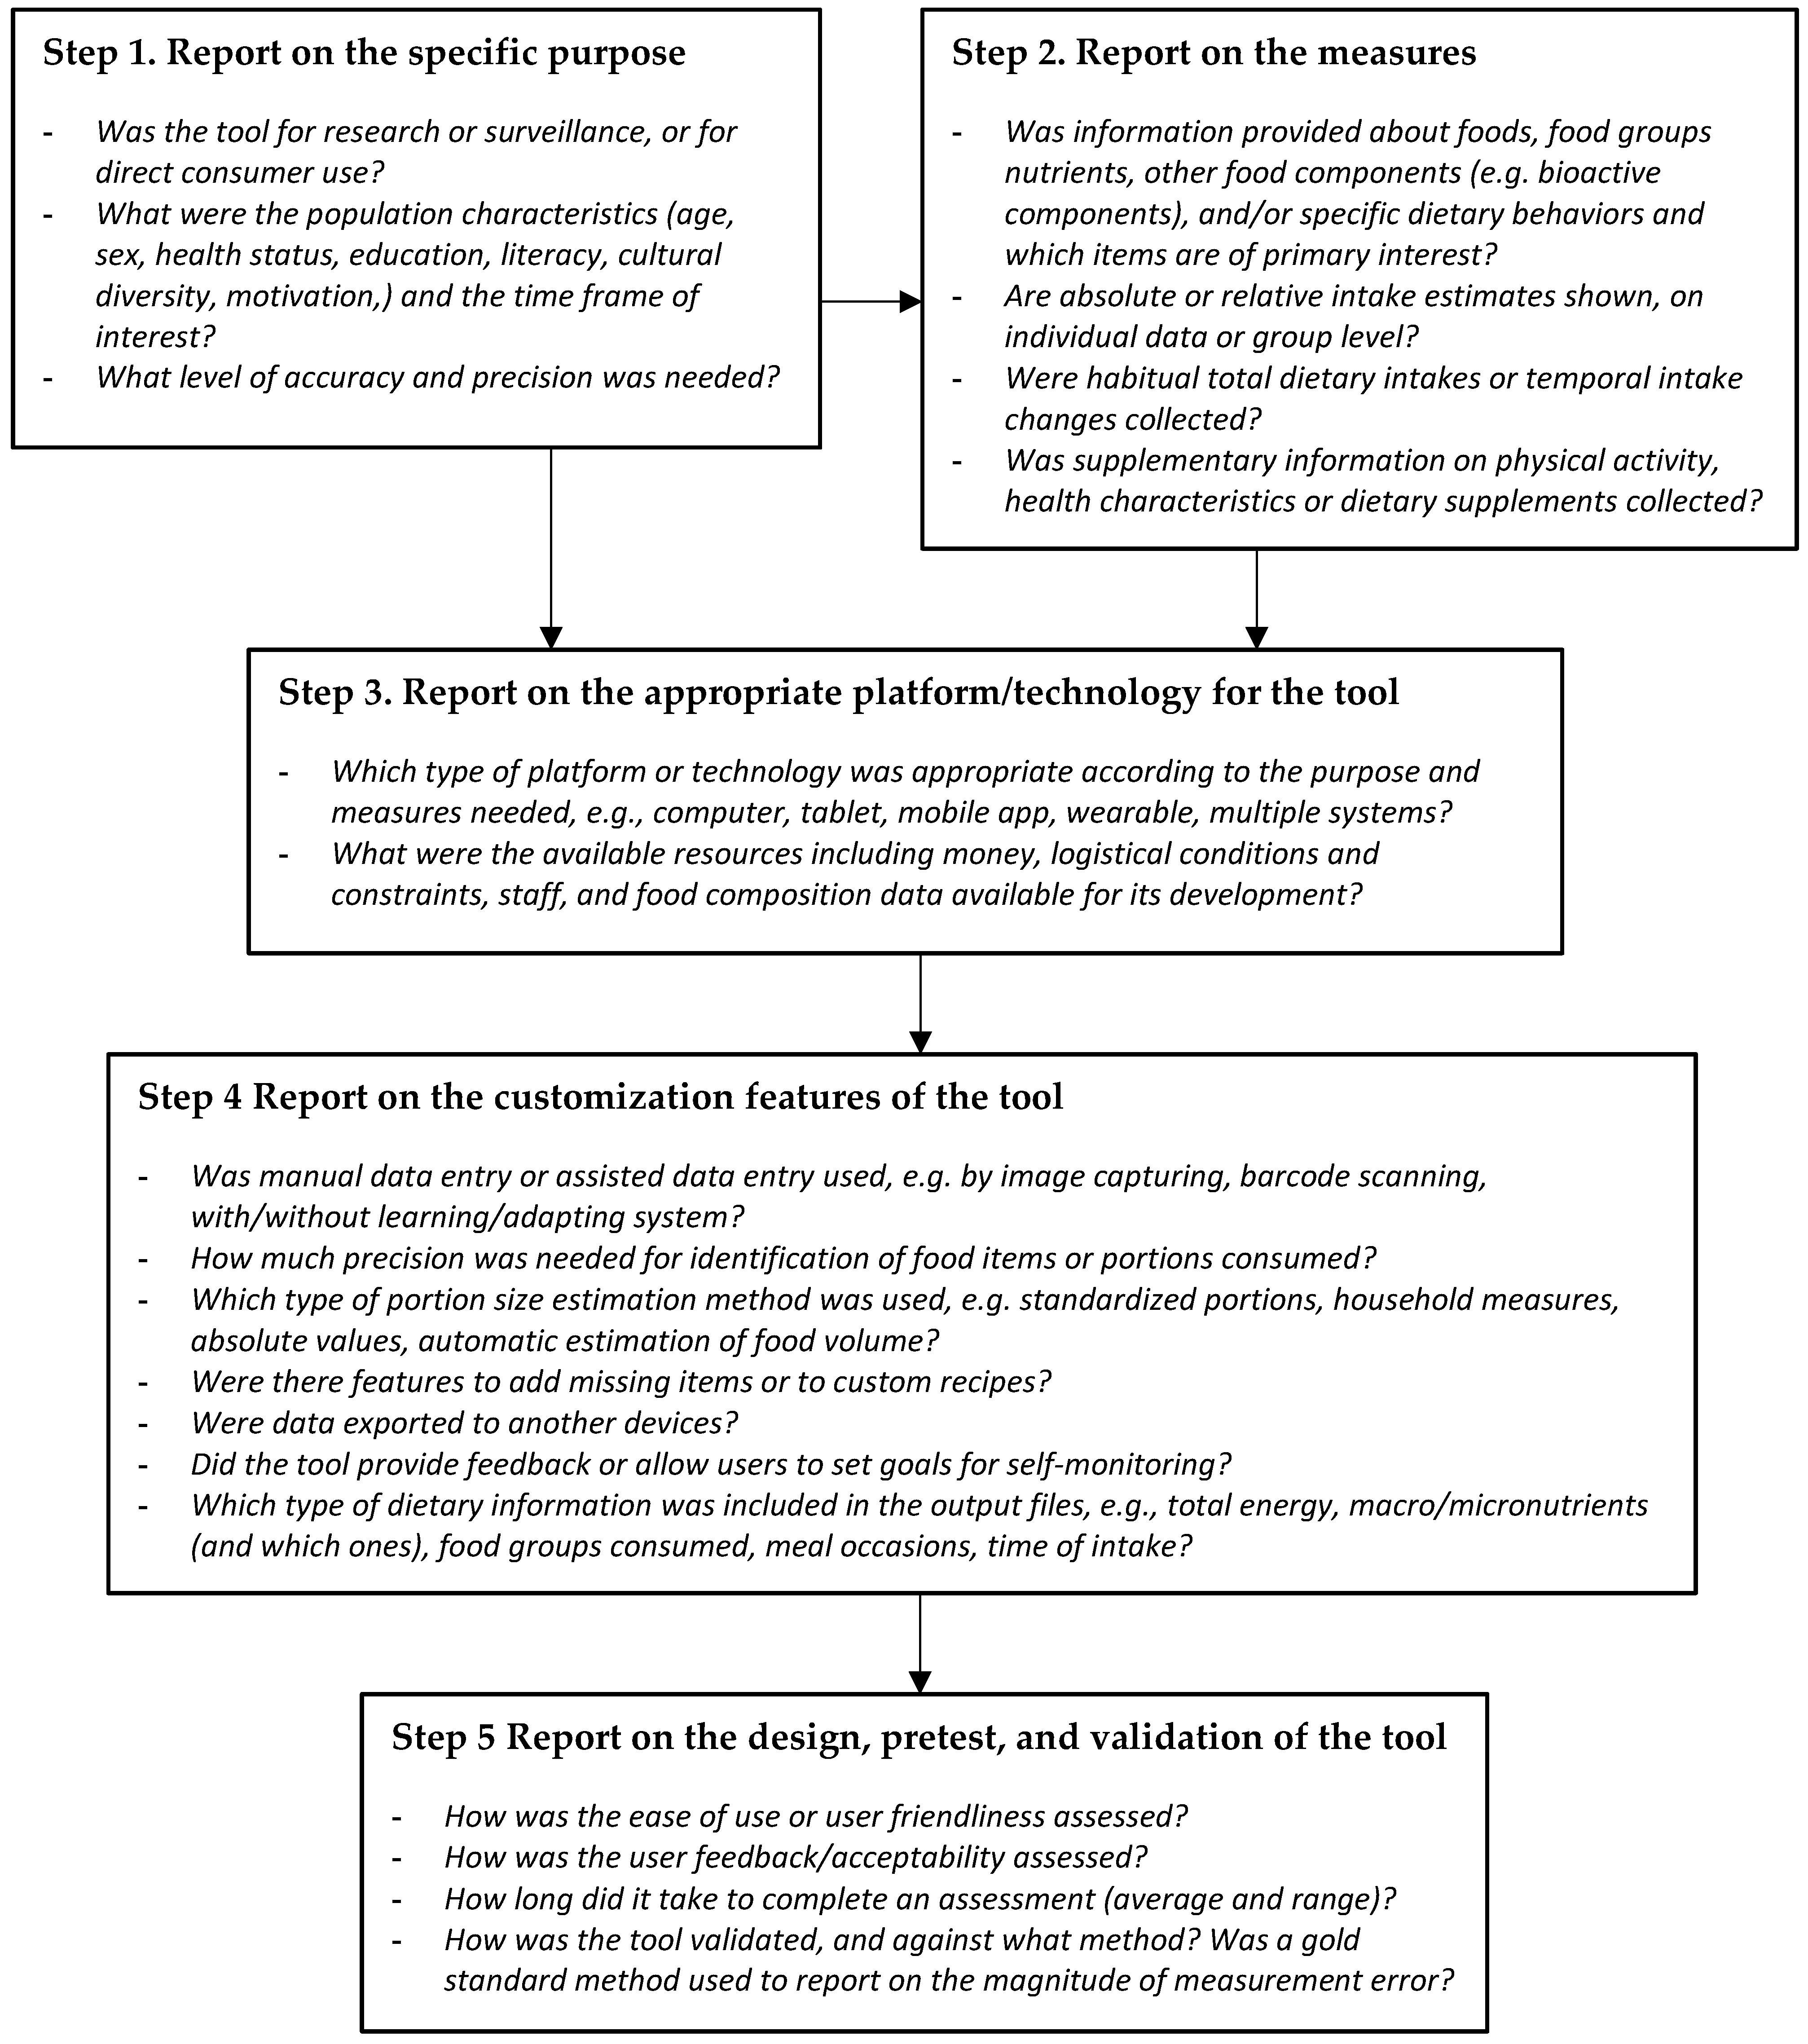
4.1. Best Practice Guidance for Reporting on New Technologies for Dietary Assessment
4.1.1. Step 1: Report on the Specific Purpose
4.1.2. Step 2: Report on the Measures
4.1.3. Step 3: Report on the Appropriate Platform/Technology for the Tool
4.1.4. Step 4: Report on the Customization Features of the Tool
4.1.5. Step 5: Report on the Design, Pretest, and Validation of the Tool
5. Conclusions
Supplementary Materials
Author Contributions
Funding
Acknowledgments
Conflicts of Interest
References
- Cade, J.E. Measuring diet in the 21st century: Use of new technologies. Proc. Nutr. Soc. 2017, 76, 276–282. [Google Scholar] [CrossRef] [PubMed]
- Cade, J.E.; Warthon-Medina, M.; Albar, S.; Alwan, N.A.; Ness, A.; Roe, M.; Wark, P.A.; Greathead, K.; Burley, V.J.; Finglas, P.; et al. DIET@NET: Best practice guidelines for dietary assessment in health research. BMC Med. 2017, 15, 202. [Google Scholar] [CrossRef] [PubMed]
- Freedman, L.S.; Potischman, N.; Kipnis, V.; Midthune, D.; Schatzkin, A.; Thompson, F.E.; Troiano, R.P.; Prentice, R.; Patterson, R.; Carroll, R.; et al. A comparison of two dietary instruments for evaluating the fat-breast cancer relationship. Int. J. Epidemiol. 2006, 35, 1011–1021. [Google Scholar] [CrossRef] [PubMed]
- Freedman, L.S.; Schatzkin, A.; Midthune, D.; Kipnis, V. Dealing with dietary measurement error in nutritional cohort studies. J. Natl. Cancer Inst. 2011, 103, 1086–1092. [Google Scholar] [CrossRef] [PubMed]
- Blanton, C.A.; Moshfegh, A.J.; Baer, D.J.; Kretsch, M.J. The USDA Automated Multiple-Pass Method accurately estimates group total energy and nutrient intake. J. Nutr. 2006, 136, 2594–2599. [Google Scholar] [CrossRef] [PubMed]
- Grandjean, A.C. Dietary intake data collection: Challenges and limitations. Nutr. Rev. 2012, 70 (Suppl. 2), S101–S104. [Google Scholar] [CrossRef] [PubMed]
- Burrows, T.L.; Rollo, M.E.; Williams, R.; Wood, L.G.; Garg, M.L.; Jensen, M.; Collins, C.E. A systematic review of technology-based dietary intake assessment validation studies that include carotenoid biomarkers. Nutrients 2017, 9, 140. [Google Scholar] [CrossRef] [PubMed]
- Karlsen, M.C.; Lichtenstein, A.H.; Economos, C.D.; Folta, S.C.; Rogers, G.; Jacques, P.F.; Livingston, K.A.; Rancano, K.M.; McKeown, N.M. Web-based recruitment and survey methodology to maximize response rates from followers of popular diets: The Adhering to Dietary Approaches for Personal Taste (ADAPT) feasibility survey. Curr. Dev. Nutr. 2018, 2, nzy012. [Google Scholar] [CrossRef] [PubMed]
- Carter, M.C.; Hancock, N.; Albar, S.A.; Brown, H.; Greenwood, D.C.; Hardie, L.J.; Frost, G.S.; Wark, P.A.; Cade, J.E. Development of a new branded uk food composition database for an online dietary assessment tool. Nutrients 2016, 8, 480. [Google Scholar] [CrossRef]
- Subar, A.F.; Crafts, J.; Zimmerman, T.P.; Wilson, M.; Mittl, B.; Islam, N.G.; McNutt, S.; Potischman, N.; Buday, R.; Hull, S.G.; et al. Assessment of the accuracy of portion size reports using computer-based food photographs aids in the development of an automated self-administered 24-h recall. J. Am. Diet Assoc. 2010, 110, 55–64. [Google Scholar] [CrossRef]
- Ngo, J.; Engelen, A.; Molag, M.; Roesle, J.; Garcia-Segovia, P.; Serra-Majem, L. A review of the use of information and communication technologies for dietary assessment. Br. J. Nutr. 2009, 101 (Suppl. 2), S102–S112. [Google Scholar] [CrossRef]
- Illner, A.K.; Freisling, H.; Boeing, H.; Huybrechts, I.; Crispim, S.P.; Slimani, N. Review and evaluation of innovative technologies for measuring diet in nutritional epidemiology. Int. J. Epidemiol. 2012, 41, 1187–1203. [Google Scholar] [CrossRef] [PubMed]
- Lachat, C.; Hawwash, D.; Ocke, M.C.; Berg, C.; Forsum, E.; Hornell, A.; Larsson, C.; Sonestedt, E.; Wirfalt, E.; Akesson, A.; et al. Strengthening the reporting of observational studies in epidemiology-nutritional epidemiology (STROBE-nut): An extension of the strobe statement. PLoS Med. 2016, 13, e1002036. [Google Scholar] [CrossRef] [PubMed]
- Boushey, C.J.; Spoden, M.; Zhu, F.M.; Delp, E.J.; Kerr, D.A. New mobile methods for dietary assessment: Review of image-assisted and image-based dietary assessment methods. Proc. Nutr. Soc. 2017, 76, 283–294. [Google Scholar] [CrossRef] [PubMed]
- Zhang, W.; Yu, Q.; Siddiquie, B.; Divakaran, A.; Sawhney, H. “Snap-n-eat”: Food recognition and nutrition estimation on a smartphone. J. Diabetes Sci. Technol. 2015, 9, 525–533. [Google Scholar] [CrossRef] [PubMed]
- Kong, F.; He, H.; Raynor, H.A.; Tan, J. Dietcam: Multi-view regular shape food recognition with a camera phone. Pervasive Mob. Comput. 2015, 19, 108–121. [Google Scholar] [CrossRef]
- Baranowski, T.; Islam, N.; Baranowski, J.; Martin, S.; Beltran, A.; Dadabhoy, H.; Adame, S.H.; Watson, K.B.; Thompson, D.; Cullen, K.W.; et al. Comparison of a web-based versus traditional diet recall among children. J. Acad. Nutr. Diet. 2012, 112, 527–532. [Google Scholar] [CrossRef]
- Baranowski, T.; Islam, N.; Douglass, D.; Dadabhoy, H.; Beltran, A.; Baranowski, J.; Thompson, D.; Cullen, K.W.; Subar, A.F. Food Intake Recording Software System, version 4 (FIRSSt4): A self-completed 24-h dietary recall for children. J. Hum. Nutr. Diet. 2014, 27 (Suppl. 1), 66–71. [Google Scholar] [CrossRef]
- Kirkpatrick, S.I.; Subar, A.F.; Douglass, D.; Zimmerman, T.P.; Thompson, F.E.; Kahle, L.L.; George, S.M.; Dodd, K.W.; Potischman, N. Performance of the automated self-administered 24-h recall relative to a measure of true intakes and to an interviewer-administered 24-h recall. Am. J. Clin. Nutr. 2014, 100, 233–240. [Google Scholar] [CrossRef]
- Thompson, F.E.; Dixit-Joshi, S.; Potischman, N.; Dodd, K.W.; Kirkpatrick, S.I.; Kushi, L.H.; Alexander, G.L.; Coleman, L.A.; Zimmerman, T.P.; Sundaram, M.E.; et al. Comparison of interviewer-administered and automated self-administered 24-h dietary recalls in 3 diverse integrated health systems. Am. J. Epidemiol. 2015, 181, 970–978. [Google Scholar] [CrossRef]
- Kerr, D.A.; Harray, A.J.; Pollard, C.M.; Dhaliwal, S.S.; Delp, E.J.; Howat, P.A.; Pickering, M.R.; Ahmad, Z.; Meng, X.; Pratt, I.S.; et al. The connecting health and technology study: A 6-month randomized controlled trial to improve nutrition behaviours using a mobile food record and text messaging support in young adults. Int. J. Behav. Nutr. Phys. Act. 2016, 13, 52. [Google Scholar] [CrossRef] [PubMed]
- Kerr, D.A.; Pollard, C.M.; Howat, P.; Delp, E.J.; Pickering, M.; Kerr, K.R.; Dhaliwal, S.S.; Pratt, I.S.; Wright, J.; Boushey, C.J. Connecting Health and Technology (CHAT): Protocol of a randomized controlled trial to improve nutrition behaviours using mobile devices and tailored text messaging in young adults. BMC Public Health 2012, 12, 477. [Google Scholar] [CrossRef] [PubMed]
- Pollard, C.M.; Howat, P.A.; Pratt, I.S.; Boushey, C.J.; Delp, E.J.; Kerr, D.A. Preferred tone of nutrition text messages for young adults: Focus group testing. JMIR mHealth uHealth 2016, 4, e1. [Google Scholar] [CrossRef] [PubMed]
- Meijboom, S.; van Houts-Streppel, M.T.; Perenboom, C.; Siebelink, E.; van de Wiel, A.M.; Geelen, A.; Feskens, E.J.M.; de Vries, J.H.M. Evaluation of dietary intake assessed by the Dutch self-administered web-based dietary 24-h recall tool (Compl-Eat) against interviewer-administered telephone-based 24-h recalls. J. Nutr. Sci. 2017, 6, e49. [Google Scholar] [CrossRef] [PubMed]
- Gurinovic, M.; Milesevic, J.; Kadvan, A.; Djekic-Ivankovic, M.; Debeljak-Martacic, J.; Takic, M.; Nikolic, M.; Rankovic, S.; Finglas, P.; Glibetic, M. Establishment and advances in the online Serbian food and recipe data base harmonized with EuroFIR standards. Food Chem. 2016, 193, 30–38. [Google Scholar] [CrossRef] [PubMed]
- Gurinovic, M.; Milesevic, J.; Kadvan, A.; Nikolic, M.; Zekovic, M.; Djekic-Ivankovic, M.; Dupouy, E.; Finglas, P.; Glibetic, M. Development, features and application of Diet Assess & Plan (DAP) software in supporting public health nutrition research in central eastern european countries (CEEC). Food Chem. 2018, 238, 186–194. [Google Scholar] [PubMed]
- Zekovic, M.; Djekic-Ivankovic, M.; Nikolic, M.; Gurinovic, M.; Krajnovic, D.; Glibetic, M. Validity of the food frequency questionnaire assessing the folate intake in women of reproductive age living in a country without food fortification: Application of the method of triads. Nutrients 2017, 9, 128. [Google Scholar] [CrossRef]
- Jung, H.J.; Lee, S.E.; Kim, D.; Noh, H.; Song, S.; Kang, M.; Song, Y.J.; Paik, H.Y. Improvement in the technological feasibility of a web-based dietary survey system in local settings. Asia Pac. J. Clin. Nutr. 2015, 24, 308–315. [Google Scholar]
- Sun, M.; Fernstrom, J.D.; Jia, W.; Hackworth, S.A.; Yao, N.; Li, Y.; Li, C.; Fernstrom, M.H.; Sclabassi, R.J. A wearable electronic system for objective dietary assessment. J. Am. Diet. Assoc. 2010, 110, 45–47. [Google Scholar] [CrossRef]
- Sun, M.; Burke, L.E.; Mao, Z.H.; Chen, Y.; Chen, H.C.; Bai, Y.; Li, Y.; Li, C.; Jia, W. Ebutton: A wearable computer for health monitoring and personal assistance. Proc. Des. Autom. Conf. 2014, 2014, 1–6. [Google Scholar] [CrossRef]
- Jia, W.; Chen, H.C.; Yue, Y.; Li, Z.; Fernstrom, J.; Bai, Y.; Li, C.; Sun, M. Accuracy of food portion size estimation from digital pictures acquired by a chest-worn camera. Public Health Nutr. 2014, 17, 1671–1681. [Google Scholar] [CrossRef] [PubMed]
- Bucher Della Torre, S.; Carrard, I.; Farina, E.; Danuser, B.; Kruseman, M. Development and evaluation of e-ca, an electronic mobile-based food record. Nutrients 2017, 9, 76. [Google Scholar] [CrossRef] [PubMed]
- Rangan, A.M.; O’Connor, S.; Giannelli, V.; Yap, M.L.; Tang, L.M.; Roy, R.; Louie, J.C.; Hebden, L.; Kay, J.; Allman-Farinelli, M. Electronic Dietary Intake Assessment (e-DIA): Comparison of a mobile phone digital entry app for dietary data collection with 24-h dietary recalls. JMIR mHealth uHealth 2015, 3, e98. [Google Scholar] [CrossRef] [PubMed]
- Rangan, A.M.; Tieleman, L.; Louie, J.C.; Tang, L.M.; Hebden, L.; Roy, R.; Kay, J.; Allman-Farinelli, M. Electronic Dietary Intake Assessment (e-DIA): Relative validity of a mobile phone application to measure intake of food groups. Br. J. Nutr. 2016, 115, 2219–2226. [Google Scholar] [CrossRef] [PubMed]
- de Boer, E.J.; Slimani, N.; van’t Veer, P.; Boeing, H.; Feinberg, M.; Leclercq, C.; Trolle, E.; Amiano, P.; Andersen, L.F.; Freisling, H.; et al. Rationale and methods of the European food consumption validation (EFCOVAL) project. Eur. J. Clin. Nutr. 2011, 65 (Suppl. 1), S1–S4. [Google Scholar] [CrossRef]
- Huybrechts, I.; Geelen, A.; de Vries, J.H.; Casagrande, C.; Nicolas, G.; De Keyzer, W.; Lillegaard, I.T.; Ruprich, J.; Lafay, L.; Wilson-van den Hooven, E.C.; et al. Respondents’ evaluation of the 24-h dietary recall method (EPIC-Soft) in the EFCOVAL project. Eur. J. Clin. Nutr. 2011, 65 (Suppl. 1), S29–S37. [Google Scholar] [CrossRef]
- Freisling, H.; Ocke, M.C.; Casagrande, C.; Nicolas, G.; Crispim, S.P.; Niekerk, M.; van der Laan, J.; de Boer, E.; Vandevijvere, S.; de Maeyer, M.; et al. Comparison of two food record-based dietary assessment methods for a pan-European food consumption survey among infants, toddlers, and children using data quality indicators. Eur. J. Nutr. 2015, 54, 437–445. [Google Scholar] [CrossRef]
- Park, M.K.; Freisling, H.; Huseinovic, E.; Winkvist, A.; Huybrechts, I.; Crispim, S.P.; de Vries, J.H.; Geelen, A.; Niekerk, M.; van Rossum, C.; et al. Comparison of meal patterns across five European countries using standardized 24-h recall (GloboDiet) data from the EFCOVAL project. Eur. J. Nutr. 2017, 57, 1045–1057. [Google Scholar] [CrossRef]
- Fallaize, R.; Forster, H.; Macready, A.L.; Walsh, M.C.; Mathers, J.C.; Brennan, L.; Gibney, E.R.; Gibney, M.J.; Lovegrove, J.A. Online dietary intake estimation: Reproducibility and validity of the Food4Me food frequency questionnaire against a 4-day weighed food record. J Med Internet Res 2014, 16, e190. [Google Scholar] [CrossRef]
- Forster, H.; Fallaize, R.; Gallagher, C.; O’Donovan, C.B.; Woolhead, C.; Walsh, M.C.; Macready, A.L.; Lovegrove, J.A.; Mathers, J.C.; Gibney, M.J.; et al. Online dietary intake estimation: The Food4Me food frequency questionnaire. J. Med. Internet Res. 2014, 16, e150. [Google Scholar] [CrossRef]
- Celis-Morales, C.; Livingstone, K.M.; Marsaux, C.F.; Macready, A.L.; Fallaize, R.; O’Donovan, C.B.; Woolhead, C.; Forster, H.; Walsh, M.C.; Navas-Carretero, S.; et al. Effect of personalized nutrition on health-related behaviour change: Evidence from the Food4me European randomized controlled trial. Int. J. Epidemiol. 2017, 46, 578–588. [Google Scholar] [CrossRef] [PubMed]
- Timon, C.M.; Blain, R.J.; McNulty, B.; Kehoe, L.; Evans, K.; Walton, J.; Flynn, A.; Gibney, E.R. The development, validation, and user evaluation of Foodbook24: A web-based dietary assessment tool developed for the Irish adult population. J. Med. Internet Res. 2017, 19, e158. [Google Scholar] [CrossRef] [PubMed]
- Timon, C.M.; Evans, K.; Kehoe, L.; Blain, R.J.; Flynn, A.; Gibney, E.R.; Walton, J. Comparison of a web-based 24-h dietary recall tool (Foodbook24) to an interviewer-led 24-h dietary recall. Nutrients 2017, 9, 425. [Google Scholar] [CrossRef] [PubMed]
- Pendergast, F.J.; Ridgers, N.D.; Worsley, A.; McNaughton, S.A. Evaluation of a smartphone food diary application using objectively measured energy expenditure. Int. J. Behav. Nutr. Phys. Act. 2017, 14, 30. [Google Scholar] [CrossRef] [PubMed]
- Kristal, A.R.; Kolar, A.S.; Fisher, J.L.; Plascak, J.J.; Stumbo, P.J.; Weiss, R.; Paskett, E.D. Evaluation of Web-based, self-administered, graphical food frequency questionnaire. J. Acad. Nutr. Diet. 2014, 114, 613–621. [Google Scholar] [CrossRef] [PubMed]
- Foster, E.; Hawkins, A.; Delve, J.; Adamson, A.J. Reducing the cost of dietary assessment: Self-completed recall and analysis of nutrition for use with children (SCRAN24). J. Hum. Nutr. Diet. 2014, 27 (Suppl. 1), 26–35. [Google Scholar] [CrossRef]
- Bradley, J.; Simpson, E.; Poliakov, I.; Matthews, J.N.; Olivier, P.; Adamson, A.J.; Foster, E. Comparison of INTAKE24 (an online 24-h dietary recall tool) with interviewer-led 24-h recall in 11-24 year-old. Nutrients 2016, 8, 358. [Google Scholar] [CrossRef]
- Simpson, E.; Bradley, J.; Poliakov, I.; Jackson, D.; Olivier, P.; Adamson, A.J.; Foster, E. Iterative development of an online dietary recall tool: INTAKE24. Nutrients 2017, 9, 118. [Google Scholar] [CrossRef]
- O’Loughlin, G.; Cullen, S.J.; McGoldrick, A.; O’Connor, S.; Blain, R.; O’Malley, S.; Warrington, G.D. Using a wearable camera to increase the accuracy of dietary analysis. Am. J. Prev. Med. 2013, 44, 297–301. [Google Scholar] [CrossRef]
- Gemming, L.; Doherty, A.; Kelly, P.; Utter, J.; Ni Mhurchu, C. Feasibility of a sensecam-assisted 24-h recall to reduce under-reporting of energy intake. Eur. J. Clin. Nutr. 2013, 67, 1095–1099. [Google Scholar] [CrossRef]
- Gemming, L.; Rush, E.; Maddison, R.; Doherty, A.; Gant, N.; Utter, J.; Ni Mhurchu, C. Wearable cameras can reduce dietary under-reporting: Doubly labelled water validation of a camera-assisted 24 h recall. Br. J. Nutr. 2015, 113, 284–291. [Google Scholar] [CrossRef] [PubMed]
- Carter, M.C.; Albar, S.A.; Morris, M.A.; Mulla, U.Z.; Hancock, N.; Evans, C.E.; Alwan, N.A.; Greenwood, D.C.; Hardie, L.J.; Frost, G.S.; et al. Development of a UK online 24-h dietary assessment tool: Myfood24. Nutrients 2015, 7, 4016–4032. [Google Scholar] [CrossRef] [PubMed]
- Albar, S.A.; Alwan, N.A.; Evans, C.E.; Greenwood, D.C.; Cade, J.E. Agreement between an online dietary assessment tool (Myfood24) and an interviewer-administered 24-h dietary recall in british adolescents aged 11-18 years. Br. J. Nutr. 2016, 115, 1678–1686. [Google Scholar] [CrossRef] [PubMed]
- Daniel, C.R.; Kapur, K.; McAdams, M.J.; Dixit-Joshi, S.; Devasenapathy, N.; Shetty, H.; Hariharan, S.; George, P.S.; Mathew, A.; Sinha, R. Development of a field-friendly automated dietary assessment tool and nutrient database for India. Br. J. Nutr. 2014, 111, 160–171. [Google Scholar] [CrossRef] [PubMed]
- Astell, A.J.; Hwang, F.; Brown, L.J.; Timon, C.; Maclean, L.M.; Smith, T.; Adlam, T.; Khadra, H.; Williams, E.A. Validation of the NANA (Novel Assessment of Nutrition and Ageing) touch screen system for use at home by older adults. Exp. Gerontol. 2014, 60, 100–107. [Google Scholar] [CrossRef] [PubMed]
- Timon, C.M.; Astell, A.J.; Hwang, F.; Adlam, T.D.; Smith, T.; Maclean, L.; Spurr, D.; Forster, S.E.; Williams, E.A. The validation of a computer-based food record for older adults: The Novel Assessment of Nutrition and Ageing (NANA) method. Br. J. Nutr. 2015, 113, 654–664. [Google Scholar] [CrossRef] [PubMed]
- Rollo, M.E.; Ash, S.; Lyons-Wall, P.; Russell, A. Trial of a mobile phone method for recording dietary intake in adults with type 2 diabetes: Evaluation and implications for future applications. J. Telemed. Telecare 2011, 17, 318–323. [Google Scholar] [CrossRef] [PubMed]
- Rollo, M.E.; Ash, S.; Lyons-Wall, P.; Russell, A.W. Evaluation of a mobile phone image-based dietary assessment method in adults with type 2 diabetes. Nutrients 2015, 7, 4897–4910. [Google Scholar] [CrossRef] [PubMed]
- Touvier, M.; Kesse-Guyot, E.; Mejean, C.; Pollet, C.; Malon, A.; Castetbon, K.; Hercberg, S. Comparison between an interactive Web-based self-administered 24 h dietary record and an interview by a dietitian for large-scale epidemiological studies. Br. J. Nutr. 2011, 105, 1055–1064. [Google Scholar] [CrossRef]
- Liu, B.; Young, H.; Crowe, F.L.; Benson, V.S.; Spencer, E.A.; Key, T.J.; Appleby, P.N.; Beral, V. Development and evaluation of the Oxford WebQ, a low-cost, web-based method for assessment of previous 24 h dietary intakes in large-scale prospective studies. Public Health Nutr. 2011, 14, 1998–2005. [Google Scholar] [CrossRef]
- Galante, J.; Adamska, L.; Young, A.; Young, H.; Littlejohns, T.J.; Gallacher, J.; Allen, N. The acceptability of repeat internet-based hybrid diet assessment of previous 24-h dietary intake: Administration of the Oxford WebQ in UK Biobank. Br. J. Nutr. 2016, 115, 681–686. [Google Scholar] [CrossRef] [PubMed]
- Jacques, S.; Lemieux, S.; Lamarche, B.; Laramee, C.; Corneau, L.; Lapointe, A.; Tessier-Grenier, M.; Robitaille, J. Development of a Web-based 24-h dietary recall for a French-Canadian population. Nutrients 2016, 8, 724. [Google Scholar] [CrossRef] [PubMed]
- Lafrenière, J.; Benoît Lamarche, B.; Catherine Laramée, C.; Julie Robitaille, J.; Lemieux, S. Validation of a newly automated webbased 24-h dietary recall using fully controlled feeding studies. BMC Nutr. 2017, 3, 34. [Google Scholar] [CrossRef]
- Martin, C.K.; Correa, J.B.; Han, H.; Allen, H.R.; Rood, J.C.; Champagne, C.M.; Gunturk, B.K.; Bray, G.A. Validity of the Remote Food Photography Method (RFPM) for estimating energy and nutrient intake in near real-time. Obesity 2012, 20, 891–899. [Google Scholar] [CrossRef] [PubMed]
- Martin, C.K.; Nicklas, T.; Gunturk, B.; Correa, J.B.; Allen, H.R.; Champagne, C. Measuring food intake with digital photography. J. Hum. Nutr. Diet. 2014, 27 (Suppl. 1), 72–81. [Google Scholar] [CrossRef] [PubMed]
- Nicklas, T.; Saab, R.; Islam, N.G.; Wong, W.; Butte, N.; Schulin, R.; Liu, Y.; Apolzan, J.W.; Myers, C.A.; Martin, C.K. Validity of the Remote Food Photography Method against doubly labeled water among minority preschoolers. Obesity 2017, 25, 1633–1638. [Google Scholar] [CrossRef] [PubMed]
- Moore, H.J.; Hillier, F.C.; Batterham, A.M.; Ells, L.J.; Summerbell, C.D. Technology-based dietary assessment: Development of the Synchronised Nutrition and Activity Program (SNAP). J. Hum. Nutr. Diet. 2014, 27 (Suppl. 1), 36–42. [Google Scholar] [CrossRef]
- Hillier, F.C.; Batterham, A.M.; Crooks, S.; Moore, H.J.; Summerbell, C.D. The development and evaluation of a novel internet-based computer program to assess previous-day dietary and physical activity behaviours in adults: The Synchronised Nutrition and Activity Program for adults (SNAPA). Br. J. Nutr. 2012, 107, 1221–1231. [Google Scholar] [CrossRef]
- Daugherty, B.L.; Schap, T.E.; Ettienne-Gittens, R.; Zhu, F.M.; Bosch, M.; Delp, E.J.; Ebert, D.S.; Kerr, D.A.; Boushey, C.J. Novel technologies for assessing dietary intake: Evaluating the usability of a mobile telephone food record among adults and adolescents. J. Med. Internet Res. 2012, 14, e58. [Google Scholar] [CrossRef]
- Ahmad, Z.; Kerr, D.A.; Bosch, M.; Boushey, C.J.; Delp, E.J.; Khanna, N.; Zhu, F. A mobile food record for integrated dietary assessment. MADiMa16 (2016) 2016, 2016, 53–62. [Google Scholar]
- Boushey, C.J.; Harray, A.J.; Kerr, D.A.; Schap, T.E.; Paterson, S.; Aflague, T.; Bosch Ruiz, M.; Ahmad, Z.; Delp, E.J. How willing are adolescents to record their dietary intake? The mobile food record. JMIR mHealth uHealth 2015, 3, e47. [Google Scholar] [CrossRef] [PubMed]
- Boushey, C.J.; Spoden, M.; Delp, E.J.; Zhu, F.; Bosch, M.; Ahmad, Z.; Shvetsov, Y.B.; DeLany, J.P.; Kerr, D.A. Reported energy intake accuracy compared to doubly labeled water and usability of the mobile food record among community dwelling adults. Nutrients 2017, 9, 312. [Google Scholar] [CrossRef] [PubMed]
- Delisle, C.; Sandin, S.; Forsum, E.; Henriksson, H.; Trolle-Lagerros, Y.; Larsson, C.; Maddison, R.; Ortega, F.B.; Ruiz, J.R.; Silfvernagel, K.; et al. A Web- and mobile phone-based intervention to prevent obesity in 4-year-olds (MINISTOP): A population-based randomized controlled trial. BMC Public Health 2015, 15, 95. [Google Scholar] [CrossRef] [PubMed]
- Henriksson, H.; Bonn, S.E.; Bergstrom, A.; Balter, K.; Balter, O.; Delisle, C.; Forsum, E.; Lof, M. A new mobile phone-based tool for assessing energy and certain food intakes in young children: A validation study. JMIR mHealth uHealth 2015, 3, e38. [Google Scholar] [CrossRef] [PubMed]
- Delisle Nystrom, C.; Forsum, E.; Henriksson, H.; Trolle-Lagerros, Y.; Larsson, C.; Maddison, R.; Timpka, T.; Lof, M. A mobile phone based method to assess energy and food intake in young children: A validation study against the doubly labelled water method and 24 h dietary recalls. Nutrients 2016, 8, 50. [Google Scholar] [CrossRef] [PubMed]
- da Silva, M.M.; Sala, P.C.; Torrinhas, R.S.; Waitzberg, D.L. Efficiency of the 24-h food recall instrument for assessing nutrient intake before and after Roux-en-Y gastric bypass. Nutr. Hosp. 2014, 30, 1240–1247. [Google Scholar] [PubMed]
- da Silva, M.M.; Sala, P.C.; Cardinelli, C.S.; Torrinhas, R.S.; Waitzberg, D.L. Comparison of Virtual Nutri Plus® and Dietpro 5i® software systems for the assessment of nutrient intake before and after Roux-en-Y gastric bypass. Clinics (Sao Paulo) 2014, 69, 714–722. [Google Scholar] [CrossRef]
- Davies, V.F.; Kupek, E.; de Assis, M.A.; Natal, S.; Di Pietro, P.F.; Baranowski, T. Validation of a web-based questionnaire to assess the dietary intake of brazilian children aged 7–10 years. J. Hum. Nutr. Diet. 2015, 28 (Suppl. 1), 93–102. [Google Scholar] [CrossRef]
- Kupek, E.; de Assis, M.A. The use of multiple imputation method for the validation of 24-h food recalls by part-time observation of dietary intake in school. Br. J. Nutr. 2016, 116, 904–912. [Google Scholar] [CrossRef]
- Biltoft-Jensen, A.; Bysted, A.; Trolle, E.; Christensen, T.; Knuthsen, P.; Damsgaard, C.T.; Andersen, L.F.; Brockhoff, P.; Tetens, I. Evaluation of web-based dietary assessment software for children: Comparing reported fruit, juice and vegetable intakes with plasma carotenoid concentration and school lunch observations. Br. J. Nutr. 2013, 110, 186–195. [Google Scholar] [CrossRef]
- Biltoft-Jensen, A.; Trolle, E.; Christensen, T.; Islam, N.; Andersen, L.F.; Egenfeldt-Nielsen, S.; Tetens, I. Webdasc: A Web-based dietary assessment software for 8-11-year-old danish children. J. Hum. Nutr. Diet. 2012, 27 (Suppl. 1), 43–53. [Google Scholar] [CrossRef]
- Andersen, R.; Biltoft-Jensen, A.; Christensen, T.; Andersen, E.W.; Ege, M.; Thorsen, A.V.; Knudsen, V.K.; Damsgaard, C.T.; Sorensen, L.B.; Petersen, R.A.; et al. What do Danish children eat, and does the diet meet the recommendations? Baseline data from the Opus School Meal Study. J. Nutr. Sci. 2015, 4, e29. [Google Scholar] [CrossRef] [PubMed]
- Labonte, M.E.; Cyr, A.; Baril-Gravel, L.; Royer, M.M.; Lamarche, B. Validity and reproducibility of a Web-based, self-administered food frequency questionnaire. Eur. J. Clin. Nutr. 2012, 66, 166–173. [Google Scholar] [CrossRef] [PubMed]
- Medin, A.C.; Astrup, H.; Kasin, B.M.; Andersen, L.F. Evaluation of a Web-based food record for children using direct unobtrusive lunch observations: A validation study. J. Med. Internet Res. 2015, 17, e273. [Google Scholar] [CrossRef] [PubMed]
- Medin, A.C.; Carlsen, M.H.; Andersen, L.F. Associations between reported intakes of carotenoid-rich foods and concentrations of carotenoids in plasma: A validation study of a web-based food recall for children and adolescents. Public Health Nutr. 2016, 19, 3265–3275. [Google Scholar] [CrossRef] [PubMed]
- Medin, A.C.; Hansen, B.H.; Astrup, H.; Ekelund, U.; Frost Andersen, L. Validation of energy intake from a web-based food recall for children and adolescents. PLoS ONE 2017, 12, e0178921. [Google Scholar] [CrossRef] [PubMed]
- Caswell, B.L.; Talegawkar, S.A.; Dyer, B.; Siamusantu, W.; Klemm, R.D.; Palmer, A.C. Assessing child nutrient intakes using a tablet-based 24-h recall tool in rural Zambia. Food Nutr. Bull. 2015, 36, 467–480. [Google Scholar] [CrossRef]
- Arsand, E.; Muzny, M.; Bradway, M.; Muzik, J.; Hartvigsen, G. Performance of the first combined smartwatch and smartphone diabetes diary application study. J. Diabetes Sci. Technol. 2015, 9, 556–563. [Google Scholar] [CrossRef]
- Kong, F.; Tan, J. Dietcam: Regular shape food recognition with a camera phone. In Proceedings of the 2011 International Conference on Body Sensor Networks, Dallas, TX, USA, 23–25 May 2011; pp. 127–132. [Google Scholar]
- Kong, F. Automatic Food Intake Assessment Using Camera Phones. Master’s Thesis, Michigan Technological University, Houghton, MI, USA, 2012. [Google Scholar]
- Kong, F.; Tan, J. Dietcam: Sutomatic dietary assessment with mobile camera phones. Pervasive Mob. Comput. 2012, 8, 147–163. [Google Scholar] [CrossRef]
- Connelly, K.; Siek, K.A.; Chaudry, B.; Jones, J.; Astroth, K.; Welch, J.L. An offline mobile nutrition monitoring intervention for varying-literacy patients receiving hemodialysis: A pilot study examining usage and usability. J. Am. Med. Inform. Assoc. 2012, 19, 705–712. [Google Scholar] [CrossRef]
- Welch, J.L.; Astroth, K.S.; Perkins, S.M.; Johnson, C.S.; Connelly, K.; Siek, K.A.; Jones, J.; Scott, L.L. Using a mobile application to self-monitor diet and fluid intake among adults receiving hemodialysis. Res. Nurs. Health 2013, 36, 284–298. [Google Scholar] [CrossRef] [PubMed]
- Recio-Rodriguez, J.I.; Martin-Cantera, C.; Gonzalez-Viejo, N.; Gomez-Arranz, A.; Arietaleanizbeascoa, M.S.; Schmolling-Guinovart, Y.; Maderuelo-Fernandez, J.A.; Perez-Arechaederra, D.; Rodriguez-Sanchez, E.; Gomez-Marcos, M.A.; et al. Effectiveness of a smartphone application for improving healthy lifestyles, a randomized clinical trial (EVIDENT II): Study protocol. BMC Public Health 2014, 14, 254. [Google Scholar] [CrossRef] [PubMed]
- Recio-Rodriguez, J.I.; Agudo-Conde, C.; Martin-Cantera, C.; Gonzalez-Viejo, M.N.; Fernandez-Alonso, M.D.; Arietaleanizbeaskoa, M.S.; Schmolling-Guinovart, Y.; Maderuelo-Fernandez, J.A.; Rodriguez-Sanchez, E.; Gomez-Marcos, M.A.; et al. Short-term effectiveness of a mobile phone app for increasing physical activity and adherence to the Mediterranean diet in primary care: A randomized controlled trial (EVIDENT Ii study). J. Med. Internet Res. 2016, 18, e331. [Google Scholar] [CrossRef]
- Aizawa, K.; Maeda, K.; Ogawa, M.; Sato, Y.; Kasamatsu, M.; Waki, K.; Takimoto, H. Comparative study of the routine daily usability of FoodLog: A smartphone-based food recording tool assisted by image retrieval. J Diabetes Sci. Technol. 2014, 8, 203–208. [Google Scholar] [CrossRef] [PubMed]
- Waki, K.; Fujita, H.; Uchimura, Y.; Aramaki, E.; Omae, K.; Kadowaki, T.; Ohe, K. Dialbetics: Smartphone-based self-management for type 2 diabetes patients. J. Diabetes Sci. Technol. 2012, 6, 983–985. [Google Scholar] [CrossRef] [PubMed]
- Waki, K.; Aizawa, K.; Kato, S.; Fujita, H.; Lee, H.; Kobayashi, H.; Ogawa, M.; Mouri, K.; Kadowaki, T.; Ohe, K. Dialbetics with a multimedia food recording tool, FoodLog: Smartphone-based self-management for type 2 diabetes. J. Diabetes Sci. Technol. 2015, 9, 534–540. [Google Scholar] [CrossRef] [PubMed]
- Bally, L.; Dehais, J.; Nakas, C.T.; Anthimopoulos, M.; Laimer, M.; Rhyner, D.; Rosenberg, G.; Zueger, T.; Diem, P.; Mougiakakou, S.; et al. Carbohydrate estimation supported by the GoCARB system in individuals with type 1 diabetes: A randomized prospective pilot study. Diabetes Care 2017, 40, e6–e7. [Google Scholar] [CrossRef]
- Rhyner, D.; Loher, H.; Dehais, J.; Anthimopoulos, M.; Shevchik, S.; Botwey, R.H.; Duke, D.; Stettler, C.; Diem, P.; Mougiakakou, S. Carbohydrate estimation by a mobile phone-based system versus self-estimations of individuals with type 1 diabetes mellitus: A comparative study. J. Med. Internet Res. 2016, 18, e101. [Google Scholar] [CrossRef]
- Du, S.S.; Jiang, Y.S.; Chen, Y.; Li, Z.; Zhang, Y.F.; Sun, C.H.; Feng, R.N. Development and applicability of an internet-based diet and lifestyle questionnaire for college students in China: A cross-sectional study. Medicine (Baltimore) 2015, 94, e2130. [Google Scholar] [CrossRef]
- Carter, M.C.; Burley, V.J.; Cade, J.E. Development of ‘My Meal Mate’—A smartphone intervention for weight loss. Nutr. Bull. 2013, 38, 80–84. [Google Scholar] [CrossRef]
- Carter, M.C.; Burley, V.J.; Nykjaer, C.; Cade, J.E. ‘My Meal Mate’ (MMM): Validation of the diet measures captured on a smartphone application to facilitate weight loss. Br. J. Nutr. 2013, 109, 539–546. [Google Scholar] [CrossRef] [PubMed]
- Carter, M.C.; Burley, V.J.; Nykjaer, C.; Cade, J.E. Adherence to a smartphone application for weight loss compared to website and paper diary: Pilot randomized controlled trial. J. Med. Internet Res. 2013, 15, e32. [Google Scholar] [CrossRef] [PubMed]
- Post, R.C.; Herrup, M.; Chang, S.; Leone, A. Getting plates in shape using Supertracker. J. Acad. Nutr. Diet. 2012, 112, 354–358. [Google Scholar] [CrossRef] [PubMed]
- Tsompanakis, S. Supertracker. J. Consum. Health Internet 2015, 19, 132–142. [Google Scholar] [CrossRef]
- Thompson, F.E.; Subar, A.F.; Loria, C.M.; Reedy, J.L.; Baranowski, T. Need for technological innovation in dietary assessment. J. Am. Diet. Assoc. 2010, 110, 48–51. [Google Scholar] [CrossRef] [PubMed]
- Forster, H.; Walsh, M.C.; Gibney, M.J.; Brennan, L.; Gibney, E.R. Personalised nutrition: The role of new dietary assessment methods. Proc. Nutr. Soc. 2016, 75, 96–105. [Google Scholar] [CrossRef] [PubMed]
- Afshin, A.; Babalola, D.; McLean, M.; Yu, Z.; Ma, W.; Chen, C.Y.; Arabi, M.; Mozaffarian, D. Information technology and lifestyle: A systematic evaluation of internet and mobile interventions for improving diet, physical activity, obesity, tobacco, and alcohol use. J. Am. Heart Assoc. 2016, 5, e003058. [Google Scholar] [CrossRef]
- Franco, R.Z.; Fallaize, R.; Lovegrove, J.A.; Hwang, F. Popular nutrition-related mobile apps: A feature assessment. JMIR mHealth uHealth 2016, 4, e85. [Google Scholar] [CrossRef]
- Maringer, M.; Van’t Veer, P.; Klepacz, N.; Verain, M.C.D.; Normann, A.; Ekman, S.; Timotijevic, L.; Raats, M.M.; Geelen, A. User-documented food consumption data from publicly available apps: An analysis of opportunities and challenges for nutrition research. Nutr. J. 2018, 17, 59. [Google Scholar] [CrossRef]
- Timon, C.M.; van den Barg, R.; Blain, R.J.; Kehoe, L.; Evans, K.; Walton, J.; Flynn, A.; Gibney, E.R. A review of the design and validation of Web- and computer-based 24-h dietary recall tools. Nutr. Res. Rev. 2016, 29, 268–280. [Google Scholar] [CrossRef]
- Subar, A.F.; Freedman, L.S.; Tooze, J.A.; Kirkpatrick, S.I.; Boushey, C.; Neuhouser, M.L.; Thompson, F.E.; Potischman, N.; Guenther, P.M.; Tarasuk, V.; et al. Addressing current criticism regarding the value of self-report dietary data. J. Nutr. 2015, 145, 2639–2645. [Google Scholar] [CrossRef] [PubMed]
- Wark, P.A.; Hardie, L.J.; Frost, G.S.; Alwan, N.A.; Carter, M.; Elliott, P.; Ford, H.E.; Hancock, N.; Morris, M.A.; Mulla, U.Z.; et al. Validity of an online 24-h recall tool (Myfood24) for dietary assessment in population studies: Comparison with biomarkers and standard interviews. BMC Med. 2018, 16, 136. [Google Scholar] [CrossRef] [PubMed]
- Archundia Herrera, M.C.; Chan, C.B. Narrative review of new methods for assessing food and energy intake. Nutrients 2018, 10, 1064. [Google Scholar] [CrossRef] [PubMed]


| Device Name | Country | Main Purpose of the Tool | Target Audience | Main Platform for Tool | Method of Data Collection and Entry | Food Composition Source | Approximate Number of Items | Time to Complete | References |
|---|---|---|---|---|---|---|---|---|---|
| Tools for Use in Research or Surveillance (n = 33) | |||||||||
| ASA24 Automated Self-Administered 24 h Recall | USA, Canada, Australia | Dietary intake | Adults and children from 10 years | Web-based | 24-h recall based on automated multiple-pass method (AMPM) | USDA’s FNDDS 4, Canadian Food Composition and Australian food tables | 10,000 | Average of 24 min; most within 17–34 min | Baranowski et al. 2012 and 2014; Kirkpatrick et al. 2014; Thompson et al. 2015 [17,18,19,20] |
| CHAT Connecting Health and Technology; mobile food record | Australia | Food groups consumed | Adults and adolescents | Smartphone App | Food record based on images; dietitian identifies foods and food groups | Australia Guide to Healthy Eating, but not integrated into tool | 2670 | Not specified | Kerr et al. 2012 and 2016; Pollard et al. 2016 [21,22,23] |
| Compl-Eat | Netherlands | Dietary intake | Adults and adolescents from 16 years | Web-based | Interviewer-assisted or self-administered 24-h recall based on | Dutch Food Composition Database | 2000 | Close to 30 min | Meijboom et al. 2017 [24] |
| DAP Diet Assess and Plan | Serbia, Balkan region | Diet and physical activity | All ages | Web-based, PC | 24-h recalls, food frequency questionnaires (FFQ), food propensity; dietitian enters data | Serbian and Balkan regional food composition databases | 1450 Serbian and 1600 Balkan foods and recipes 9 | 15–30 min | Gurinovic et al. 2016 and 2018; Zekovic et al. 2017 [25,26,27] |
| DES Diet Evaluation System | Korea | Dietary intake | All ages | Web-based | Interviewer-assisted 24-h recall | Korean food composition tables | 8100 | Average of 14 min | Jung et al. 2014 [28] |
| eButton | USA | Dietary intake, activity | All ages | Wearable | Imaging system with automated portion estimates; dietitian enters data | USDA’s FNDDS, but not integrated into tool | 8500 | Not specified | Sun et al. 2010 and 2014; Jia et al. 2014 [29,30,31] |
| e-CA Electronic Carnet Alimentaire | Switzerland | Dietary intake | Adults | Web-based | Electronic food record; dietitian enters for coding | Prodi 6.3 software, but not integrated into the tool | 900 | Average of 19 min | Bucher Della Torre et al. 2017 [32] |
| eDIA Electronic Dietary Intake Assessment | Australia | Dietary intake | 19–24 years old | Smartphone app | Food record | AUSNUT 5 2007 | 4500 | Not specified | Rangan et al. 2015 and 2016 [33,34] |
| EPIC-Soft 1 | European Union (EU) | Dietary intake | All ages | PC with Web-based management platform | Interviewer-assisted 24-h recall or dietitian enters data from food records | EPIC 6 software from all EU countries | 10,000 | Not specified | de Boer et al. 2011; Huybrechts et al. 2011; Freisling et al. 2014; Park et al. 2017 [35,36,37,38] |
| Food4Me | EU—7 European counties | Dietary Intake | Adults | Web-based | FFQ | WISP 7 software; based on McCance and Widdowson | 157 items grouped into 11 categories | Not specified | Fallaize et al., 2014; Forster et al., 2014; Celis-Morales et al. 2016 [39,40,41] |
| FoodBook24 | Ireland | Dietary intake | Adults | Web-based | Food record, FFQ, food choice | Irish National Adult Nutrition Survey food composition database | 751 | Average of 15 min 10 | Timon et al. 2017a and 2017b [42,43] |
| FoodNow | Australian | Diet and physical activity | Young adults | Smartphone; wearable armband for energy expenditure | Food record based on images, text or voice; dietitian enters data | 2011–2013 Australian Food and Nutrient Database | 5740 | Not specified | Pendergast et al. 2017 [44] |
| GraFFS Graphical Food Frequency System | US | Dietary intake | Adults | Web-based | FFQ | NDSR and USDA’s FNDDS | 156 | Not specified | Kristal et al. 2014 [45] |
| INTAKE24 Self-Completed Recall and Analysis of Nutrition 2 | UK | Dietary Intake | Adults and children from 11 years | Web-based | 24-h recall based on AMPM | McCance and Widdowson | 2800 | Average of 13 min with flat interface | Foster et al. 2014; Bradley et al. 2016; Simpson et al. 2017 [46,47,48] |
| Microsoft SenseCam | Ireland, UK, Australia, others | Dietary intake, activity | Tested in athletes and different adult groups | Wearable | Imaging system to enhance 24-h recall interviews | WinDiets, but not integrated into tool | WinDiets has food databases from many countries | Not specified | O’Loughlin et al. 2013; Gemming et al. 2013 and 2015 [49,50,51] |
| myfood24 | UK | Dietary Intake | Young Adults, Adults, Elderly | Web-based | 24-h recall based on AMPM or food record | UK food composition database (branded and generic foods) | 45,000 | Average of 19 min (+/−7 min) | Carter et al. 2015; Albar et al. 2016 [52,53] |
| NINA-DISH New Interactive Nutrition Assistant | India: specifically New Delhi, Mumbai and Trivandrum | Dietary intake | Adults (35–69) | PC | Interviewer-assisted 24-h recalls, diet history, mealtime and food-preparer questionnaire | Indian FCT 8 augmented with data from UK, FNDDS, Singapore and Malaysia | 1000 | Not specified | Daniel et al. 2014 [54] |
| NANA Novel Assessment of Nutrition and Ageing | UK and USA | Dietary intake, activity, cognitive function | Elderly | Touch-screen computer with audio-recording | Food record based on images and voice; dietitian enters data | Windiets, but not integrated into tool | 1200 | Not specified | Astell et al. 2014; Timon et al. 2015 [55,56] |
| NuDAM Nutricam Dietary Assessment Method | Australia | Dietary intake | Adults | Smartphone/camera | Food record based on images and voice notes; dietitian enters data | FoodWorks 5.1, but not integrated into tool | 13,000 | Not specified | Rollo et al. 2011 and 2015 [57,58] |
| NutriNet Santé | France | Diet and physical activity | Adults | Web-based | 24-h recall or food record based on AMPM | French food composition table | 2600 | Average of 31 ± 29 min; Median 25 min | Touvier et al. 2011 [59] |
| Oxford WebQ | UK | Diet and physical activity | Adults | Web-based, PC | 24-h dietary checklist | McCance and Widdowson | 200 items in 21 food groups | Average of 14 min; Median 12.5 min | Liu et al. 2011; Galante et al. 2016 [60,61] |
| R24W Self-Administered Web-based recall | French Canadian | Dietary intake | Adults and adolescents from 16 years | Web-based | 24-h recalls based on AMPM | Canadian Nutrient file 2010 and Foods Commonly Consumed in Canada | 4000 | 27.6% reported < 20 min, 31% 20–30 min, 24.1% 30–45 min, 7% 45–60 min | Jacques et al. 2016; Lafrenière et al. 2017 [62,63] |
| RFPM Remote Food Photography Method | USA | Dietary intake | All ages | Smartphone/camera/bar-code reader | Remote imaging system; semi-automated food identification | USDA’s FNDDS, but not integrated into tool | 8500 | Not specified | Martin et al. 2012 and 2014; Nicklas et al. 2017 [64,65,66] |
| SNAP Synchronized Nutrition and Activity Program | UK | Diet and physical activity | Children | Web-based | Food records collected during eight time-points daily | UK food consumption database | 49 (40 foods, nine beverages) | <25 min | Moore et al. 2013 [67] |
| SNAPA Synchronized Nutrition and Activity Program for Adults | UK | Diet and physical activity | Adults | Web-based | Food records collected during 4 time periods each day | UK food consumption database | 120 (102 foods and 18 beverages) | Not specified | Hillier, et al. 2012 [68] |
| TADA Technology Assisted Dietary Assessment;mobile food record | USA | Dietary intake | Adults and children from 3 years | Smartphone App | Food record based on before and after images of foods and beverages; system calculates energy and nutrients | USDA’s Food and Nutrient Database for Dietary Studies (FNDDS) | 8500 | Not specified | Daugherty et al. 2012; Ahmad et al. 2016; Boushey et al. 2015 and 2017 [69,70,71,72] |
| TECH Tool for Energy Balance in Children | Sweden | Diet and physical activity | 2–5 years old | Smartphone App | Food record: Parents take images and provide short descriptions; dietitian enters data | Swedish Food Database, but this was not integrated into tool | Not reported | Not specified | Delisle et al. 2015; Henriksson et al. 2015; Delisle Nyström et al. 2016 [73,74,75] |
| VNP Virtual Nutri Plus | Brazil | Dietary intake | Patients undergoing gastric bypass surgery | PC | 24-h recall or food record; dietitian enters data | Brazilian Food Chemical Composition Table | 1711 | Not specified | da Silva et al. 2014a and 2014b [76,77] |
| WebCAAFE Food Intake and Physical Activity of School-children | Brazil | Diet and physical activity | Children 6–12 years | Web-based | 24-h recall | None; evaluates foods and beverages only | 32 items in each of 6 eating events per day | Not specified | Davies et al., 2015; Kupek et al. 2016 [78,79] |
| WebDASC Web-Based Dietary Assessment Software for Children | Denmark | Dietary Intake | Children | Web-based | 24-h recall | Danish National Survey of Diet and Physical Activity (DANSDA) | 1300 | Average of 15 min (after first day) | Biltoft-Jensen et al. 2012 and 2013; Andersen et al. 2015 [80,81,82] |
| Web-FFQ | Quebec, Canada | Dietary intake | Adults | Web-based | FFQ | Nutrition Data System for Research and the Canadian Nutrient File | 136 | 45 min | Labonte et al. 2012 [83] |
| WebFR Web-based Food Record | Norway | Dietary Intake | Children | Web-based | 24-h recall | Norwegian National Survey database (NORKOST) | 550 | Not specified | Medin et al. 2015, 2016, and 2017 [84,85,86] |
| Zambia Tablet-based 24h recall Tool | Zambia | Dietary intake | Children | Tablet | Interviewer-assisted 24-h recall | HarvestPlus and Zambia food comp tables | Not specified | Not specified | Caswell et al. 2015 [87] |
| Tools for Consumer Use (n = 10) | |||||||||
| Diabetics Diary, paired with Pebble smartwatch | Norway | Diabetes management Diet and physical activity | Adults | Android Smartphone plus Smart watch | Carbohydrate food log | None | Not reported | Not specified | Arsand et al. 2015 [88] |
| DietCam | USA | Dietary intake | All ages for obesity prevention | Smartphone App | Food record from images; system calculates energy | USDA National Nutrient Database for Standard Reference | 8500 | Not specified | Kong and Tan, 2011 and 2012; Kong thesis, 2012; Kong et al. 2015 [16,89,90,91] |
| DIMA Dietary Intake Monitoring Application | USA | Medical management and diet | Hemodialysis patients | PDA | Food record with touch, voice, bar-code scanner | Database was created from existing nutrient database and UPC codes | Not specified | Not specified | Connelly et al. 2012; Welch et al. 2013 [92,93] |
| EVIDENT II app | Spain | Adherence to a Med Diet and log for step counter | Adults | Smartphone App | FFQ and Med Diet checklist | Spanish FFQ | 137s | Not specified | Recio-Rodriguez et al. 2014 and 2016 [94,95] |
| FoodLog for dietary data collection as part of DialBetics program | Japan, Korea | Diabetes management and diet, physical activity | Adults | Smartphone App | Food record from images, text; system calculates energy, macro-nutrients | National food database: Dietary Reference Intakes, Japan (2010) | 2191 | Average of 35 min | Aizawa K. et al. 2014; Waki et al. 2012 and 2015 [96,97,98] |
| GoCARB | EU | Diabetes management and diet | Adults | Smartphone App | Food record based on meal images for carbohydrate intake estimates | USDA Nutrient Database for Standard Reference | 5000 | ~1 min per image | Rhyner et al. 2016; Bally et al. 2017 [99,100] |
| IDQC Internet Based Diet and Lifestyle Questionnaire | China | Diet and physical activity | Adults and adolescents | Web-based | FFQ | Food Nutrition Calculator (Beijing) | 135 | 30–40 min | Du et al. 2015 [101] |
| My Meal Mate (MMM) | UK | Diet, activity and body weight | Adults—Weight loss or maintenance | Smartphone App | Food record | UK Composition of Foods | 40,000 | Average of 22 min | Carter et al. 2013a, 2013b, 2013c [102,103,104] |
| Snap-n-Eat mobile application | USA | Dietary intake | Adults | Smartphone App | Food record from images; system calculates energy and nutrients | not reported | not reported | Not specified | Zhang et al. 2015 [15] |
| SuperTracker 3 | USA | Diet and physical activity | All ages | Web-based | Food records, diet recall | USDA’s FNDDS | 8500 | Not specified | Post et al. 2012; Tsompanakis, 2015 [105,106] |
© 2018 by the authors. Licensee MDPI, Basel, Switzerland. This article is an open access article distributed under the terms and conditions of the Creative Commons Attribution (CC BY) license (http://creativecommons.org/licenses/by/4.0/).
Share and Cite
Eldridge, A.L.; Piernas, C.; Illner, A.-K.; Gibney, M.J.; Gurinović, M.A.; De Vries, J.H.M.; Cade, J.E. Evaluation of New Technology-Based Tools for Dietary Intake Assessment—An ILSI Europe Dietary Intake and Exposure Task Force Evaluation. Nutrients 2019, 11, 55. https://doi.org/10.3390/nu11010055
Eldridge AL, Piernas C, Illner A-K, Gibney MJ, Gurinović MA, De Vries JHM, Cade JE. Evaluation of New Technology-Based Tools for Dietary Intake Assessment—An ILSI Europe Dietary Intake and Exposure Task Force Evaluation. Nutrients. 2019; 11(1):55. https://doi.org/10.3390/nu11010055
Chicago/Turabian StyleEldridge, Alison L., Carmen Piernas, Anne-Kathrin Illner, Michael J. Gibney, Mirjana A. Gurinović, Jeanne H.M. De Vries, and Janet E. Cade. 2019. "Evaluation of New Technology-Based Tools for Dietary Intake Assessment—An ILSI Europe Dietary Intake and Exposure Task Force Evaluation" Nutrients 11, no. 1: 55. https://doi.org/10.3390/nu11010055
APA StyleEldridge, A. L., Piernas, C., Illner, A.-K., Gibney, M. J., Gurinović, M. A., De Vries, J. H. M., & Cade, J. E. (2019). Evaluation of New Technology-Based Tools for Dietary Intake Assessment—An ILSI Europe Dietary Intake and Exposure Task Force Evaluation. Nutrients, 11(1), 55. https://doi.org/10.3390/nu11010055