Article

A Randomized Controlled Trial to Compare the Effect of Peanuts and Almonds on the Cardio-Metabolic and Inflammatory Parameters in Patients with Type 2 Diabetes Mellitus

1
School of Nursing, Medical College, Soochow University, Suzhou 215006, China
2
Faculty of Education and Health, University of Greenwich, London SE9 2UG, UK
3
Medical College, Soochow University, Suzhou 215006, China
*
Author to whom correspondence should be addressed.
Yun-Ying Hou and Omorogieva Ojo are co-first authors.
Nutrients 2018, 10(11), 1565; https://doi.org/10.3390/nu10111565
Submission received: 24 August 2018 / Revised: 16 October 2018 / Accepted: 18 October 2018 / Published: 23 October 2018
(This article belongs to the Special Issue Dietary Intake and Type 2 Diabetes)

Abstract

:
A low carbohydrate diet (LCD), with some staple food being replaced with nuts, has been shown to reduce weight, improve blood glucose, and regulate blood lipid in patients with type 2 diabetes mellitus (T2DM). These nuts include tree nuts and ground nuts. Tree nut consumption is associated with improved cardio-vascular and inflammatory parameters. However, the consumption of tree nuts is difficult to promote in patients with diabetes because of their high cost. As the main ground nut, peanuts contain a large number of beneficial nutrients, are widely planted, and are affordable for most patients. However, whether peanuts and tree nuts in combination with LCD have similar benefits in patients with T2DM remains unknown; although almonds are the most consumed and studied tree nut. This study sought to compare the effect of peanuts and almonds, incorporated into a LCD, on cardio-metabolic and inflammatory measures in patients with T2DM. Of the 32 T2DM patients that were recruited, 17 were randomly allocated to the Peanut group (n = 17) and 15 to the Almond group (n = 15) in a parallel design. The patients consumed a LCD with part of the starchy staple food being replaced with peanuts (Peanut group) or almonds (Almond group). The follow-up duration was three months. The indicators for glycemic control, other cardio-metabolic, and inflammatory parameters were collected and compared between the two groups. Twenty-five patients completed the study. There were no significant differences in the self-reported dietary compliance between the two groups. Compared with the baseline, the fasting blood glucose (FBG) and postprandial 2-h blood glucose (PPG) decreased in both the Peanut and Almond groups (p < 0.05). After the intervention, no statistically significant differences were found between the Peanut group and the Almond group with respect to the FBG and PPG levels. A decrease in the glycated hemoglobin A1c (HbA1c) level from the baseline in the Almond group was found (p < 0.05). However, no significant difference was found between the two groups with respect to the HbA1c level at the third month. The peanut and almond consumption did not increase the body mass index (BMI) and had no effect on the blood lipid profile or interleukin-6 (IL-6).In conclusion, incorporated into a LCD, almonds and peanuts have a similar effect on improving fasting and postprandial blood glucose among patients with T2DM. However, more studies are required to fully establish the effect of almond on the improvement of HbA1c.

1. Introduction

Type 2 diabetes mellitus (T2DM) is a chronic disease that involves a heterogeneous group of disorders of the intermediary metabolism, characterized by glucose intolerance [1]. The incidence and prevalence of T2DM have increased markedly worldwide, and its complications are the leading causes of morbidity and premature mortality [2]. The use of diet in the prevention, treatment, and control of T2DM has been recommended, and is one of the strategies for managing the condition. According to the American Diabetes Association (ADA), the nutritional goals for patients with T2DM are to achieve normoglycemia and a cardio protective lipid profile that reduces the risk for cardiovascular disease (CVD) [3].
In recent years, a low carbohydrate diet (LCD) has gained popularity [4],and its effectiveness in reducing weight, improving blood glucose, and regulating blood lipid in patients with T2DM has been confirmed by the American Diabetes Association and Diabetes UK [5,6]. ALCD combined with a low saturated fat intake may be best for patients [7].
Nuts are high in unsaturated fat and are a rich source of bioactive nutrients that have the potential to provide metabolic and cardiovascular benefits [8]. Bodies concerned with diabetes and CVD (e.g., the Canadian Cardiovascular Society and the European Atherosclerosis Society) are now advocating for an increase in nut consumption as part of their dietary recommendations [9,10,11,12].
Nuts include tree nuts (almond, walnut, hazelnut, pistachio, pine nut, cashew, pecan, macadamia, and Brazil nut) and ground nuts (mainly peanut). Almonds are the most studied tree nut. Clinical trials have shown that the consumption of almonds as well as other tree nuts is associated with improved glycemic control, insulin sensitivity, decreased inflammation, and reduced/sustained body weight [13,14,15,16]. However, tree nuts are difficult to promote in patients with diabetes because of their high cost, especially in developing and under-developed countries.
As the main ground nut, peanuts have a similar nutrient composition to tree nuts, thus being nutrient-dense and rich in monounsaturated fatty acid (MUFA) (40% of energy).They are also a good source of arginine, fiber, phytosterols, polyphenols, niacin, folic acid, and vitamin E [17]. In addition, peanuts are widely planted and are much cheaper than tree nuts, and they are affordable for most T2DM patients. Randomized controlled and cross-over trials have shown that peanut consumption helps to moderate glucose concentrations [18], improve the postprandial lipid response, and preserve endothelial function [19]. However, whether peanuts and tree nuts have similar benefits forT2DM patients remains unknown.
Almonds are the most consumed tree nut [20]. We aim to compare the effect of peanuts and almonds incorporated into LCD on cardio-metabolic and inflammatory measures in T2DM patients.

2. Materials and Methods

2.1. Subjects

The participants were recruited from a diabetes club and from the Endocrine Division of the First Affiliated Hospital of Soochow University. The inclusion criteria were as follows: The patients were diagnosed with T2DM, had glycated hemoglobin A1c (HbA1c) of less than 10%, had no change in oral antidiabetic drugs or in insulin half a month before the intervention, were between 40 to 80 years old [15,21], were able to communicate, had volunteered to participate in this study, and were willing to provide informed consent. Those that were excluded were the patients who ate nuts regularly (≥four per day/week) [22]; were allergic to nuts or other food; had difficulty in chewing nuts as a result of fewer teeth or for other reasons; could not adhere to a LCD strategy; received other dietary interventions; had severe conditions including indigestion, hepatic failure, renal failure, severe gallbladder and pancreatic diseases, stroke, malignant tumors, or unstable cardiovascular diseases (such as myocardial infarction, ketosis, or hyperthyroidism); those who were taking glucocorticoid; and those whose fasting blood glucose (FBG) was more than 16.7 mmol/L [23] during the intervention.

2.2. Study Design

This study is a prospective, randomized controlled trial (RCT) that was performed between December 2015 and April 2016. The recruited patients were randomly allocated to the Peanut and Almond groups using a table of random numbers. The random numbers were generated by one researcher, and were concealed to the researcher who was responsible for the allocation, and the participants were blinded prior to assignment. Before the intervention, all of the subjects underwent a one-week washout period [23] to diminish the effect of background diets on the study. This study followed the Declaration of Helsinki and the Guidelines for Good Clinical Practice, and was approved by the ethics committee of the First Affiliated Hospital of Soochow University (no. 2015106). All of the enrolled participants signed a consent form.

2.3. Sample Size Calculation

Evidence from the literature showed that the mean difference of the changes in the HbA1c levels were 1.6% between the Peanut group and the Almond group [21,24]. Therefore, we calculated 13 participants for each group, with α = 0.05 and power = 0.80. In light of the sample loss of 10%, the number for each group was calculated to be 16. Finally, we recruited 15 participants for the Peanut group and 17 participants for the Almond group in this study.

2.4. Intervention

We incorporated peanuts or almonds into a low-carbohydrate diet (LCD), which is a dietary strategy that refers to a carbohydrate intake of between 30–200 g/day or calories from carbohydrates/total calories <45%, being supplemented instead with fat or protein [24]. Our team developed a LCD education handbook [24] for patients with T2DM based on evidence from the literature, guidelines regarding T2DM dietary management, consultation with diabetes experts and nutritionists, and reviews by patients. The researcher and patients reviewed the LCD handbook, and the researcher trained the patients to restrict their intake of starchy staple food (such as potatoes and broad beans) to 50 g/meal per day during the one-on-one education session. The reduced staple food/meal was substituted by consuming 60 g/day peanuts for men and 50 g/day for women in the Peanut group [25], and 55 g/day almonds for men and 45 g/day for women in the Almond group [25,26]. The peanuts and almonds (without salt and with the skin intact, and free of charge) were prepared in vacuum packing, according to a daily amount. The patients were instructed to consume nuts between meals or with breakfast, or when hungry. For those whose fasting plasma glucose were higher than normal (>6.1 mmol/L), the nuts were required to be consumed before 10:00 a.m. in the morning [27]. The patients were instructed to consume 50% of the nuts before bedtime if there was a risk of a nocturnal hypoglycemic event. The intervention duration was three months for the two groups.
The follow-ups were conducted once a week in the first month of the intervention, and once every two weeks in the second and third months. The duration of each follow-up session was about 10 min. The patients’ compliance to the dietary plan was reviewed and those with a poor compliance were supported in order to adhere to the plan. The data relating to modification of hypoglycemic agents and the occurrence of hypoglycemia were also collected. Those whose diets did not meet the requirements of the dietary program in the intervention period were excluded from the study.

2.5. Diet Record

The patients maintained a diet record, including details of the diet of any day over the weekend and two working days, as well as the time of nut consumption. The types and quantities of the food consumed were assessed to determine the patients’ adherence to a LCD strategy. Among the patients who met the dietary requirements for a LCD, the number of bags of nuts consumed per week was assessed to determine the patients’ dietary adherence.

2.6. Cardio-Metabolic and Anthropometric Parameters

The cardio-metabolic and anthropometric parameters included the FBG, postprandial 2-h blood glucose (PPG) levels, HbA1c, total cholesterol, low density lipoprotein cholesterol (LDL-C), high density lipoprotein cholesterol (HDL-C), triglycerides, and body mass index (BMI). The HbA1c, blood lipids, and BMI were measured at the baseline and at the end of the third month. Venous blood samples were collected at the School of Nursing of Soochow University after a 12 h overnight fast. The HbA1c was measured by high-performance liquid chromatography using Afinion AS100 Analyzer (Alere, Inc., Shanghai, China), and the total cholesterol, LDL-C, HDL-C, and triglycerides were measured using the spectrophotometry method in the molecular laboratory of the School of Nursing of Soochow University. The height and weight were measured using a calibrated stadiometer, and the patients were weighed wearing light clothing and without shoes. The BMI was calculated as the weight (in kilograms) divided by the square of the height (in meters). The FBG and PPG levels were measured by collecting the peripheral blood from the fingers using a rapid glycemic apparatus by patients once a week at home. The glycemic meters were checked by the research staff and the patients were educated to measure the FBG and PPG correctly so as to reduce the subject bias.

2.7. Hypoglycemic Episodes and Antidiabetic Medication Modification

Hypoglycemic episodes in this study were determined by the patients’ self-reported hypoglycemic symptoms, with or without a measured plasma glucose concentration of ≤70 mg/dL (≤3.9 mmol/L), according to the definition of hypoglycemia in diabetes, given by the American Diabetes Association [28]. To assess the modification of the hypoglycemic agents, the use and changes of the doses of oral antidiabetic drugs and insulin were recorded at the baseline and in the third month.

2.8. Interleukin-6

Interleukin-6 (IL-6) was measured to assess the impact of peanuts and almonds on inflammation. The fasting venous blood was collected and the serum was separated in the molecular laboratory of the School of Nursing of Soochow University. Human IL-6 ELISA kit (R&D SystemsTM, Emeryville, CA, USA) was used to determine the IL-6 levels in the Hematology Center of the Cyrus Tang Medical Institute at Soochow University.

2.9. Ratio of Urinary Albumin/Creatinine

In order to determine the safety of peanuts and almonds in patients with diabetes, a mid-stream specimen of random urine was collected, and the ratio of urinary albumin/creatinine (ACR) was measured using a dry immune marker scattering quantitative method [29].

2.10. Statistical Analysis

A statistical analysis was performed using SPSS 18.0 software (SPSS, Inc., Dhicago, IL, USA). For continuous variables, the results were presented as mean ± standard deviation (SD). Comparisons were performed using a t-test for the independent samples for general baseline demographic, and clinical characteristics, and one-way analysis of variance (ANOVA) for the outcomes of interest. To eliminate the problem of imbalance in the baseline characteristics, the comparisons of anthropometric and metabolic variables between the groups after the intervention were performed using a covariance analysis with the baseline measurements adjusted. The trends in the dietary adherence, FBG, and PPG in the two groups, which were assessed once a week during the intervention, were analyzed using repeated ANOVA, and have been presented as a fold line diagram. The intention-to-treat (ITT) of HbA1c was performed so as to ensure the reliability of the research results. For the categorical variables, the results were presented as numbers and percentages, and comparisons between the groups were performed using the Chi-squared test or the Fisher’s exact test. A p value of <0.05 was considered statistically significant.

3. Results

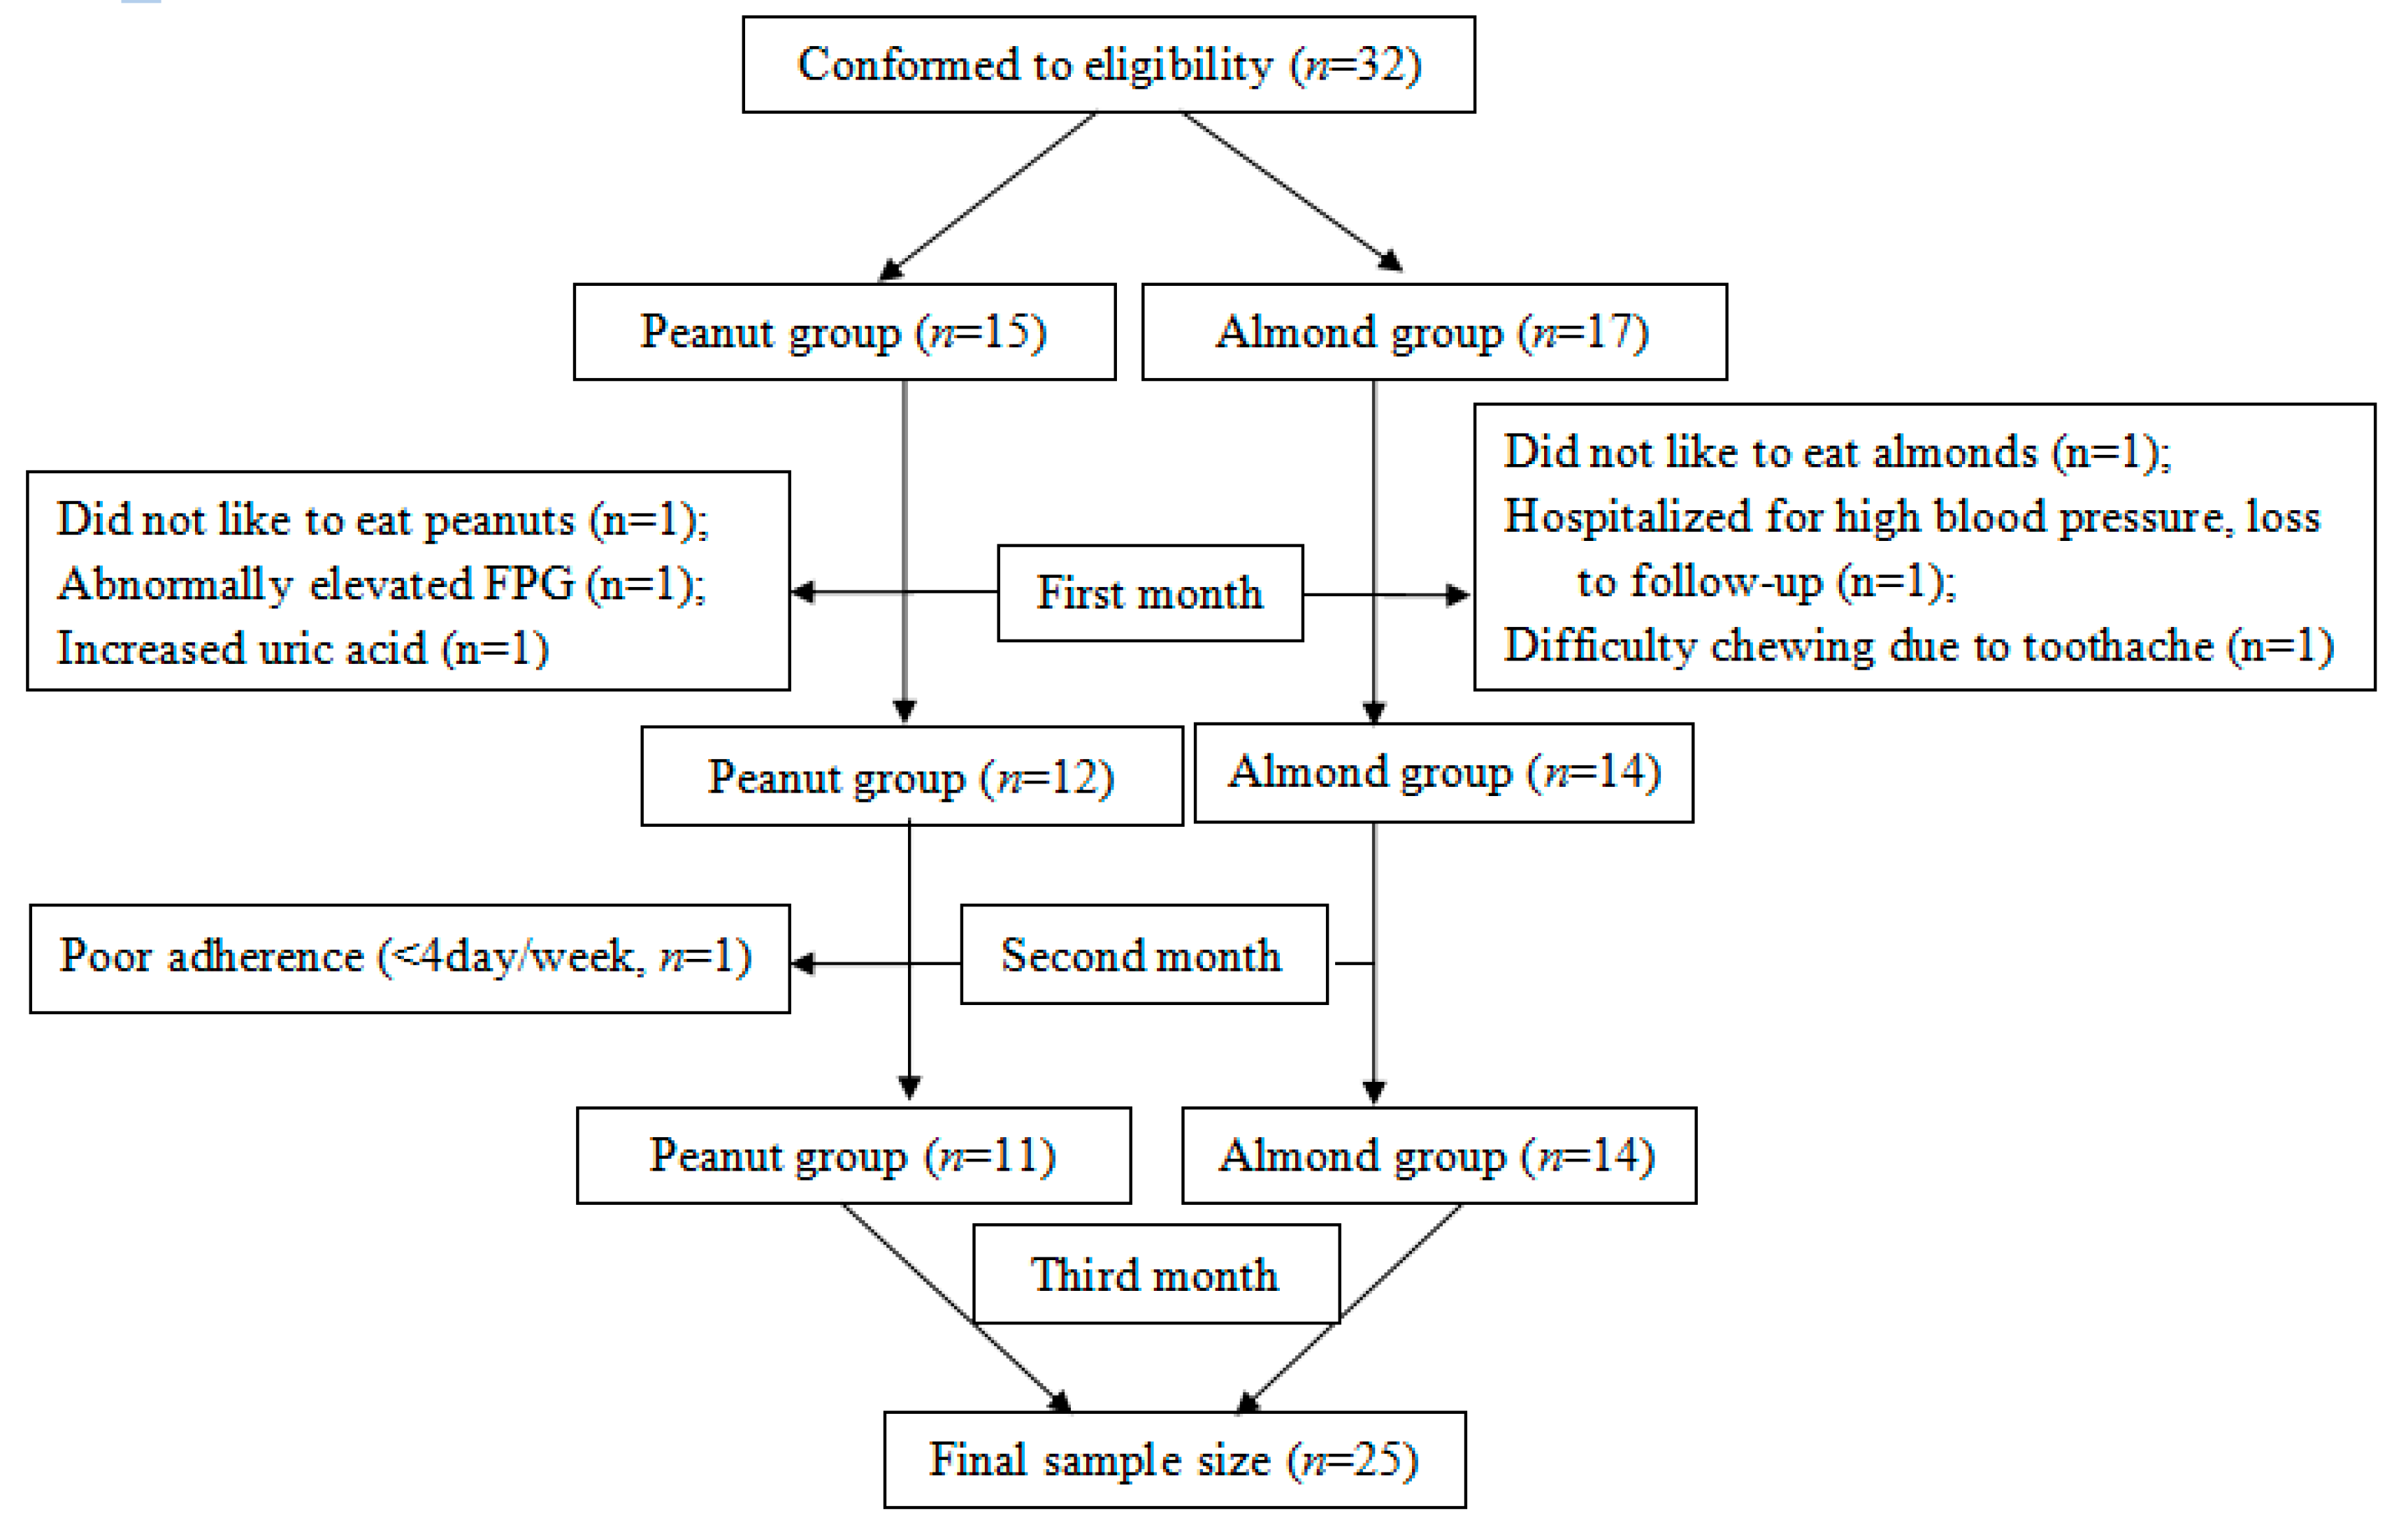
3.1. Study Participants

On the basis of inclusion and exclusion criteria, 32 T2DM participants were recruited and randomly allocated to the Peanut group (n = 15) and the Almond group (n = 17). Four participants in the Peanut group and three participants in the Almond group withdrew from the study. In the Peanut group, one participant did not like peanuts, one showed abnormally elevated FPG after the first week, one’s uric acid increased during the second week (with a history of increased uric acid), and one showed a poor adherence (<four per day/week). In the Almond group, one did not like almonds, one was lost to follow-up, and one could not adhere to the diet program because of toothache. Finally, the data of 11 patients in the Peanut group and 14 in the Almond group were analyzed (Figure 1). The mean age of the participants was 69.60 ± 7.25 years, and 15 (60.0%) were men. The general characteristics of the enrolled participants in each group are shown in Table 1. There were no statistically significant differences in any of the parameters between the two groups (p > 0.05, Table 1). The time of exercise per week in the two groups did not change significantly from the baseline, and there was no statistically significant difference found at the third month.

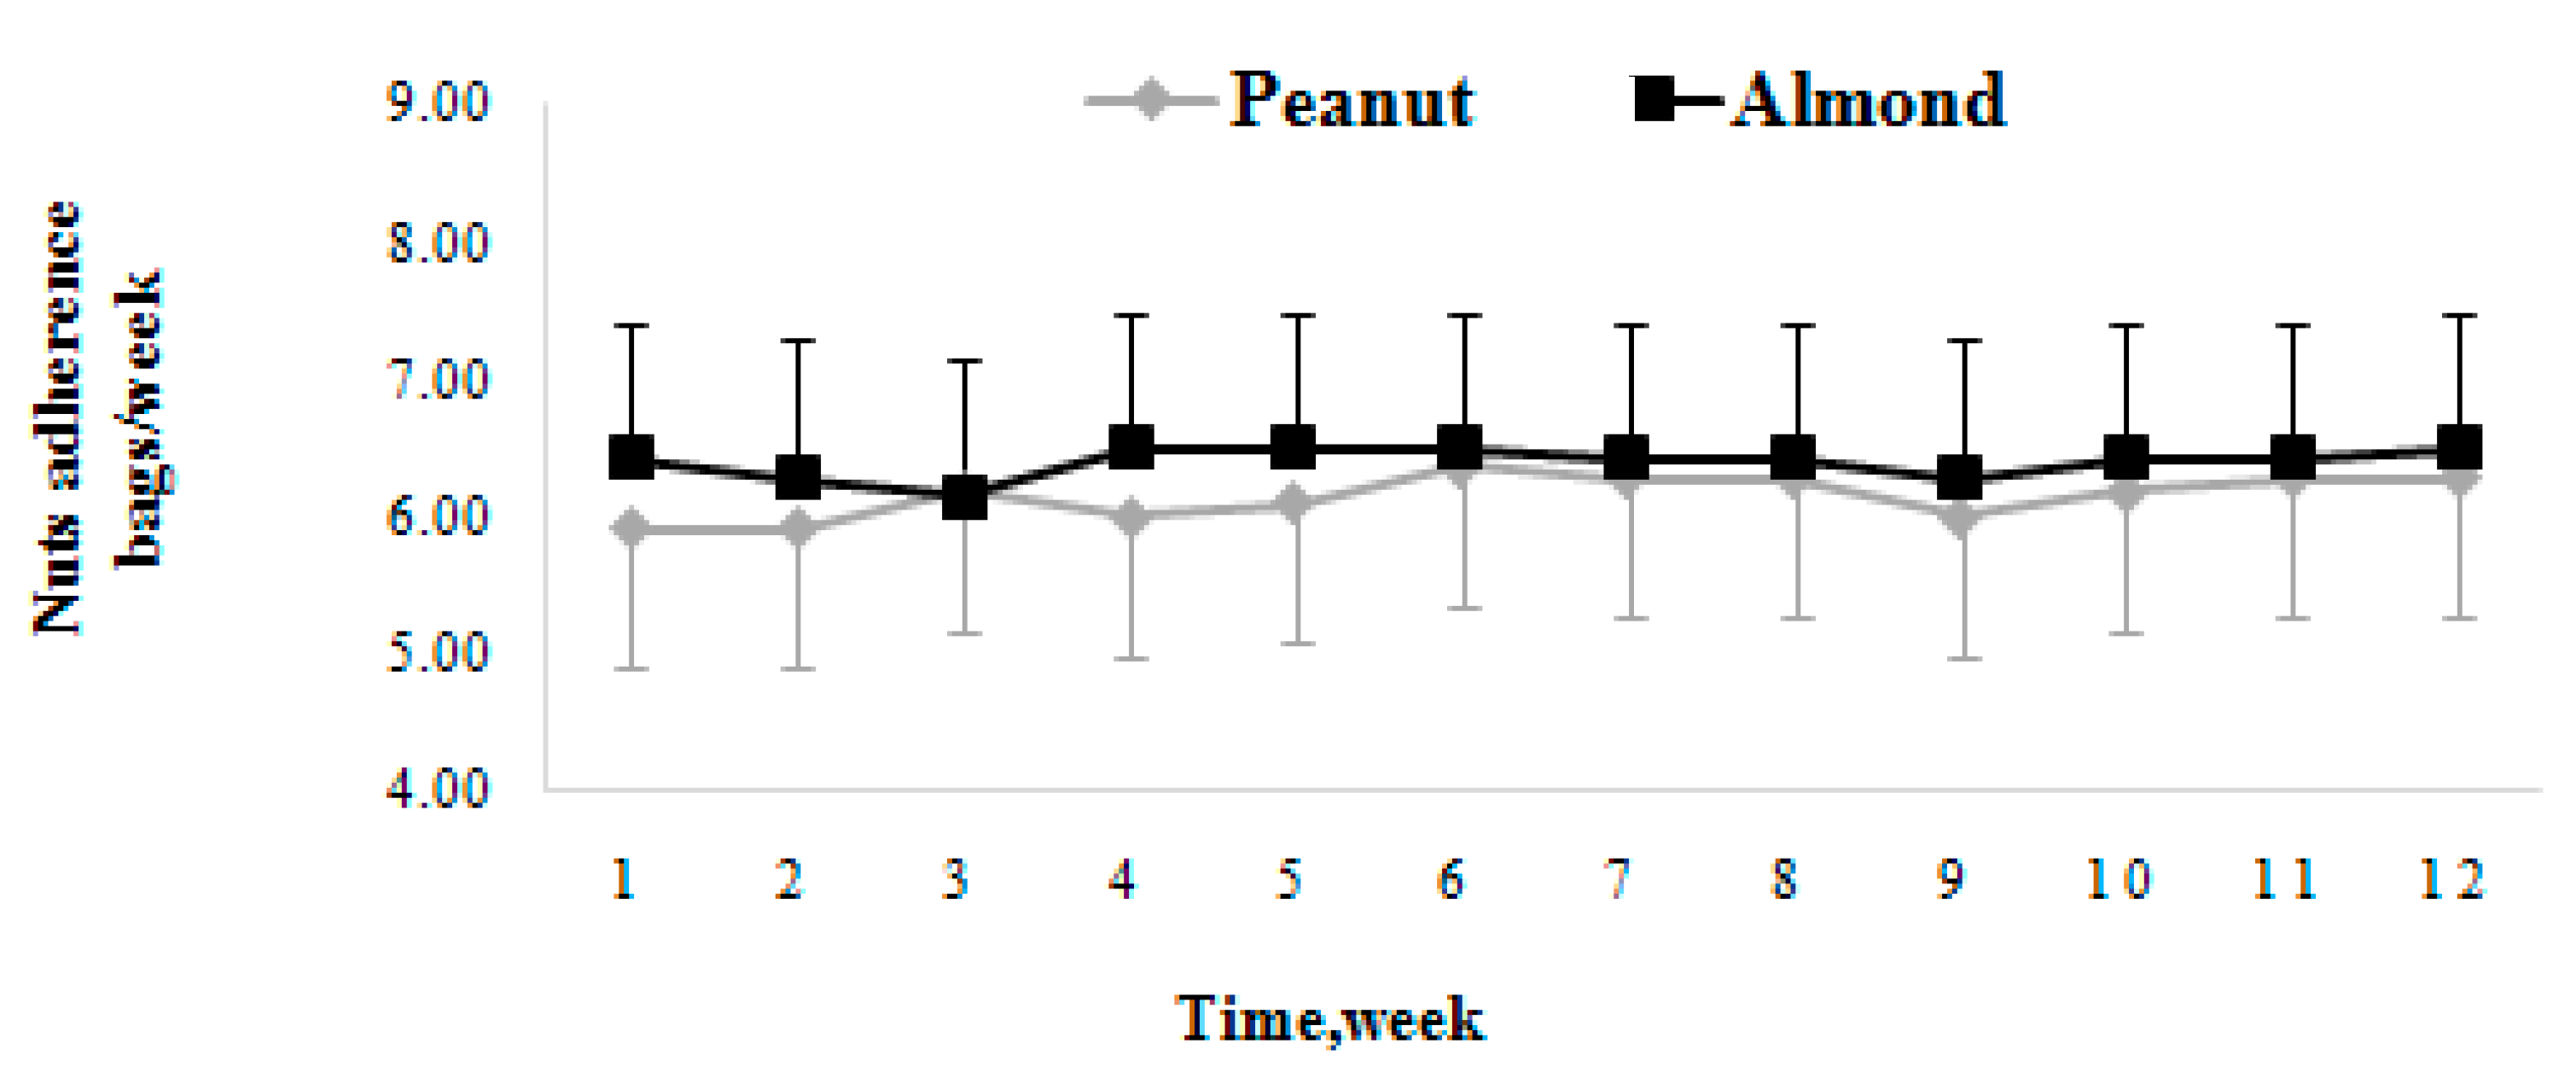
3.2. Dietary Adherence

The dietary adherence was assessed through the bags of nuts consumed by the participants per week. A fold line diagram was performed to compare the dietary compliance between the two groups (Peanut versus Almond). The results showed that there were no significant differences in the self-reported dietary compliance per week between the two groups (p > 0.05, Figure 2).

3.3. Effect of Peanuts and Almonds on Glycemic Control

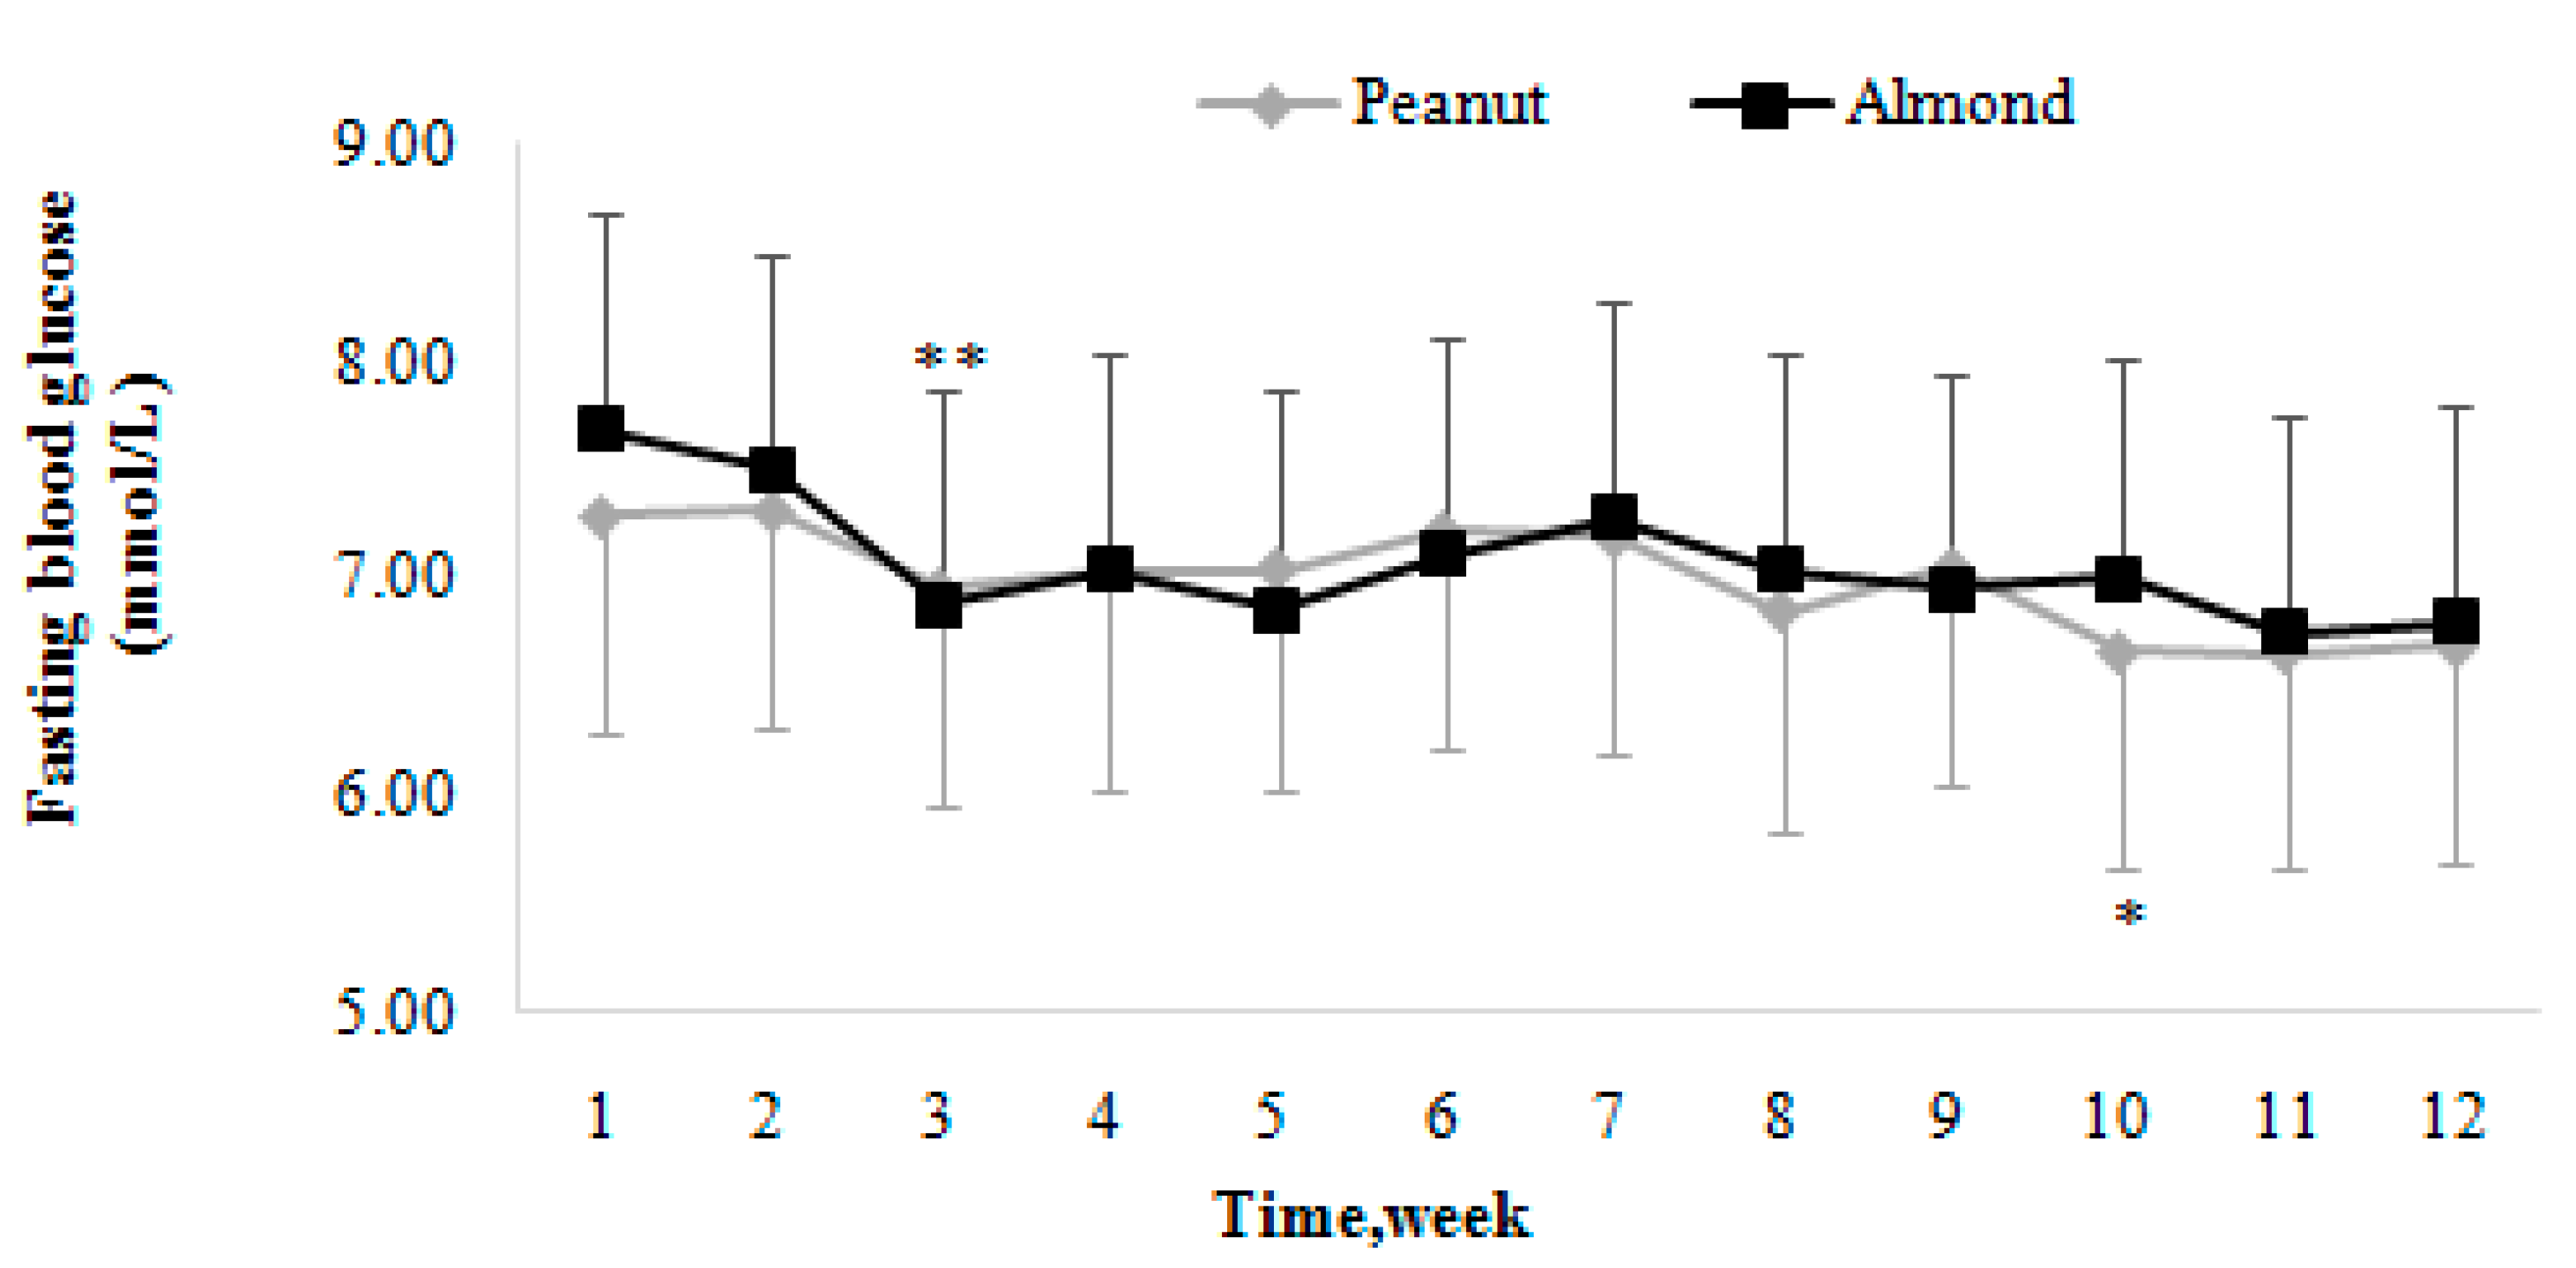
3.3.1. Fasting Blood Glucose

Changing Trends of Fasting Blood Glucose

The changing trends of FBG in the two groups during the intervention are described by the fold line diagram (Figure 3). The results show that, for the Peanut group, the levels of FBG were stable with a slight decline, down to the tenth week to the lowest level. For the Almond group, the levels of FBG decreased significantly for the first three weeks, and then fluctuated around the level of the third month.

Comparison of Fasting Blood Glucose Levels

Compared to the baseline, the FBG levels of the two groups decreased significantly (p < 0.05). However, the differences between the two groups, with respect to FBG, were not statistically significant (p > 0.05) (Table 2).

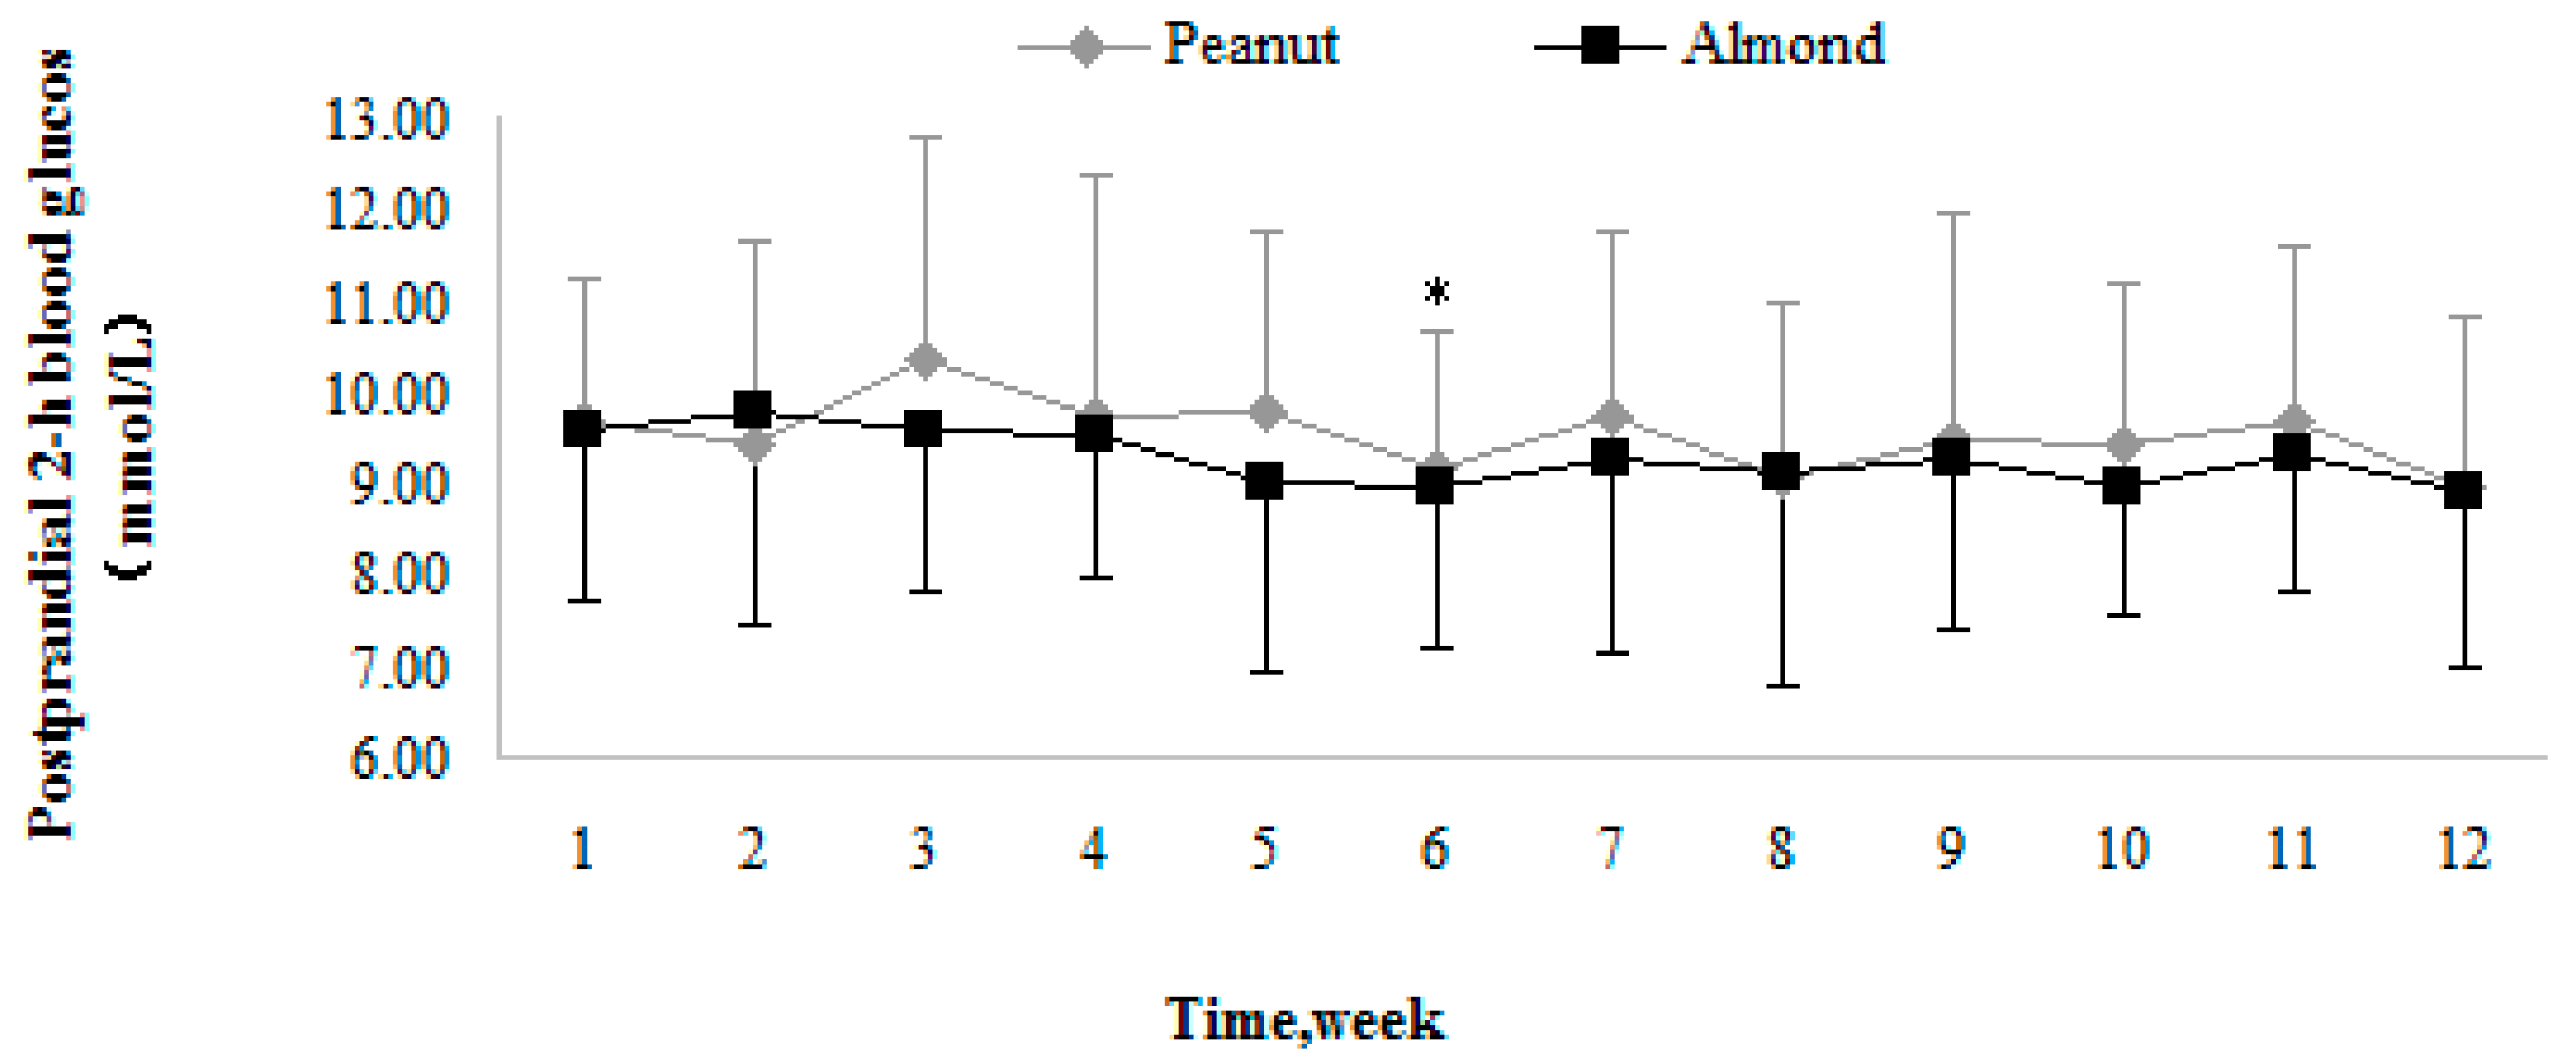
3.3.2. Postprandial Two-Hour Blood Glucose

Trends in Postprandial Two-Hour Blood Glucose

The changing trends of PPG in the two groups during the intervention are described by the fold line diagram (Figure 4). Both of the groups showed fluctuation, and the amplitude of the fluctuation of the Peanut group was significantly larger than that of the Almond group.

Comparison of Postprandial Two-Hour Blood Glucose

Compared to the baseline, the PPG in the two groups improved significantly (p < 0.05). However, there were no significant differences between the two groups at the third month (p > 0.05) (Table 3).

3.3.3. Glycated Hemoglobin

At the baseline, the HbA1c levels were not significantly different between the Peanut and Almond groups. Compared with the baseline, the HbA1c decreased significantly in the Almond group (p< 0.05, Table 4). However, there were no significant differences between the two groups by the third month. The intention-to-treat (ITT) in relation to the HbA1c levels were performed so as to ensure the stability of the above results. The ITT results were found to be in agreement with the earlier findings (Table 5).

3.4. Effect of Peanuts and Almonds on Other Cardio-Metabolic and Anthropometric Indicators

Compared with the baseline, the BMI, total cholesterol, LDL-C, HDL-C, and triglycerides in the two groups did not improve significantly by the third month. After the intervention, the cardio-metabolic and anthropometric indicators were not significantly different between the two groups (Table 6).

3.5. Hypoglycemia and Medication Changes

3.5.1. Incidence of Hypoglycemia

The incidence of hypoglycemia in the two groups showed no significant differences during the three months before the intervention (baseline) and during the intervention period. One patient in the Almond group and none in the Peanut group sustained a hypoglycemic episode during the trial.

3.5.2. Antidiabetic Drugs Used

During the study, one subject in the Peanut group and two subjects in the Almond group had a decrease in the dose of oral hypoglycemic drugs, and one subject in the Almond group had an increase in the dose of oral hypoglycemic drugs, according to the recommendations of physicians. There were no significant differences in the antidiabetic drugs used between the two groups at baseline and by the third month (Table 7).

3.6. Effect of Peanuts and Almonds onInterleukins-6

Compared with the baseline, theIL-6 in the two groups did not improve significantly by the third month. After the intervention, the IL-6 was not significantly different between the two groups (Table 8).

3.7. Effect of Peanuts and Almonds on Ratio of Urinary Albumin/Creatinine

There were no significant differences between the two groups at baseline and by the third month (Table 9).

4. Discussion

This is the first study that compared the effect of peanuts and almonds in patients with T2DM, when incorporated into a LCD diet in order to replace some staple food. The diet diaries revealed that the participants had a good adherence to the dietary intervention, and no significant difference with respect to nut adherence was found between the two groups. This RCT showed that, in combination with a LCD diet, peanuts yielded similar reductions in FBG and PPG compared to almonds.

4.1. Effect of Peanuts and Almonds on Glycemic Control

High levels of FBG, PPG, and HbA1c are some of the most difficult challenges faced by patients with T2DM, and these parameters could be used as the main indicators in order to establish a glycemic control [30]. This study showed that both peanuts and almonds incorporated into a LCD diet resulted in reductions in FBG and PPG after the intervention, which is consistent with previous research results [18,21,31]. The reason might lie in the fact that there is a decrease in the total amount of carbohydrate rich foods in a LCD. In addition, peanuts and almonds are rich in fat, they possess a low-glycemic index, and could alter the glycemic index of co-consumed foods [32]. What is more, the greater fat availability may reduce the gastric emptying rate, and may decrease the carbohydrate absorption rate [33].
However, the content of unsaturated fatty acids (UFAs) and soluble fiber in almonds is higher than that in peanuts [17]. UFAs could facilitate the movement of the glucose receptor to the cell surface, thus increasing the insulin sensitivity [34]. UFAs also act through the stimulation of GLP-1 secretion, which improves the efficacy of the β-cell function [35]. Soluble fiber increases the gastric distention, viscosity in the gastrointestinal tract, and the slower absorption of macronutrients [36]. In this way, it lowers the speed of carbohydrate absorption and the concentration of PPG [37]. Based on the above reasons, the glycemic effect of almonds may be more stable than that of peanuts. In our study, although peanuts and almonds yielded similar reductions in FBG and PPG by the end of the three-months intervention, the amplitude of the fluctuation of the PPG in the Peanut group was significantly larger than that of the Almond group.
The HbA1c level can reflect the mean blood glucose level over the last 8–12 weeks, and can be used to evaluate the long-term glycemic control of patients [30]. HbA1c has a closer association with PPG than FPG [38]. In the present study, the effect of peanuts on the HbA1c reduction was not significant. This might be due to the fluctuation of PPG in the Peanut group. The result of our study is in line with the RCT by Wien et al. [39], which did not find that incorporating peanuts into an American Diabetes Association meal plan had a significant effect in decreasing HbA1c in adults with T2DM. Although there was a 0.48% decrease in HbA1c from the baseline caused by almond consumption, the greater effect of almonds on the improvement of HbA1c was not found by the third month, compared to peanuts. The short-term duration of the follow-up may be one of the reasons for this. After a 24-week almond intervention, Gulati et al. [40] found a statistically significant improvement in the levels of HbA1c compared with the control diet.

4.2. Other Cardio-Metabolic Indicators

The consumption of peanuts and almonds has not been associated with increased body weight, despite their high lipid content. Human feeding trials have shown that nut ingestion moderates appetite postprandially [41]. The inclusion of peanuts and almonds increases a feeling of satiety and leads to a strong dietary compensation effect. In addition, because of the inefficiency in energy absorption, nut consumption does not promote a greater energy intake than other foods [41]. In a randomized cross-over study, after 12 weeks of incorporating high oleic peanuts into the diet, a less than predicted increase in the body weight was found, despite a large additional amount of energy being consumed from the peanuts [25]. Similarly, Li et al. [26] and Gulati et al. [40] also reported no changes in the body weight and BMI with the almond diet, however, a statistically significant improvement was seen in the body fat [26], waist circumference, and waist-to-height ratio [40]. Sato et al. [42] reported a significant improvement of BMI on a LCD diet on in T2DM patients with higher baseline levels of BMI (26.5 Kg/m2). Among the subjects with a relative normal baseline BMI, this study did not find that peanuts or almonds incorporated into a LCD diet had a significant reduction on the BMI.
The total cholesterol, LDL-C, HDL-C, and triglyceride levels were not altered significantly with an almond or peanut diet in this study, contrary to many other studies [14]. However, the cholesterol lowering effects of nuts are shown to be the greatest in individuals with higher baseline lipids [43]. The subjects in this study had an average healthy baseline lipid level. Barbour et al. [25] and Wien et al. [39] also reported no differences in lipids with peanut consumption in subjects with healthy baseline lipid levels.

4.3. Hypoglycemia and Medication Changes

The antidiabetic drugs and insulin doses used in the Peanut and Almond groups were identical. There was no interference caused by the agents when comparing the glycemic control effects between peanuts and almonds in this study.
We used hypoglycemia as a safety indicator. Although there was no significant difference in the between-group comparison, the percentage of hypoglycemia was reduced from 18.2% to zero in the Peanut group. Nocturnal hypoglycemia occurred in two participants in the Peanut group before the intervention, and it was recommended that they consume 50% of their prescribed peanuts before bedtime. The occurrence of hypoglycemia in the morning causes the body to produce a large amount of glucocorticoids, namely the Somogyi effect, leading to increased blood glucose in the morning [44]. Peanuts and almonds, which are rich in healthy fat, can delay the speed of gastric emptying, and can continuously supply energy [27] to the body so as to prevent the occurrence of the Somogyi effect. During the intervention in the Almond group, daytime hypoglycemia occurred in one case because of strenuous exercise, and there was no nocturnal hypoglycemia found.

4.4. Effect of Peanuts and Almonds on Interleukin-6

IL-6 was chosen as an indicator of inflammation. Chronic low-level inflammation plays an important role in the occurrence and development of DM [17,45]. IL-6 is the source of the metabolic syndrome induced by inflammation, and plays a core regulatory role in the inflammatory response [46,47]. IL-6 can inhibit insulin signaling transduction and could therefore impede the action of insulin [47].
Peanuts are rich in folic acid, which can inhibit the cascade of a reaction in the process of inflammation in vessel wall, and this may reduce the release of vascular inflammatory factors [48]. Although the administration of folic acid can cause a decrease in the concentration of homocysteine, and, as a consequence, could influence the decrease in the concentration of the indicators of inflammation [49], a decrease of IL-6 caused by peanut consumption was not found in this study. As an indicator of inflammation, the C reactive protein (CRP) did not improve after 12-week of peanut consumption in the study by Barbour et al. [25]. Contrary to our study, in the study by Gulati et al. [40], a significant improvement in the CRP was found after 24-weeks of almond consumption. Whether the inconsistency in the improvement of inflammation between studies is correlated to the different intervention duration needs to be further verified.

4.5. Effect of Peanuts and Almonds on Kidney Burden

ACR is a sensitive indicator of early renal damage [50], which is used to assess the impact of peanuts and almonds incorporated into a LCD on renal function in this study. Our study found that peanut and almond consumption with a LCD did not increase the burden on the kidney. Díaz-López et al. also reported no change in ACR after a one-year Mediterranean diet supplemented with nuts [51].

5. Limitation

There are some limitations to this study. Firstly, the sample size was small. There was also an imbalance in the gender, diabetes duration, and baseline HbA1c level between groups, although there were no significant differences found. The prolonged effect of peanuts and almonds on the prognosis of T2DM was not observed because of the short follow-up duration. Finally, measurement differences might exist in the FBG and PPG levels, which were measured by the patients themselves, using different blood glucose meters at home.

6. Conclusions

Incorporated into a low-carbohydrate diet, both peanuts and almonds can improve the fasting blood glucose and postprandial 2-h blood glucose in patients with T2DM. The effect of almonds in promoting long-term glycemic control needs to be confirmed by more studies.

Author Contributions

Y.-Y.H., O.O., and X.-H.W. analyzed the data. Y.-Y.H. wrote the initial draft, which was revised by O.O., X.-H.W., and X.-Y.S. L.-L.W., Q.W., and Q.J. collected the data. X.-H.W. contributed most to the design of this research, and all of the other authors participated in the study design and quality control. Y.-Y.H. and O.O. contributed equally to this study. X.-H.W. was the corresponding author.

Funding

This research was funded by Suzhou Science and Technology Project, China (Grant number SYS201513) and the APC was funded by Yuhui Huang.

Acknowledgments

We thank the patients with DM who volunteered to participate in this study. We also thank all of the staff in the Endocrine Division of the First Affiliated Hospital of Soochow University—Huijuan Zhou, Xiaoyan Zhang, and Li Wang—who provided us with assistance so as to ensure that the study was conducted.

Conflicts of Interest

The authors declare no conflicts of interest.

References

  1. Adeghate, E.; Schattner, P.; Dunn, E. An Update on the Etiology and Epidemiology of Diabetes Mellitus. Ann. N. Y. Acad. Sci. 2006, 1084, 1–29. [Google Scholar] [CrossRef] [PubMed]
  2. World Health Organization. World Health Organization Global Report on Diabetes: Executive Summary. 2016. Available online: http://www.who.int/diabetes/global-report (accessed on 20 May 2018).
  3. American Diabetes Association; Bantle, J.P.; Wylie-Rosett, J.; Albright, A.L.; Apovian, C.M.; Clark, N.G.; Franz, M.J.; Hoogwerf, B.J.; Lichtenstein, A.H.; Mayer-Davis, E.; et al. Nutrition recommendations and interventions for diabetes: A position statement of the American Diabetes Association. Diabetes Care 2010, 33, S61–S78. [Google Scholar]
  4. Forouhi, N.G.; Misra, A.; Mohan, V.; Taylor, R.; Yancy, W. Dietary and nutritional approaches for prevention and management of type 2 diabetes. BMJ 2018, 361, k2234. [Google Scholar] [CrossRef] [PubMed] [Green Version]
  5. Dyson, P.A.; Kelly, T.; Deakin, T.; Duncan, A.; Frost, G.; Harrison, Z.; Khatri, D.; Kunka, D.; McArdle, P.; Mellor, D. Diabetes UK evidence-based nutrition guidelines for the prevention and management of diabetes. Diabet. Med. 2011, 28, 1282–1288. [Google Scholar] [CrossRef] [PubMed]
  6. Wheeler, M.L.; Dunbar, S.A.; Jaacks, L.M.; Wahida, K.; Mayer-Davis, E.J.; Judith, W.R., Jr.; William, S. Macronutrients, Food Groups, and Eating Patterns in the Management of Diabetes. Diabetes Care 2010, 35, 434–445. [Google Scholar] [CrossRef] [PubMed]
  7. Tay, J.; Luscombe-Marsh, N.D.; Thompson, C.H.; Noakes, M.; Buckley, J.D.; Wittert, G.A.; Yancy, W.S., Jr.; Brinkworth, G.D. Comparison of low- and high-carbohydrate diets for type 2 diabetes management: A randomized trial. Am. J. Clin. Nutr. 2015, 102, 780–790. [Google Scholar] [CrossRef] [PubMed]
  8. Souza, R.G.M.; Gomes, A.C.; Naves, M.M.V.; Mota, J.F. Nuts and legume seeds for cardiovascular risk reduction: Scientific evidence and mechanisms of action. Nutr. Rev. 2015, 73, 335–347. [Google Scholar] [CrossRef] [PubMed]
  9. Cheng, A.Y.Y.; Barnes, T. Canadian Diabetes Association 2013 Clinical Practice Guidelines for the Prevention and Management of Diabetes in Canada. Can. J. Diabetes 2013, 373, S291–S360. [Google Scholar] [CrossRef]
  10. Anderson, T.J.; Gregoire, J.; Hegele, R.A.; Couture, P.; Mancini, G.B.J.; McPherson, R.; Francis, G.A.; Poirier, P.; Lau, D.C.; Grover, S.; et al. 2012 Update of the Canadian Cardiovascular Society Guidelines for the Diagnosis and Treatment of Dyslipidemia for the Prevention of Cardiovascular Disease in the Adult. Can. J. Cardiol. 2013, 29, 151–167. [Google Scholar] [CrossRef] [PubMed]
  11. Stroes, E.S.; Thompson, P.D.; Corsini, A.; Vladutiu, G.D.; Raal, F.J.; Ray, K.K.; Roden, M.; Stein, E.; Tokgozoglu, L.; Nordestgaard, B.G.; et al. Statin-associated muscle symptoms: Impact on statin therapy-European Atherosclerosis Society Consensus Panel Statement on Assessment, Aetiology and Management. Eur. Heart J. 2015, 36, 1012–1022. [Google Scholar] [CrossRef] [PubMed]
  12. Mann, J.I.; De Leeuw, I.; Hermansen, K.; Karamanos, B.; Karlstrom, B.; Katsilambros, N.; Riccardi, G.; Rivellese, A.A.; Rizkalla, S.; Slama, G.; et al. Evidence-based nutritional approaches to the treatment and prevention of diabetes mellitus. Nutr. Metab. Cardiovasc. 2004, 14, 373–394. [Google Scholar] [CrossRef]
  13. Viguiliouk, E.; Kendall, C.W.C.; Mejia, B.S.; Cozma, A.I.; Ha, V. Effect of Tree Nuts on Glycemic Control in Diabetes: A Systematic Review and Meta-Analysis of Randomized Controlled Dietary Trials. PLoS ONE 2014, 9, e103376. [Google Scholar] [CrossRef] [PubMed]
  14. Musa-Veloso, K.; Paulionis, L.; Poon, T.; Lee, H.Y. The effects of almond consumption on fasting blood lipid levels: A systematic review and meta-analysis of randomised controlled trials. J. Nutr. Sci. 2016, 5, e34. [Google Scholar] [CrossRef] [PubMed]
  15. Liu, J.; Liu, Y.; Chen, C.; Chang, W.; Chen, C.O. The effect of almonds on inflammation and oxidative stress in Chinese patients with type 2 diabetes mellitus: A randomized crossover controlled feeding trial. Eur. J. Nutr. 2013, 52, 927–935. [Google Scholar] [CrossRef] [PubMed]
  16. Jenkins, D.J.A.; Hu, F.B.; Tapsell, L.C.; Josse, A.R.; Kendall, C.W.C. Possible benefit of nuts in type 2 diabetes. J. Nutr. 2008, 138, 1752S–1756S. [Google Scholar] [CrossRef] [PubMed]
  17. Ros, E. Health Benefits of Nut Consumption. Nutrients 2010, 2, 652–682. [Google Scholar] [CrossRef] [PubMed] [Green Version]
  18. Reis, C.E.G.; Ribeiro, D.N.; Costa, N.M.B.; Bressan, J.; Alfenas, R.C.G.; Mattes, R.D. Acute and second-meal effects of peanuts on glycaemic response and appetite in obese women with high type 2 diabetes risk: A randomised cross-over clinical trial. Brit. J. Nutr. 2013, 109, 2015–2023. [Google Scholar] [CrossRef] [PubMed]
  19. Liu, X.; Hill, A.; West, S.; Gabauer, R.; McCrea, C.; Fleming, J.; Kris-Etherton, P. Acute Peanut Consumption Alters Postprandial Lipids and Vascular Responses in Healthy Overweight or Obese Men. J. Nutr. 2017, 147, 835–840. [Google Scholar] [CrossRef] [PubMed] [Green Version]
  20. Buzby, J.; Pollack, S. Almonds lead increase in tree nut consumption. Amber Waves 2008, 6, 5. [Google Scholar]
  21. Cohen, A.E.; Johnston, C.S. Almond ingestion at mealtime reduces postprandial glycemia and chronic ingestion reduces hemoglobin A(1c) in individuals with well-controlled type 2 diabetes mellitus. Metabolism 2011, 60, 1312–1317. [Google Scholar] [CrossRef] [PubMed]
  22. Asghari, G.; Ghorbani, Z.; Mirmiran, P.; Azizi, F. Nut consumption is associated with lower incidence of type 2 diabetes: The Tehran Lipid and Glucose Study. Diabetes Metab. 2017, 43, 18–24. [Google Scholar] [CrossRef] [PubMed]
  23. Chen, L. A brief discussion on the increase of fasting blood glucose. Health Guide 2014, 20, 34–35. [Google Scholar]
  24. Wang, Q. Effect of Loose Low Carbohydrate Diet on Metabolism in Patients with Type 2 Diabetes Mellitus. Master’s Thesis, Soochow University, Suzhou, China, 2015. [Google Scholar]
  25. Barbour, J.A.; Howe, P.R.C.; Buckley, J.D.; Bryan, J.; Coates, A.M. Effect of 12 Weeks High Oleic Peanut Consumption on Cardio-Metabolic Risk Factors and Body Composition. Nutrients 2015, 7, 7381–7398. [Google Scholar] [CrossRef] [PubMed] [Green Version]
  26. Li, S.; Liu, Y.; Liu, J.; Chang, W.; Chen, C.; Chen, C.O. Almond consumption improved glycemic control and lipid profiles in patients with type 2 diabetes mellitus. Metabolism 2011, 60, 474–479. [Google Scholar] [CrossRef] [PubMed]
  27. Collier, G.; O’Dea, K. He effect of coingestion of fat on the glucose, insulin, and gastric inhibitory polypeptide responses to carbohydrate and protein. Am. J. Clin. Nutr. 1983, 37, 941–944. [Google Scholar] [CrossRef] [PubMed]
  28. Childs, B.P.; Clark, N.G.; Cox, D.J.; Cryer, P.E.; Davis, S.N.; Dinardo, M.M.; Kahn, R.; Kovatchev, B.; Shamoon, H. Defining and reporting hypoglycemia in diabetes—A report from the American Diabetes Association Workgroup on Hypoglycemia. Diabetes Care 2005, 28, 1245–1249. [Google Scholar]
  29. Shi, H. The Change of Urinary Albumin-to-Creatinine Ratio in Patients with Coronary Heart Disease and the Relationship between Urinary Albumin-to-Creatinine Ratio and the Severity of Coronary Stenosis. Master’s Thesis, Fudan University, Shanghai, China, 2010. [Google Scholar]
  30. Chinese Diabetes Society. Guidelines for the prevention and treatment of type 2 diabetes in China. Chin. Med. J. 2017, 4–67. [Google Scholar]
  31. Reis, C.E.G.; Bordalo, L.A.; Rocha, A.L.C.; Freitas, D.M.O.; Da Silva, M.V.L.; de Faria, V.C.; Martino, H.S.D.; Costa, N.M.B.; Alfenas, R.C. Ground roasted peanuts leads to a lower post-prandial glycemic response than raw peanuts. Nutr. Hosp. 2011, 26, 745–751. [Google Scholar] [PubMed]
  32. Hernandez-Alonso, P.; Camacho-Barcia, L.; Bullo, M.; Salas-Salvado, J. Nuts and Dried Fruits: An Update of Their Beneficial Effects on Type 2 Diabetes. Nutrients 2017, 9, 673. [Google Scholar] [CrossRef] [PubMed]
  33. Gentilcore, D.; Chaikomin, R.; Jones, K.L.; Russo, A.; Feinle-Bisset, C.; Wishart, J.M.; Rayner, C.K.; Horowitz, M. Effects of fat on gastric emptying of and the glycemic, insulin, and incretin responses to a carbohydrate meal in type 2 diabetes. J. Clin. Endocrinol. Metab. 2006, 91, 2062–2067. [Google Scholar] [CrossRef] [PubMed]
  34. Kien, C.L. Dietary interventions for metabolic syndrome: Role of modifying dietary fats. Curr. Diabetes Rep. 2009, 9, 43–50. [Google Scholar] [CrossRef] [Green Version]
  35. Riserus, U.; Willett, W.C.; Hu, F.B. Dietary fats and prevention of type 2 diabetes. Prog. Lipid Res. 2009, 48, 44–51. [Google Scholar] [CrossRef] [PubMed] [Green Version]
  36. Chandalia, M.; Garg, A.; Lutjohann, D.; von Bergmann, K.; Grundy, S.M.; Brinkley, L.J. Beneficial effects of high dietary fiber intake in patients with type 2 diabetes mellitus. N. Engl. J. Med. 2000, 342, 1392–1398. [Google Scholar] [CrossRef] [PubMed]
  37. Hopping, B.N.; Etber, E.; Grandinetti, A.; Verheus, M.; Kolonel, L.N.; Maskarinec, G. Dietary Fiber, Magnesium, and Glycemic Load Alter Risk of Type 2 Diabetes in a Multiethnic Cohort in Hawaii. J. Nutr. 2010, 140, 68–74. [Google Scholar] [CrossRef] [PubMed]
  38. Ketema, E.B.; Kibret, K.T. Correlation of fasting and postprandial plasma glucose with HbA1c in assessing glycemic control; systematic review and meta-analysis. Arch. Public Health 2015, 73, 43. [Google Scholar] [CrossRef] [PubMed]
  39. Wien, M.; Oda, K.; Sabate, J. A randomized controlled trial to evaluate the effect of incorporating peanuts into an American Diabetes Association meal plan on the nutrient profile of the total diet and cardiometabolic parameters of adults with type 2 diabetes. Nutr. J. 2014, 13, 10. [Google Scholar] [CrossRef] [PubMed] [Green Version]
  40. Gulati, S.; Misra, A.; Pandey, R.M. Effect of Almond Supplementation on Glycemia and Cardiovascular Risk Factors in Asian Indians in North India with Type 2 Diabetes Mellitus: A 24-Week Study. Metab. Syndr. Relat. Disord. 2017, 15, 98–105. [Google Scholar] [CrossRef] [PubMed]
  41. Tan, S.Y.; Dhillon, J.; Mattes, R.D. A review of the effects of nuts on appetite, food intake, metabolism, and body weight. Am. J. Clin. Nutr. 2014, 100, 412S–422S. [Google Scholar] [CrossRef] [PubMed]
  42. Sato, J.; Kanazawa, A.; Hatae, C.; Makita, S.; Komiya, K.; Shimizu, T.; Ikeda, F.; Tamura, Y.; Ogihara, T.; Mita, T.; et al. One year follow-up after a randomized controlled trial of a 130 g/day low-carbohydrate diet in patients with type 2 diabetes mellitus and poor glycemic control. PLoS ONE 2017, 12, e0188892. [Google Scholar] [CrossRef] [PubMed]
  43. Sabate, J.; Oda, K.; Ros, E. Nut Consumption and Blood Lipid Levels A Pooled Analysis of 25 Intervention Trials. Arch. Intern. Med. 2010, 170, 821–827. [Google Scholar] [CrossRef] [PubMed]
  44. Rybicka, M.; Krysiak, R.; Okopien, B. The dawn phenomenon and the Somogyi effect-two phenomena of morning hyperglycaemia. Endokrynol. Pol. 2011, 62, 276–283. [Google Scholar] [PubMed]
  45. Yu, Z.; Malik, V.S.; Keum, N.; Hu, F.B.; Giovannucci, E.L.; Stampfer, M.J.; Willett, W.C.; Fuchs, C.S.; Bao, Y. Associations between nut consumption and inflammatory biomarkers. Am. J. Clin. Nutr. 2016, 104, 722–728. [Google Scholar] [CrossRef] [PubMed] [Green Version]
  46. Chen, Y.; Zheng, S.; Meng, C.; Hao, J. The role of IL-6 on liver insulin resistance in type 2 diabetes mellitus rats. Chin. J. Lab. Diagn. 2013, 17, 436–439. [Google Scholar]
  47. When, H.J.; Yang, J.S.; Zhang, J.J. Effect of folic acid combined with pravastatin on inflammatory factors in patients with carotid artery stenosis. Chin. J. Integr. Med. Cardio-Cerebrovasc. Dis. 2013, 11, 111–112. [Google Scholar]
  48. Scheurig, A.C.; Thorand, B.; Fischer, B.; Heier, M.; Koenig, W. Association between the intake of vitamins and trace elements from supplements and C-reactive protein: Results of the MONICA/KORA Augsburg study. Eur. J. Clin. Nutr. 2008, 62, 127–137. [Google Scholar] [CrossRef] [PubMed]
  49. Baszczuk, A.; Kopczynski, Z.; Kopczynski, J.; Cymerys, M.; Thielemann, A.; Bielawska, L.; Banaszewska, A. Impact of administration of folic acid on selected indicators of inflammation in patients with primary arterial hypertension. Postep. Hig. Med. Dosw. 2015, 69, 429–435. [Google Scholar] [CrossRef]
  50. Hasanato, R.M. Diagnostic efficacy of random albumin creatinine ratio for detection of micro and macro-albuminuria in type 2 diabetes mellitus. Saudi Med. J. 2016, 37, 268–273. [Google Scholar] [CrossRef] [PubMed] [Green Version]
  51. Diaz-Lopez, A.; Bullo, M.; Angel Martinez-Gonzalez, M.; Guasch-Ferre, M.; Ros, E.; Basora, J.; Covas, M.; Del Carmen Lopez-Sabater, M.; Salas-Salvado, J. Effects of Mediterranean Diets on Kidney Function: A Report from the PREDIMED Trial. Am. J. Kidney Dis. 2012, 60, 380–389. [Google Scholar] [CrossRef] [PubMed]
Figure 1. Flow diagram of the patients included in the study.
Nutrients 10 01565 g001
Figure 2. The changing trends of dietary adherence in the Peanut and Almond groups. Values are means, with their standard deviations represented by vertical bars.
Nutrients 10 01565 g002
Figure 3. The changing trends of fasting blood glucose (FBG) in the Peanut and Almond groups. Values are means, with their standard deviations represented by vertical bars. For the Peanut group, * FBG was significantly lower at the tenth week than that at the sixth week (p = 0.035). For the Almond group, ** FBG was significantly lower at the third week than that at the first week (p = 0.001).
Nutrients 10 01565 g003
Figure 4. The changing trends of postprandial 2-h blood glucose in the Peanut and Almond groups. Values are means, with their standard deviations represented by vertical bars. For the Peanut group, * PPG was significantly lower at the sixth week than that at the third week (p = 0.027).
Nutrients 10 01565 g004
Table 1. Baseline characteristics.
VariablesPeanut (n = 11)Almond (n = 14)t/χ2p
x ¯ ± SD/n (%) x ¯ ± SD/n (%)
Demographic data
Age (years)68.00 ± 5.8070.86 ± 8.21−0.977 aNS
Gender—male5 (45.5)10 (71.4)- bNS
Exercise (min/week)430.9 ± 222.2421.4 ± 318.50.084 aNS
Exercise habitsNever regular exercise4 (36.4)10 (71.4)- bNS
Regular exercise7 (63.6)4 (28.6)
Like sweets or rice or noodles—no1 (9.1)1 (7.1)- bNS
The amount of staple food, liang/day (1 liang = 50 g)3.77 ± 1.753.61 ± 2.020.215 aNS
Consuming nuts—yes9 (81.8)13 (92.9)- bNS
Clinical data
Smoking—yes2 (18.2)0 (0)- bNS
SBP (mmHg)130.73 ± 7.56128.00 ± 13.770.589 aNS
DBP (mmHg)79.55 ± 10.2575.71 ± 8.891.000 aNS
Family history of diabetes—yes5 (45.5)6 (42.9)- bNS
Diabetes duration, years11.27 ± 6.3615.21 ± 8.82−1.247 aNS
Complications—yes4 (36.4)6 (42.9)- bNS
Accompanying diseases—yes9 (81.8)7 (50.0)- bNS
p-value for comparisons between the treatment diets by an independent samples t-test or Chi-square test. at-test; b Fisher’s exact test. SBP—systolic blood pressure; DBP—diastolic blood pressure; NS: Differences were not significant. SD—standard deviation. Complications included diabetic retinopathy, nephropathy, neuropathy, cardiopathy, foot ulcers, and cognitive impairment.
Table 2. Comparison of fasting blood glucose (mmol/L) between the two groups.
Study PeriodPeanut (n = 11)Almond (n = 14)Fp
Baseline7.73 ± 1.198.28 ± 2.050.537NS
Third month6.69 ± 0.54 (adjusted: 6.77 ± 0.20)6.79 ± 0.92 (adjusted: 6.73 ± 0.17)0.016NS
F6.9455.785--
p0.016 *0.024 *--
F-value and p-value for comparisons by one-way analysis of variance or covariance analysis for between-group differences at the third month, with adjusted data presented as mean ± standard error. * p < 0.05; NS: differences were not significant.
Table 3. Comparison of postprandial 2-h blood glucose (mmol/L) in the two groups.
Study PeriodPeanut (n = 11)Almond (n = 14)Fp
Baseline10.36 ± 1.4010.61 ± 2.830.072NS
Third month8.94 ± 1.55 (adjusted: 9.03 ± 0.38)8.91 ± 1.89 (adjusted: 8.85 ± 0.34)0.115NS
F5.0114.487--
p0.037 *0.044 *--
F-value and p-value for comparisons by one-way analysis of variance or covariance analysis for between-group differences at the third month, with adjusted data presented as mean ± standard error. * p < 0.05; NS: differences were not significant.
Table 4. Comparison of glycated hemoglobin (%) between the two groups.
Study PeriodPeanut (n = 11)Almond (n = 14)Fp
Baseline6.81 ± 0.827.39 ± 1.160.072NS
Third month6.76± 0.91 (adjusted: 6.97 ± 0.15)6.81 ± 0.73 (adjusted: 6.65 ± 0.13)2.453NS
F0.0154.541--
pNS0.043 *--
F-value and p-value for comparisons by one-way analysis of variance or covariance analysis for between-group differences at the third month, with adjusted data presented as mean ± standard error. * p < 0.05; NS: differences were not significant.
Table 5. Glycated hemoglobin (%) between the two groups in intention-to-treat (ITT).
Study PeriodPeanut (n = 15)Almond (n = 17)Fp
Baseline6.96 ± 0.897.36 ± 1.072.119NS
Third month6.93 ± 0.96 (adjusted: 6.90 ± 0.18)6.88 ± 0.71 (adjusted: 6.65 ± 0.11)2.361NS
F0.0154.210--
pNS0.048 *--
F-value and p-value for comparisons by one-way analysis of variance or covariance analysis for between-group difference at the third month, with adjusted data presented as mean ± standard error. * p < 0.05; ITT—intention-to-treat; NS: differences were not significant.
Table 6. Comparison of other cardio-metabolic indicators between the two groups.
VariablesStudy PeriodPeanut (n = 11)Almond (n = 14)Fp
BMI (Kg/m2)Baseline22.84 ± 2.4824.08 ± 3.151.141NS
Third month22.67 ± 2.44
(adjusted: 23.30 ± 0.22)
23.43 ± 2.90
(adjusted: 22.94 ± 0.20)
1.482NS
F0.0251.141--
pNSNS--
Total cholesterol (mmol/L)Baseline4.48 ± 0.774.90 ± 1.001.362NS
Third month4.25 ± 0.93
(adjusted: 4.40 ± 0.21)
4.51 ± 0.86
(adjusted:4.39 ± 0.19)
0.002NS
F0.3981.260--
pNSNS--
LDL-C (mmol/L)Baseline2.48 ± 0.722.97 ± 0.842.290NS
Third month2.51 ± 0.84
(adjusted: 2.69 ± 0.15)
2.74 ± 0.63
(adjusted: 2.59 ± 0.14)
0.234NS
F0.0060.653--
pNSNS--
HDL-C (mmol/L)Baseline1.49 ± 0.281.36 ± 0.301.219NS
Third month1.53 ± 0.22
(adjusted: 1.49 ± 0.05)
1.34 ± 0.26
(adjusted: 1.38 ± 0.04)
3.123NS
F0.1970.029--
pNSNS--
Triglycerides (mmol/L)Baseline1.05 ± 0.461.87 ± 1.192.184NS
Third month0.96 ± 0.46
(adjusted: 0.98 ± 0.23)
1.26 ± 0.87
(adjusted: 1.25 ± 0.20)
0.777NS
F0.2071.317--
pNSNS--
F-value and p-value for comparisons by one-way analysis of variance or covariance analysis for between-group differences at the third month, with adjusted data presented as mean ± standard error.BMI—body mass index; LDL-C—low density lipoprotein cholesterol; HDL-C—high density lipoprotein cholesterol; NS: differences were not significant.
Table 7. Comparison of antidiabetic drugs between the two groups.
Study PeriodPeanut (n = 11)Almond (n = 14)F/χ2p
x ¯ ± SD/n (%) x ¯ ± SD/n (%)
BaselineNo1 (9.1%)2 (14.3%)0.423 aNS
Oral antidiabetic drugs7 (63.6%)9 (64.3%)
Insulin0 (0%)0 (0%)
Both3 (27.3)3 (21.4%)
Third monthNo1 (9.1%)1 (7.1%)0.581 aNS
Oral antidiabetic drugs7 (63.6%)10 (71.4%)
Insulin0 (0%)0 (0%)
Both3 (27.3)3 (21.4%)
Insulin dose (IU)Baseline28.33 ± 11.5936.00 ± 24.580.239 bNS
Third month27.00 ± 10.82
(adjusted: 30.19 ± 1.18 d)
33.33 ± 20.03
(adjusted: 30.14 ± 1.18 d)
0.001 cNS
a Fisher’s exact test; b one-way analysis of variance; c covariance analysis; d standard error; NS: differences were not significant.
Table 8. Comparison of interleukin-6 (IL-6) ( x ¯ ± s, pg/mL) in the two groups.
Study PeriodPeanut (n = 11)Almond (n = 14)Fp
Baseline12.78 ± 30.622.18 ± 1.101.696NS
Third month10.65 ± 26.91
(adjusted: 5.44 ± 0.52)
2.70 ± 1.83
(adjusted: 6.79 ± 0.45)
3.761NS
F0.0300.832--
pNSNS--
p-value for comparisons by one-way analysis of variance or covariance analysis for between-group differences at the third month, with adjusted data presented as mean ± standard error. NS: differences were not significant.
Table 9. Comparison of albumin/creatinine (ACR) ( x ¯ ± s, mg/g) in the two groups.
Study PeriodPeanut (n = 11)Almond (n = 14)Fp
Baseline25.58 ± 26.4018.53 ± 16.190.679NS
Third month31.47 ± 48.70 (adjusted: 25.55 ± 5.26)17.88 ± 21.87 (adjusted: 22.54 ± 4.65)0.182NS
F0.1240.008--
pNSNS--
p-value for comparisons by one-way analysis of variance or covariance analysis for between-group difference at the third month, with adjusted data presented as mean ± standard error. ACR—ratio of urinary albumin/creatinine; NS: differences were not significant.

