Article

Additive-Enhanced SnO2 FBG Sensor with Optimized Annealing Time, Temperature, and Multilayer Coating for High-Performance Humidity Sensing

1
School of Engineering and Physical Sciences, Heriot-Watt University Malaysia, Putrajaya 62200, Malaysia
2
Wireless and Photonics Networks Research Centre, Faculty of Engineering, Universiti Putra Malaysia, Serdang 43400, Malaysia
3
School of Engineering, Newcastle University, Newcastle upon Tyne NE1 7RU, UK
4
Newcastle University Medicine Malaysia, Educity, Johor Bahru 79200, Malaysia
5
Faculty of Artificial Intelligence and Engineering, Multimedia University, Cyberjaya 63100, Malaysia
6
Centre for Advanced Devices and Systems, Centres of Excellence for Robotics and Sensing Technologies, Multimedia University, Cyberjaya 63100, Malaysia
*
Author to whom correspondence should be addressed.
Nanomaterials 2025, 15(19), 1508; https://doi.org/10.3390/nano15191508
Submission received: 22 July 2025 / Revised: 19 September 2025 / Accepted: 29 September 2025 / Published: 1 October 2025
(This article belongs to the Special Issue Nanomaterials for Optical Fiber Sensing)

Abstract

Coating plays an important role in advancing sensing technology by significantly enhancing sensitivity, stability, and response time. The unique properties of nanostructures, including high surface-to-volume ratio and tunable porosity, make them suitable candidates for improving sensor performance. By optimizing nanostructure coatings, advancements in high-precision humidity sensing devices are achievable, enabling a wide range of industrial applications, especially in humidity-controlled industries. In this study, the effects of annealing time, annealing temperature, and the number of coating layers on the properties of additive-enhanced SnO2 nanostructure were investigated. The experiment was carried out by subjecting the additive-enhanced SnO2 nanostructure to different annealing times and annealing temperatures to analyze its impact on crystallinity, porosity, and moisture adsorption properties. Upon optimizing the annealing parameters, multilayer coatings were carried out to assess the effect of the total number of coating layers on hygroscopic behavior. A hygroscopicity test was carried out on each sample to evaluate its moisture adsorption and desorption capabilities. The results demonstrated that controlled annealing conditions significantly improve the nanostructure’s hygroscopic properties, and the optimized coating layers further enhanced the moisture retention, making the developed SnO2 nanostructure a promising candidate for advanced sensing applications.

Graphical Abstract

1. Introduction

Metal oxides have gained increasing popularity in sensing advancements across various applications, such as gas sensing, chemical sensing, and humidity sensing [1,2]. Titanium dioxide (TiO2)-based nanostructures are commonly used for applications in chemical and gas sensing due to their chemical and thermal stability [3]. One of the optical fiber sensors, known as a fiber Bragg grating (FBG), has been explored with TiO2 coating for chemical detection [4]. The results showed an improved sensing capability of more than 10% with the TiO2 coating.
Zinc oxide (ZnO) and SnO2 have been explored for humidity sensing purposes as hygroscopic nanomaterials, where ZnO exhibits high thermal and chemical stability, and SnO2 demonstrates improved surface area and increased oxygen vacancies, providing more active sites for water retention [5]. A ZnO/SnO2 composite humidity sensor has been developed via solvothermal synthesis. Results showed that a high-response sensor with improved linearity and stability can be achieved using the metal oxide composite. The designed sensor also showed small hysteresis and short response and recovery times in a relative humidity range of 11% to 95%.
Other metal oxides, including cerium oxide (CeO2), iron oxide (Fe2O3), chromium oxide (Cr2O3), vanadium oxide (V2O5), and silicone dioxide (SiO2), have also been explored for sensing purposes as summarize in Table 1. The tunable crystallite size and surface morphology, excellent electrical and optical properties, and high thermal stability of metal oxides make them suitable candidates for deployment under harsh and extreme conditions [6,7]. Research has been carried out to improve the hygroscopicity of the nanomaterial for its applications in humidity sensors with enhanced sensitivity, response time, selectivity, and stability [8].
An additive that acts as a surfactant and structure-directing agent is one of the approaches for the modification of pore structure, resulting in increased hygroscopicity of metal oxide sensing materials [16,17]. An additive-enhanced nanostructure requires controlled annealing and coating processes to achieve the desired structural parameter, particle size, and surface-to-volume ratio. The annealing process is important in optimizing the porosity, surface area, morphology, optical properties, and adsorption capacity of nanostructures [18,19].
The annealing time and temperature are critical parameters to achieve high crystallinity, ensuring the performance and stability of the nanostructure [20]. The unwanted residue and impurities cannot be fully removed under insufficient annealing, jeopardizing the formation of M–O bonds [21]. Whereas over annealing could lead to decomposition of the additive and incur agglomeration, which leads to a reduction in surface area [22].
A multilayer coating increases the thickness of the nanostructure, resulting in a larger particle size [23]. Additionally, this approach produces abundant functional groups and pore structure, providing more active sites for water molecules. However, the repeatability and stability of multilayer nanostructures can be impacted by the interlayer interaction at high humidity conditions [24].
Hybrid layer coating showed improvement in increased surface area, enhanced interfacial bonding for stronger adhesion through the anchoring effect, and improved charge transfer by pairing p-type and n-type semiconductor materials to form a p–n heterojunction [25,26,27].
Optical fiber sensors have been deployed for multiple applications owing to their advantages, including small form-factor, high robustness towards hazardous environments, and ease of integration into wearable smart sensing devices [28,29]. By applying suitable coating materials and optimizing coating techniques to optical fiber sensors, including FBG, improved performance in humidity sensing can be achieved.
To the best of our knowledge, additive-enhanced SnO2 nanostructures have not been studied for application in optical-based humidity sensing. The coating parameters of the nanostructure, such as annealing time, annealing temperature, and multilayer coating, have not been analyzed.
In this study, an additive-enhanced SnO2 nanostructure will be synthesized, and the effect of annealing time and temperature on the nanostructure will be examined. Multilayer coating of SnO2-HMT and hybrid layer coating of ZnO/SnO2-HMT will also be investigated. The sensing performance of the synthesized nanostructure will be studied with a hygroscopicity test and characterization.

2. Materials and Methods

2.1. Additive-Enhanced SnO2 Synthesis

The SnO2-HMT was synthesized via a modified low-temperature hydrothermal technique as illustrated in Figure 1, where tin (II) chloride dihydrate (SnCl2∙2H2O) (Merck KGaA, Darmstadt, Germany) was selected as the precursor and hexamethyltriethylethanolamine (HMT) (Merck KGaA, Darmstadt, Germany) was dispersed as the additive. 0.01M of precursor and 0.01M of additive were dissolved with 95% ethanol and facilitated by the solution of sodium hydroxide (NaOH) for further dissolution to form a homogeneous coating solution.

2.2. Investigation of Annealing Time and Temperature

Glass slides cleaned with 95% ethanol were placed on a hotplate heated up to 80 °C. 100 µL of SnO2-HMT coating solution was drop-cast onto the glass slide and let dry for 1 min. The same steps were repeated 5 times to ensure a total of 500 µL precursor solution was deposited to fully cover the substrate for single-layer coating.
The coated glass slide will be subjected to an annealing oven preheated to 140 °C. The annealing time was adjusted to 2.5 h for sample curing. The sample was removed upon completion of the annealing process, followed by the insertion of the sample into the preheated oven with the annealing time set to 3 h and 3.5 h, respectively, to obtain the second and third batches of the sample.
The three samples of fully cured nanostructures were subjected to a hygroscopicity test, where the samples were inserted into a humidity-controlled chamber separately for mass change measurement under increasing and decreasing RH. A hygroscopicity test was conducted, and characterization, including FTIR, microscope image, and FESEM, was carried out. Upon analysis of the testing and characterization results, the optimal annealing time was determined for the next experiment.
The same coating steps will be repeated to obtain another 3 batches of samples; each of the samples will be inserted into the annealing oven separately, with the annealing temperature set to 100 °C, 140 °C, and 180 °C, respectively. The temperature ranges were selected due to the decomposition temperature of HMT is approximately 236.55 °C [30]. Therefore, the annealing temperature in this experiment should not exceed 200 °C to prevent decomposition of the additive. Upon annealing, all samples underwent the same testing and characterization procedure to analyze the effects of annealing temperature on the humidity sensing properties of SnO2-HMT.

2.3. Investigation of Multilayer and Hybrid Layer Coating

For multilayer coating, the coating steps were repeated to first form a single-layer coating of SnO2-HMT on the glass substrate. The sample was subjected to an annealing process with the optimal annealing time and temperature, determined by the hygroscopicity test for first-layer curing. The annealing process was repeated with the same parameters until 3 layers coating were formed.
To obtain a hybrid layer-coated sample, Zinc Oxide (ZnO) was selected as the interlayer between the substrate and the SnO2-HMT. The ZnO coating solution was prepared with similar steps by replacing the precursor with zinc acetate dihydrate (Zn(CH3CO2)2∙2H2O) (Merck). The sample was prepared by coating and annealing a single-layer ZnO, followed by the coating and annealing of SnO2-HMT as the top layer.
Both the multilayer SnO2-HMT and hybrid layer ZnO/SnO2-HMT samples were subjected to a hygroscopicity test, followed by characterization to examine the water–surface interaction between the nanostructure with the surrounding water molecules.

3. Results and Discussions

3.1. Hygroscopicity Test

The hygroscopicity test was carried out according to the ASTM standard [31], where the samples were placed within a humidity-controlled chamber and the mass change over increasing RH from 40 to 80%, and decreasing RH from 80 to 40%, was recorded at every 10%RH interval.
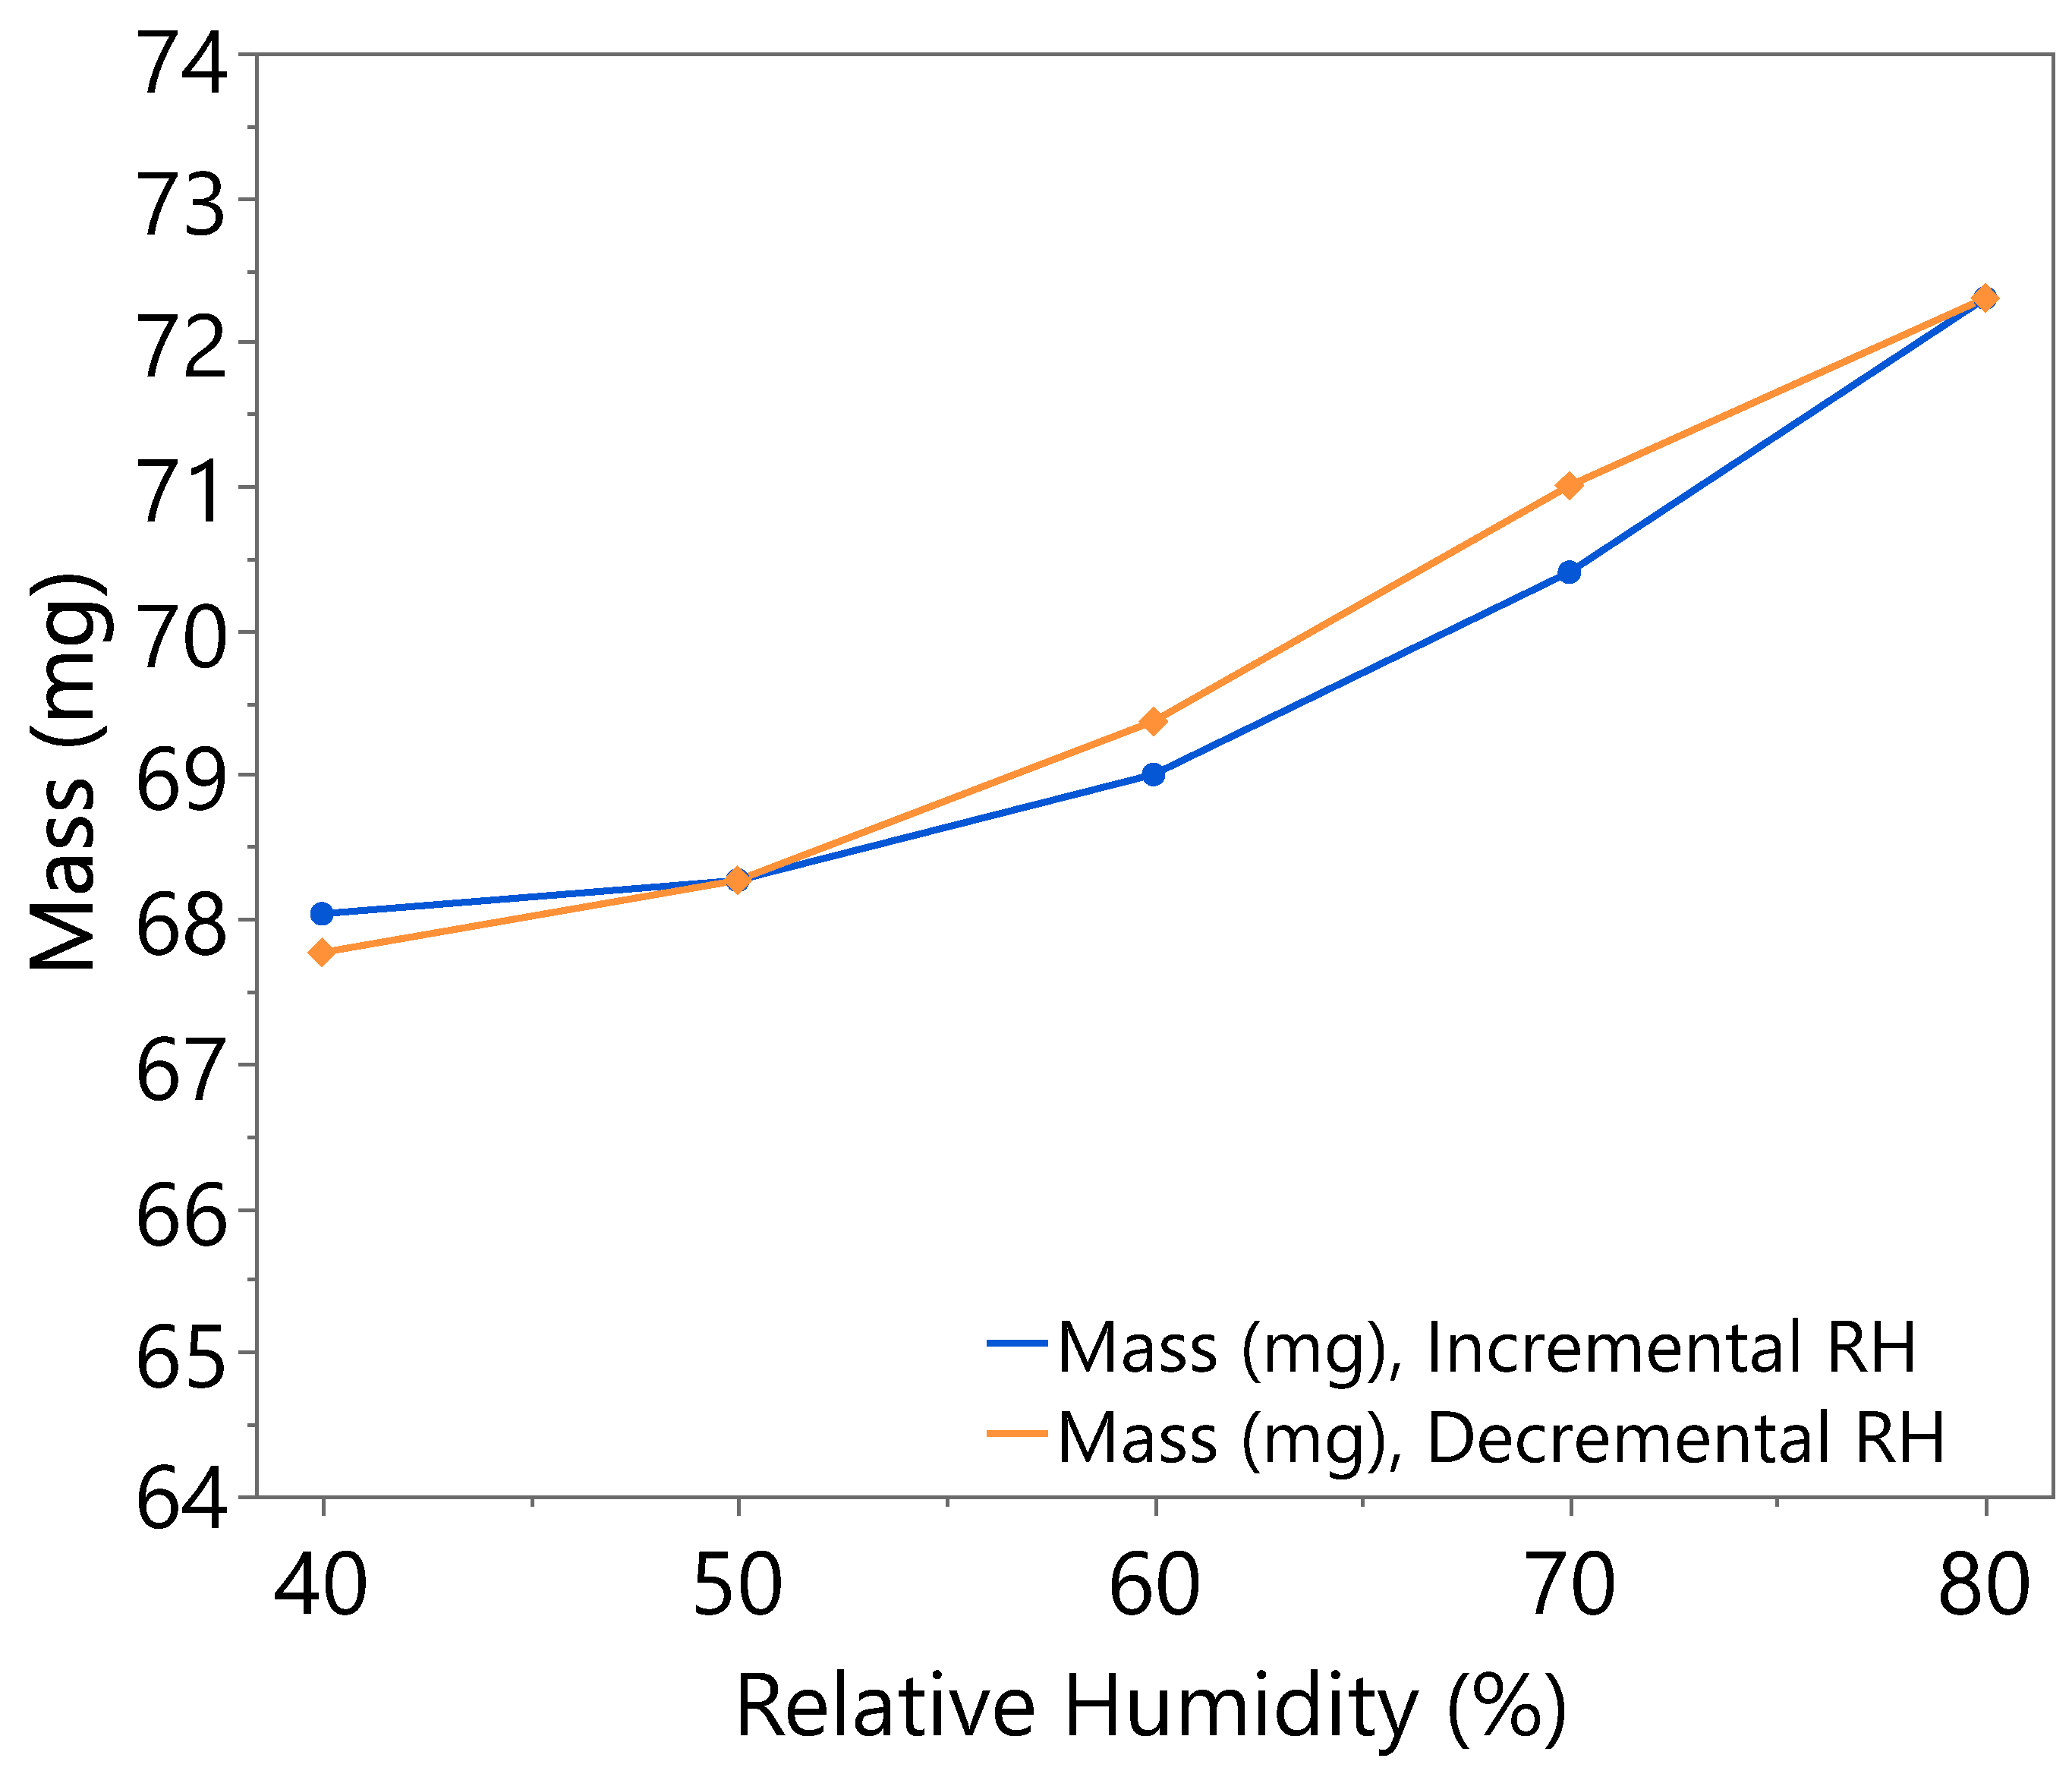
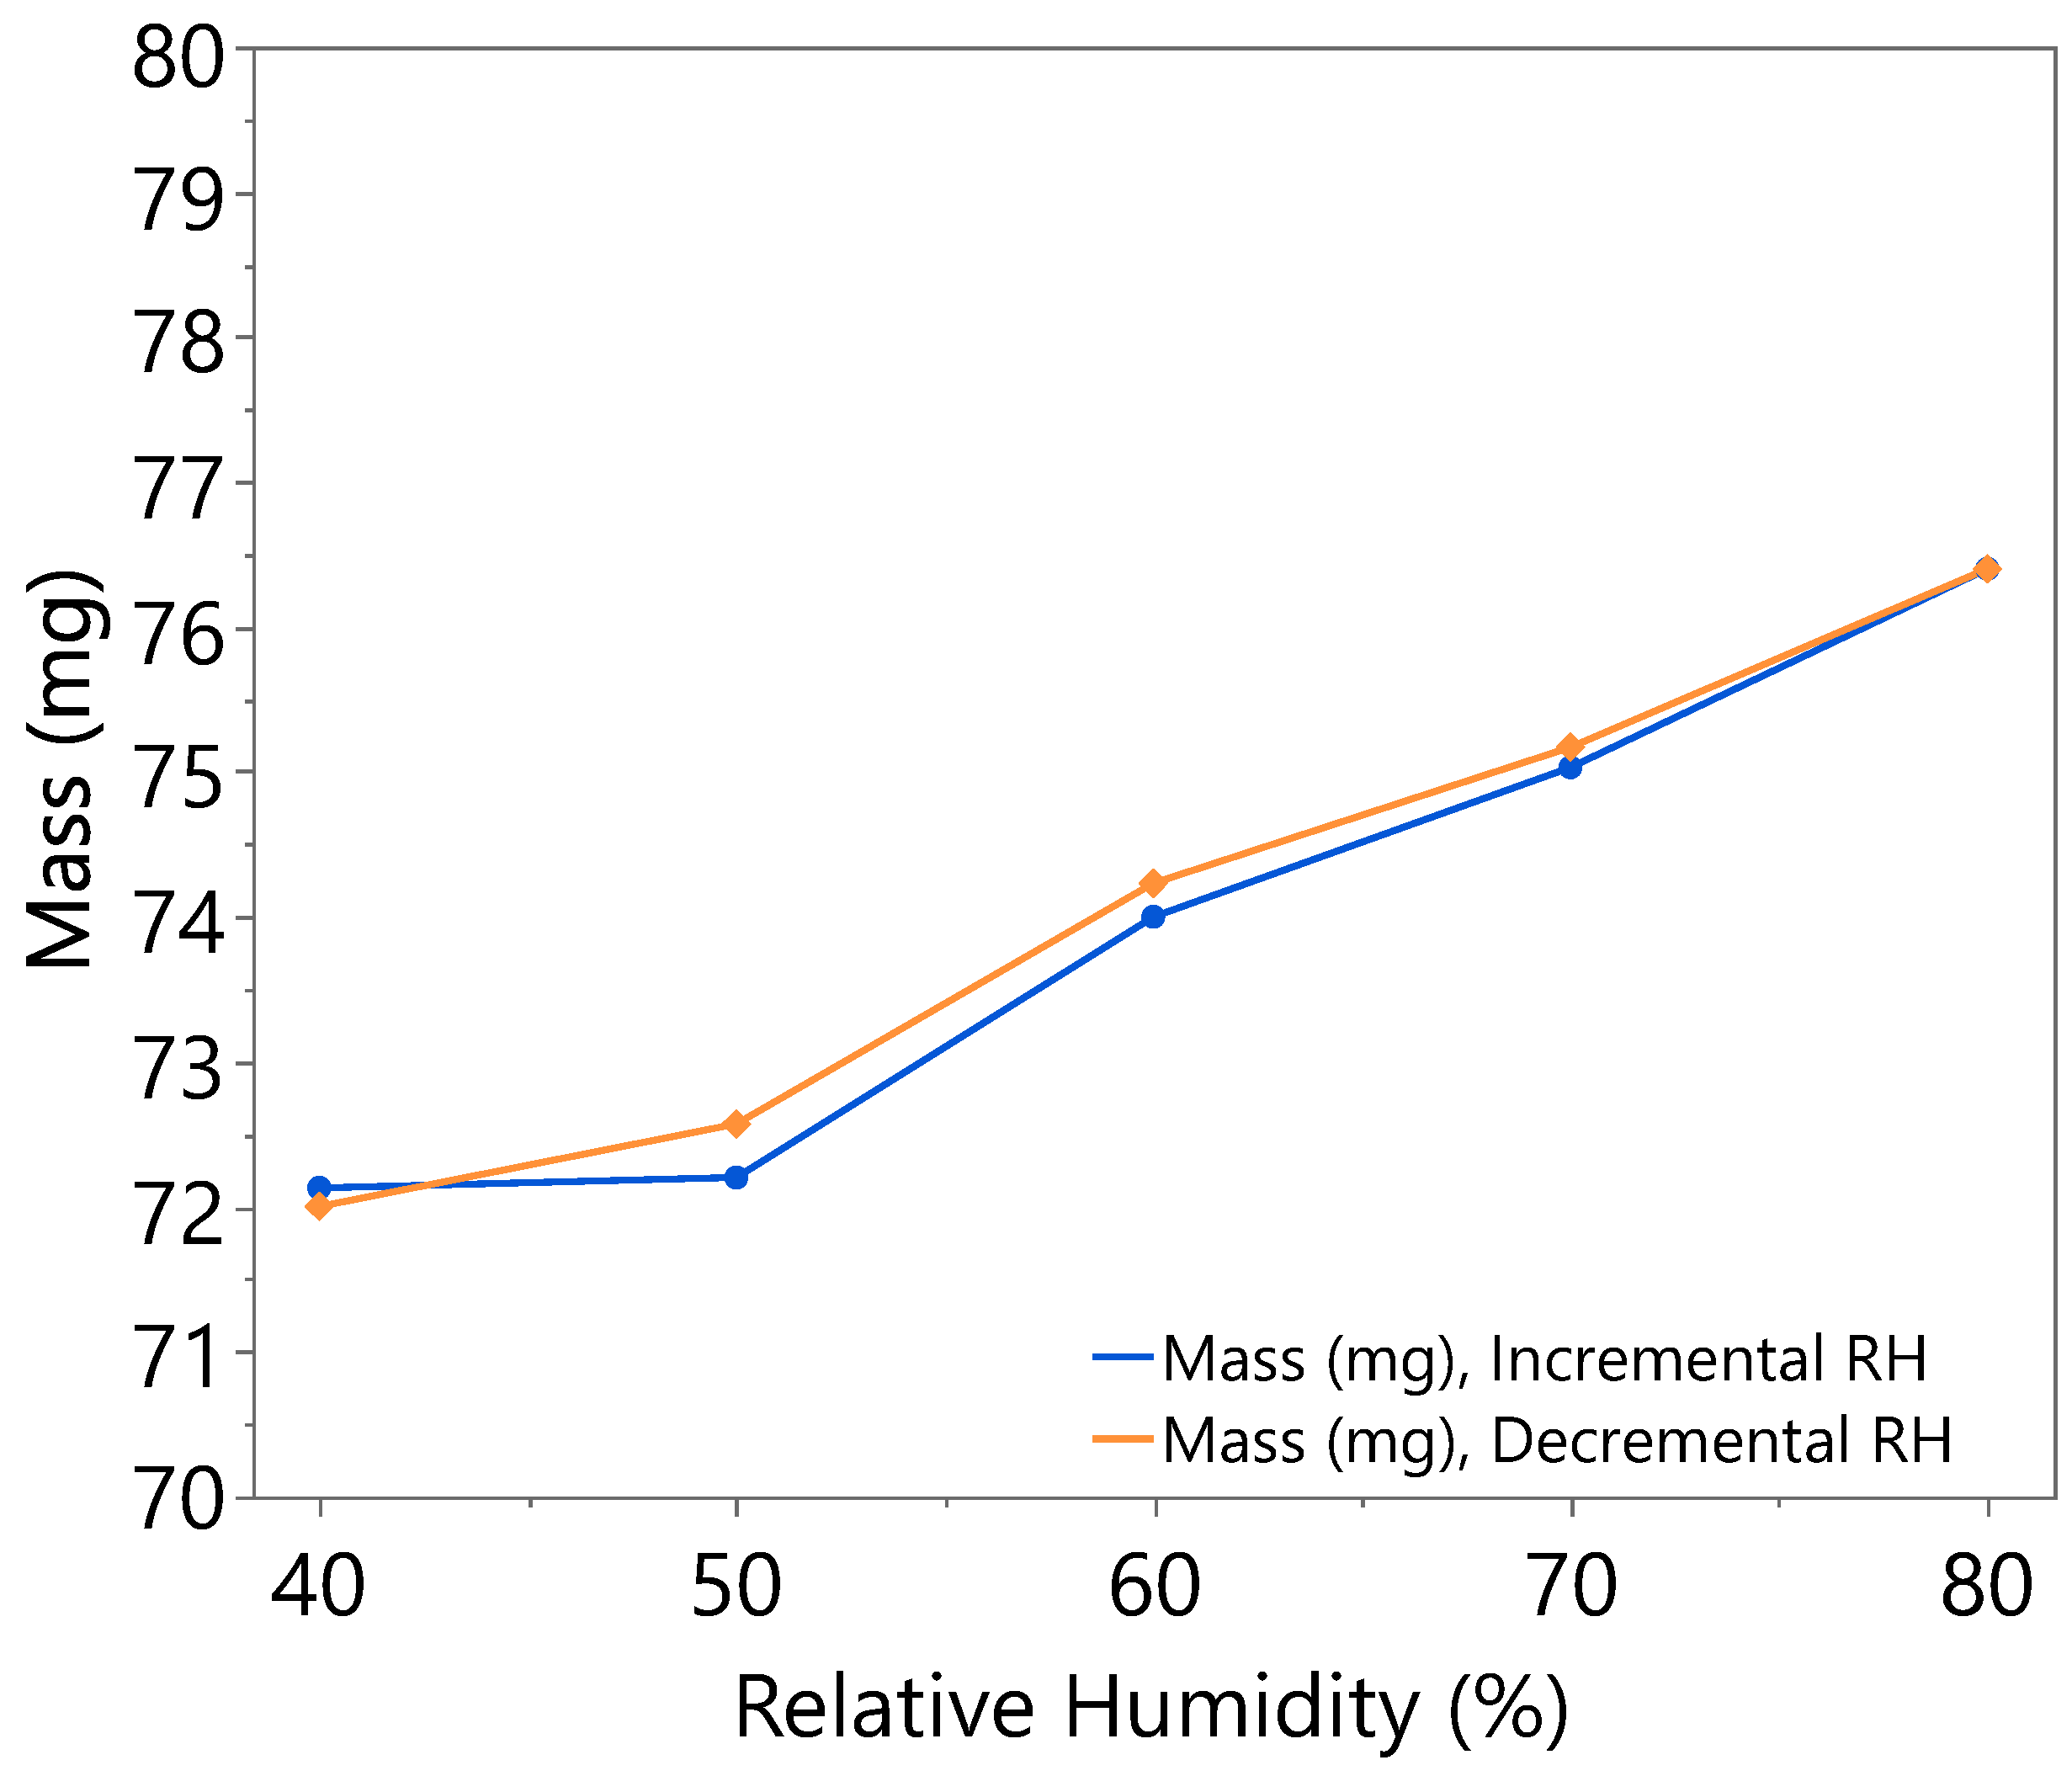
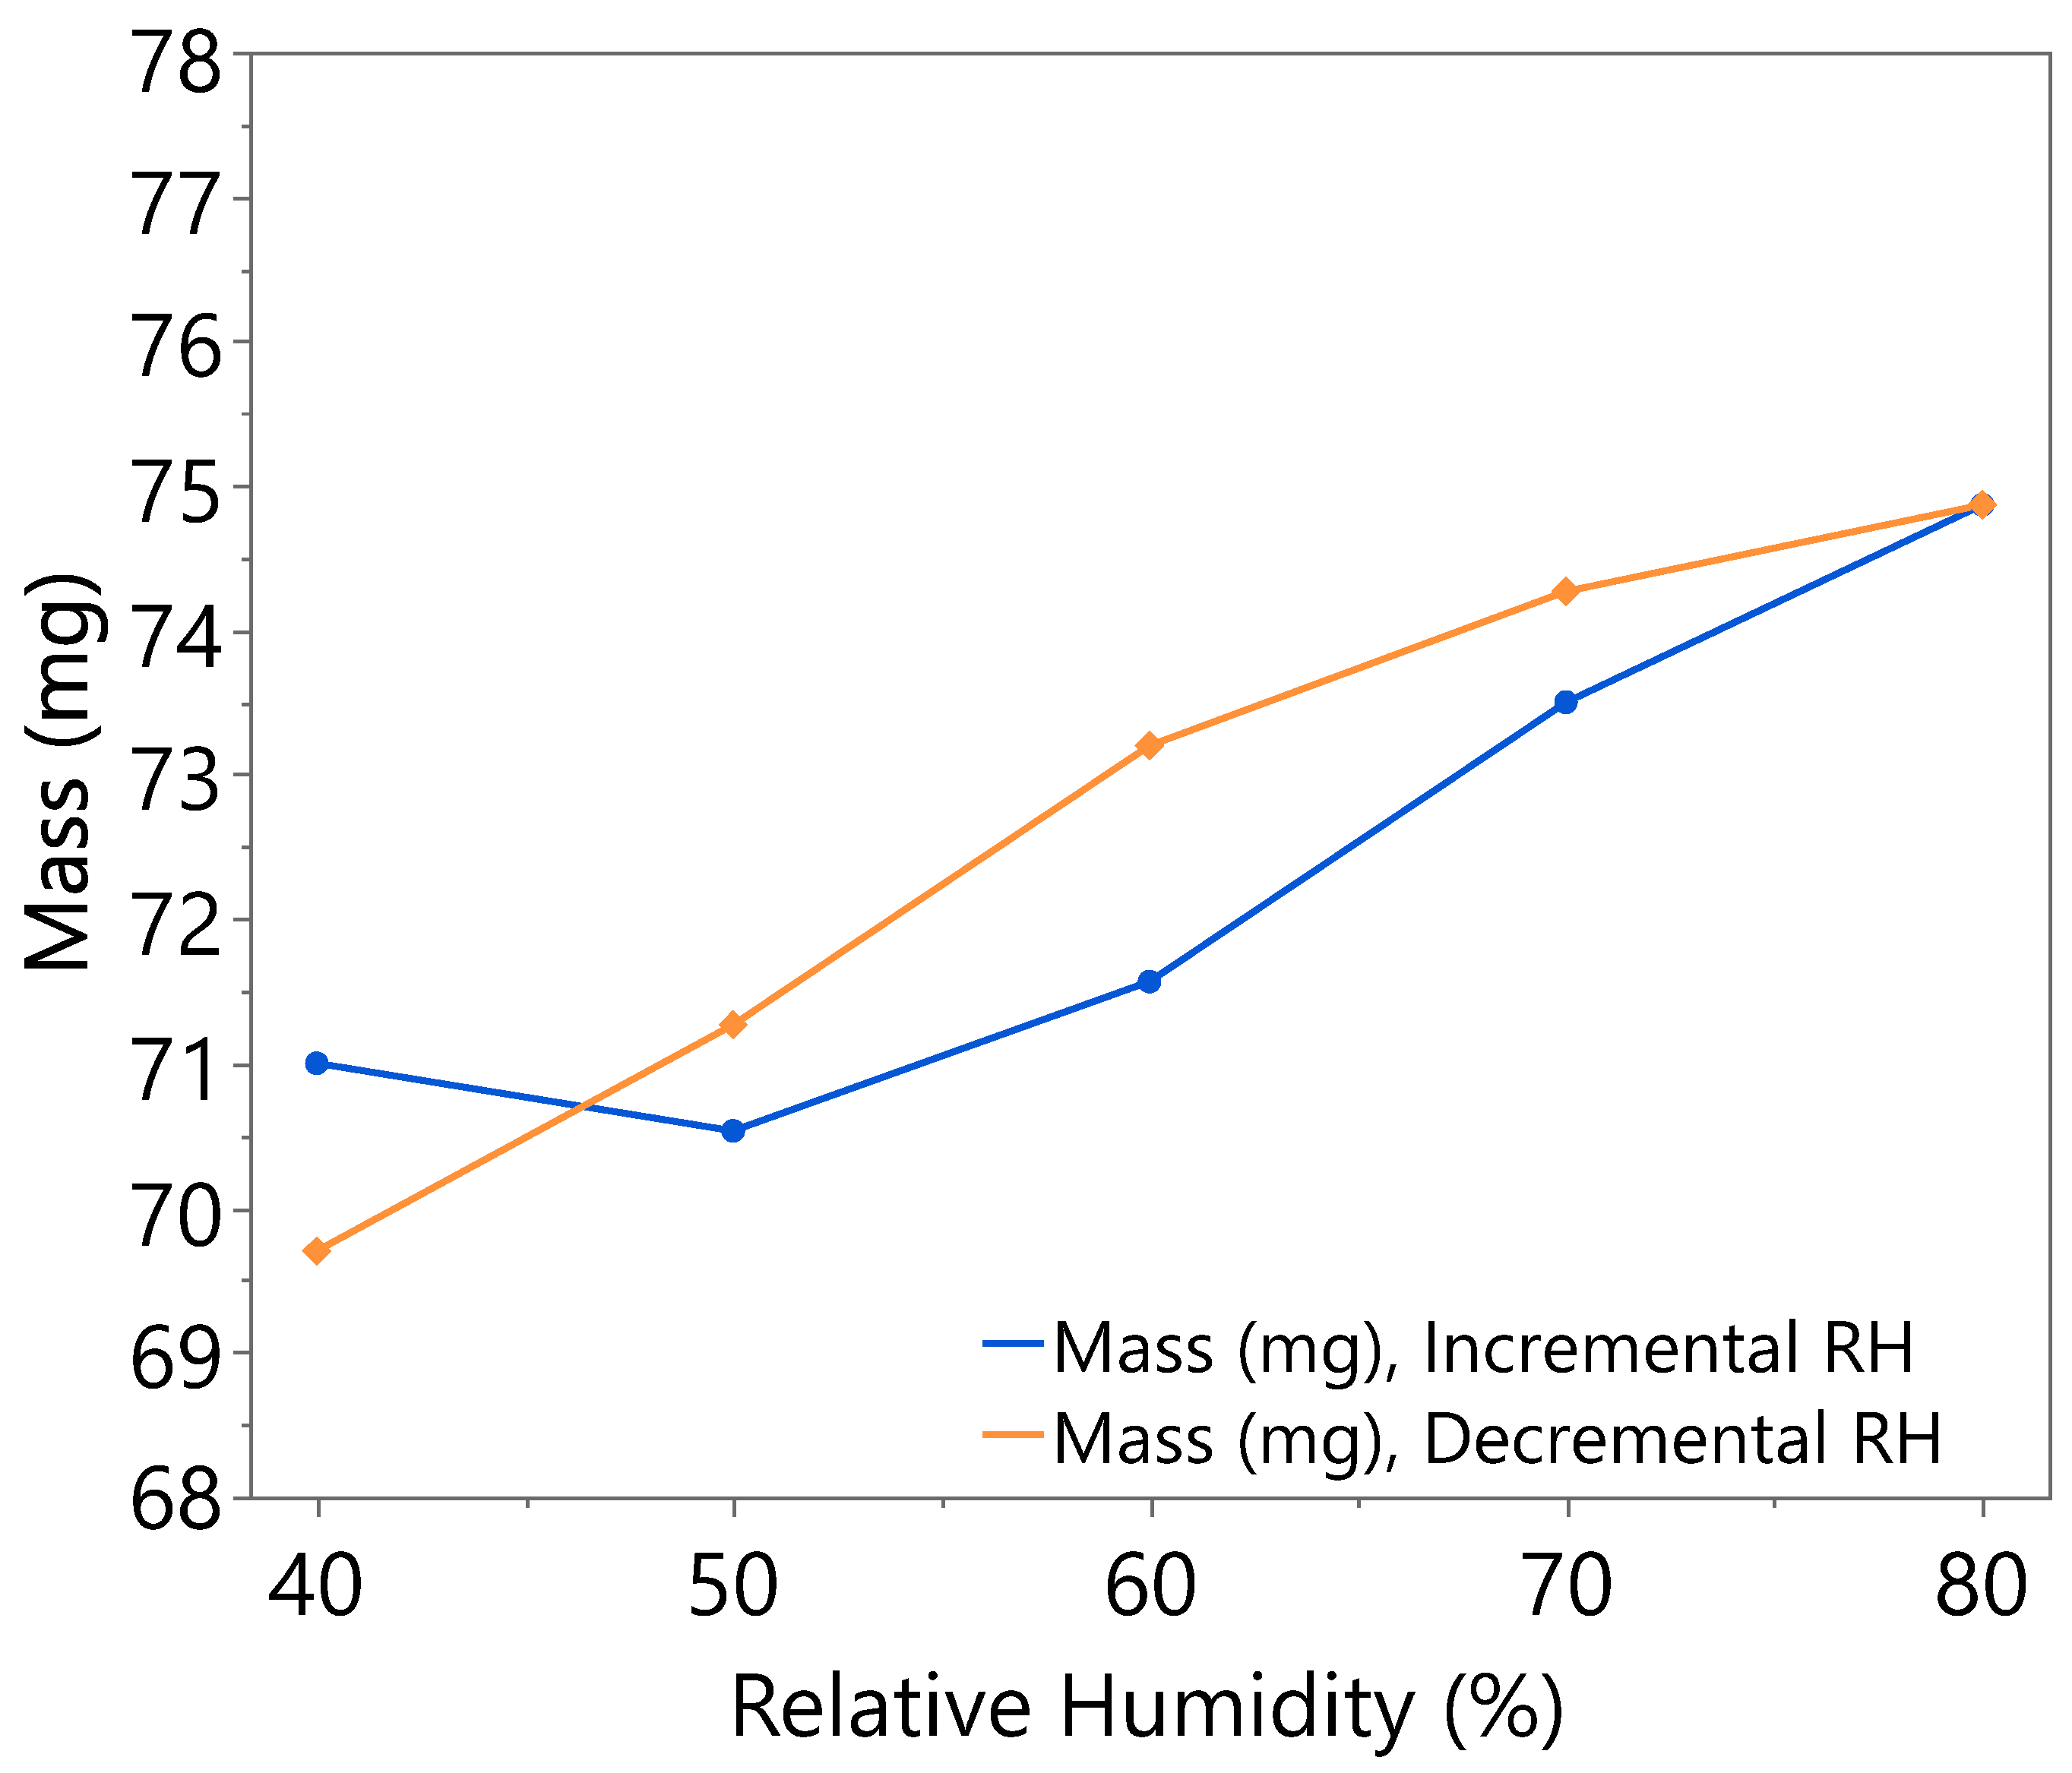
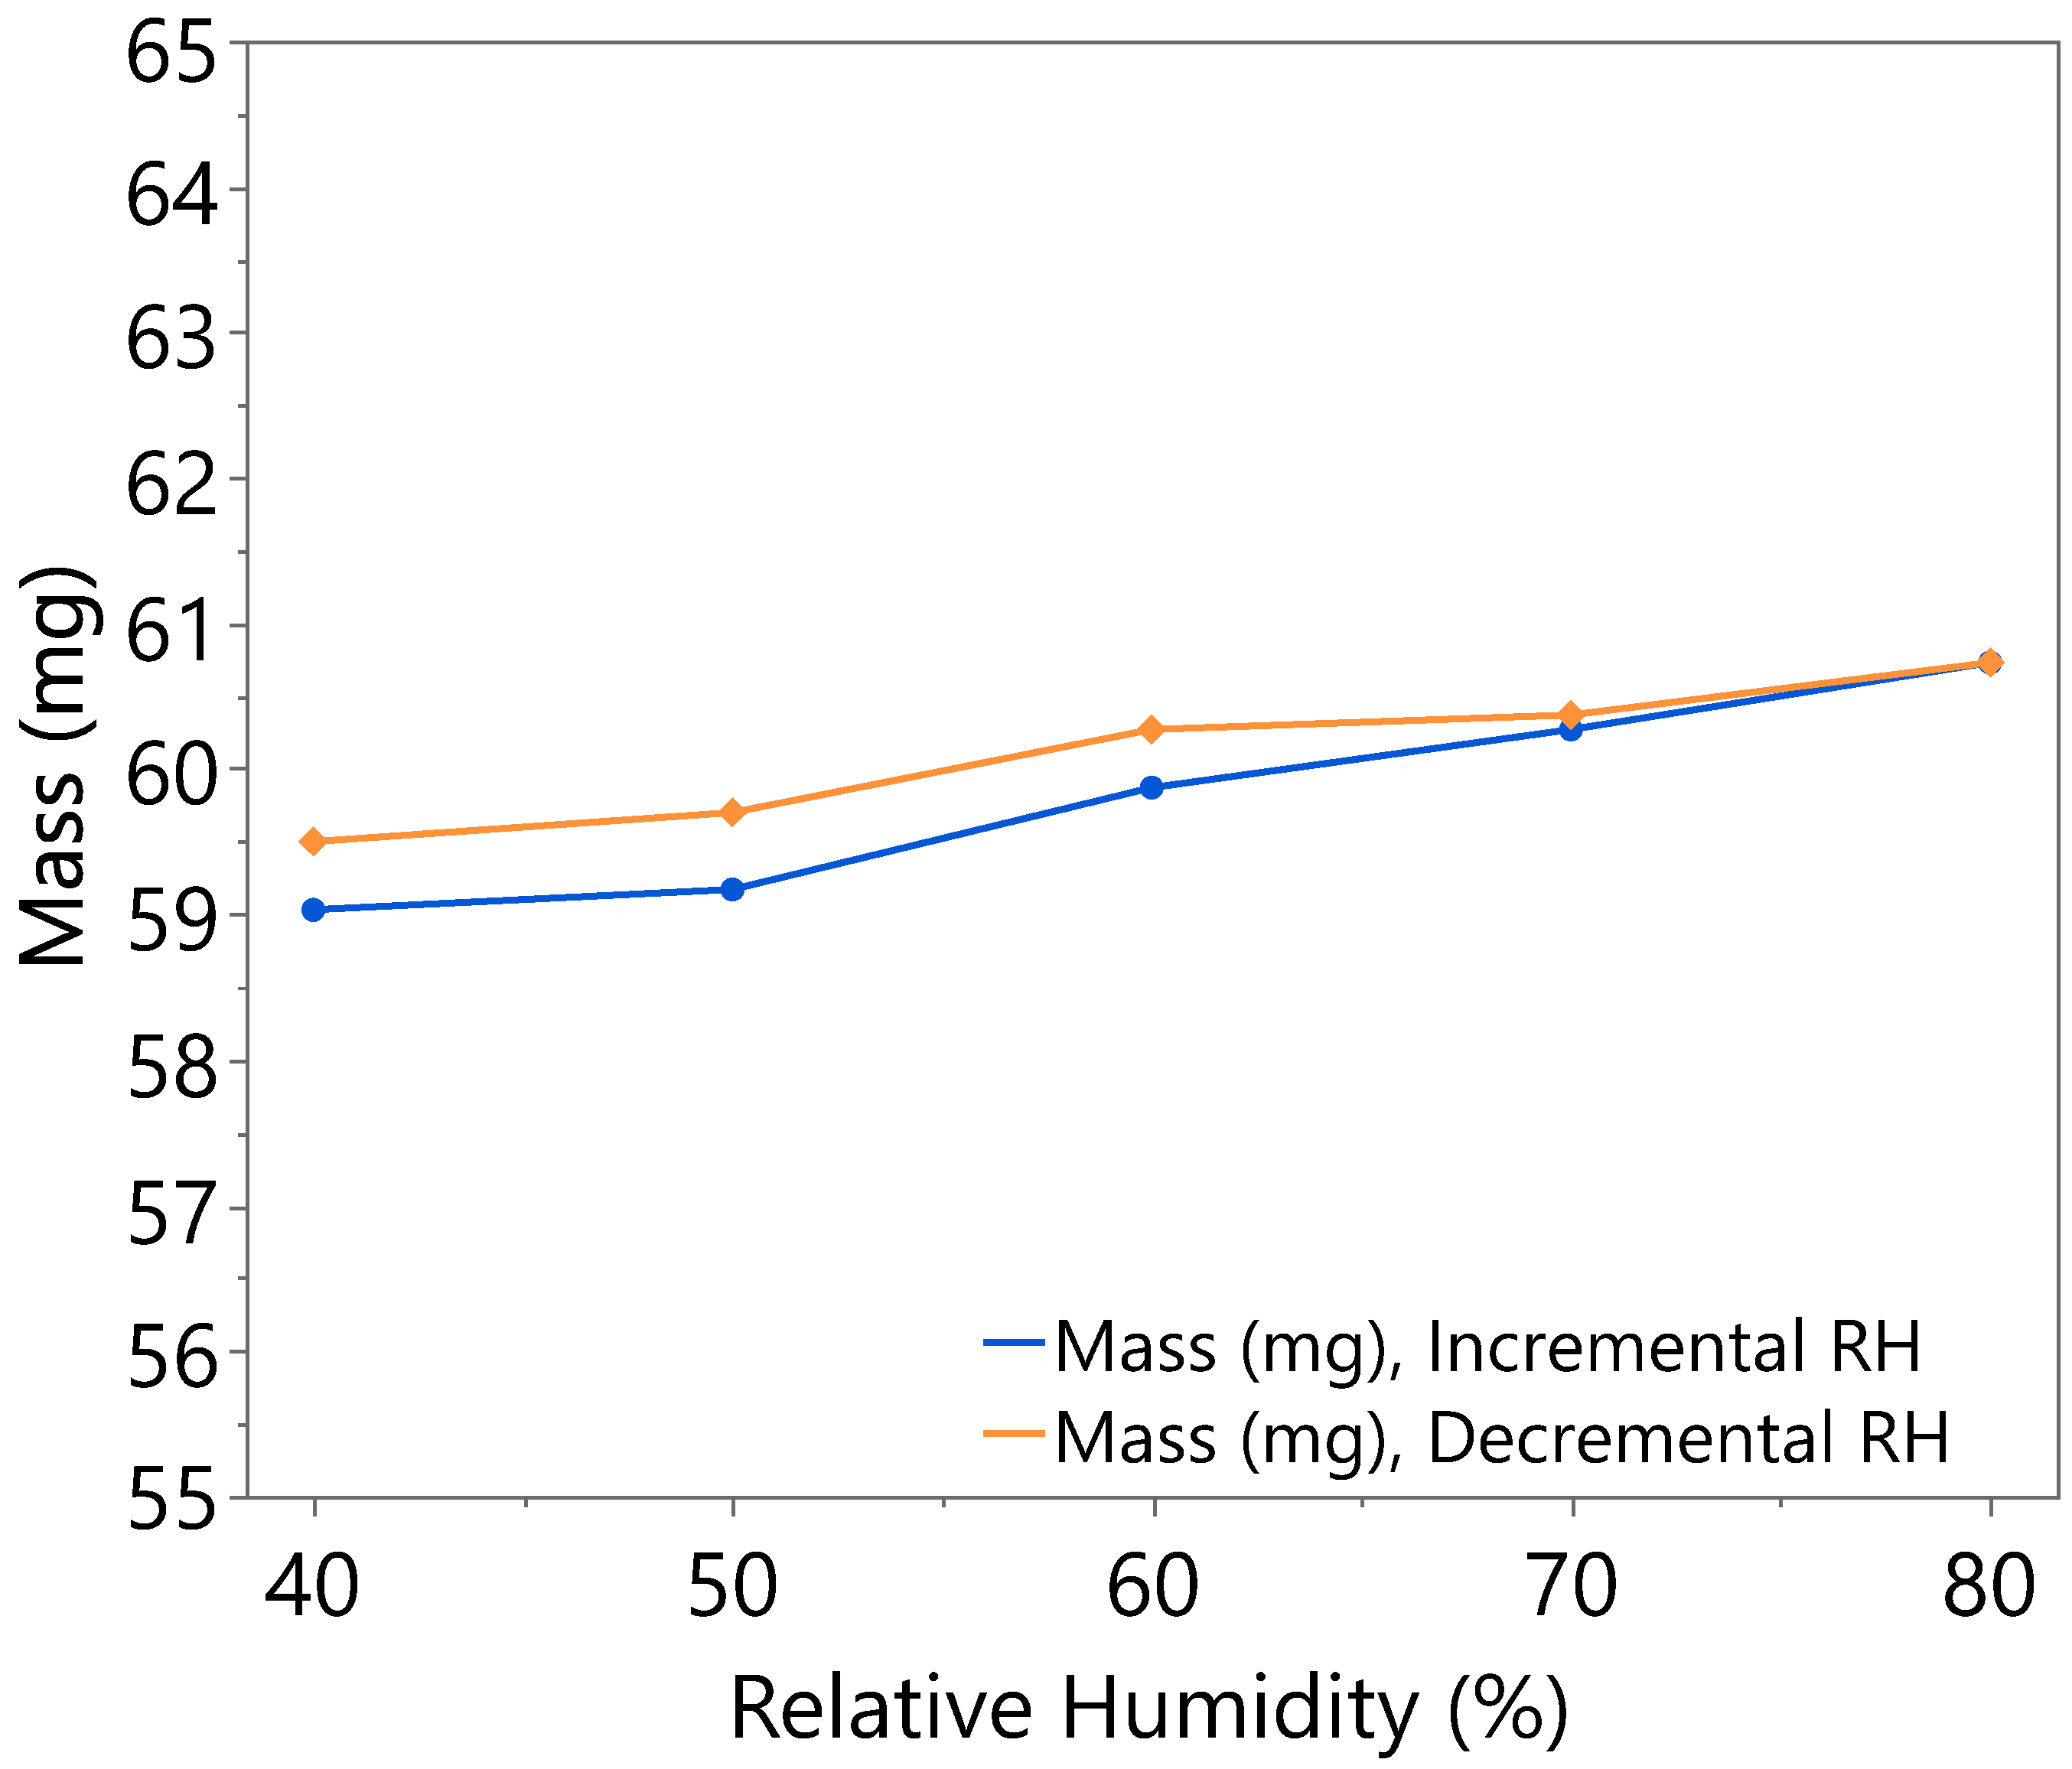
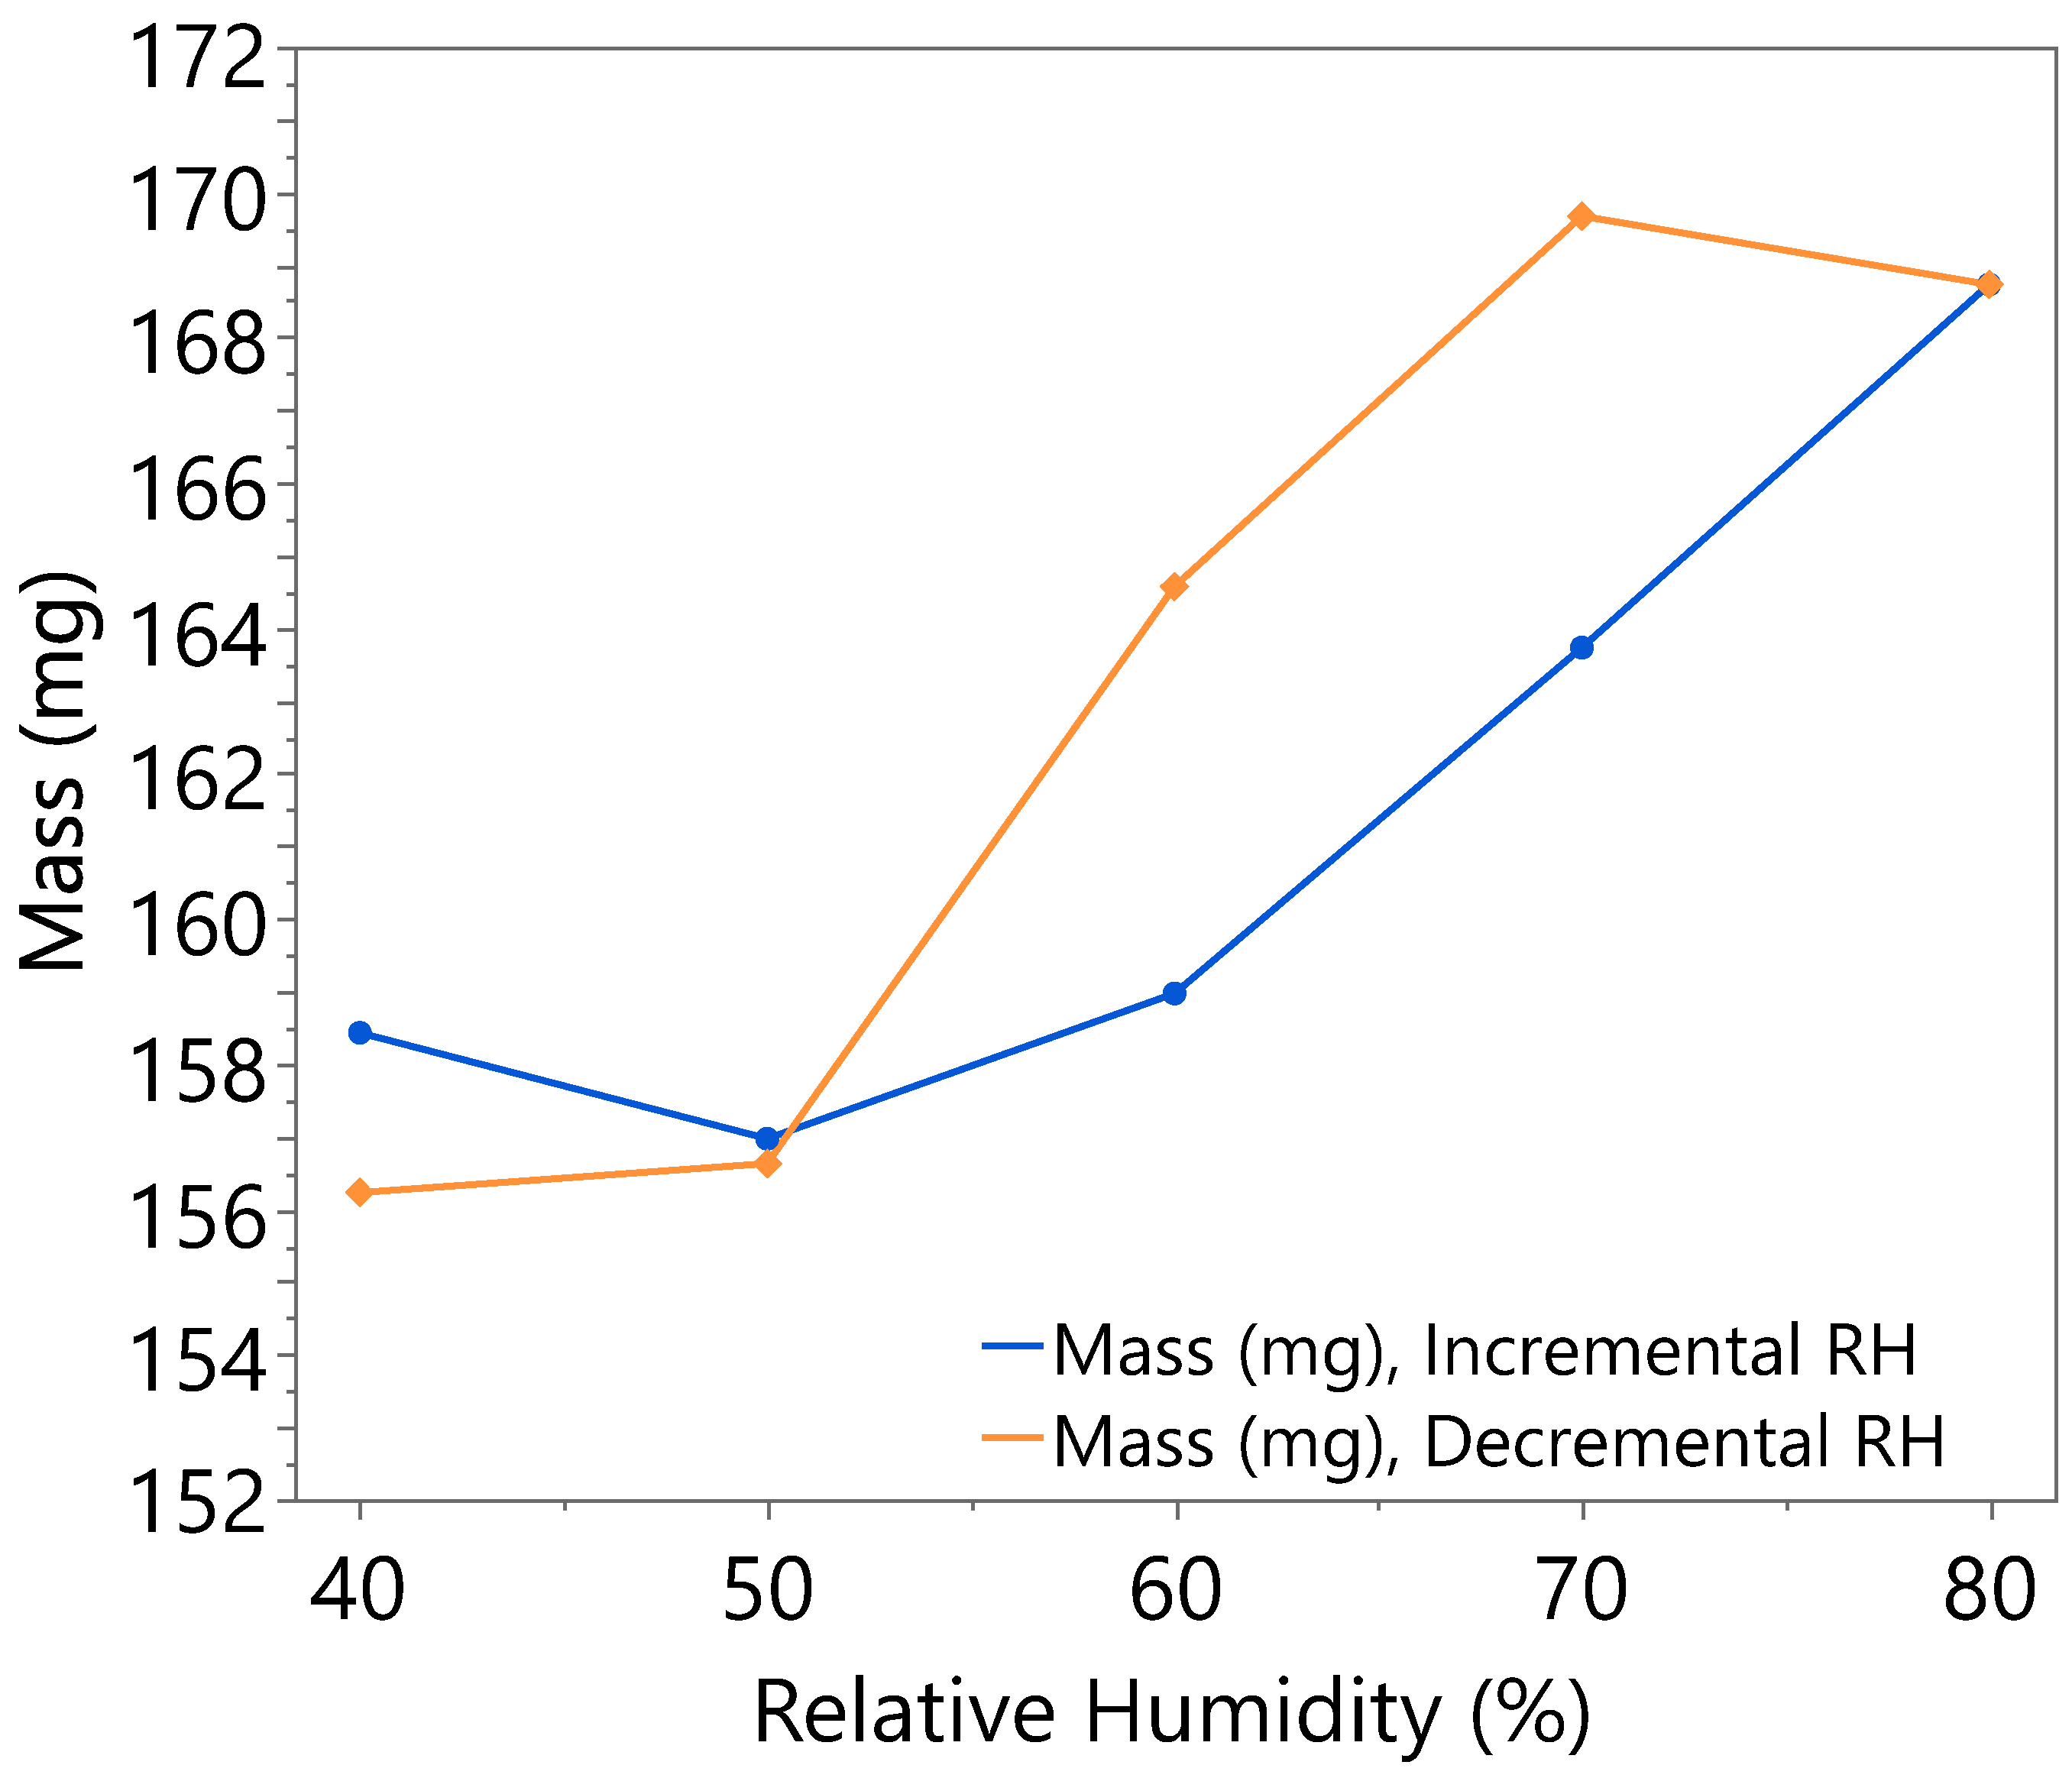
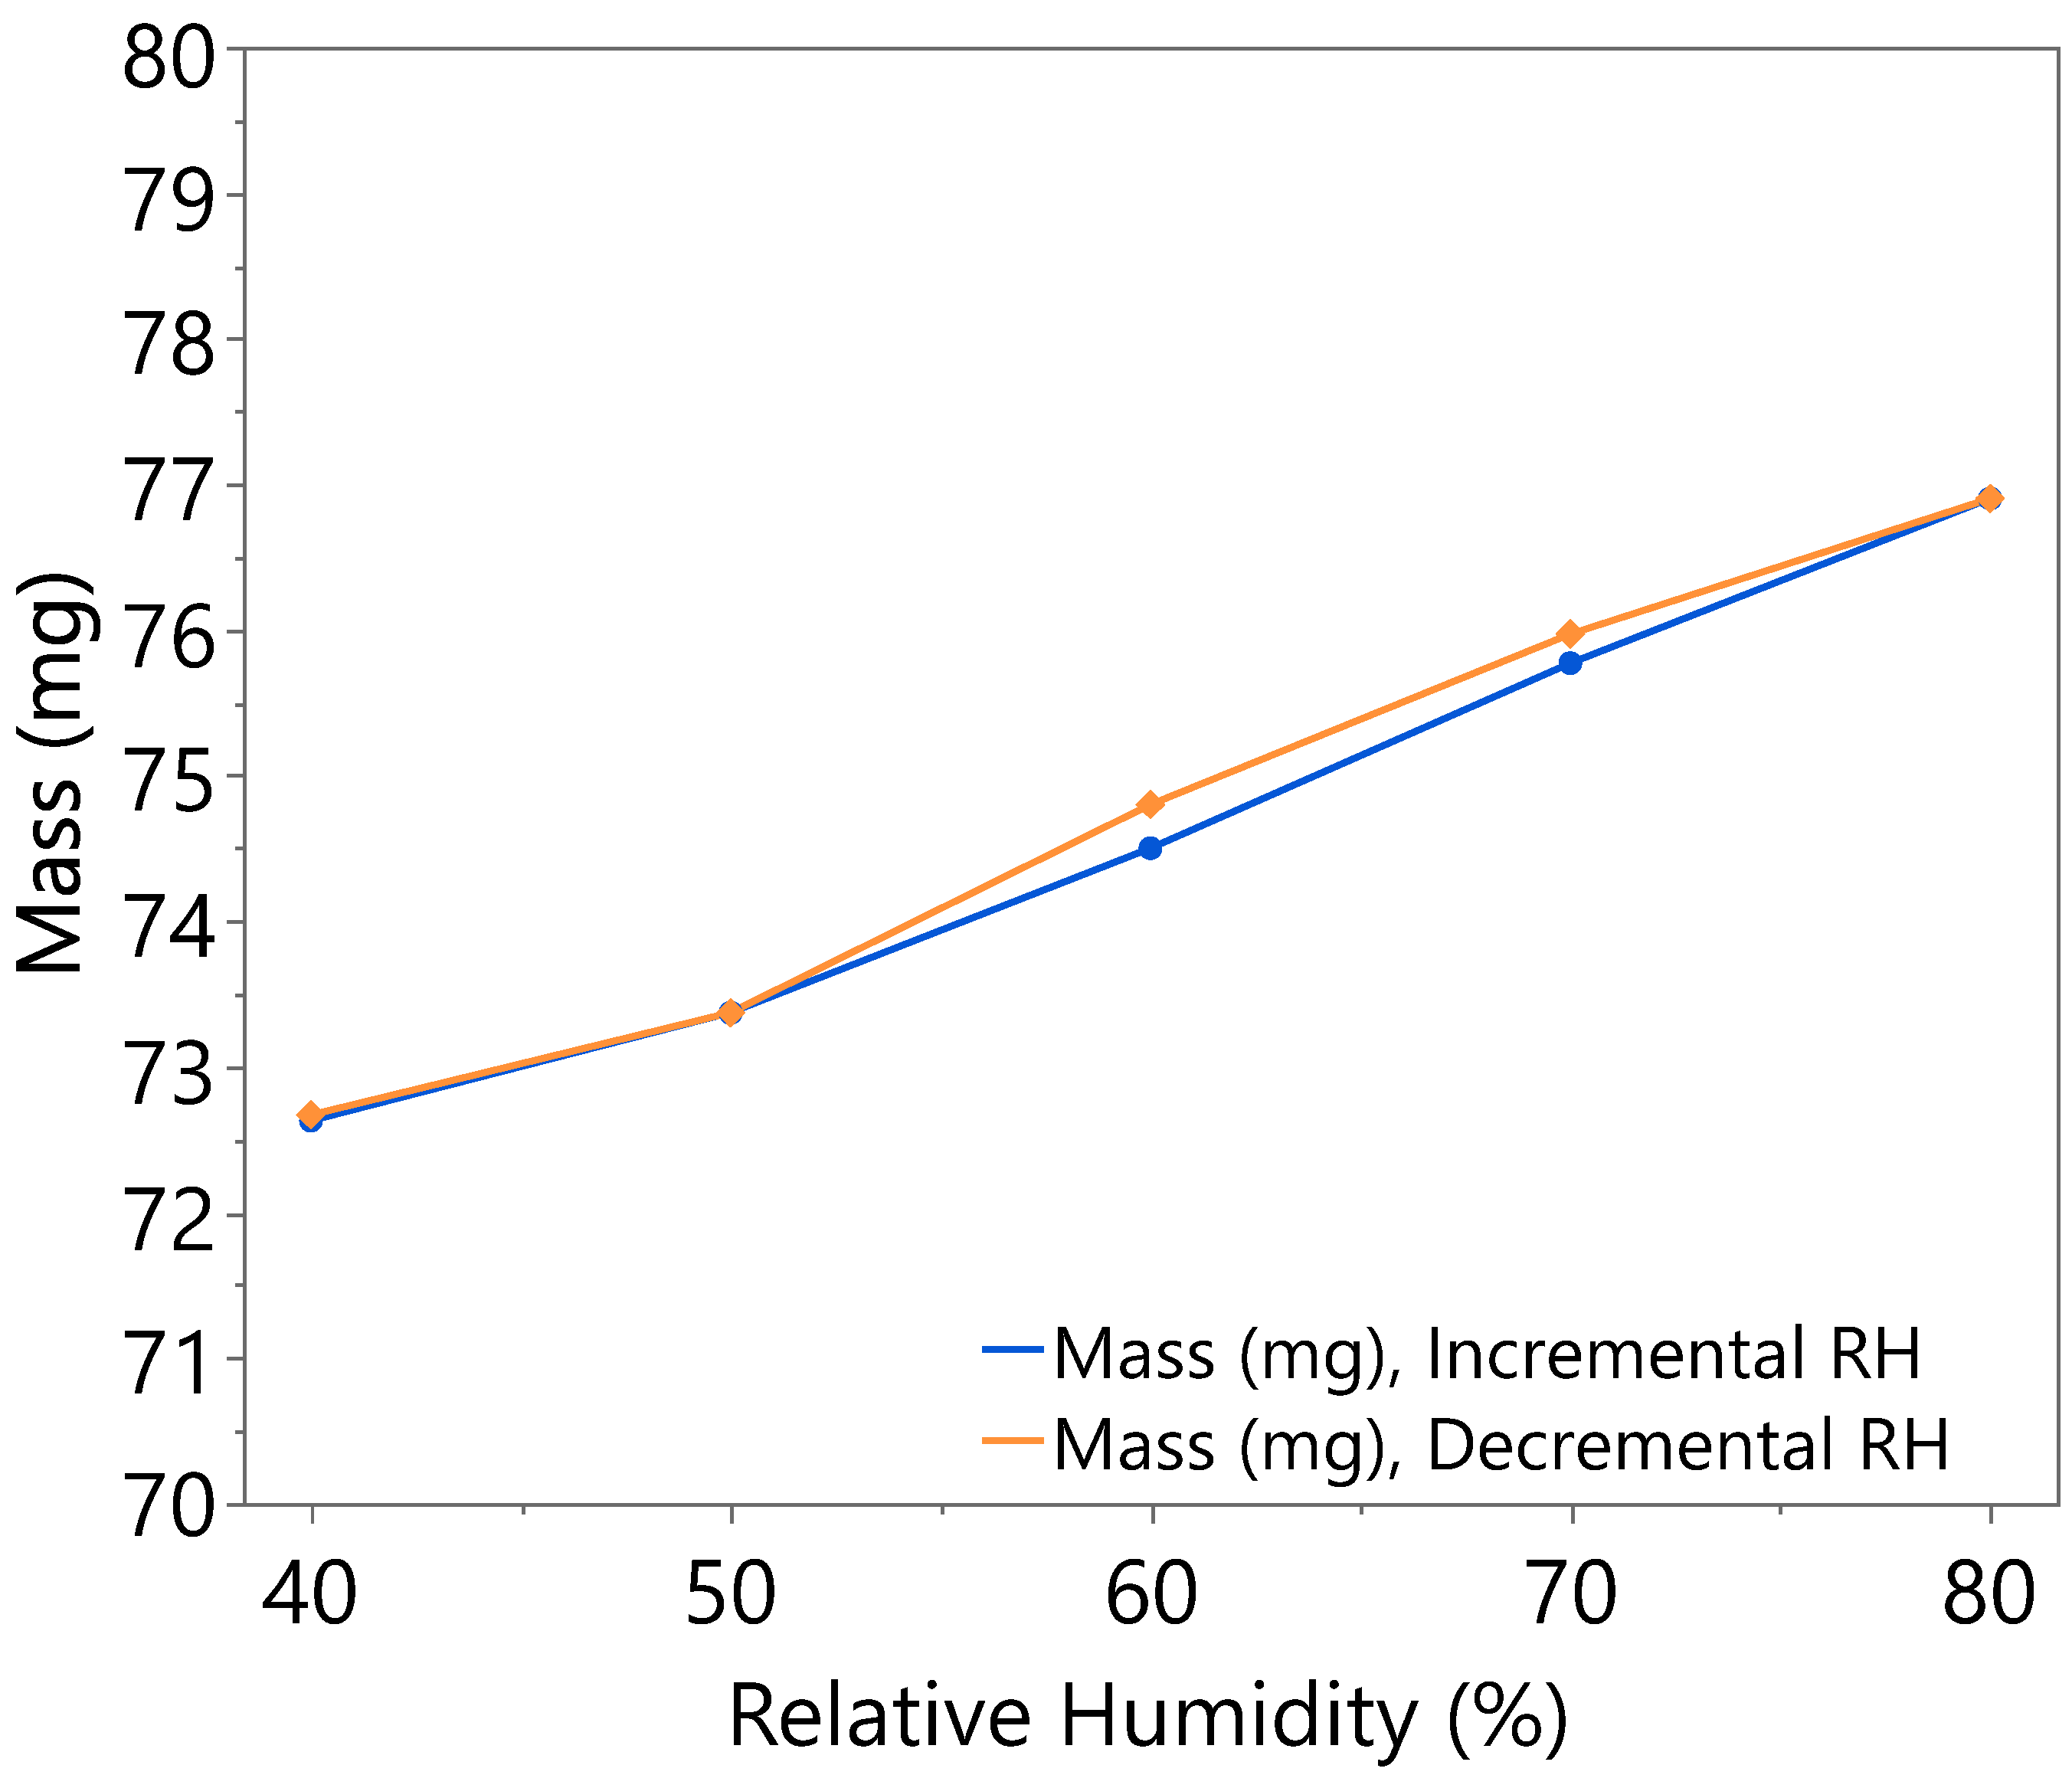
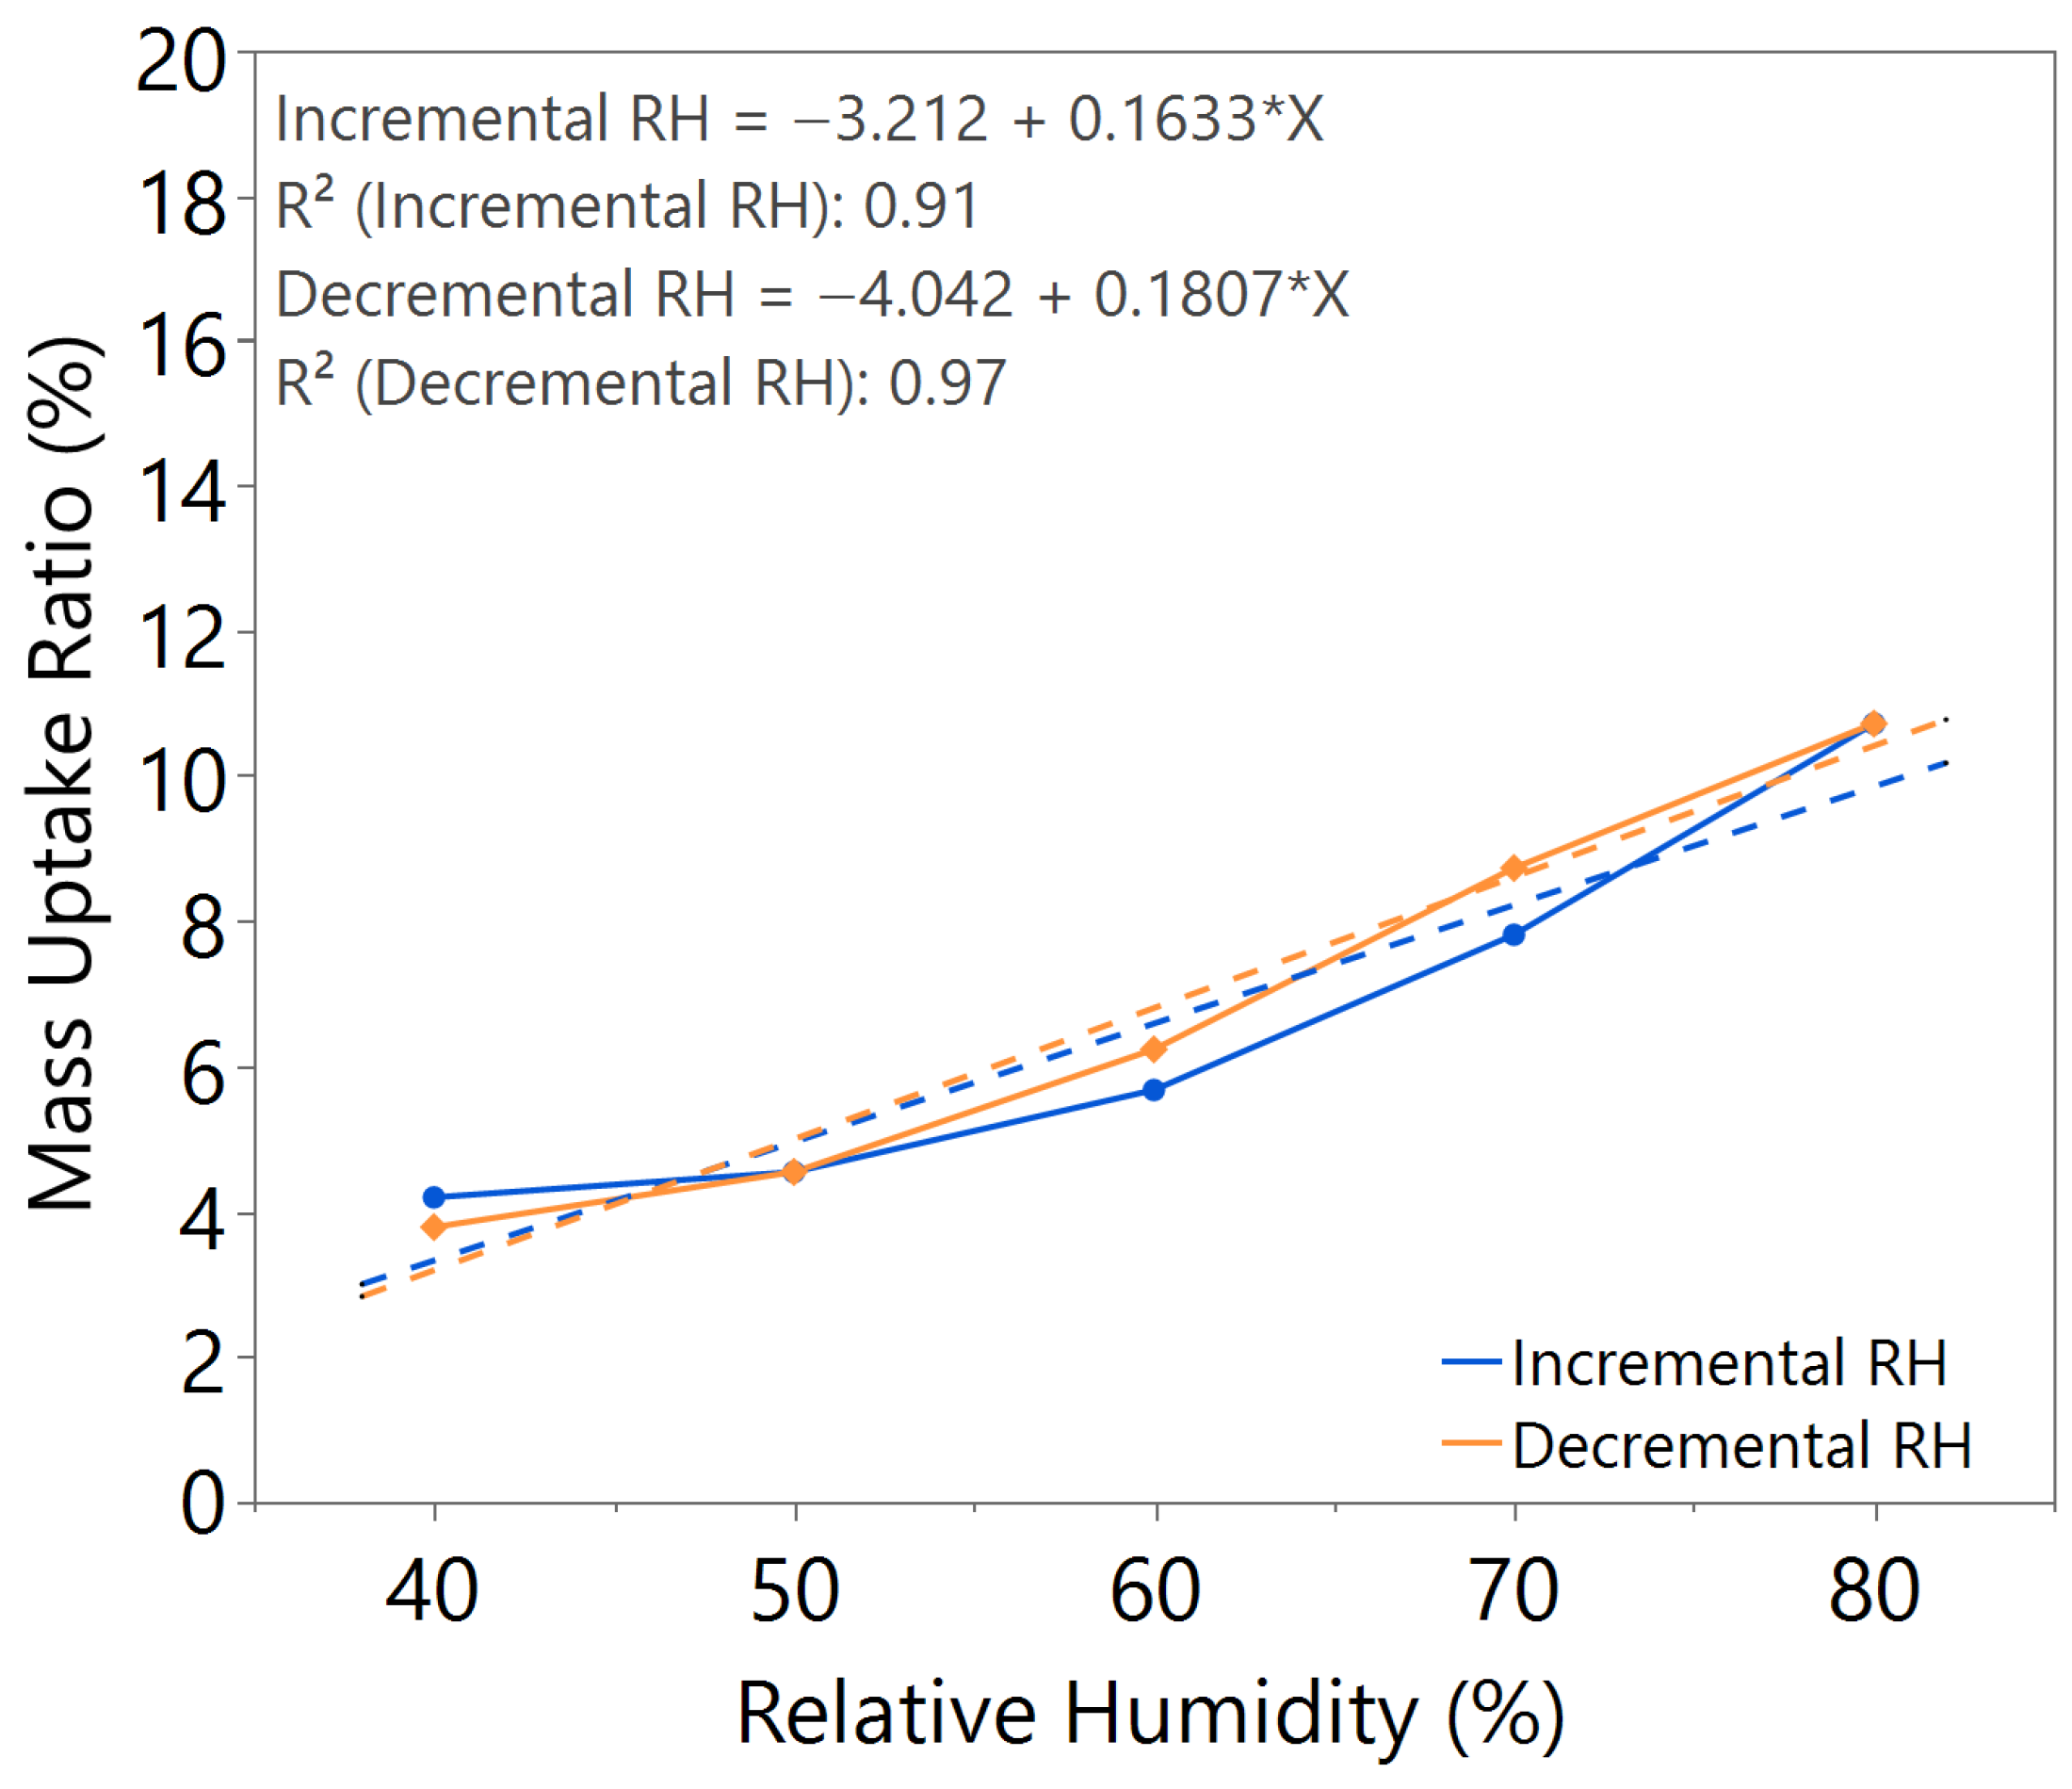
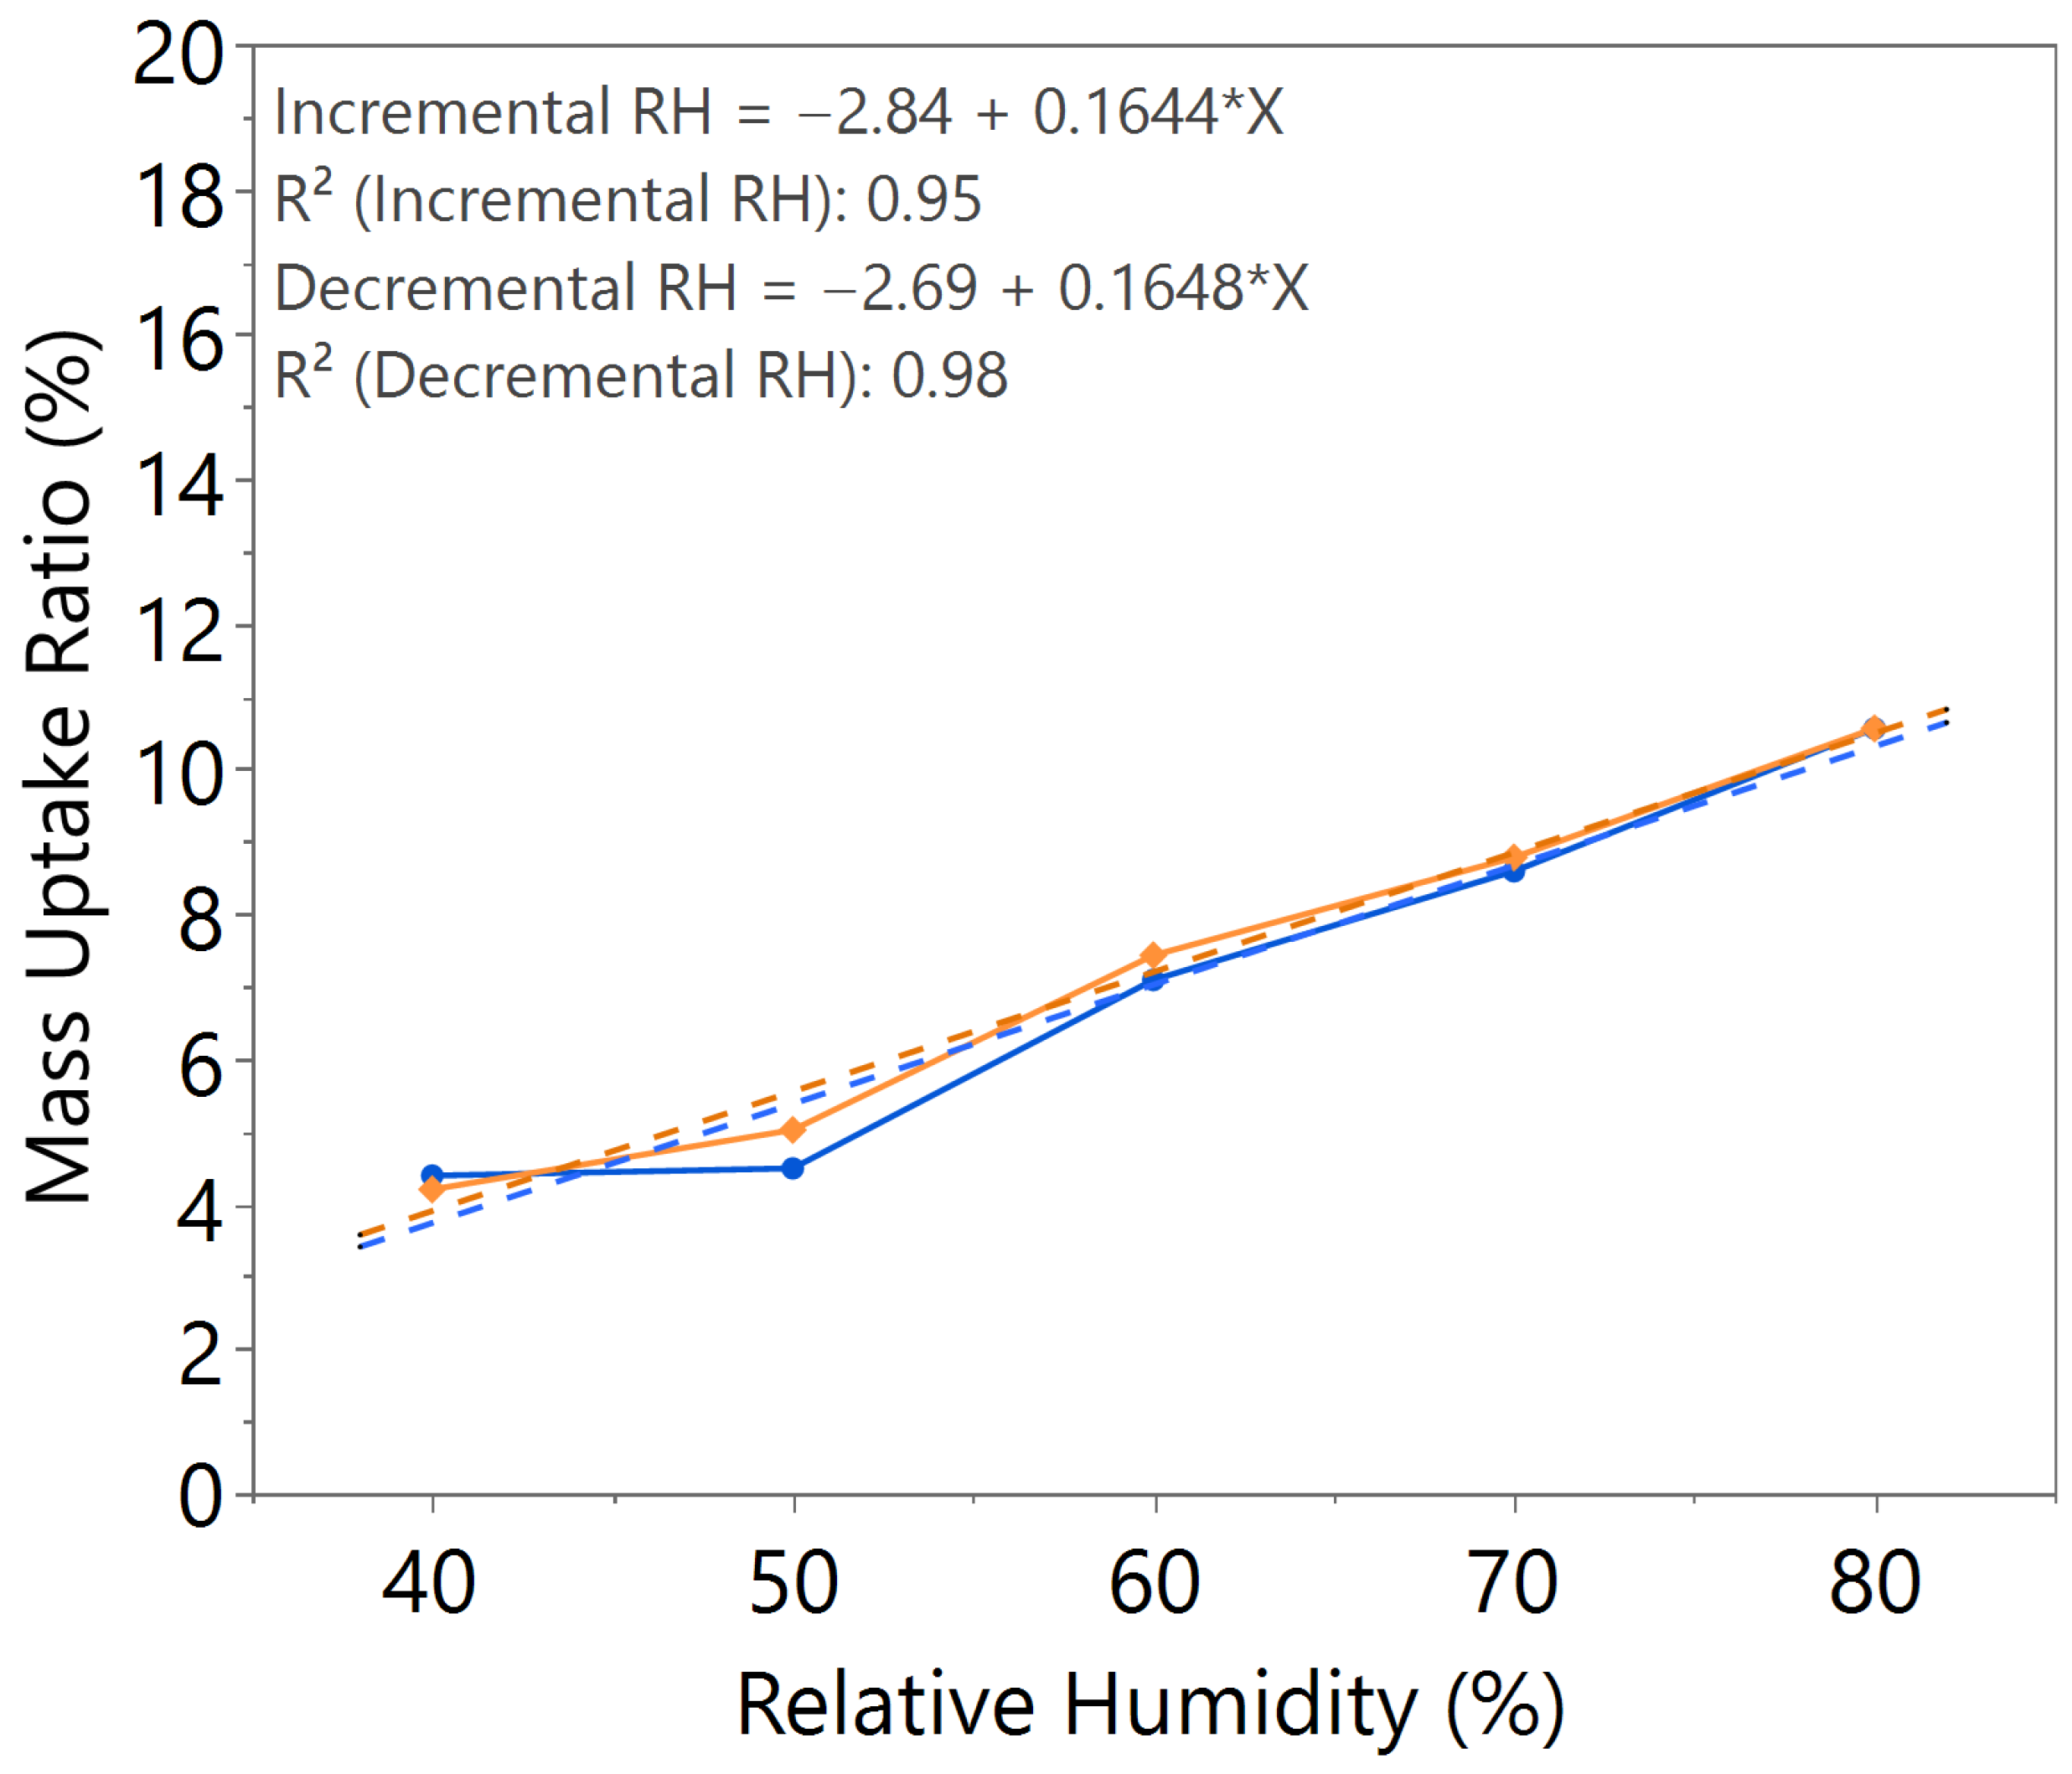
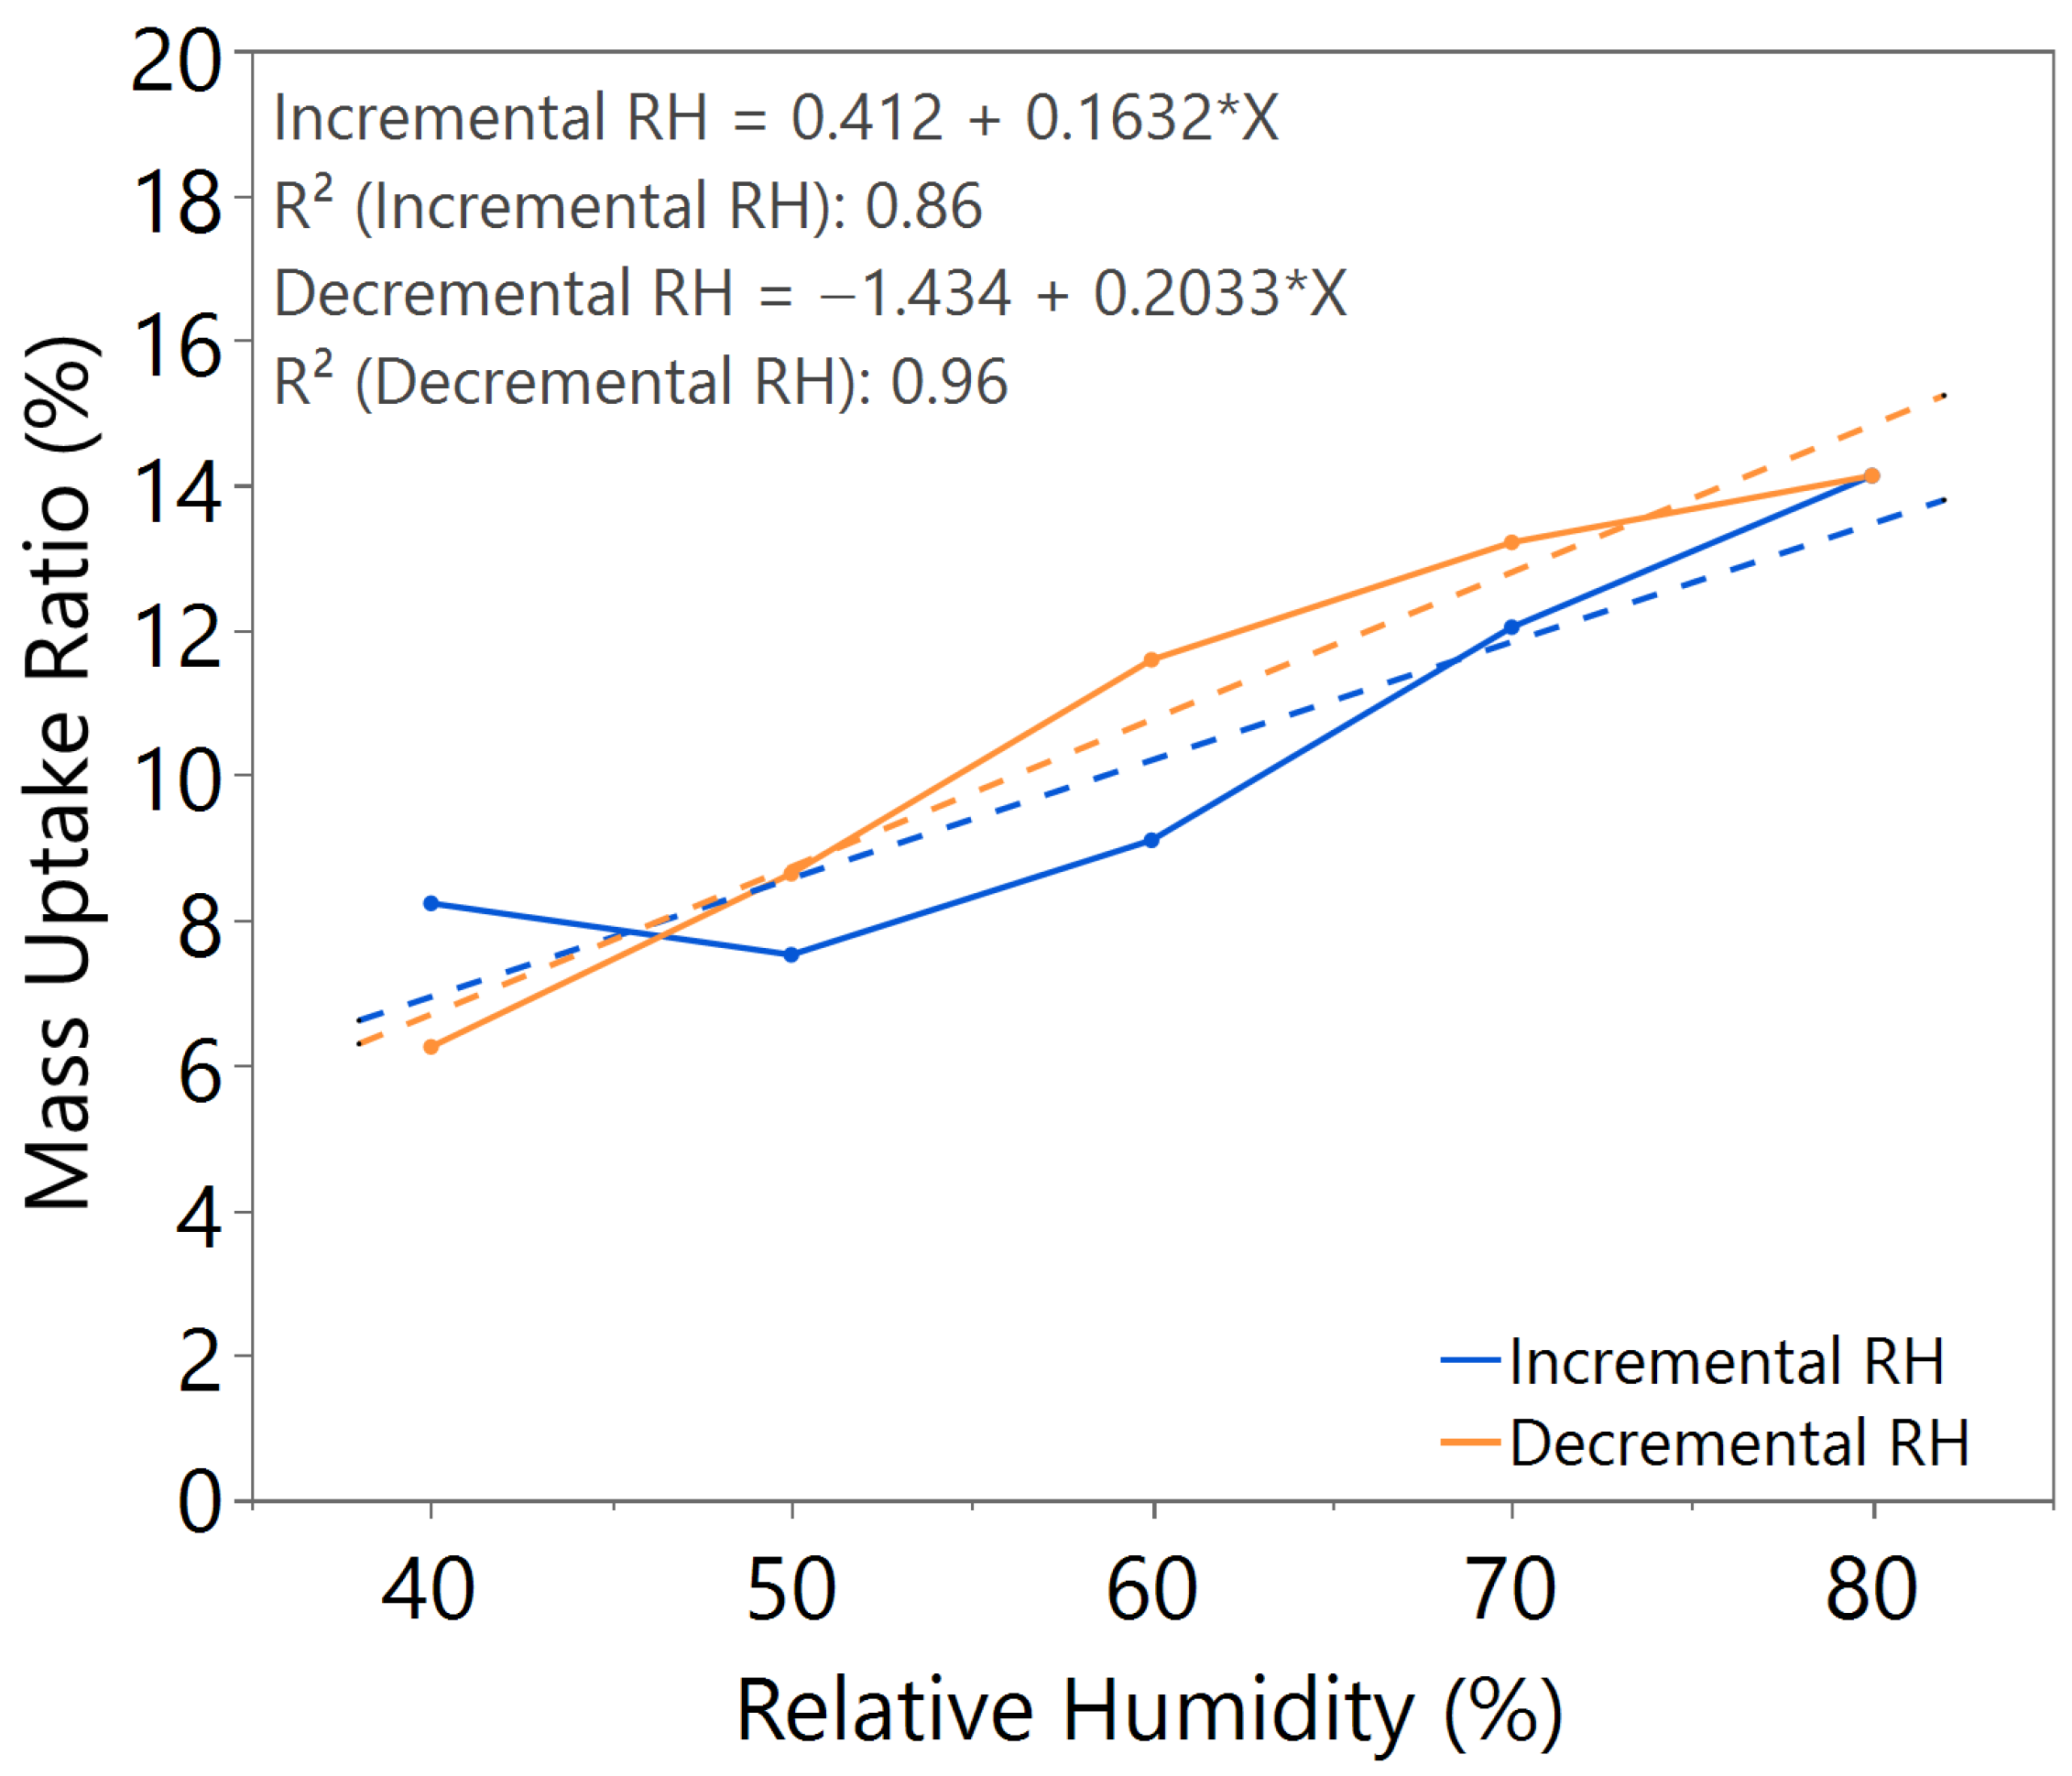
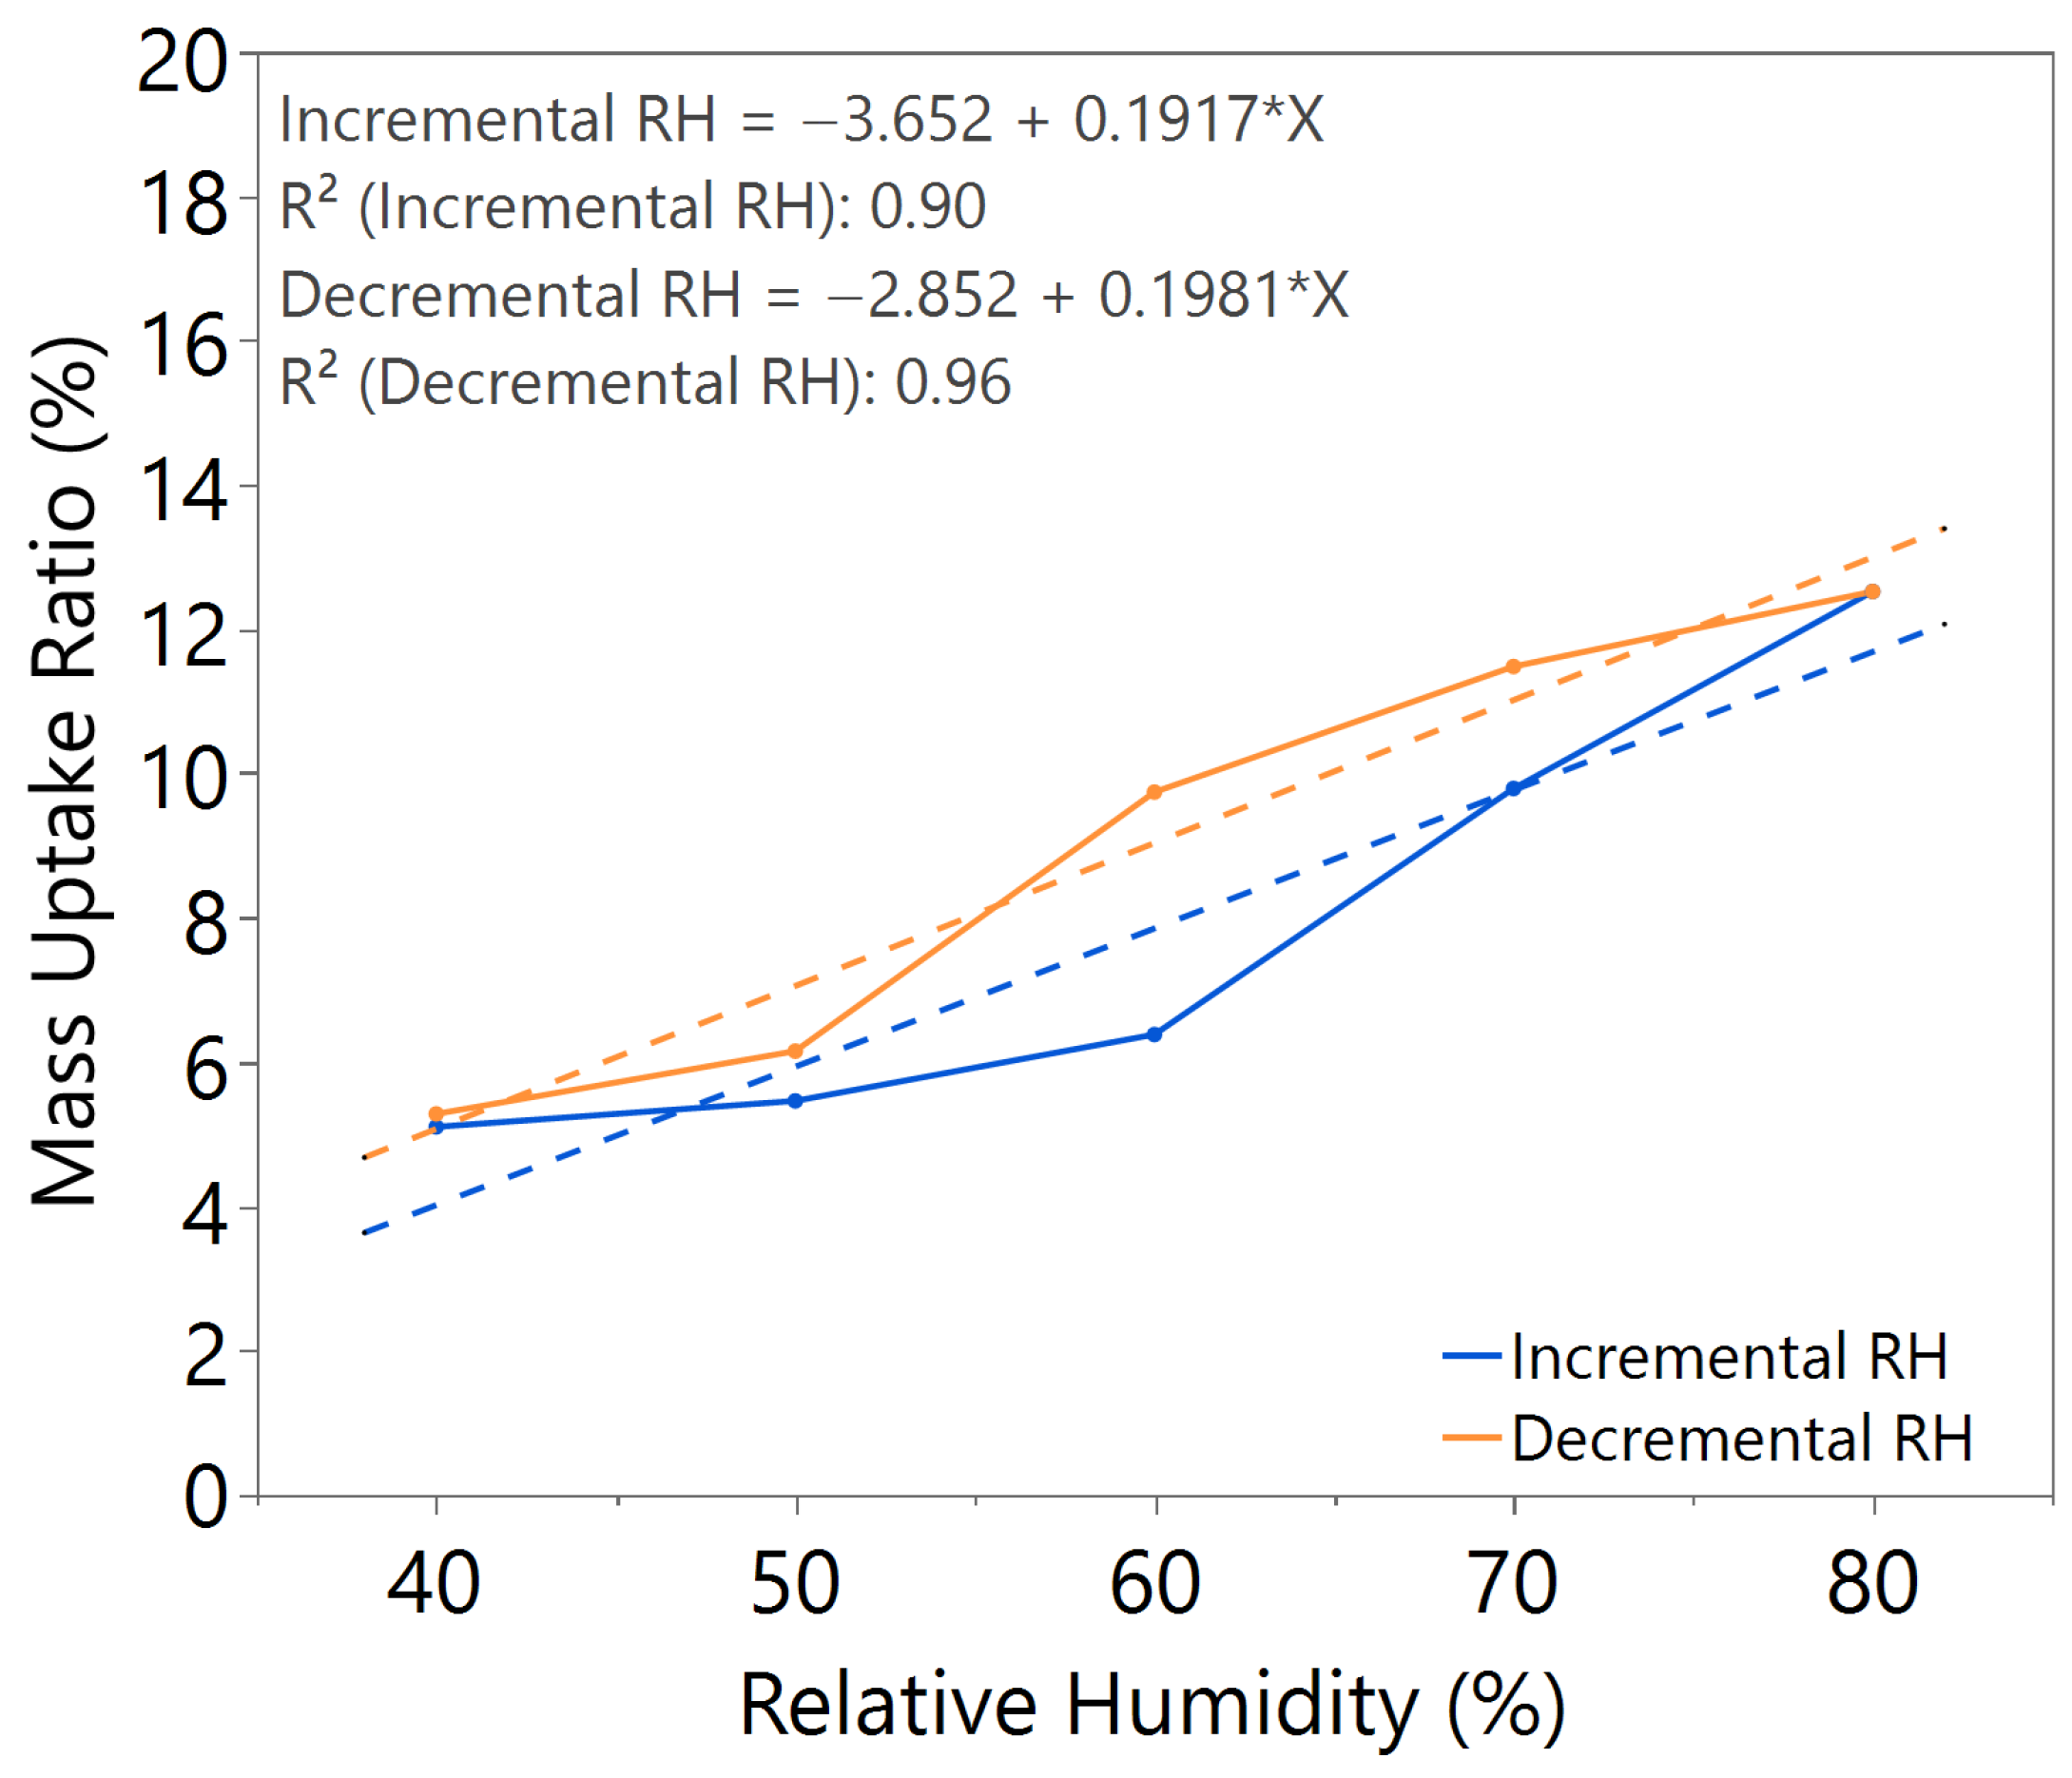
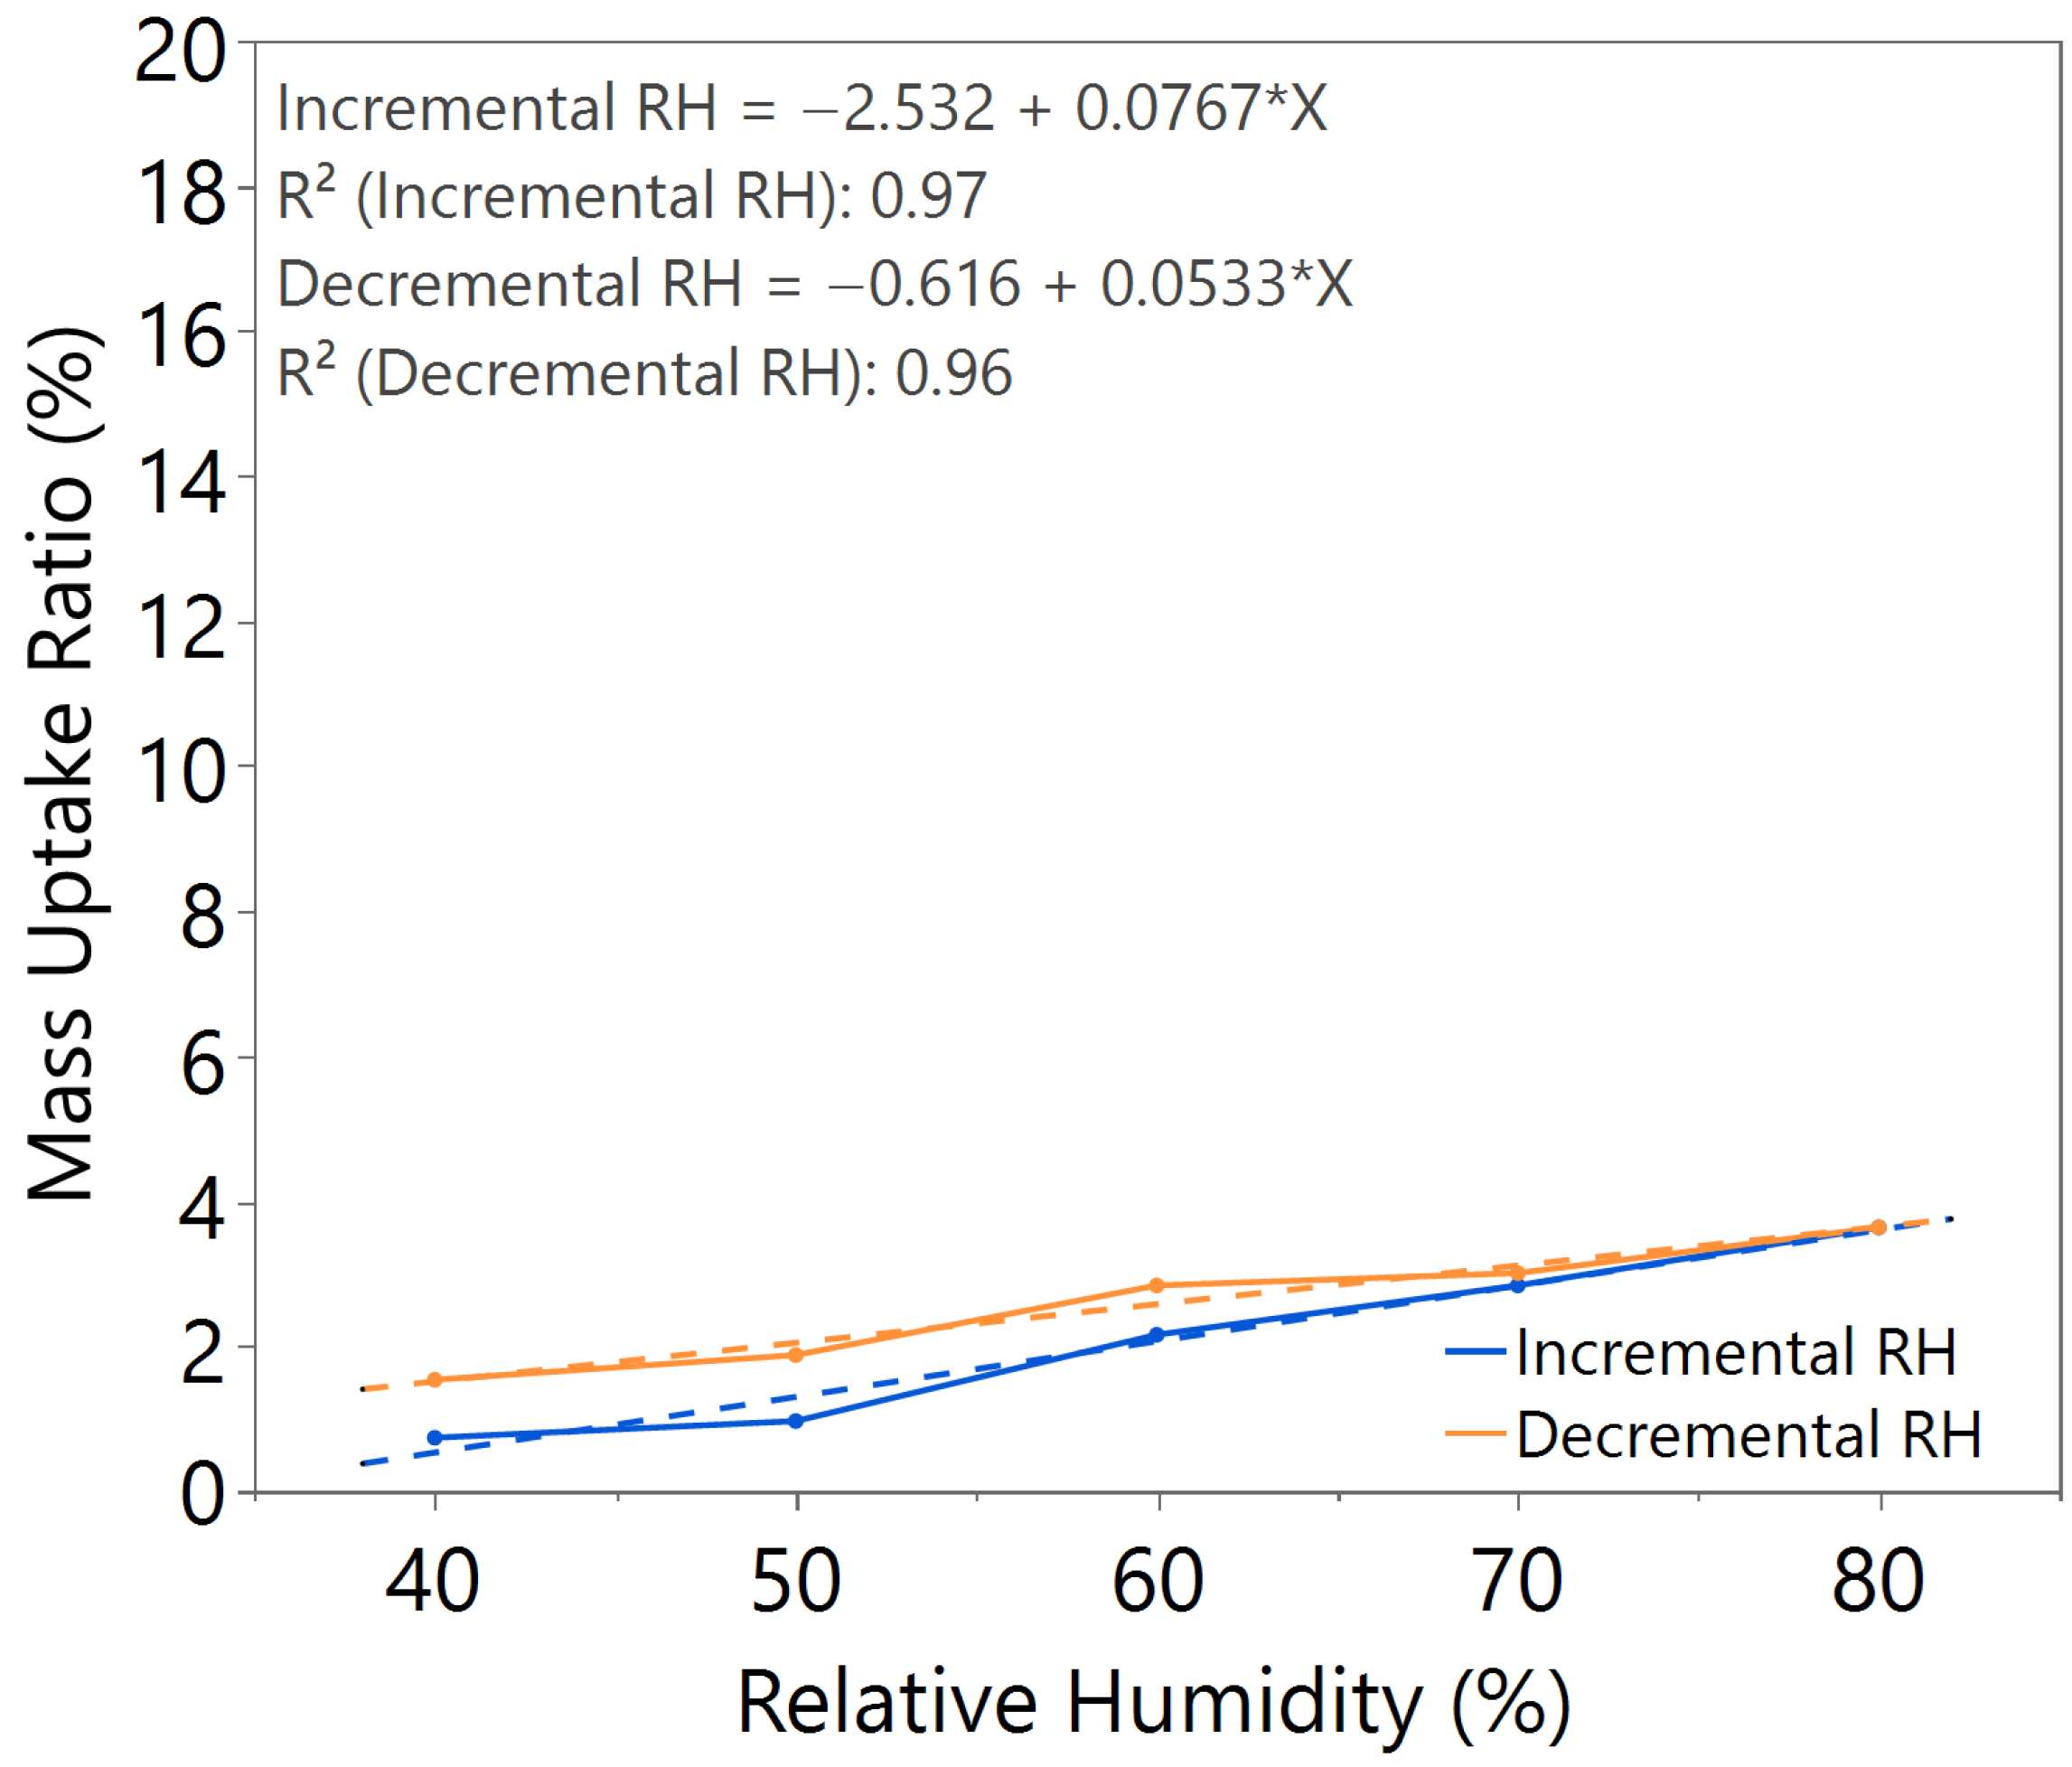
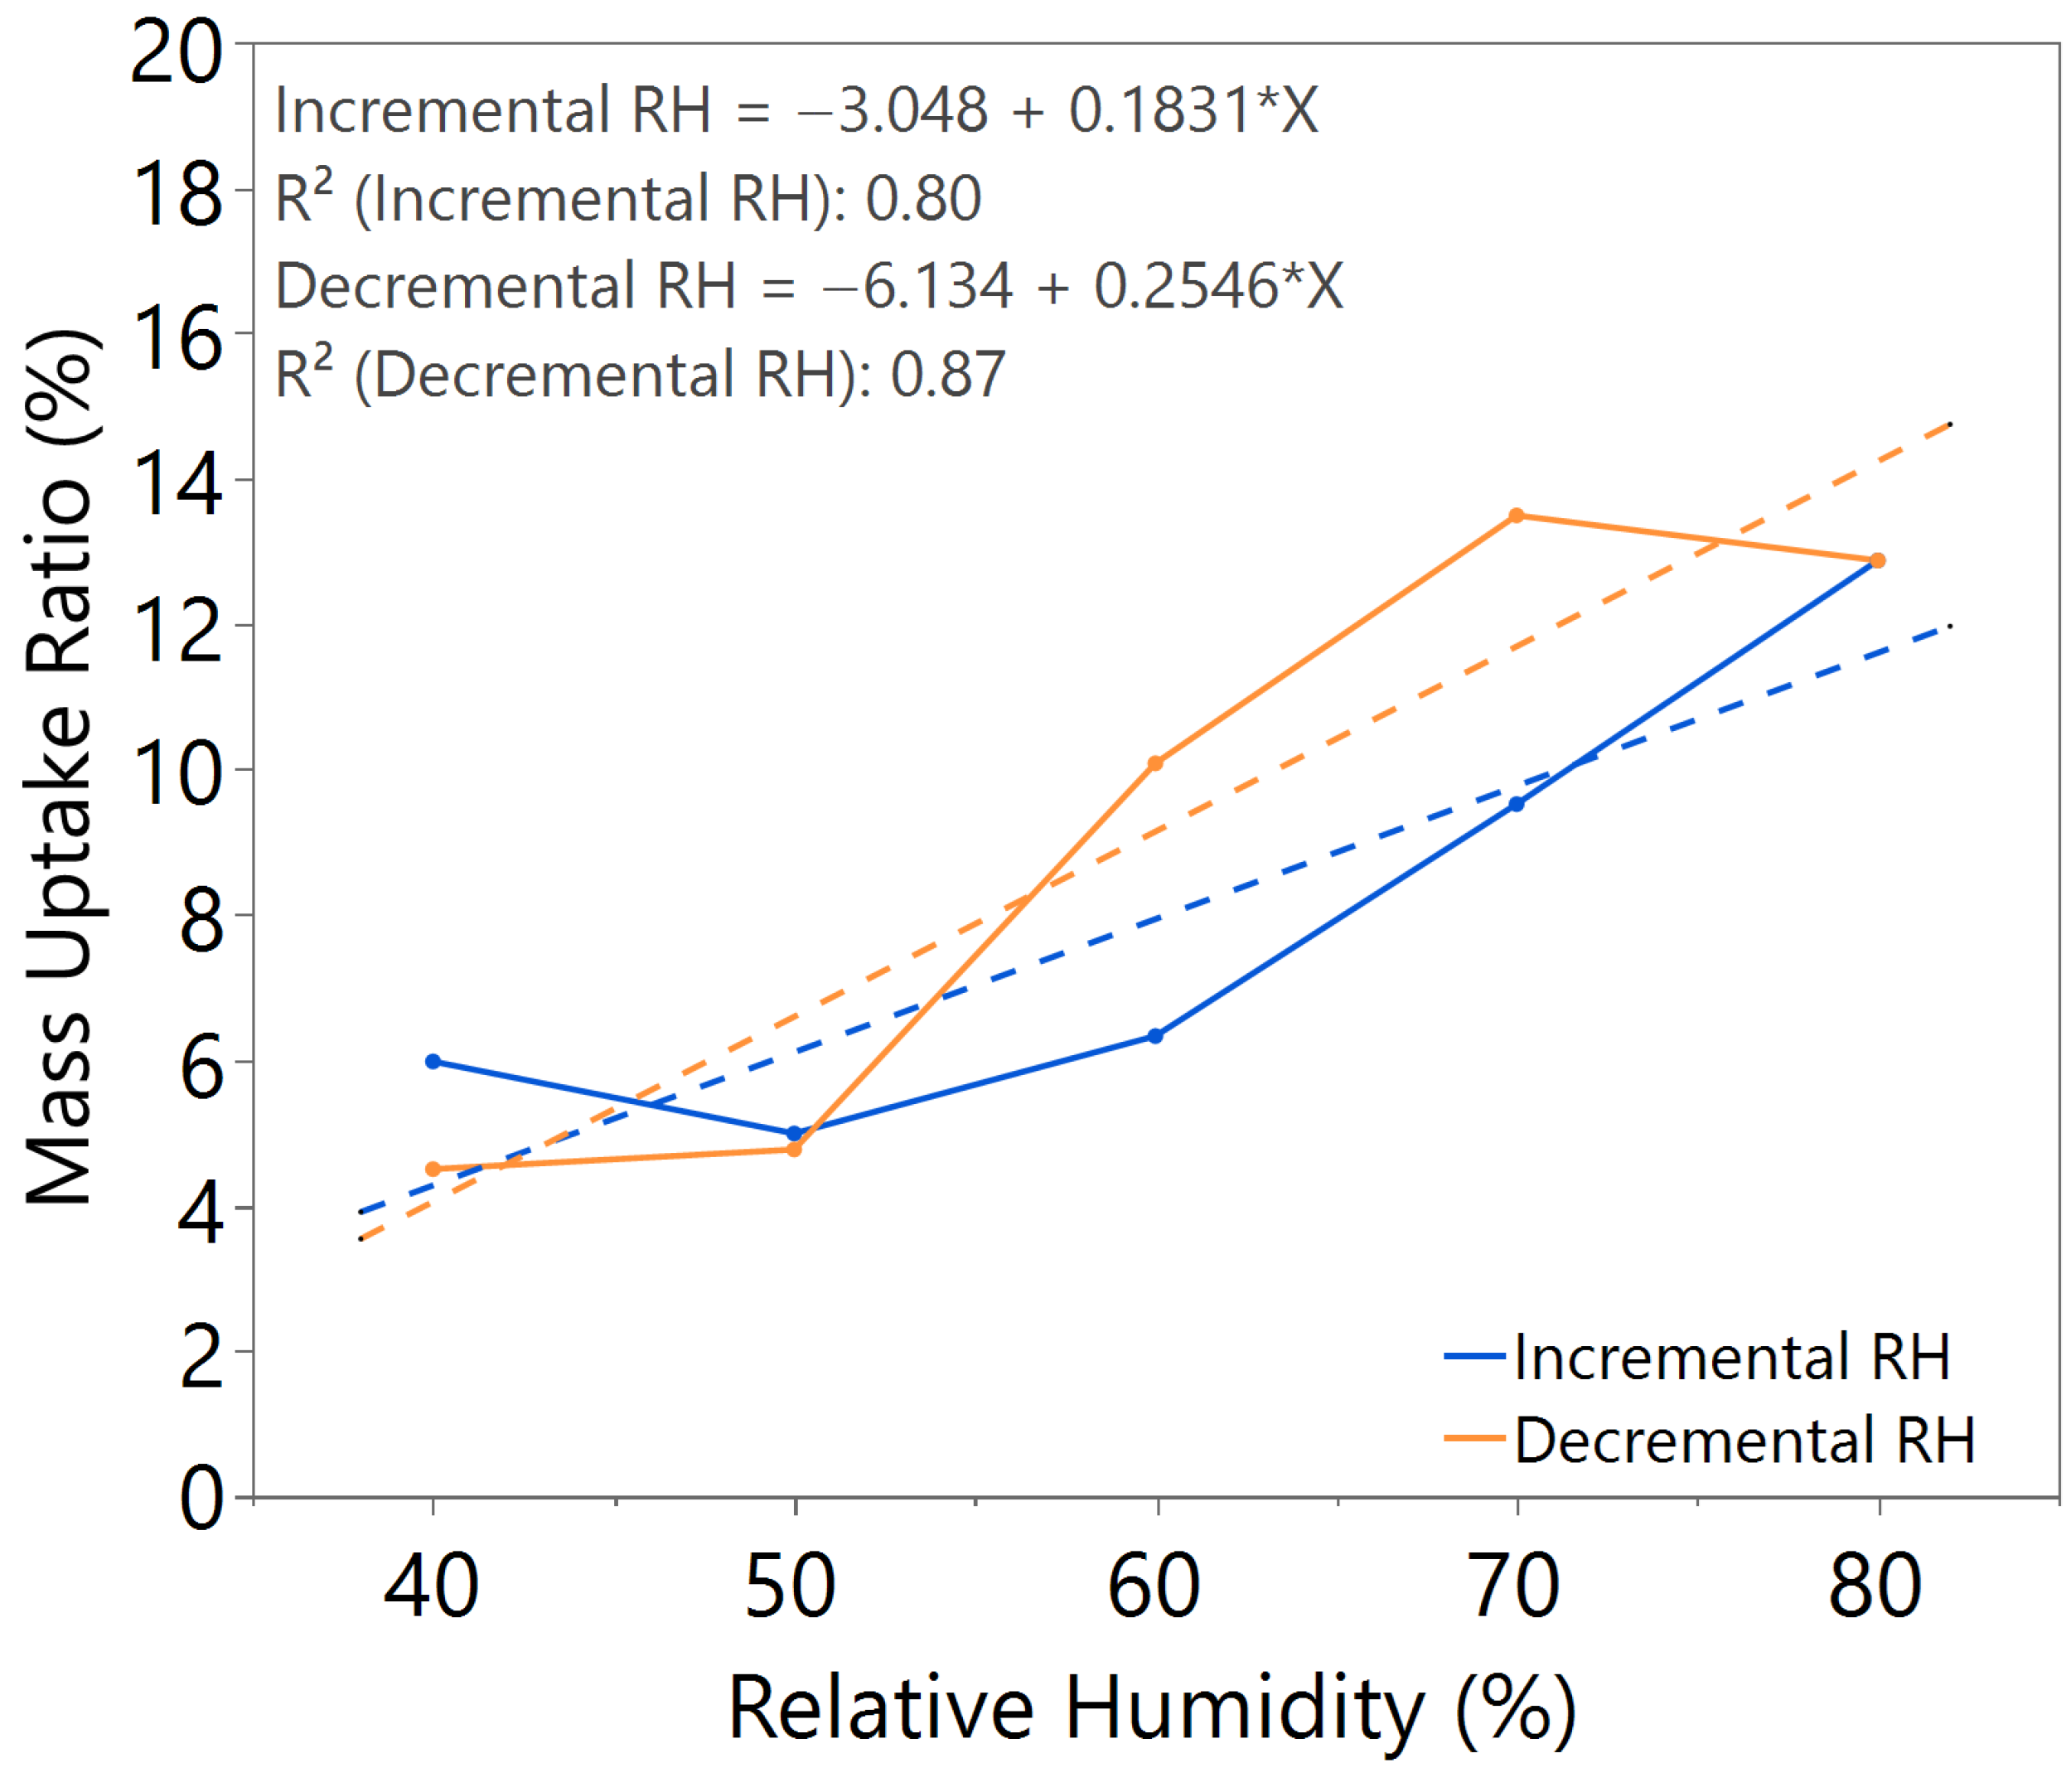
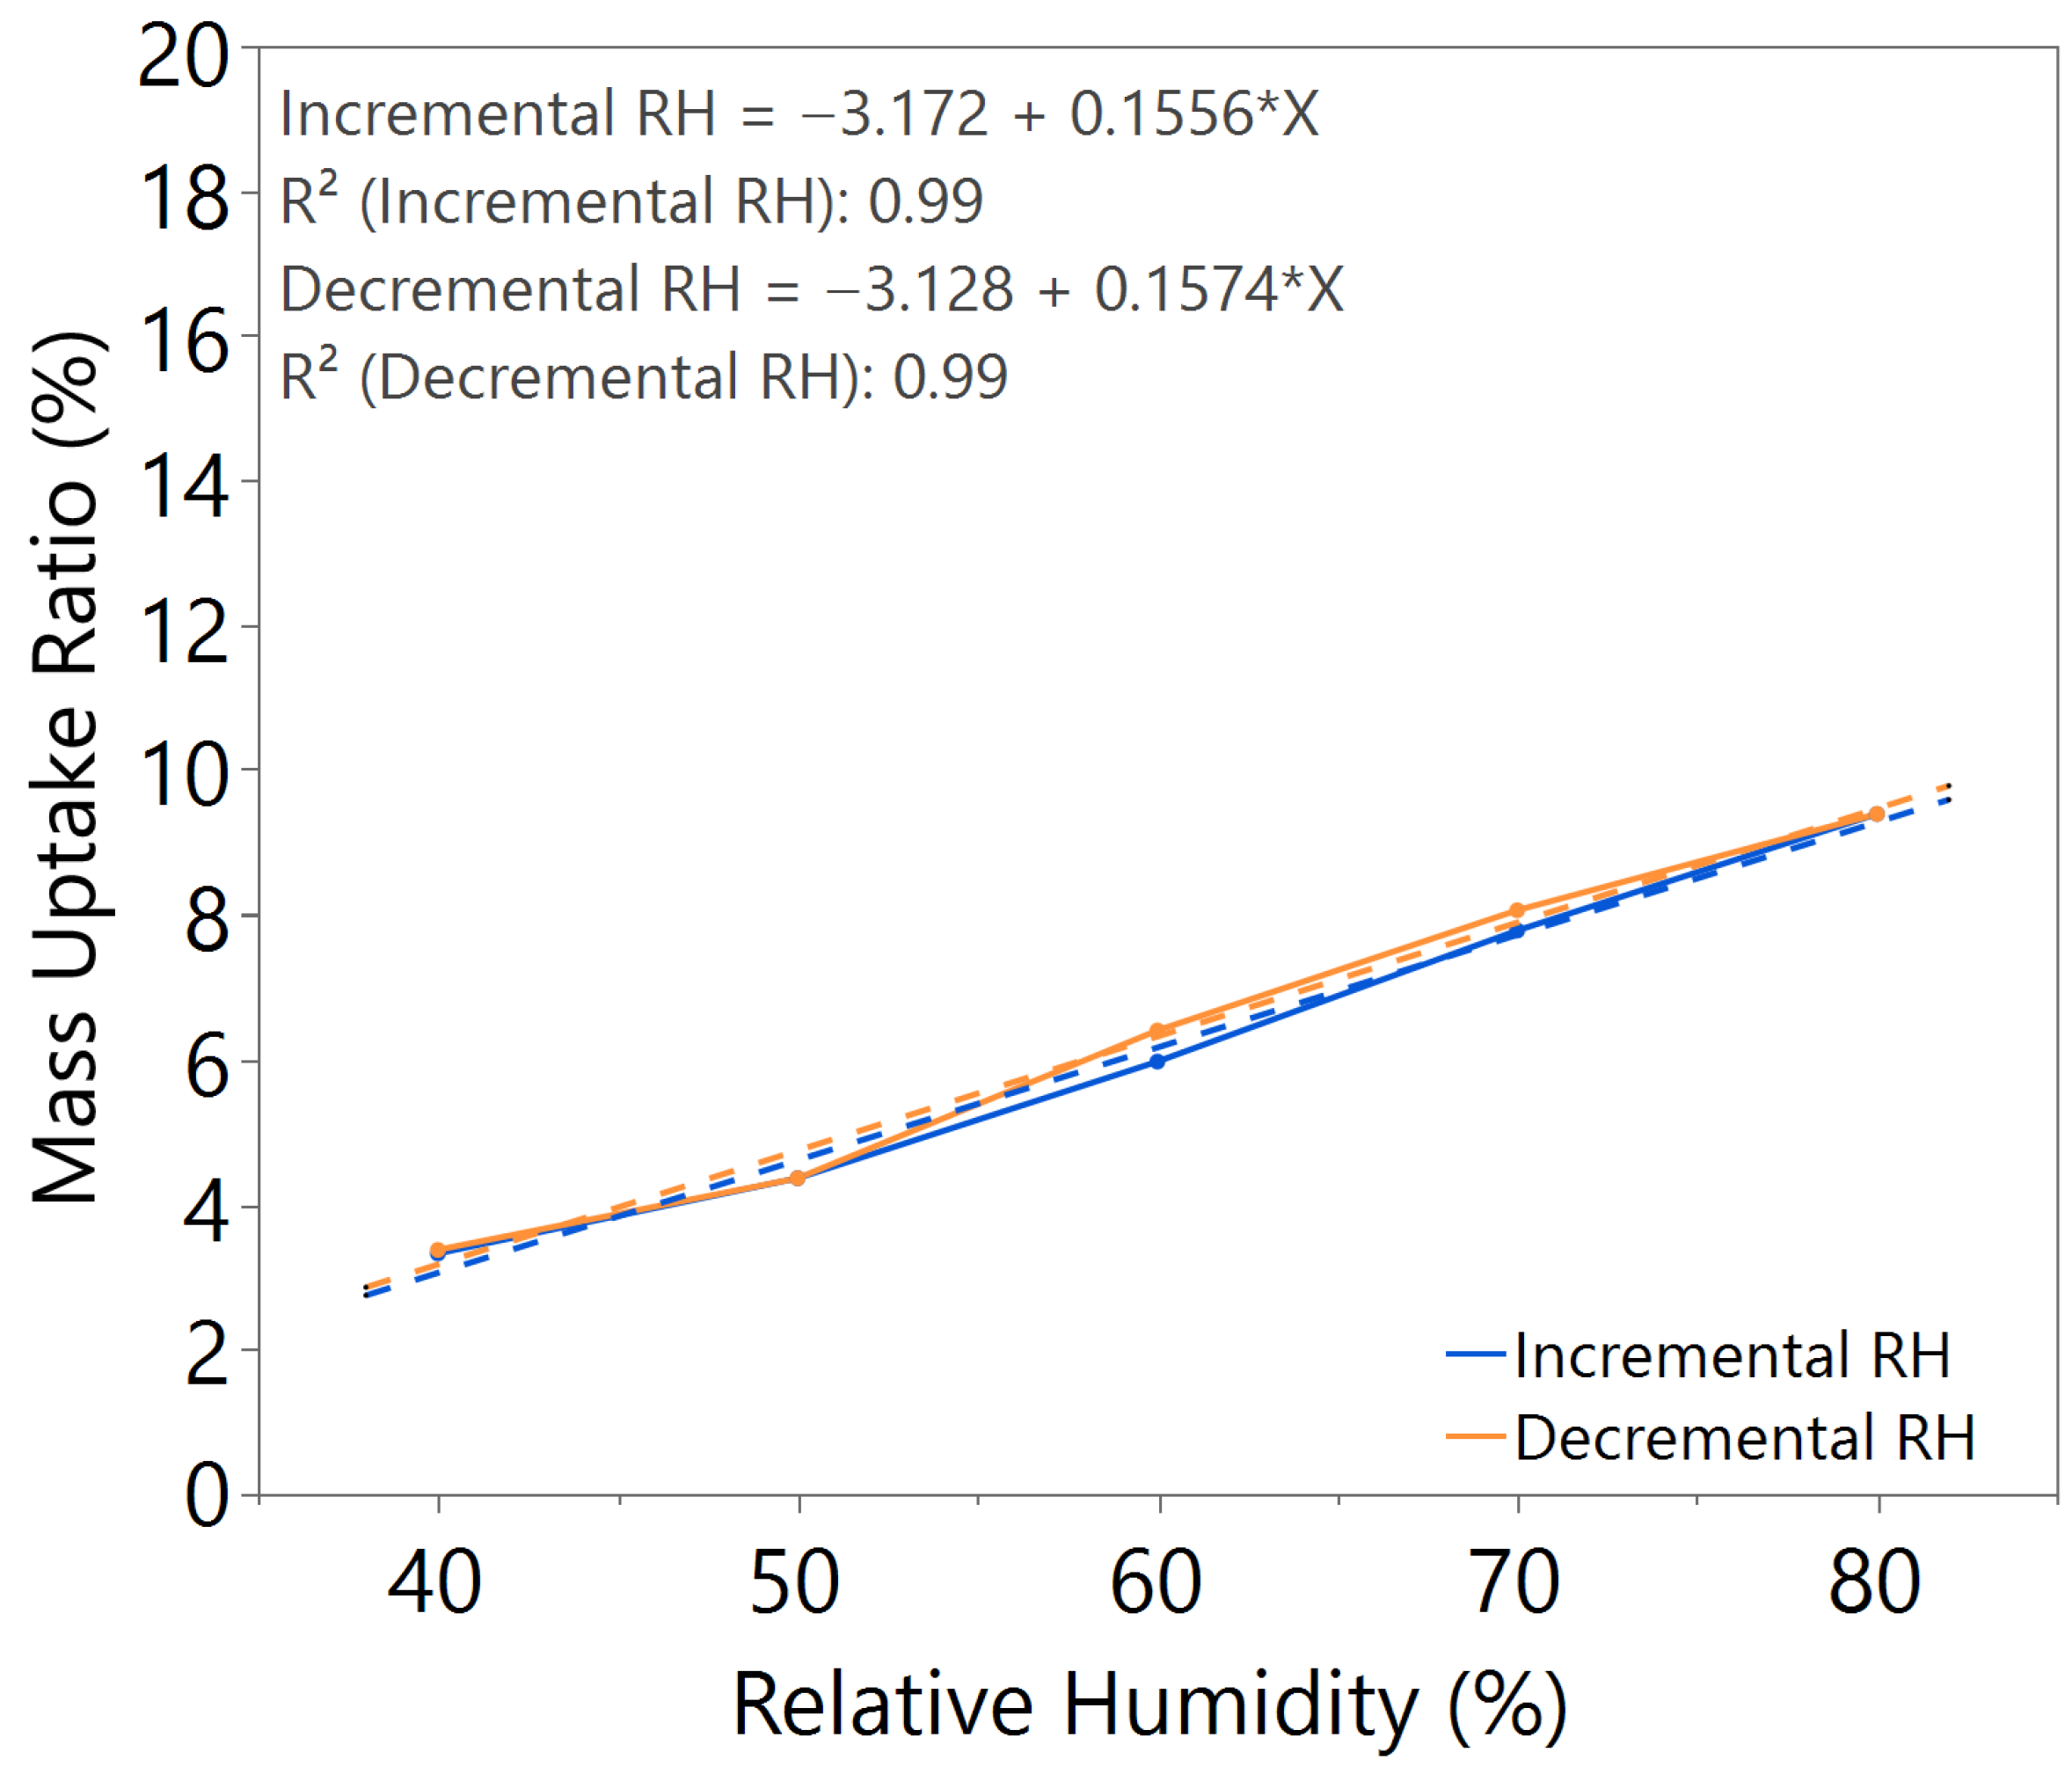
The mass uptake ratio was calculated based on the recorded individual material mass, as illustrated in Figure A1, Figure A2, Figure A3, Figure A4, Figure A5, Figure A6 and Figure A7, by reference to the oven-dried material mass. This ratio quantifies the capability of the nanomaterial in water absorption, adsorption, and desorption. From the linear equation of y = mx + c, the m value represents the slope of the line. A higher m value indicates higher mass change throughout the humidity cycle, demonstrating better hygroscopicity properties of the tested material.
Comparing samples with 2.5 h and 3 h annealing time under the same annealing temperature, as illustrated in Figure 2 and Figure 3, both samples exhibited comparable m value. However, the sample with 2.5 h annealing time shows slightly higher hysteresis compared to the sample with 3 h annealing time, especially at high humidity levels between 60 and 80%RH, where the material mass is unable to return to its original state during decreasing humidity from 80 to 50%RH.
The sample with a 3.5 h annealing time in Figure 4 showed slightly better m value, but significant hysteresis was observed. Similar behavior was observed in the sample with a 3 h annealing time under 100 °C annealing temperature, as shown in Figure 5, where a higher m value led to higher hysteresis. For the sample with a 3 h annealing time under 180 °C annealing temperature, as illustrated in Figure 6, the mass uptake ratio is low, indicating the lowest water uptake with increasing RH. The sample also showed increased hysteresis throughout the humidity cycle.
From the comparative study of all the samples, a 3 h annealing time with 140 °C annealing temperature showed the most significant water–surface interaction, with an m value of approximately 0.16. The samples exhibited negligible hysteresis, indicating that an optimal annealing time and temperature led to the formation of a nanostructure with improved humidity sensing properties, as illustrated in Table 2.
The samples with a 3-layer coating were synthesized based on the optimal annealing time and temperature. From the hygroscopicity test results, as shown in Figure 7, a significant increase in m value and hysteresis was observed. Whereas for hybrid layer coating, the m value and hysteresis were comparable with those of single-layer SnO2-HMT under 3 h 140 °C annealing conditions, as demonstrated in Figure 8, indicating the ZnO interlayer has minimal impact on the humidity sensing properties of the top coating layer. This could be due to ZnO not affecting the surface morphology of the top-layer nanostructure. Therefore, both hybrid layer coating and single layer coating shared similar porous structures, which contribute to improved water adsorption and desorption mechanisms, leading to minimal hysteresis.

3.2. Fourier Transform Infrared Spectroscopy (FTIR)

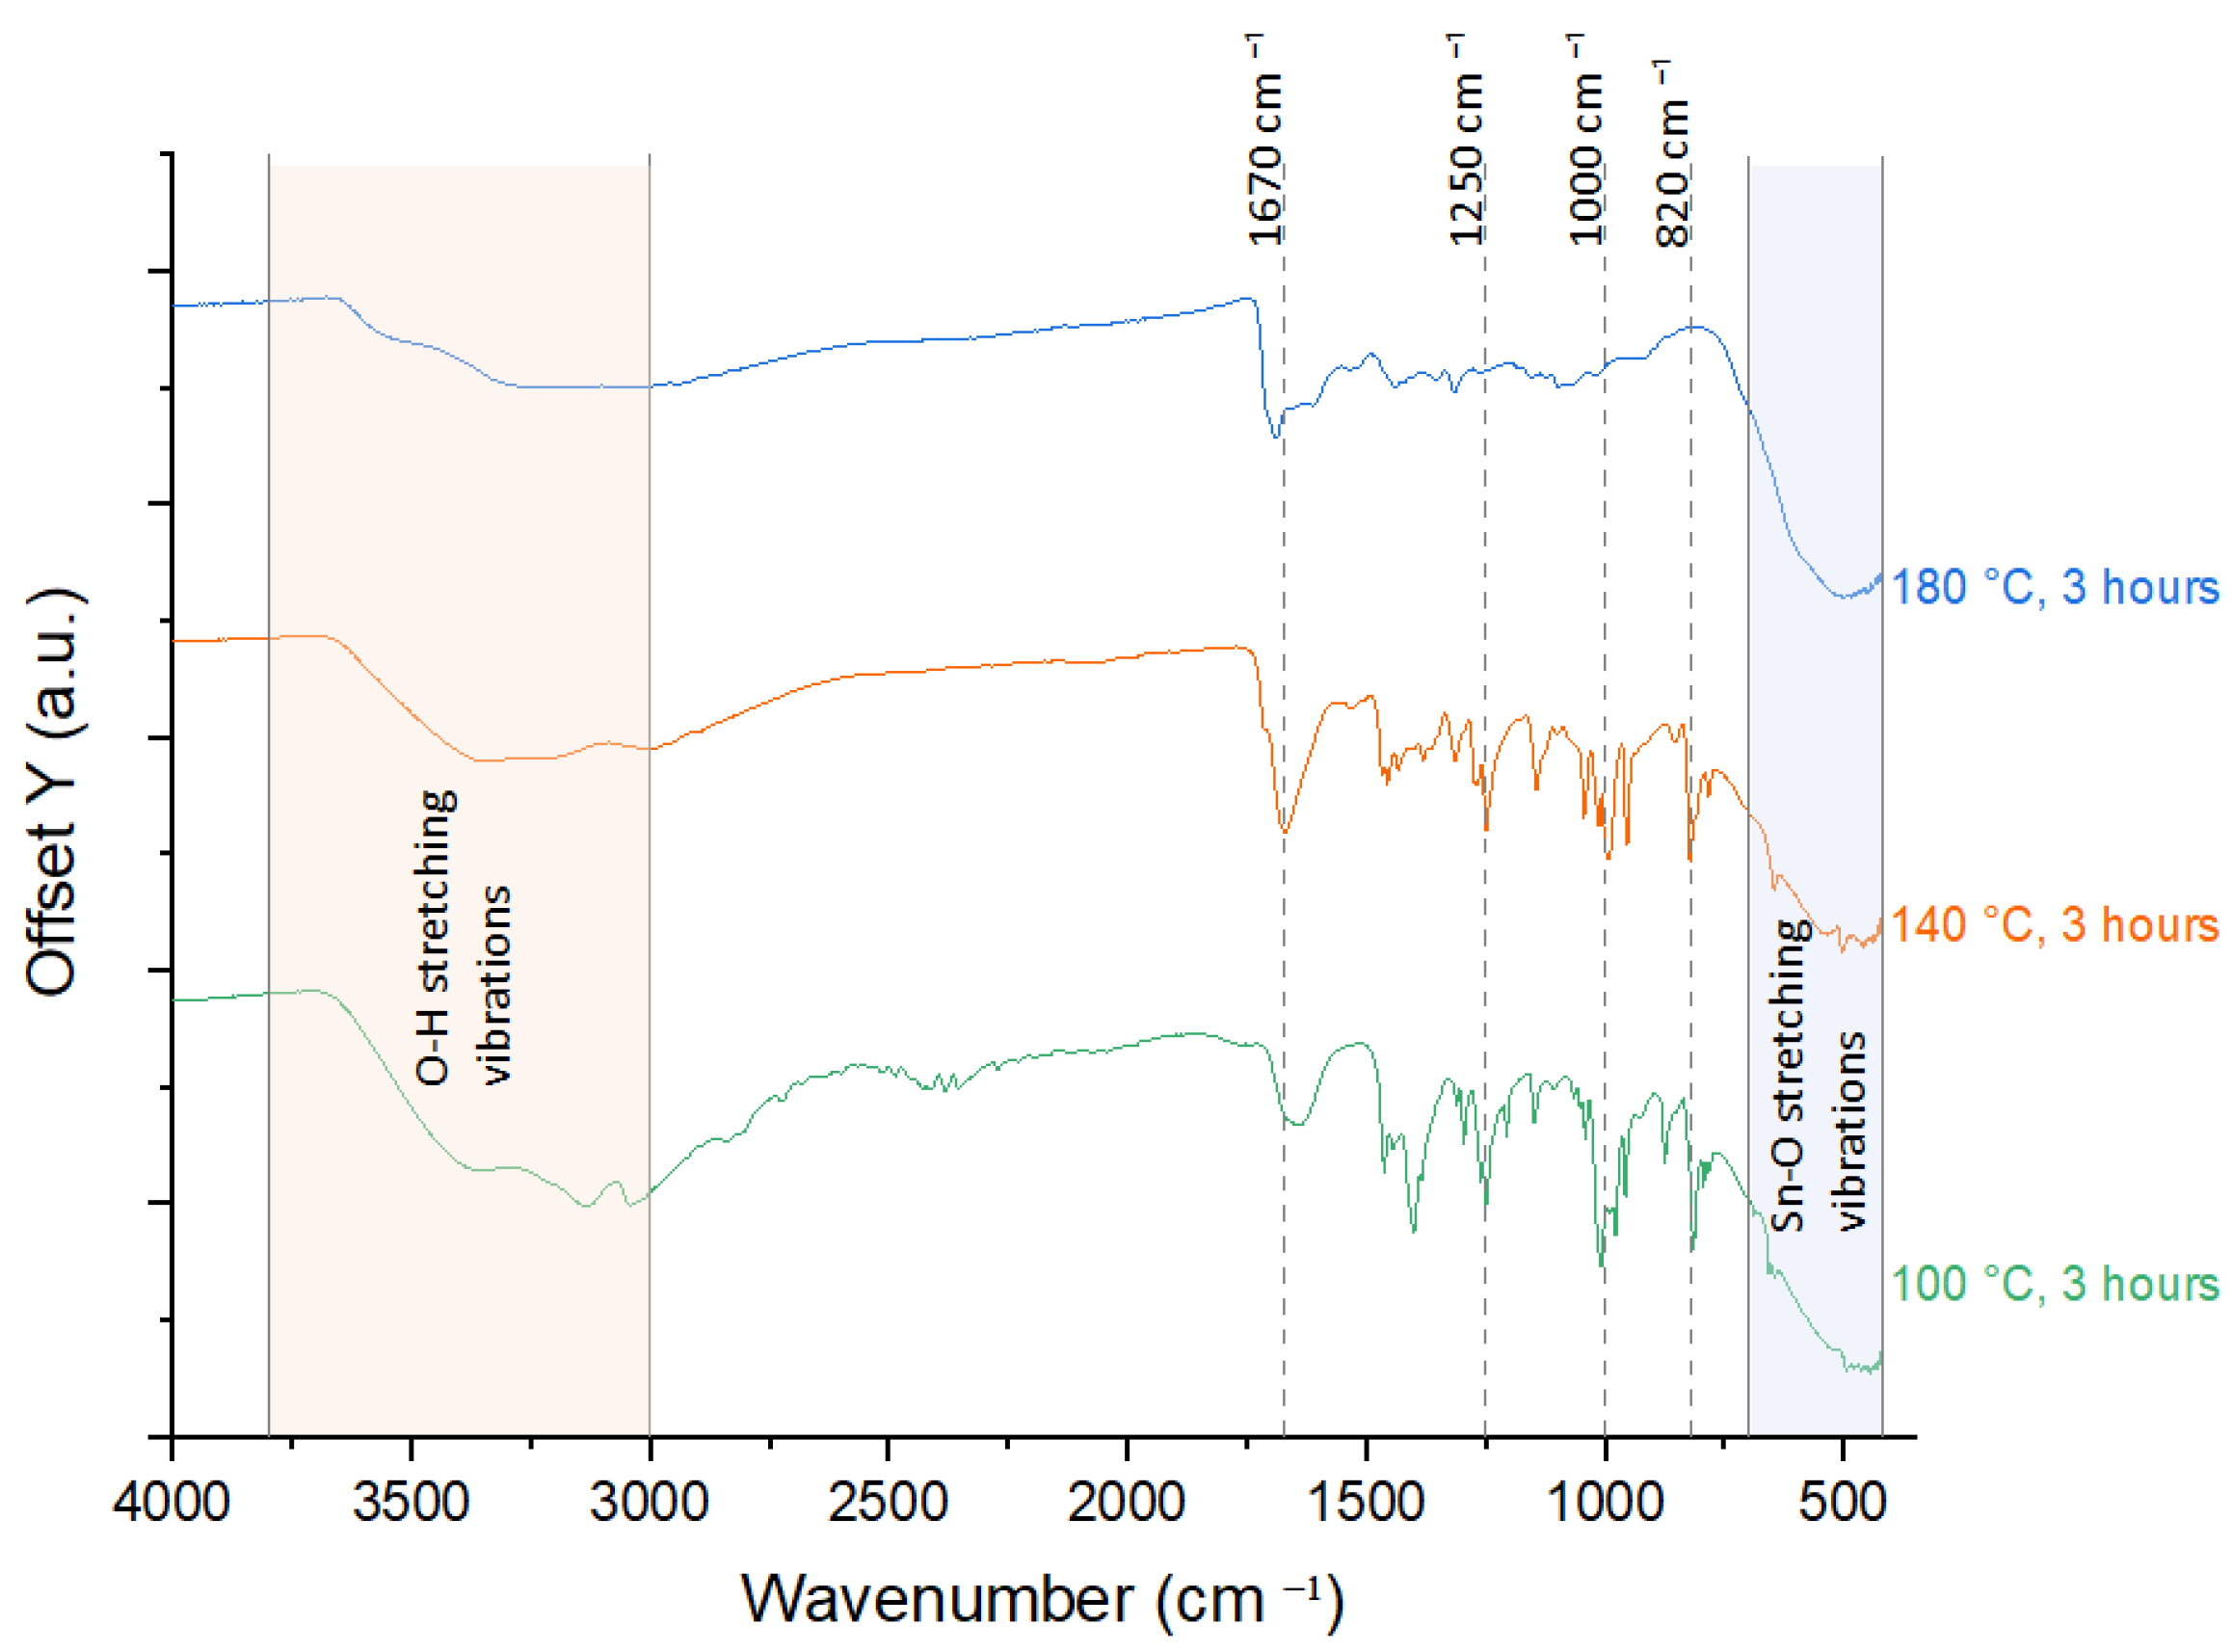
The FTIR, ranging from 4000 to 420 cm−1, identified the O-H stretching, interaction between HMT and SnO2, and Sn-O stretching vibrations. Broad peak in the range of 3000–3800 cm−1 is attributed to the stretching of hydrogen-bonded O-H groups from moisture adsorption on the surface of synthesized nanostructures. Strong peaks within the range of 400–700 cm−1 are attributed to the Sn–O stretching vibrations and the O–Sn–O bending vibrations of SnO2-HMT. Whereas peaks at ~820 cm−1, ~1000 cm−1, ~1250 cm−1, and ~1670 cm−1 correspond to the out-of-plane C-N stretching, O-H bending, and C-O stretching vibration of the functional groups of HMT, indicating interaction between HMT and SnO2.
From the comparative study in Figure 9 and Figure 10, all samples showed strong O-H stretching with a broad peak observed from 3000 to 3800 cm−1, except for the sample annealed at 180 °C for 3 h, which showed a rather flat peak in this range. The broad O-H stretching peak represents the presence of hydrogen bonding interactions between the samples and water [32]. The flat peak in the sample annealed at 180 °C for 3 h validated the results observed from the hygroscopicity test, where high annealing temperature led to poor hydrogen bonding interaction, resulting in minimal water uptake throughout the humidity cycle.
The sample went through 140 °C for 3.5 h annealing and 180 °C for 3 h, observed minor peaks at ~820 cm−1, ~1000 cm−1, ~1250 cm−1, and ~1670 cm−1, which can be due to decomposition of HMT under over-annealing conditions. The strongest peaks at these locations were observed in the sample with 100 °C, 3 h annealing, which can be attributed to unreacted HMT that remained on the sample surface. This result indicated that optimal annealing conditions are important for HMT to react with sensing materials for structural modifications.

3.3. Microscope Image

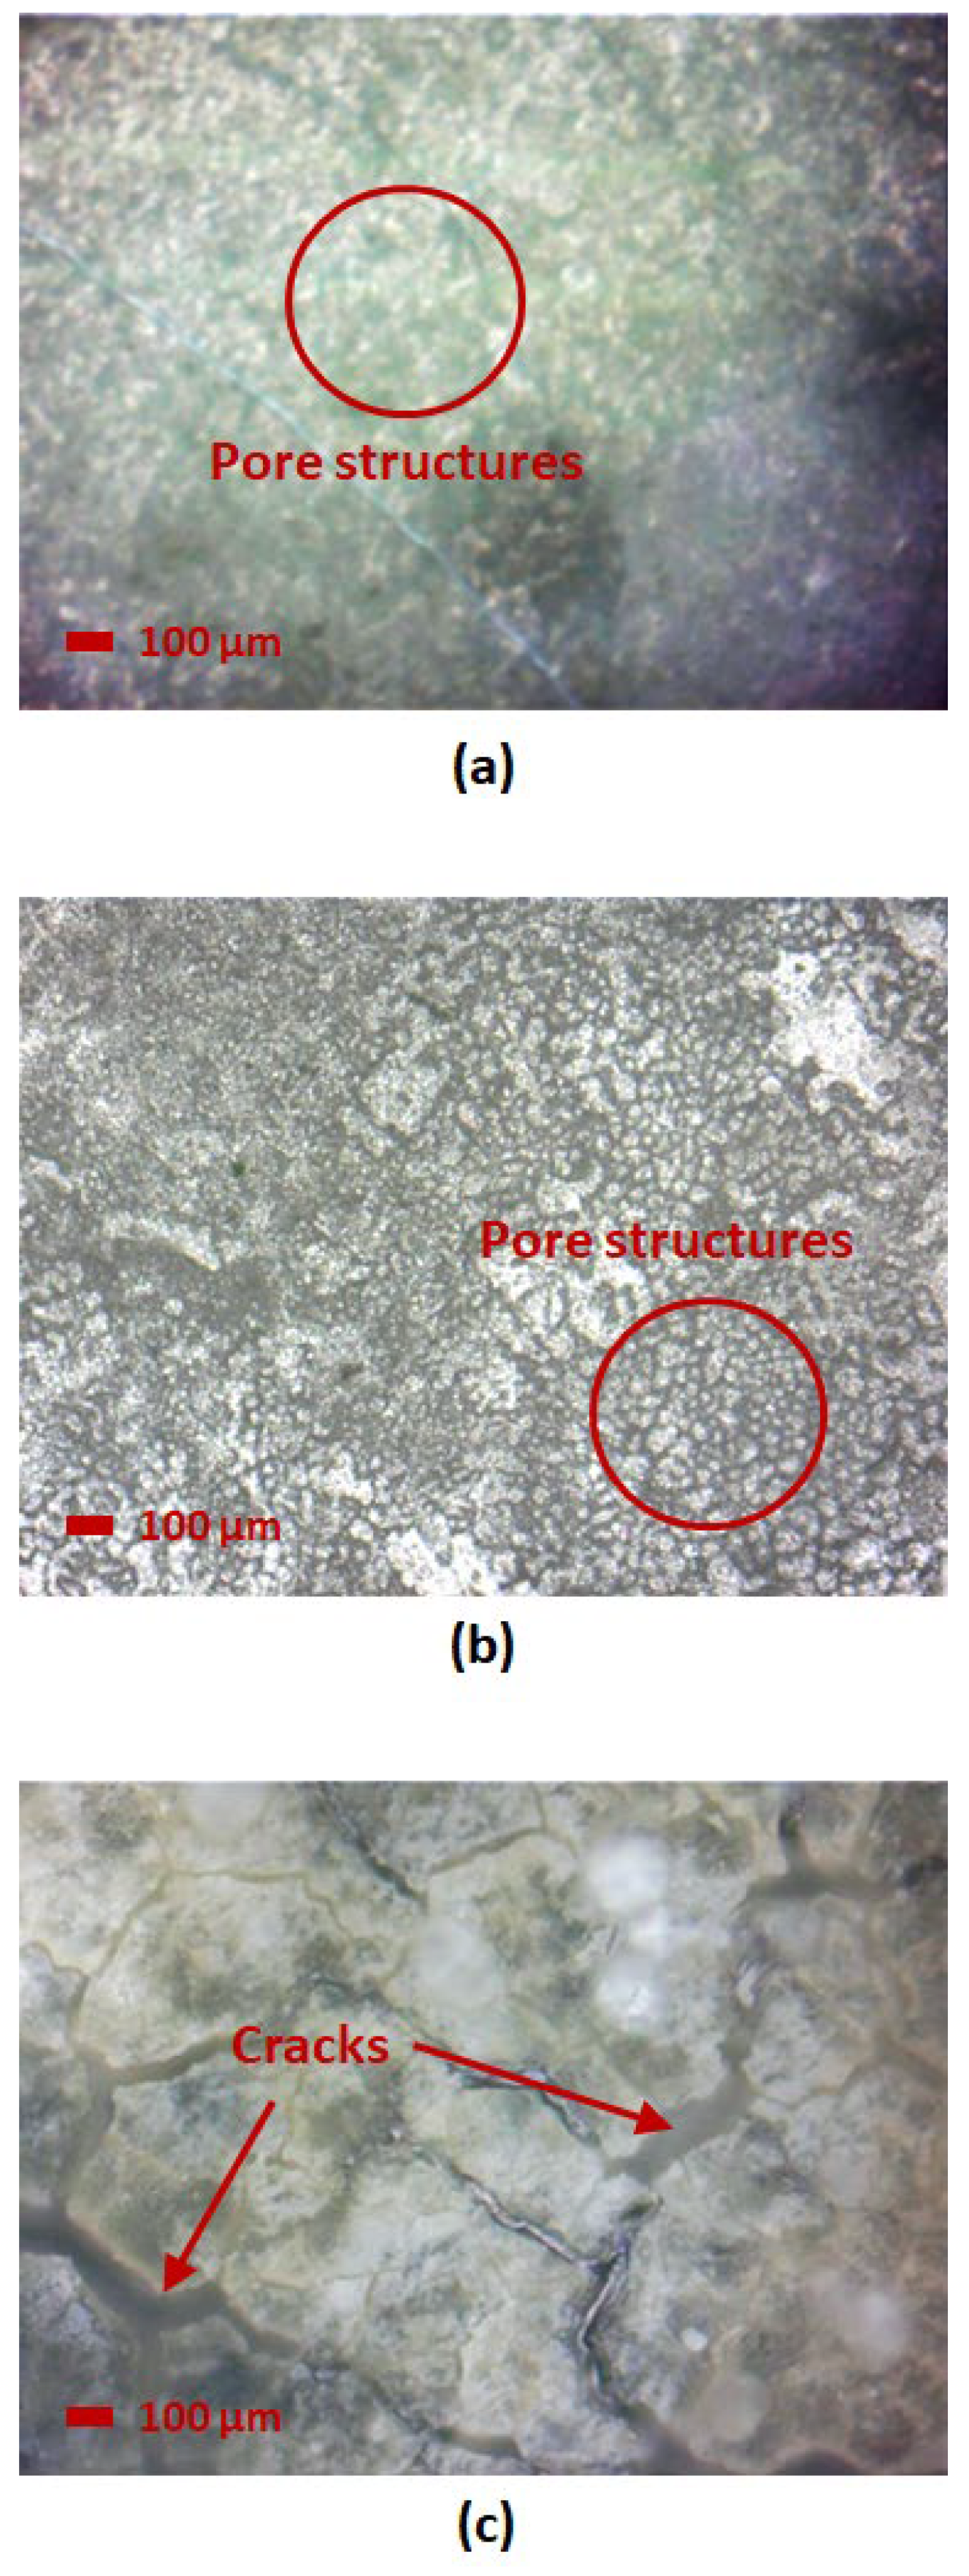
Microscope images of each sample were obtained under 20× magnification to observe the structural change of SnO2-HMT under different annealing and coating conditions. A comparison of different annealing times is shown in Figure 11, where annealing times of 2.5 h and 3 h both led to the formation of pore structures. No pore structure was observed after an annealing time of 3.5 h, which verified the result obtained from FTIR, indicating that the missing pores can be attributed to the decomposition of HMT at high annealing time and temperatures.
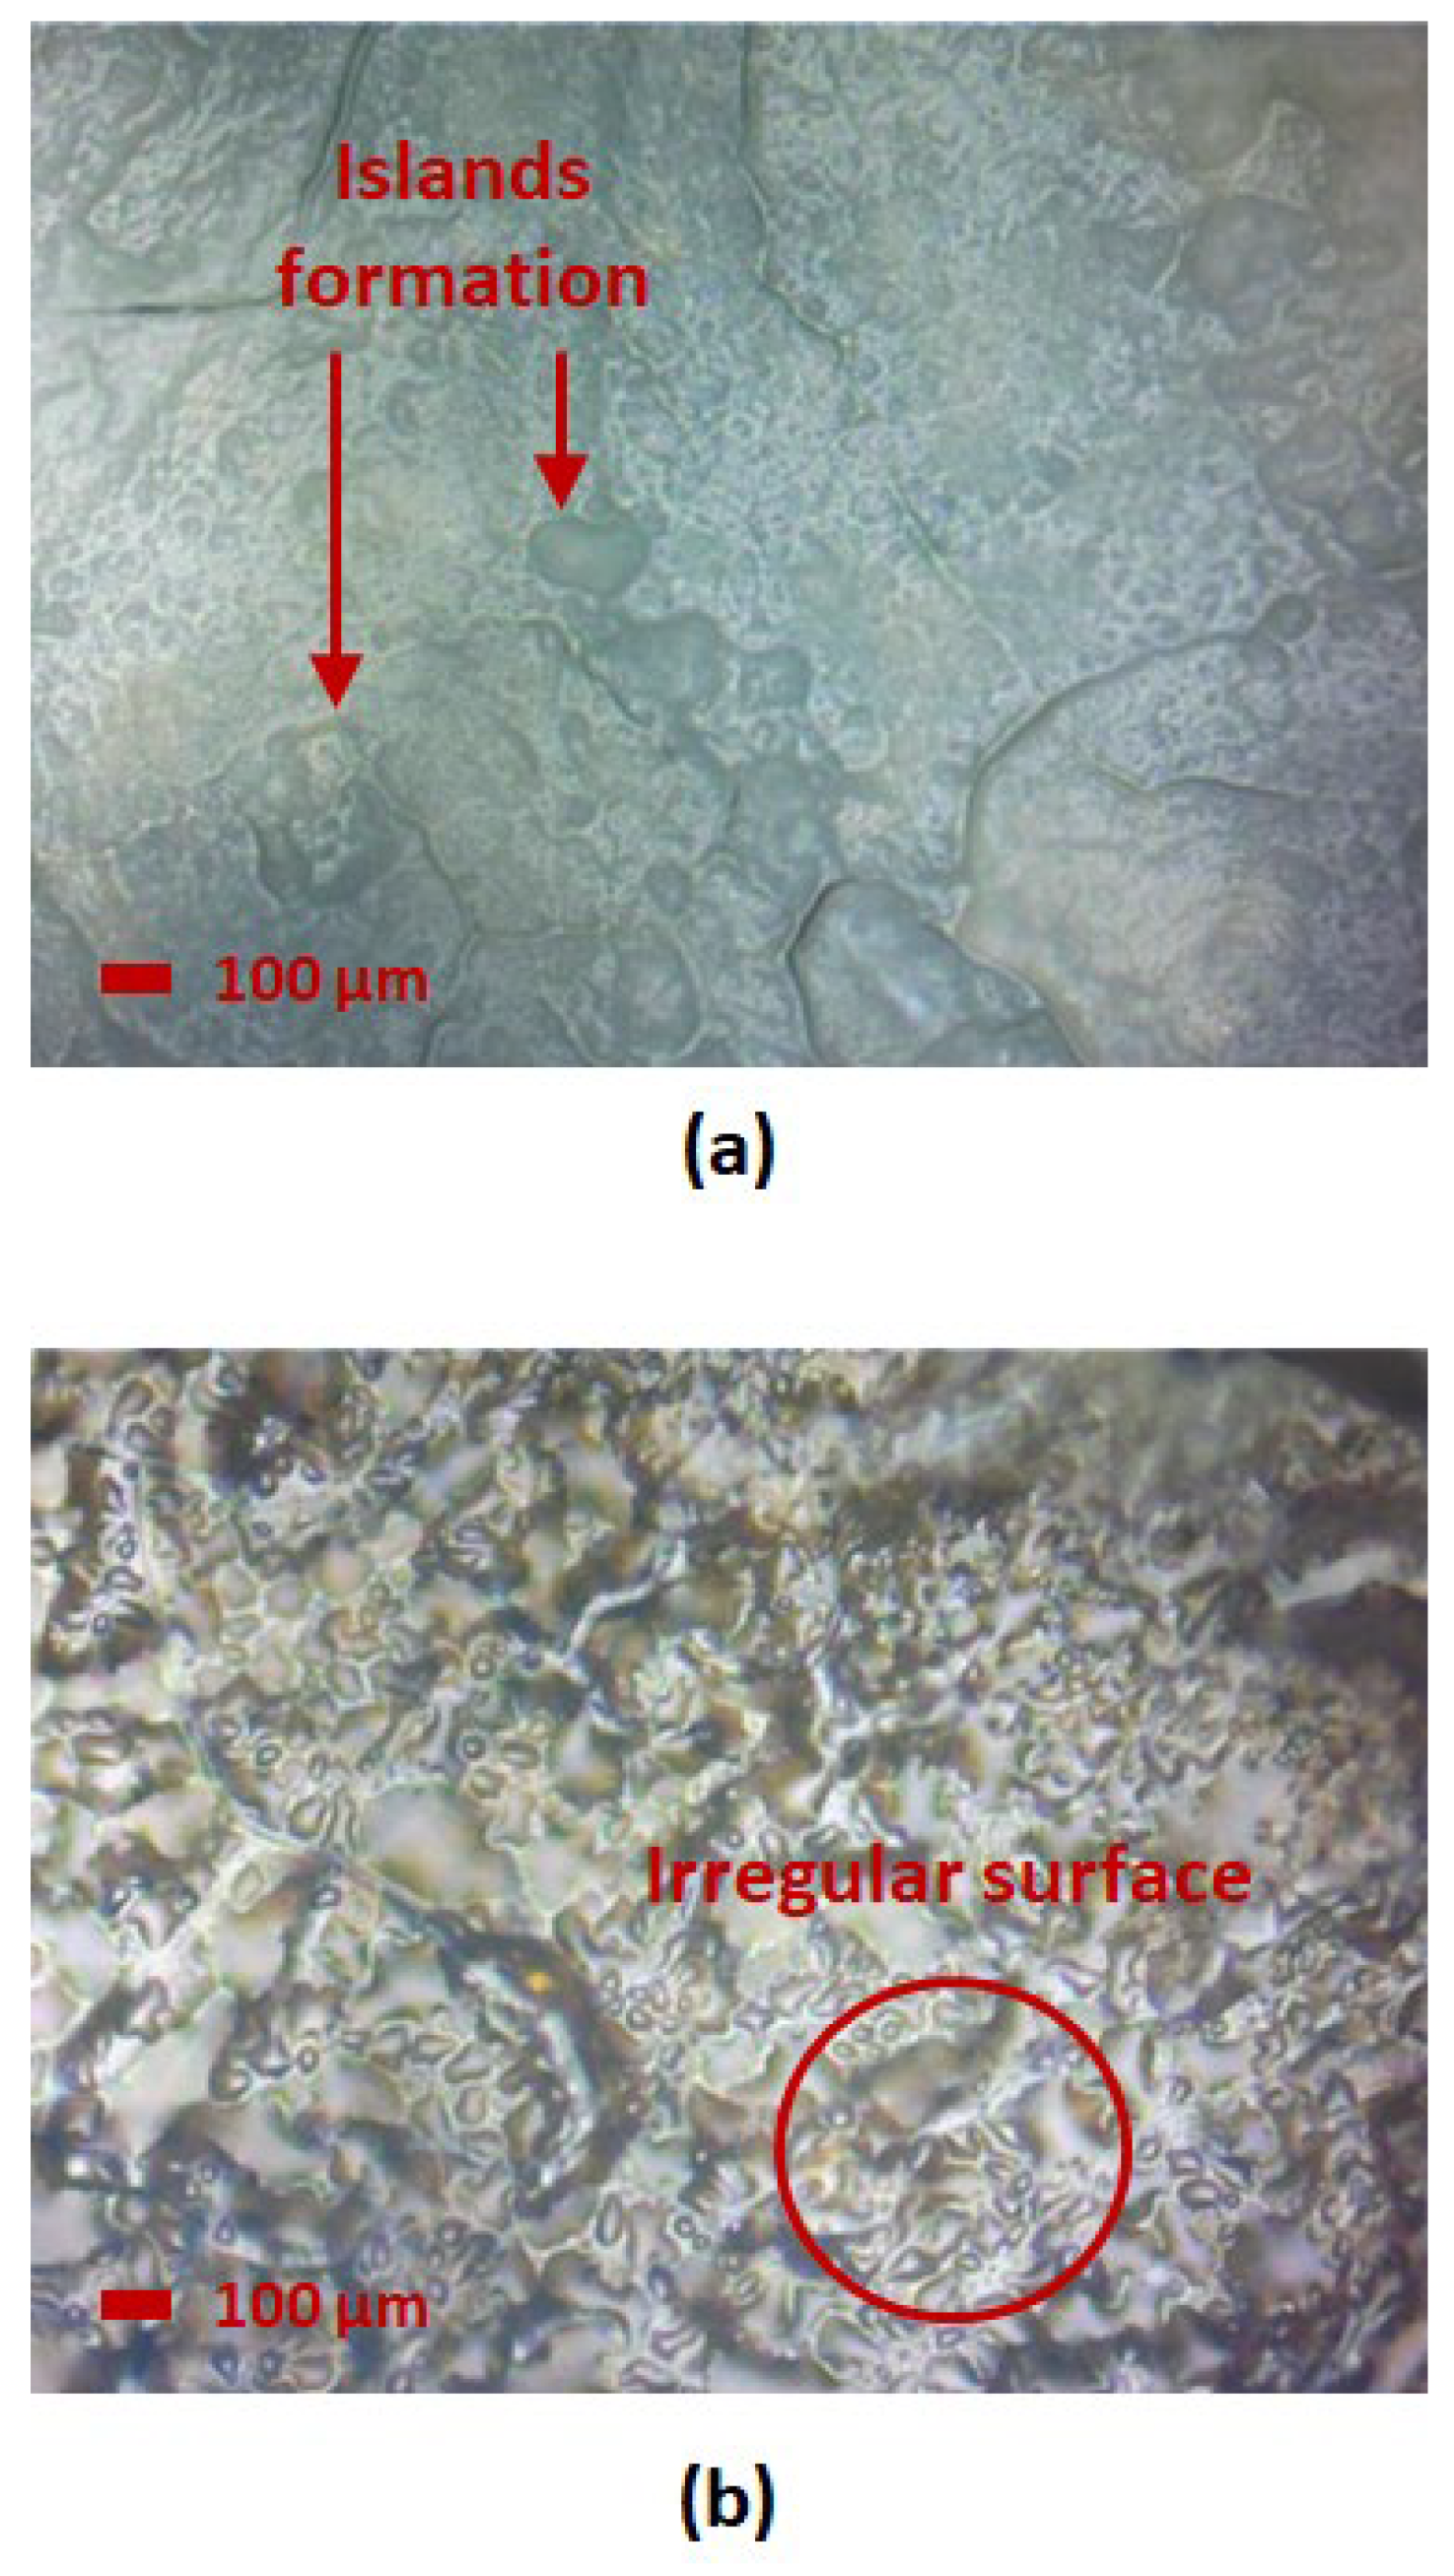
For comparison of annealing temperatures as illustrated in Figure 12, a lower annealing temperature at 100 °C potentially led to incomplete crystallization, where a large number of island structures were distributed randomly over the material surface. Whereas higher annealing temperature at 180 °C led to the formation of an irregular surface with missing pores, potentially due to agglomeration, leading towards the minimal mass change over increasing and decreasing RH as observed from the hygroscopicity test.
This result indicates that optimal annealing conditions enhance the formation of a porous structure, thereby improving the water adsorption and desorption mechanism. On the contrary, samples with under-annealing or over-annealing conditions exhibited minimal porous structures and irregular surfaces, either due to poor crystallinity or agglomeration, which led to high hysteresis or minimal water uptake, as observed in the hygroscopicity test.
Comparing the multilayer and hybrid layer coating in Figure 13, an uneven surface was observed from the samples of 3 layers of SnO2-HMT, where the increasing number of coating layers can potentially lead to an uneven crystal structure. Formation of microcracks was also observed in this sample, which can lead to high water retention and low water desorption, resulting in high hysteresis observed from the hygroscopicity test. Whereas for the hybrid layer ZnO/ SnO2-HMT, a similar nanostructure with single-layer SnO2-HMT with 3 h 140 °C annealing condition was observed, indicating minimal impact of ZnO interlayer on the top surface of SnO2-HMT.

3.4. Field Emission Scanning Electron Microscope (FESEM)

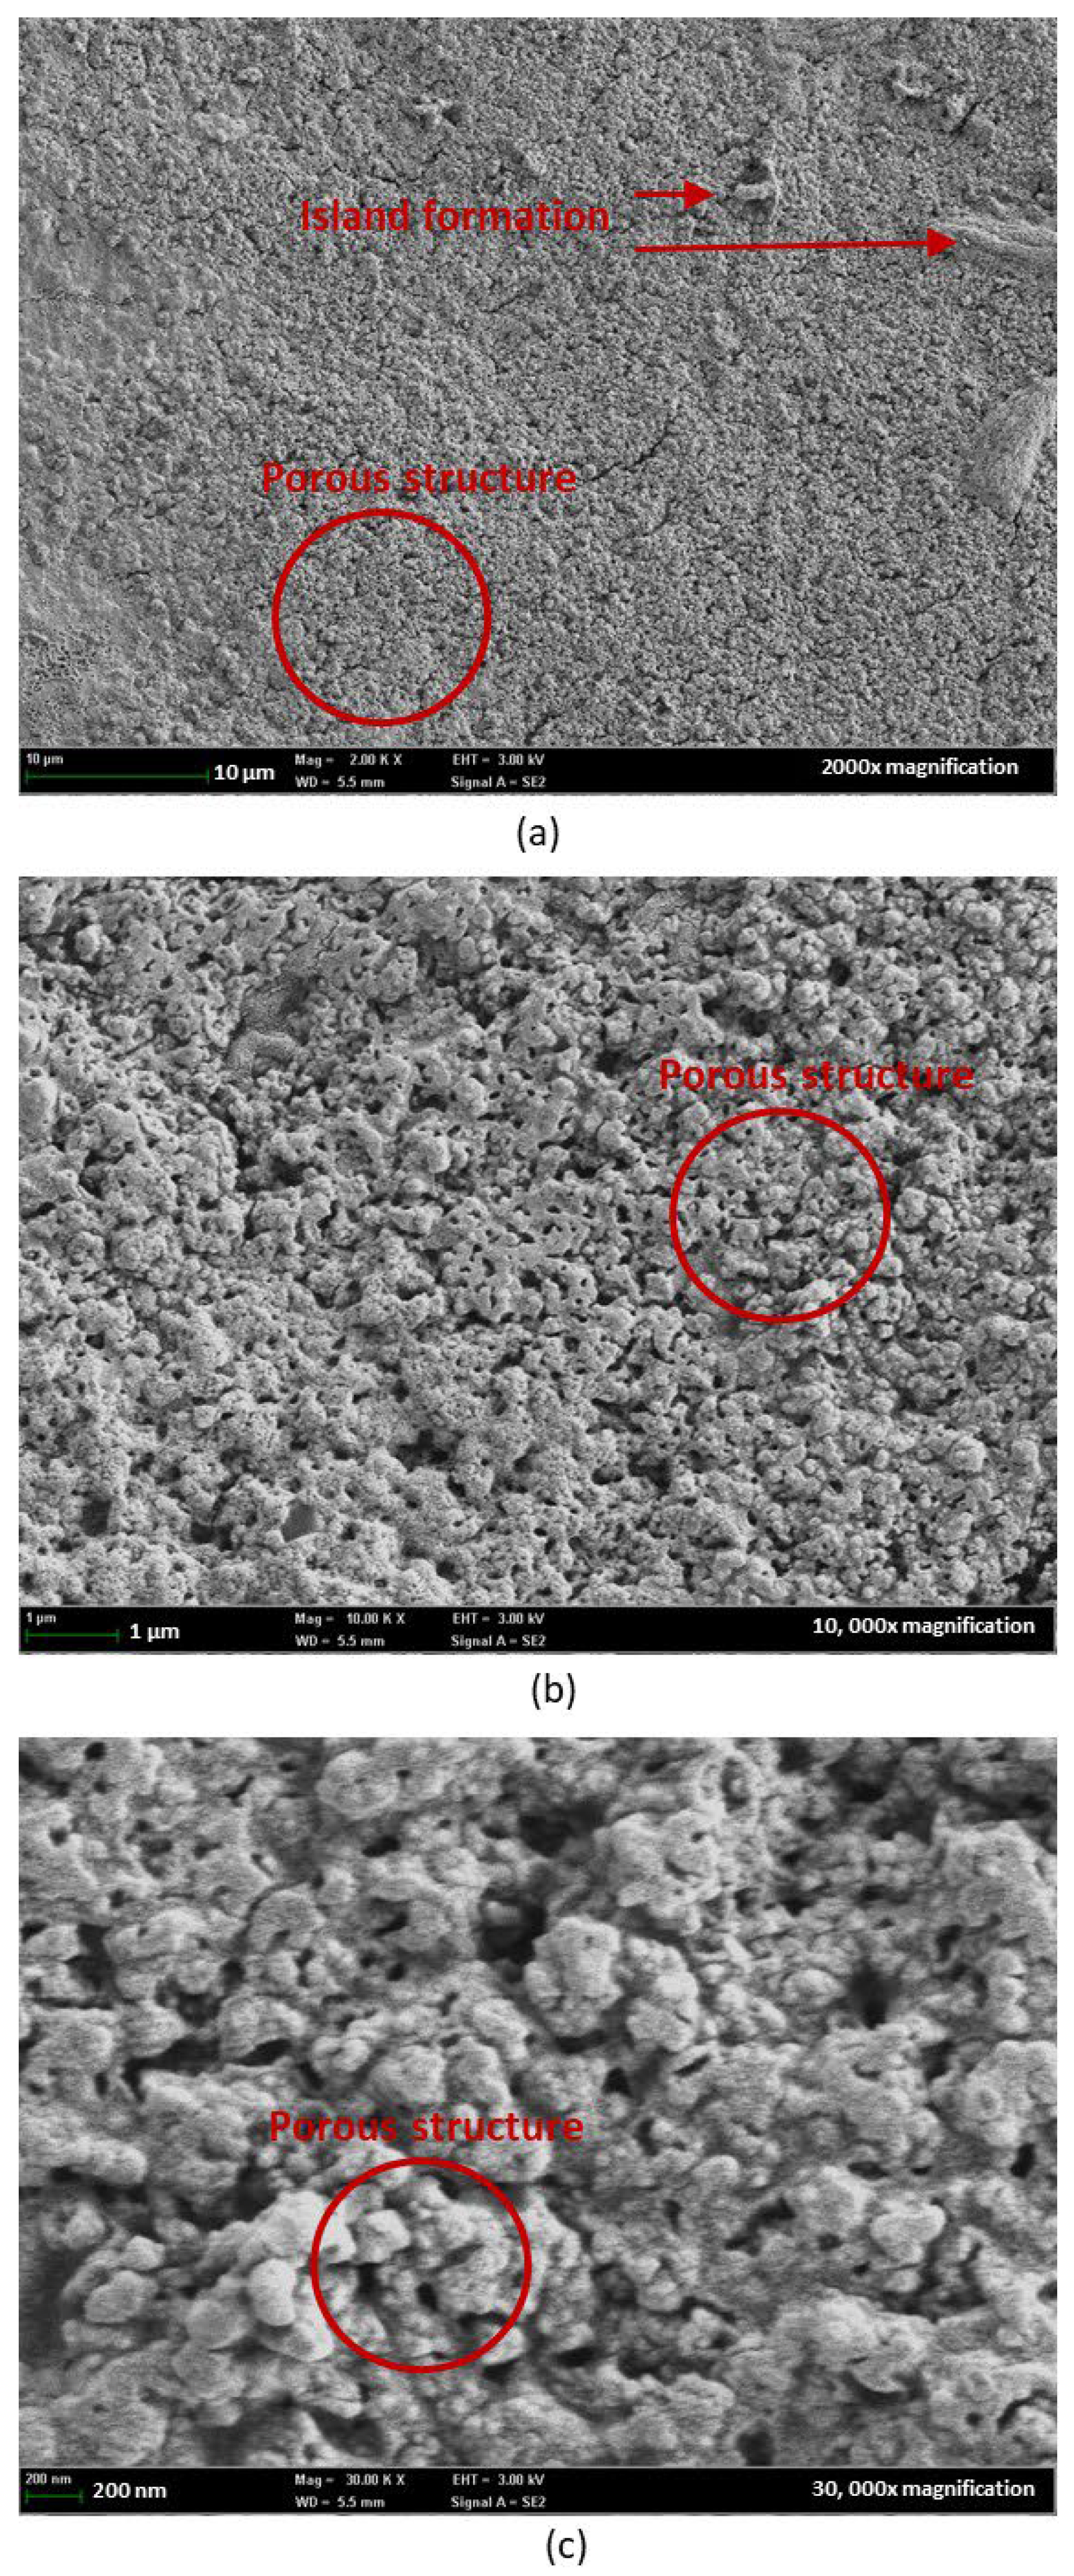
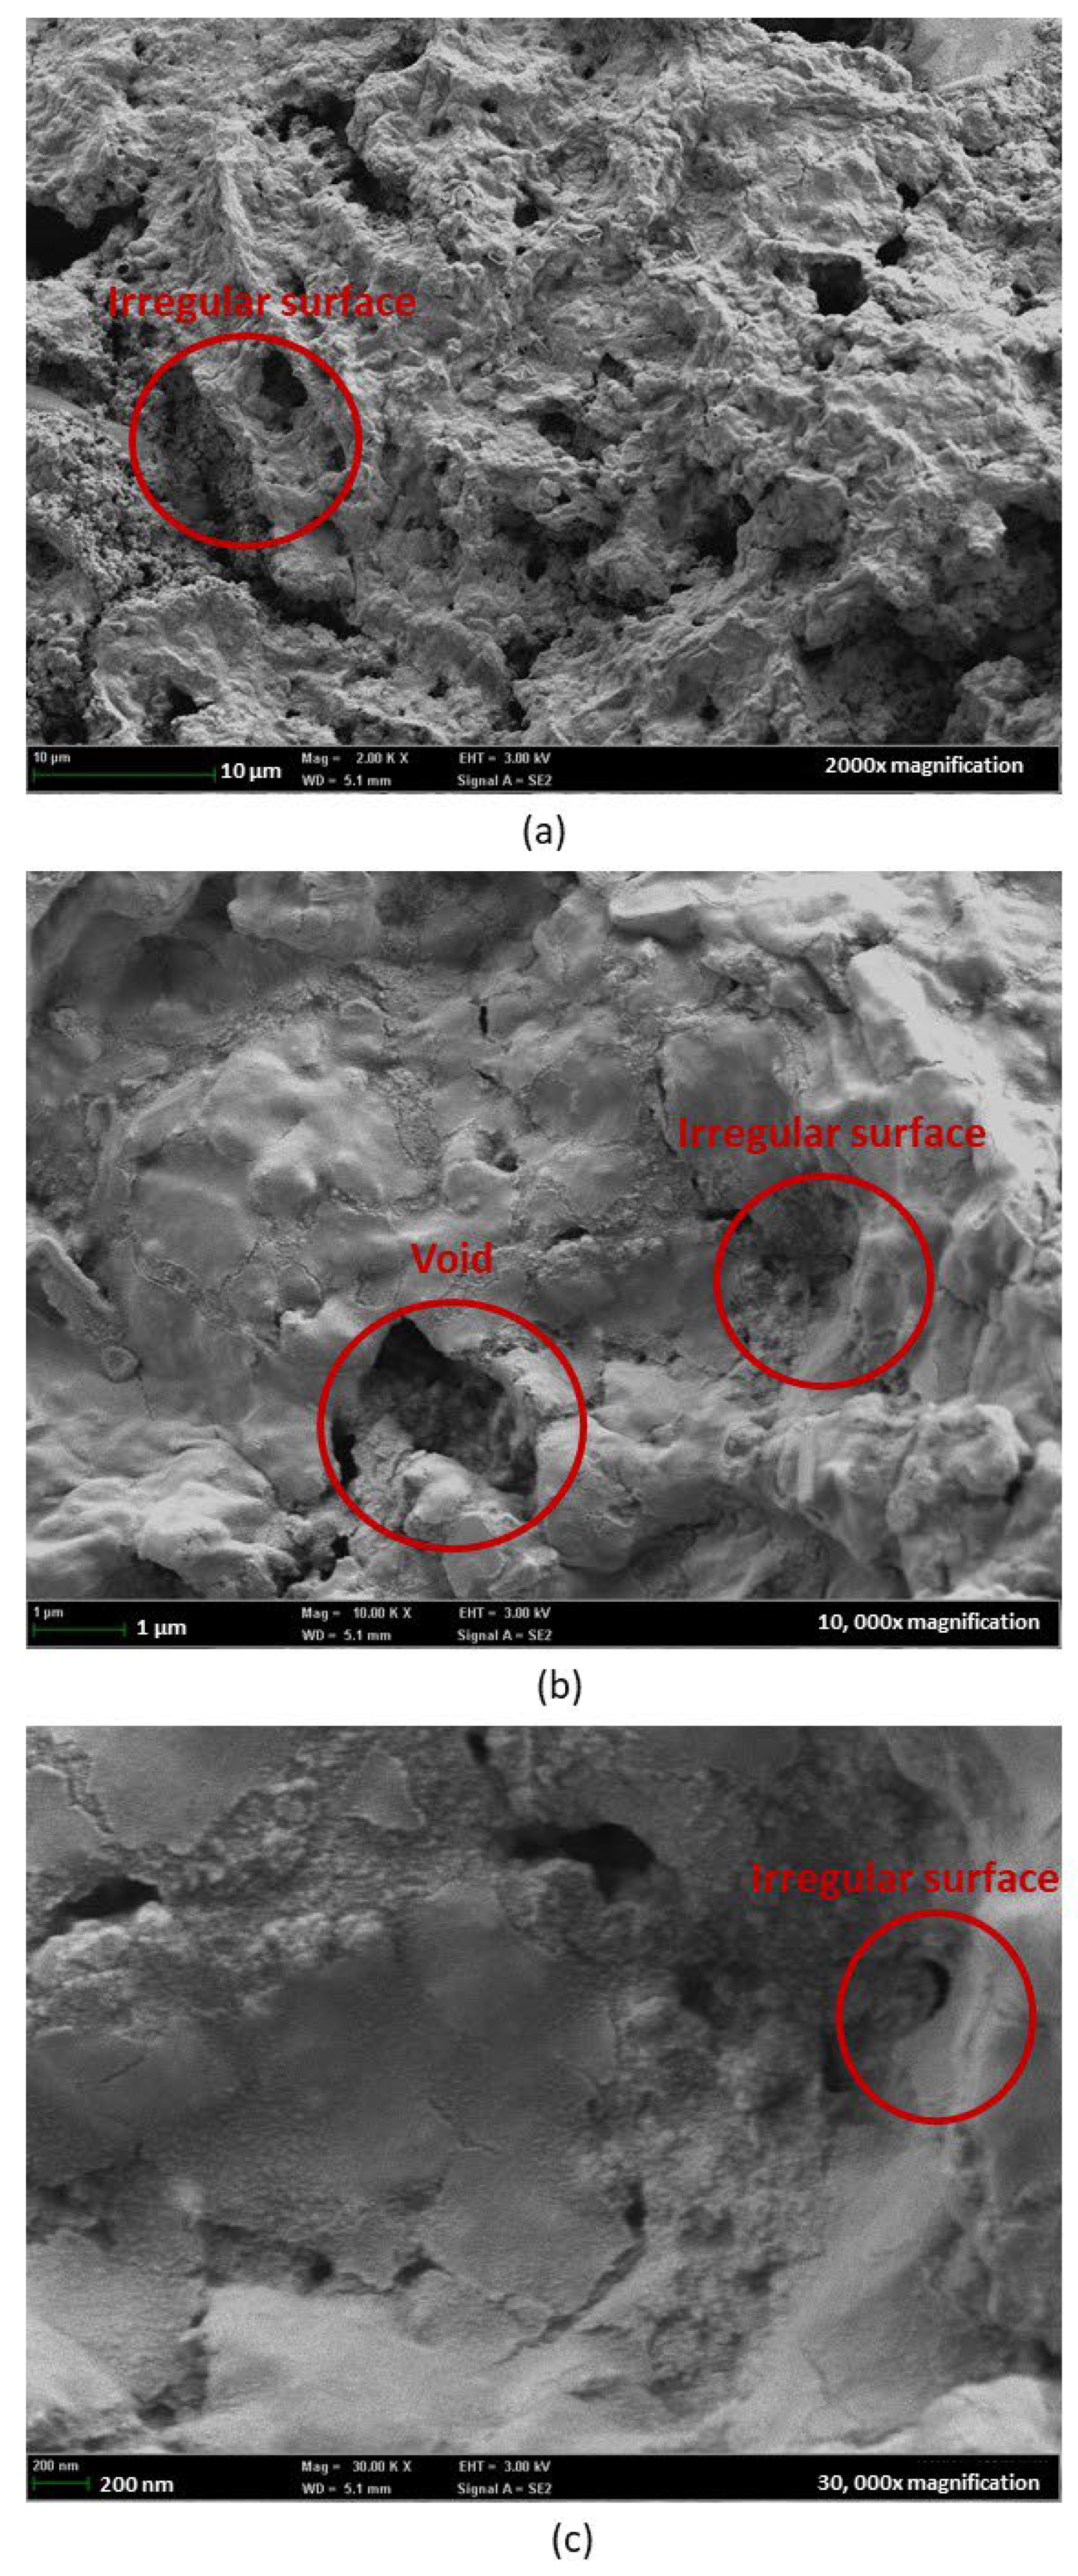
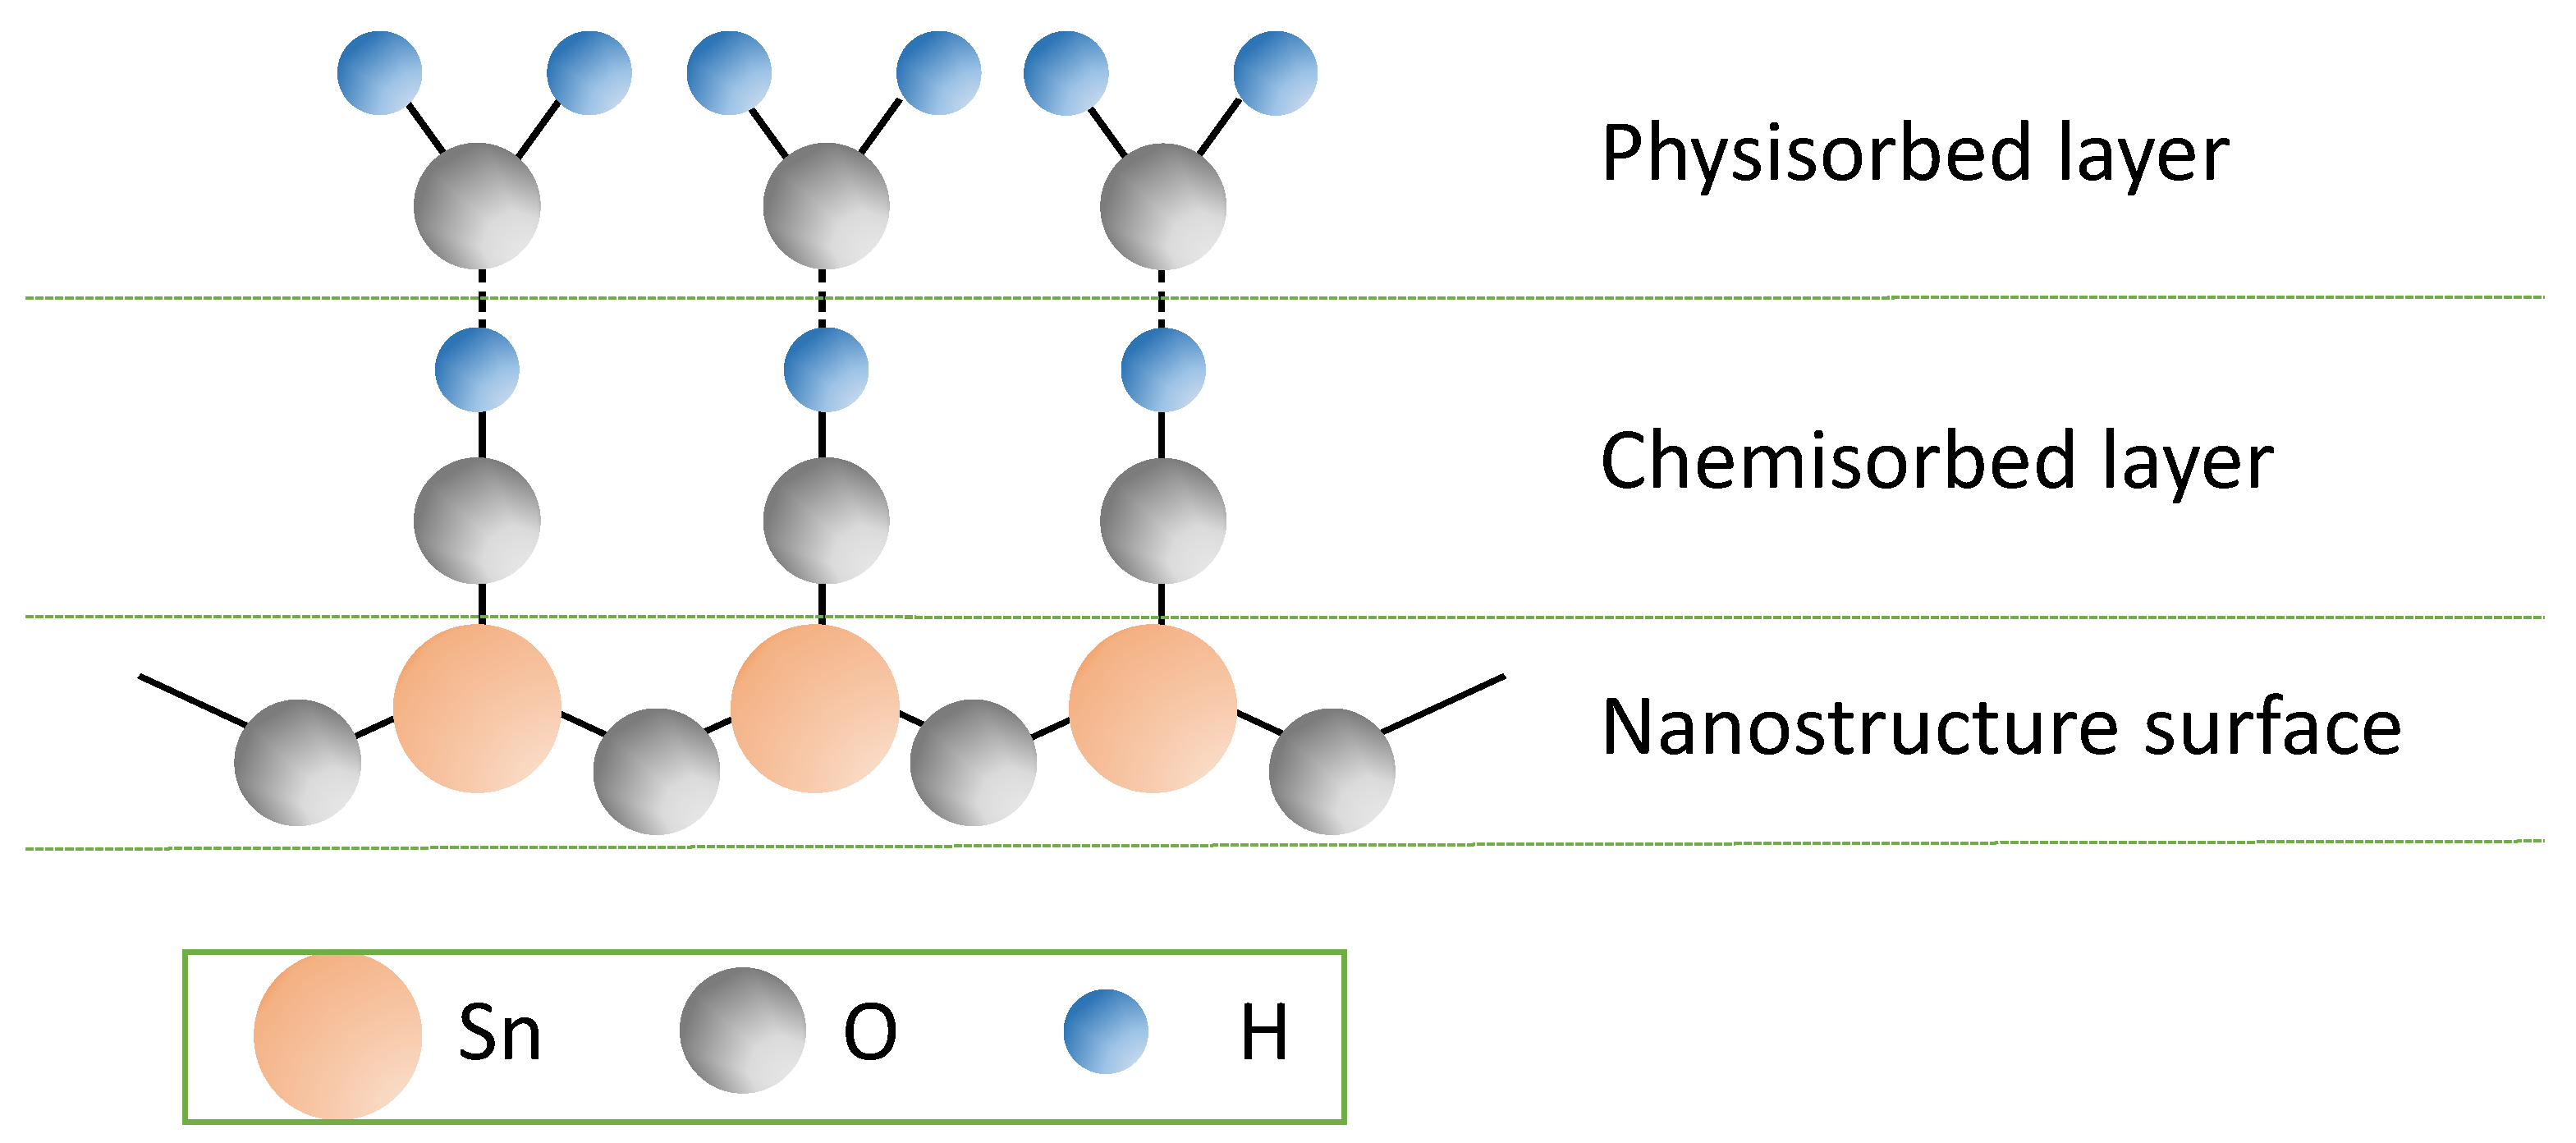
FESEM images under 2000×, 10,000×, and 30,000× magnification were captured for the single-layer sample in Figure 14 and the multilayer sample in Figure 15, to further validate the results obtained. The single-layer samples showed minor island formation under 2000× magnification. By increasing the magnification to 10,000× and 30,000×, the porous structures can be clearly observed. These uniform porous structures, which served as active sites for water adsorption and desorption, contribute to the high water–surface interaction physically and chemically with the nanostructure, as shown in Figure 16. High porosity nanostructure also led to a change in surface tension through the capillary effect [33] minimizing the hysteresis of the tested sample.
This explained the observation from the hygroscopicity test, where the uniform porous structures of SnO2-HMT annealed under 140 °C for 3 h exhibited minor or negligible hysteresis. On the contrary, increasing the coating layers led to uneven crystal structure and formation of voids, which can be the reason for high hysteresis, as the water molecules might be trapped within the uneven surface or voids, causing poor water desorption [34].

3.5. Optical Spectrum Analysis

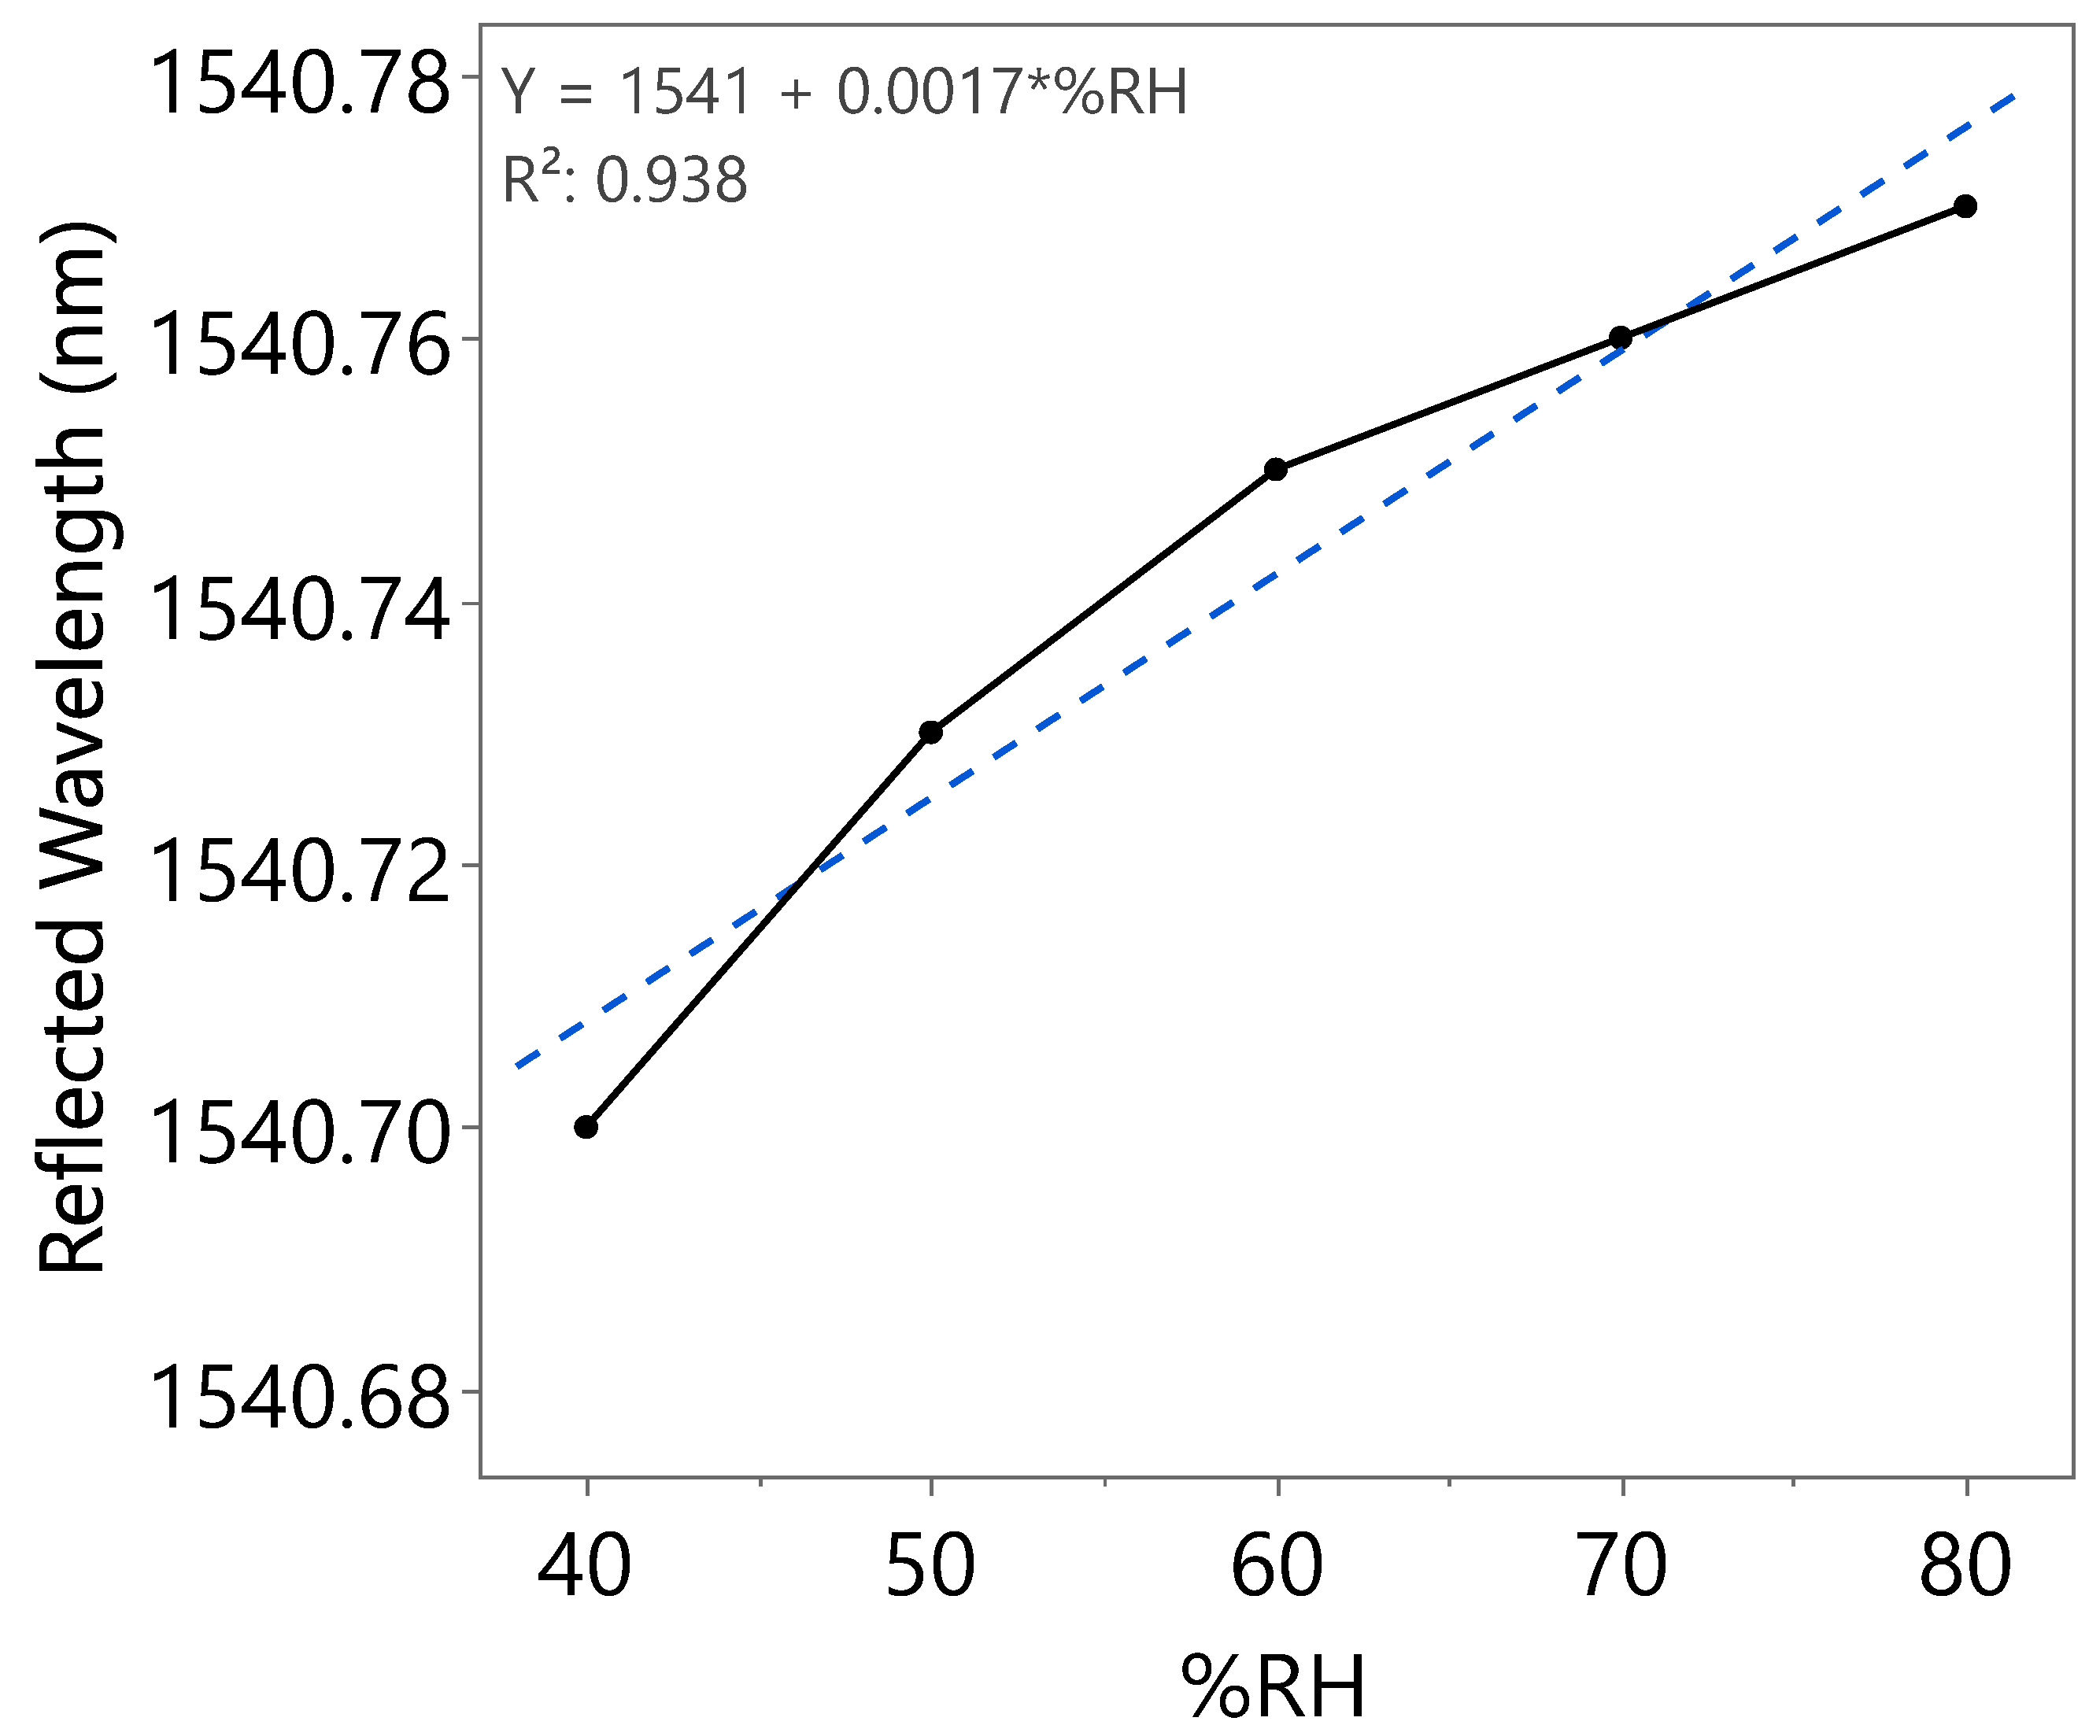
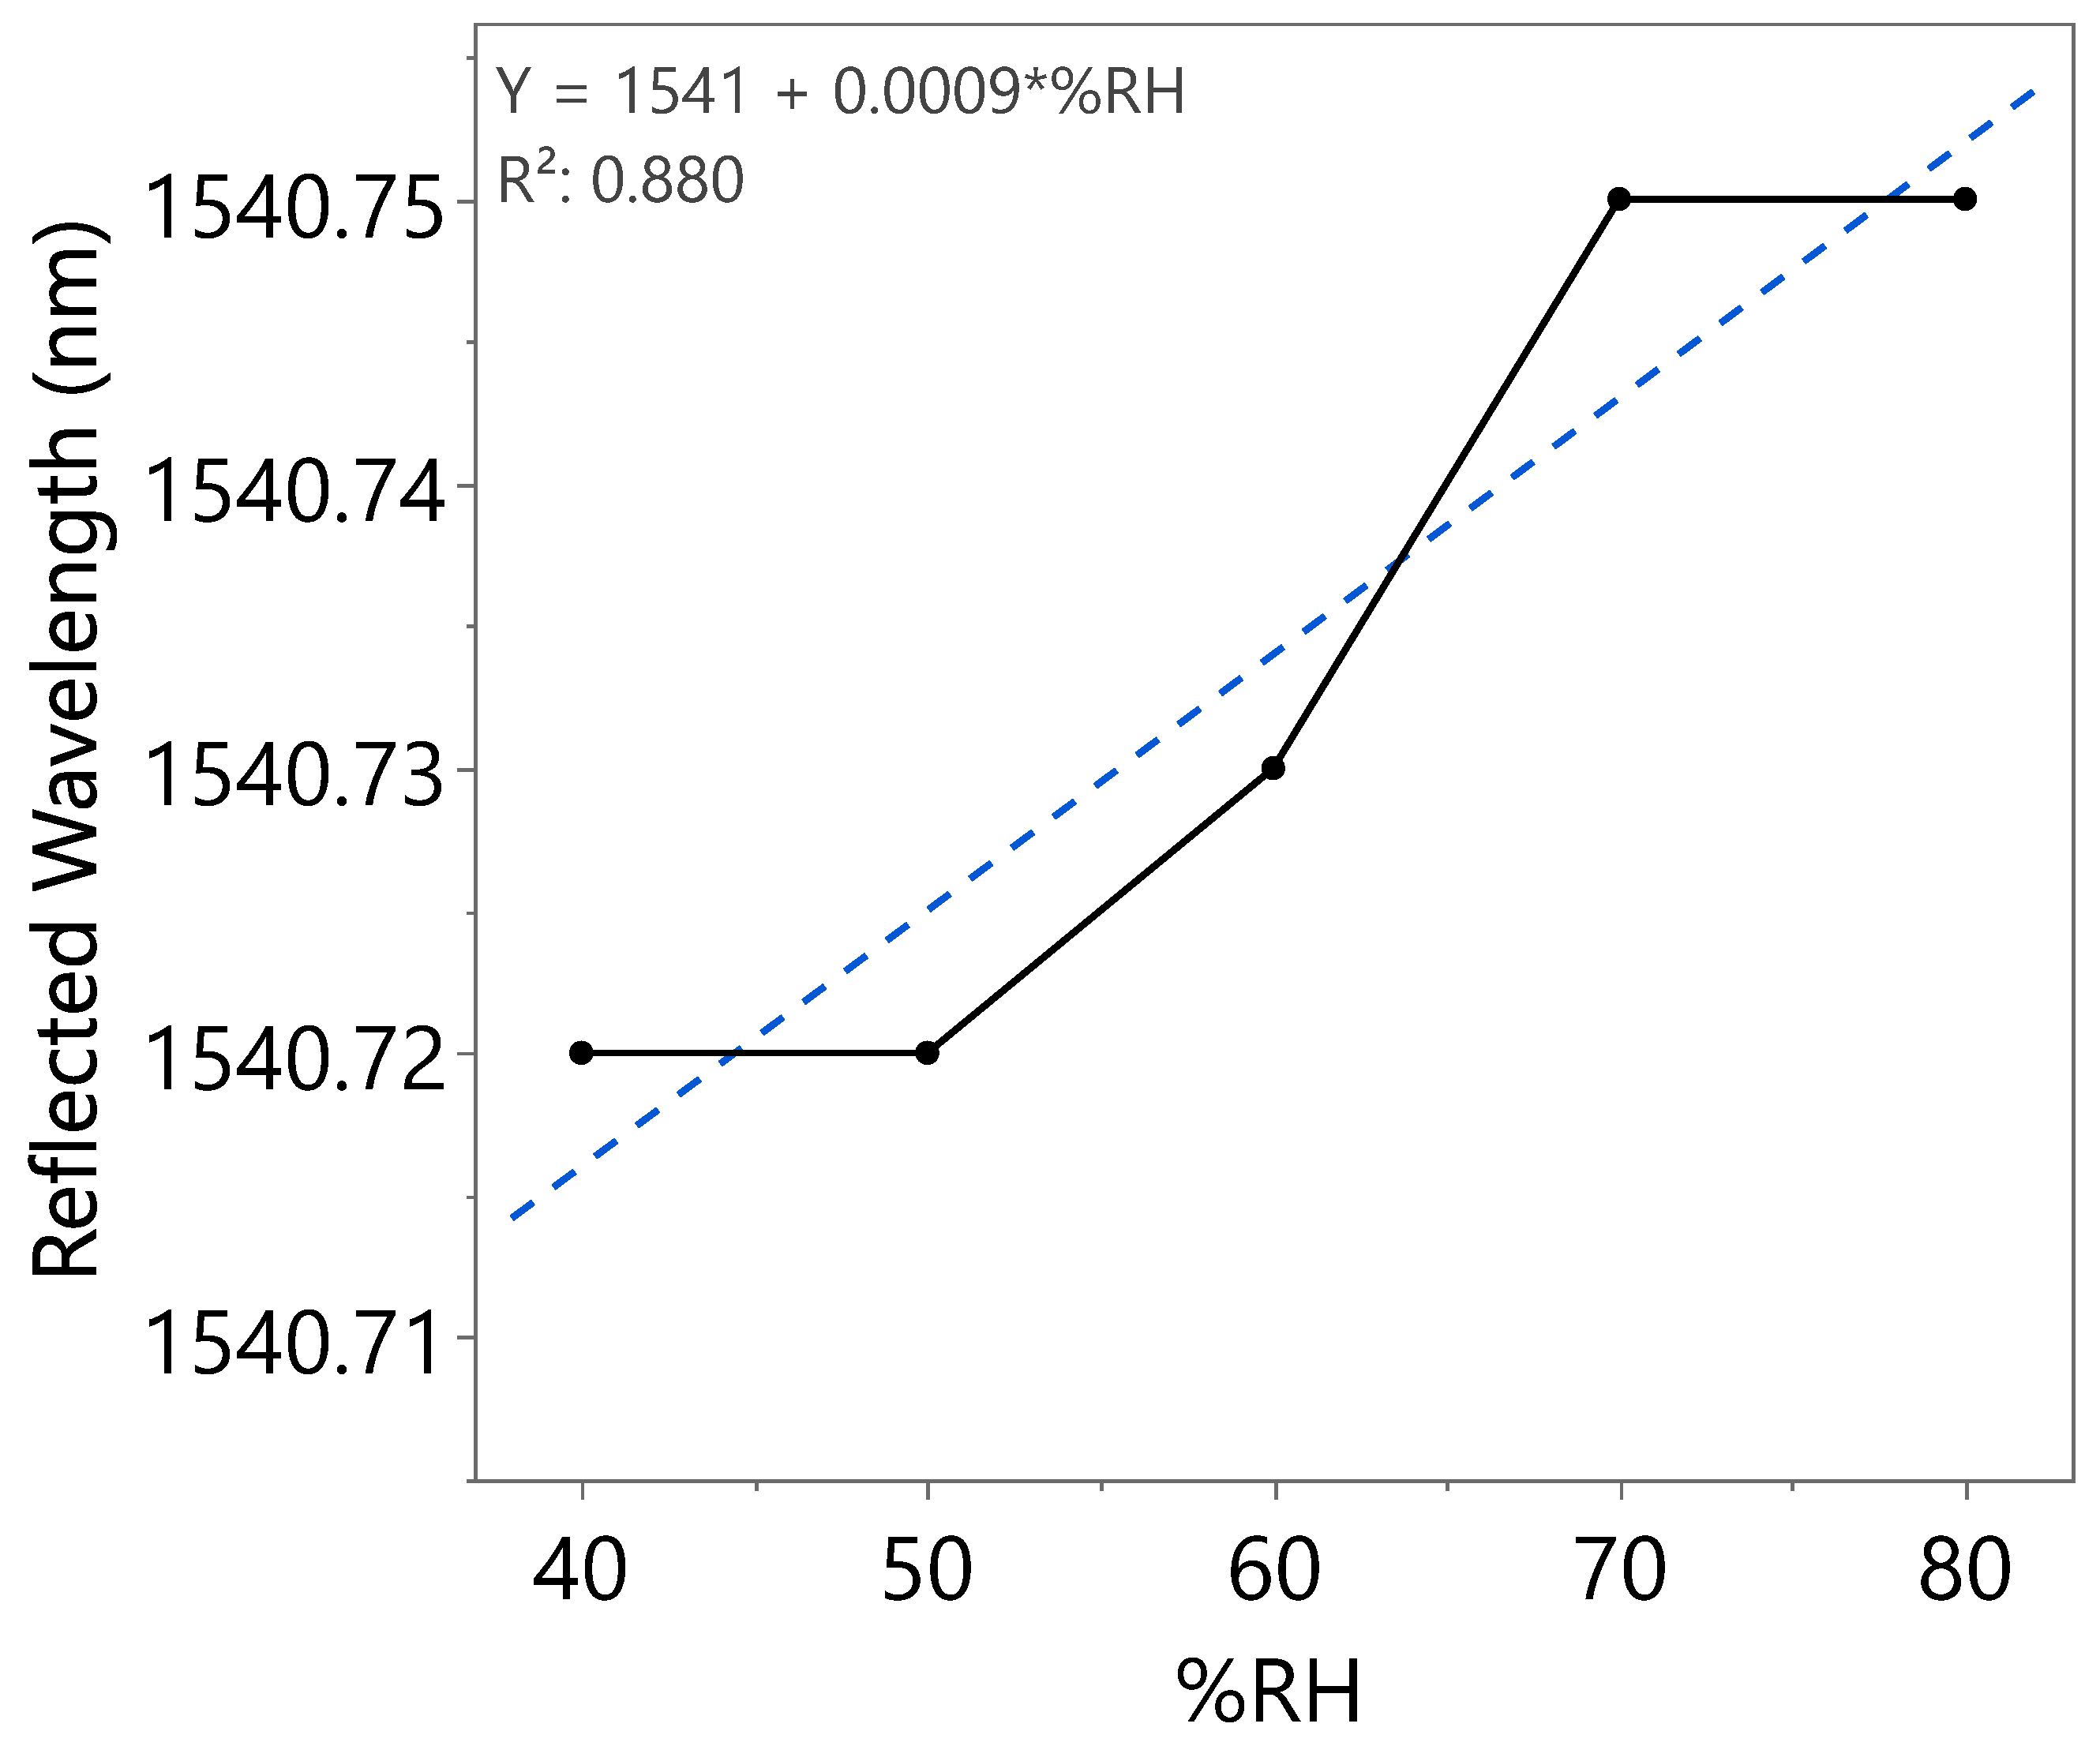
The FBG sensor was coated with a single layer of SnO2-HMT and subjected to the annealing process with optimal annealing conditions, which are 140 °C annealing temperature and 3 h annealing time. To analyze the wavelength shift, the coated FBG was placed in a humidity-controlled chamber and connected to the optical spectrum analyzer (OSA) and light source. The reflected wavelength of the coated FBG was recorded by the OSA at every 10%RH from 40%RH to 80%RH.
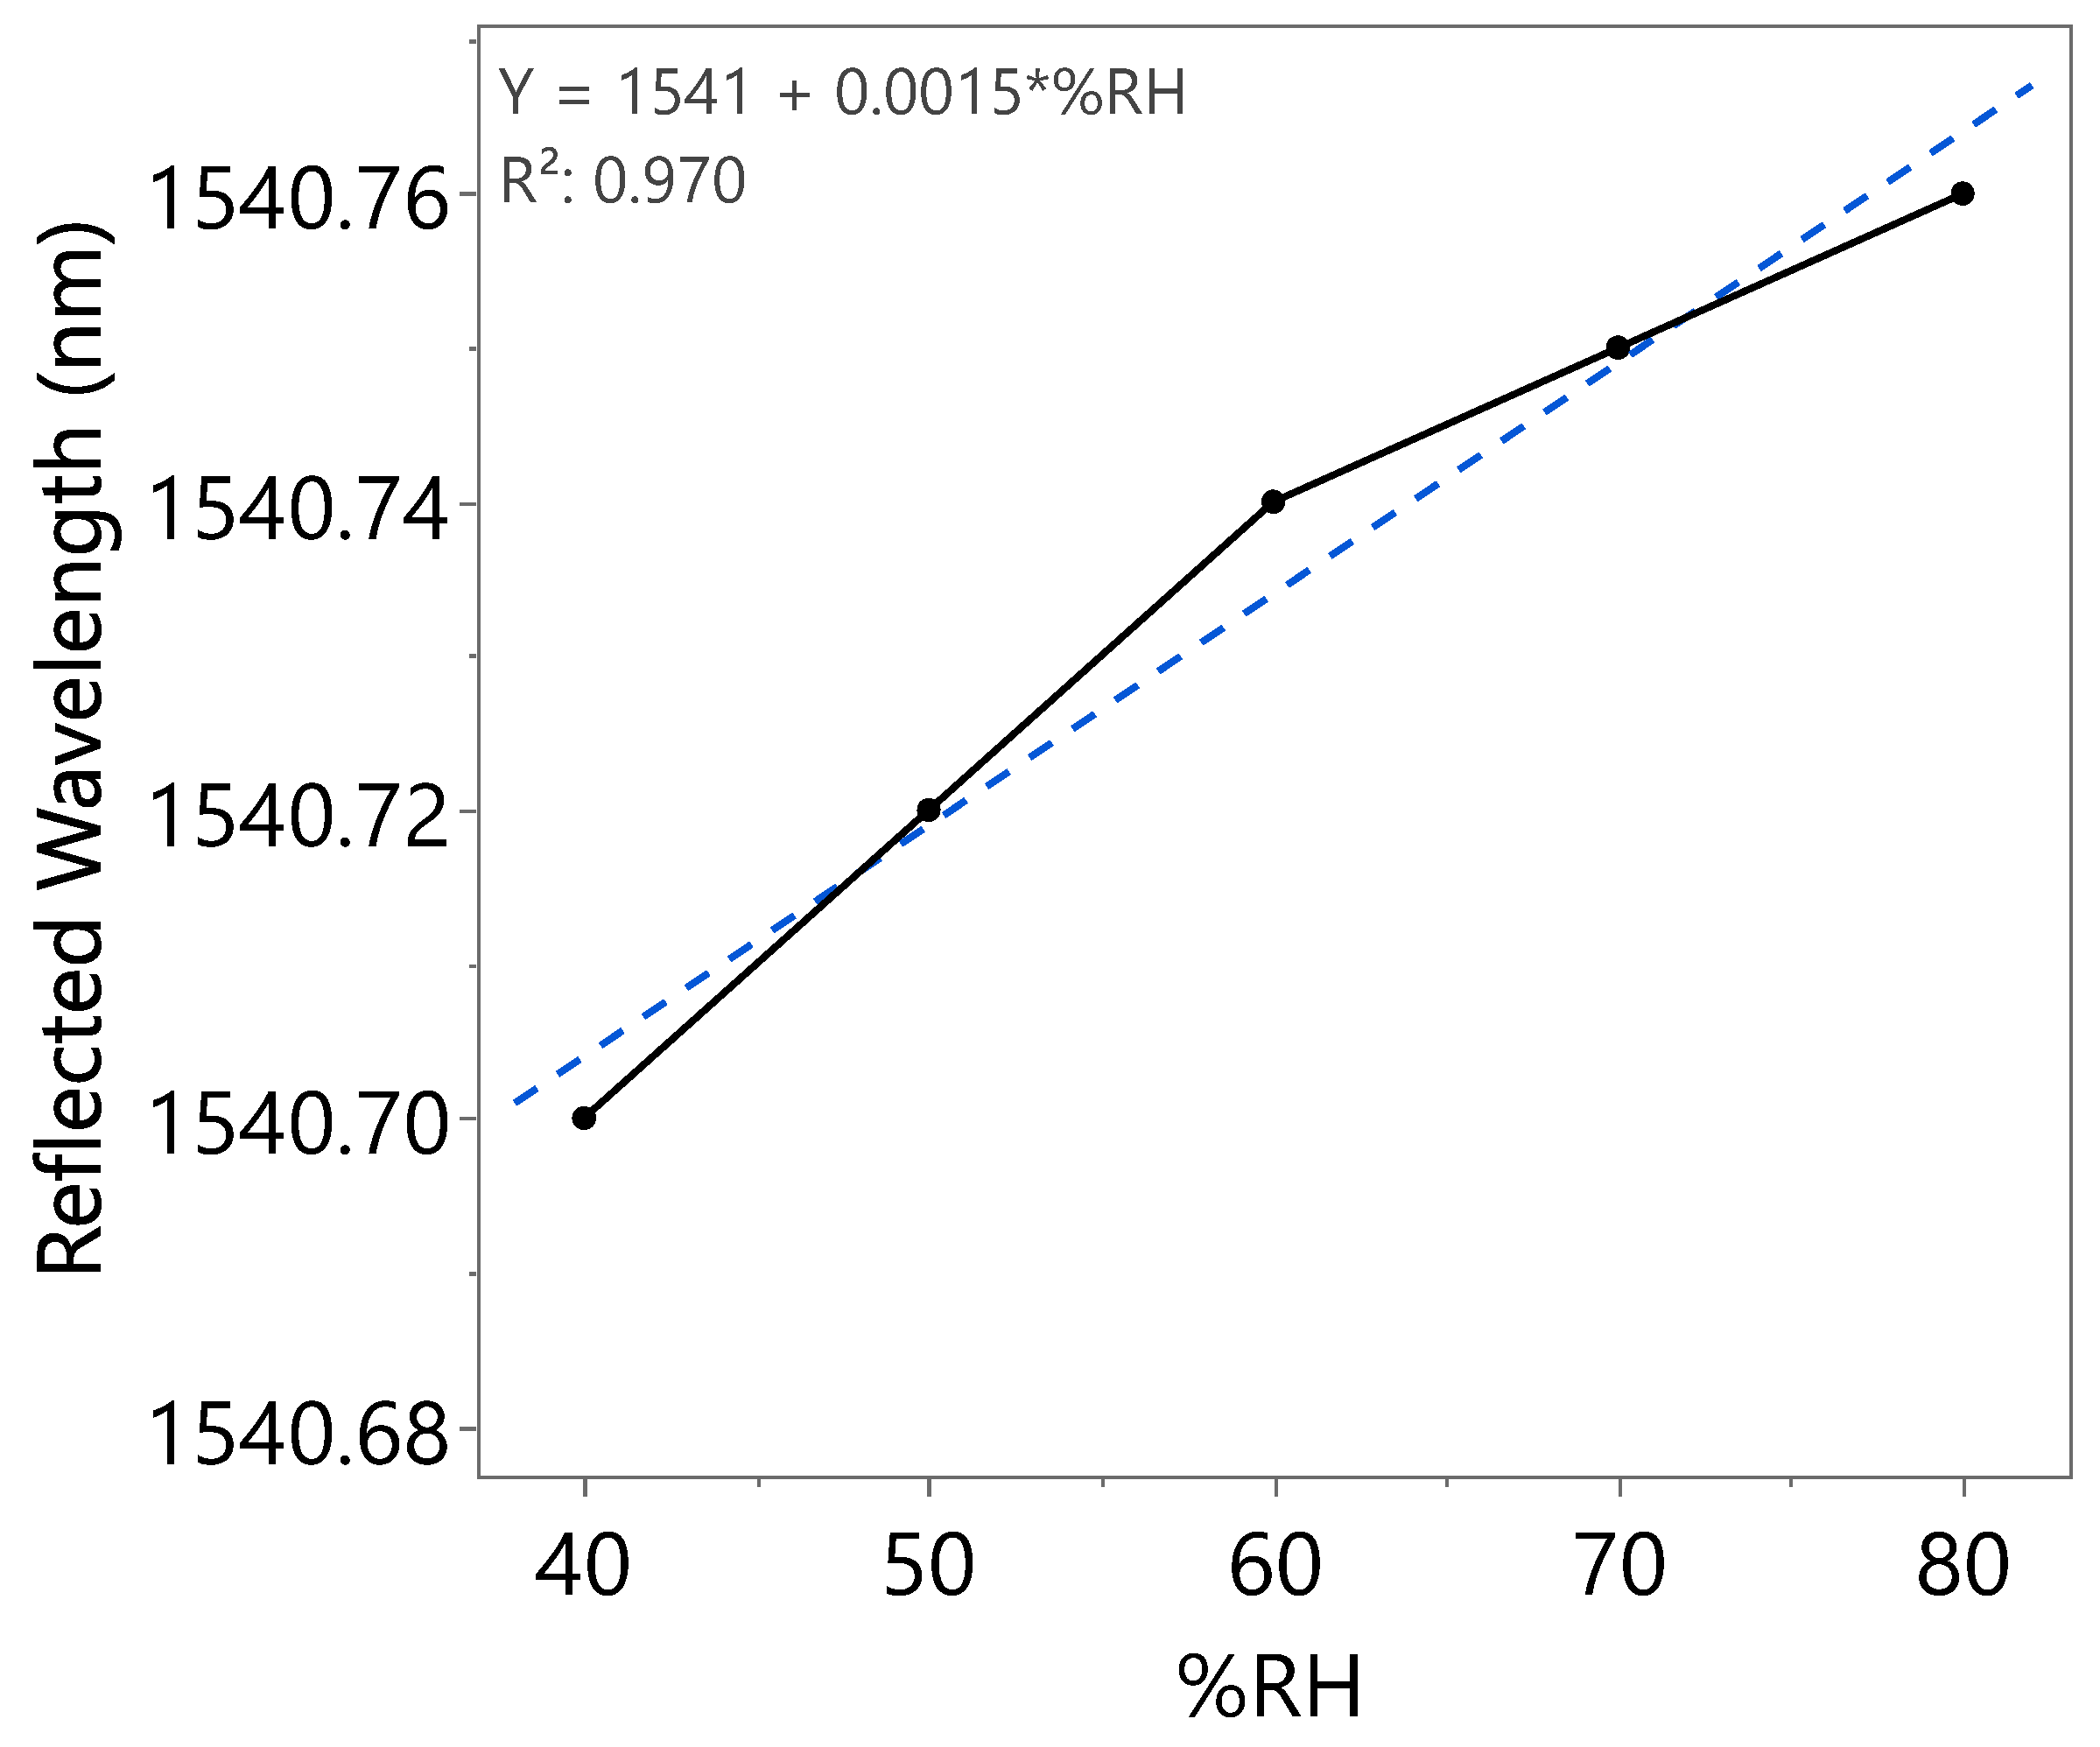
A wavelength shift with increasing RH can be clearly observed from Figure 17, indicating the effect of coated SnO2-HMT towards optical-based humidity sensing, with a sensitivity of 1.5 pm/%RH recorded from 40 to 80%RH in the first incremental RH cycle. Similar works reported a sensitivity of 0.05 pm/%RH from RH ranging from 50 to 80% by coating FBG with ZnO-HMT [35] and sensitivity of approximately 1.5 pm/%RH in the range of 11–83%RH by coating FBG with polyimide [36]. Repeatability tests have been carried out on the same coated FBG as illustrated in Figure 18 and Figure 19. The wavelength shifts were summarized under Table 3. The second incremental RH cycle demonstrated a slight increase in sensitivity to 1.7 pm/%RH. However, a decrease in sensitivity to 0.9 pm/%RH in the third incremental RH cycle was observed. This could be caused by water molecules trapped within the porous structure after exposure to repeated humidity cycles.

4. Conclusions

Comparative studies have been conducted in this study to examine the impact of annealing conditions on morphology and structural change in additive-enhanced SnO2. By optimizing the annealing time and temperature, the crystallinity can be enhanced through the presence of the HMT additive, resulting in high porosity nanostructures with an increased mass uptake ratio and reduced hysteresis. Over-annealing can lead to decomposition of the additive, suggested by the missing FTIR peak from the range of ~820 cm−1 to 1670 cm−1, hindering the water adsorption and desorption. Whereas insufficient annealing may result in incomplete crystallization, reducing the effect of the additive in the formation of pore structures. The microscope images have further validated the observation from the hygroscopicity test findings, where samples under over-annealing conditions induced cracks or agglomeration, whereas samples under insufficient annealing conditions were observed to have poor crystallinity.
The study also investigated the increase in coating layers under optimal annealing conditions. The multilayer SnO2-HMT samples showed an uneven crystal structure from the microscope images and void formation from FESEM, which traps the water molecules upon adsorption. These findings validate the result from the hygroscopicity test, where the multilayer samples exhibited increased water uptake during increasing RH, but poor water desorption during decreasing RH. The hybrid layer ZnO/SnO2-HMT sample showed comparable hygroscopicity and hysteresis to the single-layer SnO2-HMT with optimized annealing conditions; this indicates that using ZnO as an interlayer did not enhance the hygroscopicity of the coated nanostructure. Further investigation can be conducted to determine the suitable candidates to act as interlayers of the coated nanostructures.
Overall, the single-layer SnO2-HMT or hybrid-layer ZnO/SnO2-HMT annealed under 140 °C for 3 h showed the best hygroscopicity among all other samples in this study, with m value approximately 0.16 and negligible hysteresis. Sensitivity of 1.5 pm/%RH can be achieved with single-layer SnO2-HMT under optimized annealing and coating conditions during the first RH cycle. However, the sensitivity decreased to 0.9 pm/%RH in the third RH cycle during the repeatability test. This result demonstrated that the optimized SnO2-HMT can be applied for nanostructure coating on humidity sensors, including optical-based sensing for enhanced sensitivity.
Pure metal oxide nanostructures often exhibit advantages, including high stability, improved optical sensitivity, and large surface area [2]. However, challenges such as self-agglomeration and inconsistent crystallization limited the scalability of the nanostructures for large-scale industry production [37]. Further research, including the development of nanocomposites, interlayer coating for surface modification, and enhanced coating techniques to improve uniformity, is necessary for scalability, reproducibility, and repeatability improvements. This will enable broad applications of the sensor across various humidity-sensing industries, such as civil engineering, agriculture, and semiconductor manufacturing [17,38].

Author Contributions

Conceptualization, S.P.K.; Methodology, S.P.K.; Validation, S.P.K.; Formal analysis, S.P.K.; Investigation, S.P.K.; Resources, S.B.A.A. and K.Y.C.; Data curation, S.P.K.; Writing – original draft, S.P.K.; Writing – review & editing, Y.I.G.; Visualization, S.P.K.; Supervision, Y.I.G.; Project administration, Y.I.G.; Funding acquisition, Y.I.G. and M.L.D.W. All authors have read and agreed to the published version of the manuscript.

Funding

This work was supported by the Ministry of Higher Education Malaysia through the Fundamental Research Grant Scheme (FRGS) under Grant FRGS/1/2023/TK08/HWUM/02/2.

Data Availability Statement

Data is contained within the article.

Conflicts of Interest

The authors declare no conflict of interest.

Appendix A

Figure A1. Hygroscopicity test result of 2.5 h annealing time, illustrated as material mass change with incremental and decremental RH.
Nanomaterials 15 01508 g0a1
Figure A2. Hygroscopicity test result of 3.0 h annealing time, illustrated as material mass change with incremental and decremental RH.
Nanomaterials 15 01508 g0a2
Figure A3. Hygroscopicity test result of 3.5 h annealing time, illustrated as material mass change with incremental and decremental RH.
Nanomaterials 15 01508 g0a3
Figure A4. Hygroscopicity test result of 100 °C annealing temperature, illustrated as material mass change with incremental and decremental RH.
Nanomaterials 15 01508 g0a4
Figure A5. Hygroscopicity test result of 180 °C annealing temperature, illustrated as material mass change with incremental and decremental RH.
Nanomaterials 15 01508 g0a5
Figure A6. Hygroscopicity test result of 3 layers SnO2-HMT, illustrated as material mass change with incremental and decremental RH.
Nanomaterials 15 01508 g0a6
Figure A7. Hygroscopicity test result of hybrid layers ZnO/SnO2-HMT, illustrated as material mass change with incremental and decremental RH.
Nanomaterials 15 01508 g0a7

References

  1. Nunes, D.; Pimentel, A.; Gonçalves, A.; Pereira, S.; Branquinho, R.; Barquinha, P.; Fortunato, E.; Martins, R. Metal oxide nanostructures for sensor applications. Semicond. Sci. Technol. 2019, 34, 043001. [Google Scholar] [CrossRef]
  2. George, J.M.; Antony, A.; Mathew, B. Metal oxide nanoparticles in electrochemical sensing and biosensing: A review. Microchim. Acta 2018, 185, 358. [Google Scholar] [CrossRef] [PubMed]
  3. Kaur, N.; Singh, M.; Moumen, A.; Duina, G.; Comini, E. 1D titanium dioxide: Achievements in chemical sensing. Materials 2020, 13, 2974. [Google Scholar] [CrossRef] [PubMed]
  4. Singh, Y.; Ansari, M.T.I.; Raghuwanshi, S.K. Design and development of titanium dioxide (TiO2)-coated eFBG sensor for the detection of petrochemicals adulteration. IEEE Trans. Instrum. Meas. 2021, 70, 7002508. [Google Scholar] [CrossRef]
  5. Li, F.; Li, P.; Zhang, H. Preparation and research of a high-performance ZnO/SnO2 humidity sensor. Sensors 2021, 22, 293. [Google Scholar] [CrossRef]
  6. Chavali, M.S.; Nikolova, M.P. Metal oxide nanoparticles and their applications in nanotechnology. SN Appl. Sci. 2019, 1, 607. [Google Scholar] [CrossRef]
  7. Kok, S.P.; Go, Y.I.; Xu, W.; Wong, M.D. Advances in Fibre Bragg Grating (FBG) Sensing: A Review of Conventional and New Approaches and Novel Sensing Materials in Harsh and Emerging Industrial Sensing. IEEE Sens. J. 2024, 24, 29485–29505. [Google Scholar] [CrossRef]
  8. Tomer, V.K.; Duhan, S. A facile nanocasting synthesis of mesoporous Ag-doped SnO2 nanostructures with enhanced humidity sensing performance. Sens. Actuators B 2016, 223, 750–760. [Google Scholar] [CrossRef]
  9. Riza, M.A.; Go, Y.I.; Maier, R.R.; Harun, S.W.; Anas, S.B. Hygroscopic materials and characterization techniques for fiber sensing applications: A review. Sens. Mater. 2020, 32, 3755–3772. [Google Scholar] [CrossRef]
  10. Charbgoo, F.; Ramezani, M.; Darroudi, M. Bio-sensing applications of cerium oxide nanoparticles: Advantages and disadvantages. Biosens. Bioelectron. 2017, 96, 33–43. [Google Scholar] [CrossRef]
  11. Amara, U.; Mahmood, K.; Awais, M.; Khalid, M.; Nasir, M.; Riaz, S.; Hayat, A.; Nawaz, M.H. Nickel-doped iron oxide nanoparticle-conjugated porphyrin interface (porphyrin/Fe2O3@Ni) for the non-enzymatic detection of dopamine from lacrimal fluid. Dalton Trans. 2022, 51, 5098–5107. [Google Scholar] [CrossRef]
  12. Saritas, S. Temperature-dependent gas sensor application of chromium oxide structure. J. Mater. Sci. Mater. Electron. 2023, 34, 679. [Google Scholar] [CrossRef]
  13. Mounasamy, V.; Mani, G.K.; Madanagurusamy, S. Vanadium oxide nanostructures for chemiresistive gas and vapour sensing: A review on state of the art. Microchim. Acta 2020, 187, 253. [Google Scholar] [CrossRef] [PubMed]
  14. Tang, Y.; Li, Z.; Ma, J.; Wang, L.; Yang, J.; Du, B.; Yu, Q.; Zu, X. Highly sensitive surface acoustic wave (SAW) humidity sensors based on sol–gel SiO2 films: Investigations on the sensing property and mechanism. Sens. Actuators B 2015, 215, 283–291. [Google Scholar] [CrossRef]
  15. Li, P.; Yang, F. Preparation and performance of TiO2/ZnO humidity sensor based on TiO2. Mater. Sci. Eng. B 2023, 298, 116902. [Google Scholar] [CrossRef]
  16. Esposito, S. “Traditional” sol-gel chemistry as a powerful tool for the preparation of supported metal and metal oxide catalysts. Materials 2019, 12, 668. [Google Scholar] [CrossRef]
  17. Kok, S.P.; Go, Y.I.; Wong, M.L.D. Effect of Hygroscopic and Electronic Materials, Challenges, and Sensing Requirements in Humidity-Controlled Industry. J. Electron. Mater. 2025, 54, 6960–6981. [Google Scholar] [CrossRef]
  18. Ungula, J.; Dejene, B.; Swart, H. Effect of annealing on the structural, morphological and optical properties of Ga-doped ZnO nanoparticles by reflux precipitation method. Results Phys. 2017, 7, 2022–2027. [Google Scholar] [CrossRef]
  19. Gao, M.; Xiao, W.; Miao, L.; Yang, Z.; Liang, W.; Ao, T.; Yang, Q.; Chen, W. Prussian blue and its analogs: A robust platform for efficient capacitive deionization. Desalination 2024, 574, 117278. [Google Scholar] [CrossRef]
  20. Riza, M.A.; Go, Y.I.; Maier, R.R.; Harun, S.W.; Anas, S.B.A. Characterization of hysteresis free, low-temperature hydrothermally synthesized zinc oxide for enhanced humidity sensing. Sens. Int. 2021, 2, 100106. [Google Scholar] [CrossRef]
  21. Park, W.-T.; Son, I.; Park, H.-W.; Chung, K.-B.; Xu, Y.; Lee, T.; Noh, Y.-Y. Facile routes to improve performance of solution-processed amorphous metal oxide thin film transistors by water vapor annealing. ACS Appl. Mater. Interfaces 2015, 7, 13289–13294. [Google Scholar] [CrossRef] [PubMed]
  22. Muthee, D.K.; Dejene, B.F. Effect of annealing temperature on structural, optical, and photocatalytic properties of titanium dioxide nanoparticles. Heliyon 2021, 7, e07269. [Google Scholar] [CrossRef] [PubMed]
  23. Sikarwar, S.; Yadav, B.; Singh, S.; Dzhardimalieva, G.; Pomogailo, S.; Golubeva, N.D.; Pomogailo, A. Fabrication of nanostructured yttria stabilized zirconia multilayered films and their optical humidity sensing capabilities based on transmission. Sens. Actuators B 2016, 232, 283–291. [Google Scholar] [CrossRef]
  24. Lv, C.; Hu, C.; Luo, J.; Liu, S.; Qiao, Y.; Zhang, Z.; Song, J.; Shi, Y.; Cai, J.; Watanabe, A. Recent advances in graphene-based humidity sensors. Nanomaterials 2019, 9, 422. [Google Scholar] [CrossRef]
  25. Low, W.H.; Khiew, P.S.; Lim, S.S.; Siong, C.W.; Ezeigwe, E.R. Recent development of mixed transition metal oxide and graphene/mixed transition metal oxide based hybrid nanostructures for advanced supercapacitors. J. Alloys Compd. 2019, 775, 1324–1356. [Google Scholar] [CrossRef]
  26. Li, S.; Wan, H.; Lin, J.; Min, J. Physicochemical interactions between amorphous metal oxide and polymer in metal–polymer hybrid materials. Mater. Des. 2023, 230, 111993. [Google Scholar] [CrossRef]
  27. Goldoni, A.; Alijani, V.; Sangaletti, L.; D’Arsiè, L. Advanced promising routes of carbon/metal oxides hybrids in sensors: A review. Electrochim. Acta 2018, 266, 139–150. [Google Scholar] [CrossRef]
  28. Braunfelds, J.; Senkans, U.; Skels, P.; Janeliukstis, R.; Salgals, T.; Redka, D.; Lyashuk, I.; Porins, J.; Spolitis, S.; Haritonovs, V. FBG-based sensing for structural health monitoring of road infrastructure. J. Sens. 2021, 2021, 8850368. [Google Scholar] [CrossRef]
  29. Li, W.; Long, Y.; Yan, Y.; Xiao, K.; Wang, Z.; Zheng, D.; Leal-Junior, A.; Kumar, S.; Ortega, B.; Marques, C. Wearable photonic smart wristband for cardiorespiratory function assessment and biometric identification. Opto-Electron. Adv. 2025, 8, 240254. [Google Scholar] [CrossRef]
  30. Rao, G.; Feng, W.; Zhang, J.; Wang, S.; Chen, L.; Guo, Z.; Chen, W. Simulation approach to decomposition kinetics and thermal hazards of hexamethylenetetramine. J. Therm. Anal. Calorim. 2019, 135, 2447–2456. [Google Scholar] [CrossRef]
  31. American Society for Testing and Materials. Moisture Absorption Properties and Equilibrium Conditioning of Polymer Matrix Composite Materials; American Society for Testing and Materials: West Conshohocken, PA, USA, 2020. [Google Scholar]
  32. Dai, F.; Zhuang, Q.; Huang, G.; Deng, H.; Zhang, X. Infrared spectrum characteristics and quantification of OH groups in coal. ACS Omega 2023, 8, 17064–17076. [Google Scholar] [CrossRef]
  33. Xiao, P.; Gu, J.; Wan, C.; Wang, S.; He, J.; Zhang, J.; Huang, Y.; Kuo, S.-W.; Chen, T. Ultrafast formation of free-standing 2D carbon nanotube thin films through capillary force driving compression on an air/water interface. Chem. Mater. 2016, 28, 7125–7133. [Google Scholar] [CrossRef]
  34. Carlsson, L.A.; Du, E. Water uptake in polymer composites with voids. In Durability of Composites in a Marine Environment 2; Springer: Cham, Switzerland, 2017; pp. 33–57. [Google Scholar]
  35. Riza, M.A.; Go, Y.I.; Harun, S.W.; Anas, S.B.A. Effect of additive concentration on crystalline surface of ZnO nanostructures morphology for enhanced humidity sensing. Sens. Int. 2023, 4, 100211. [Google Scholar] [CrossRef]
  36. Zhang, J.; Shen, X.; Qian, M.; Xiang, Z.; Hu, X. An optical fiber sensor based on polyimide coated fiber Bragg grating for measurement of relative humidity. Opt. Fiber Technol. 2021, 61, 102406. [Google Scholar] [CrossRef]
  37. Wang, M.-S.; Lei, M.; Wang, Z.-Q.; Zhao, X.; Xu, J.; Yang, W.; Huang, Y.; Li, X. Scalable preparation of porous micron-SnO2/C composites as high performance anode material for lithium ion battery. J. Power Sources 2016, 309, 238–244. [Google Scholar] [CrossRef]
  38. Velumani, M.; Meher, S.; Alex, Z. Composite metal oxide thin film based impedometric humidity sensors. Sens. Actuators B 2019, 301, 127084. [Google Scholar] [CrossRef]
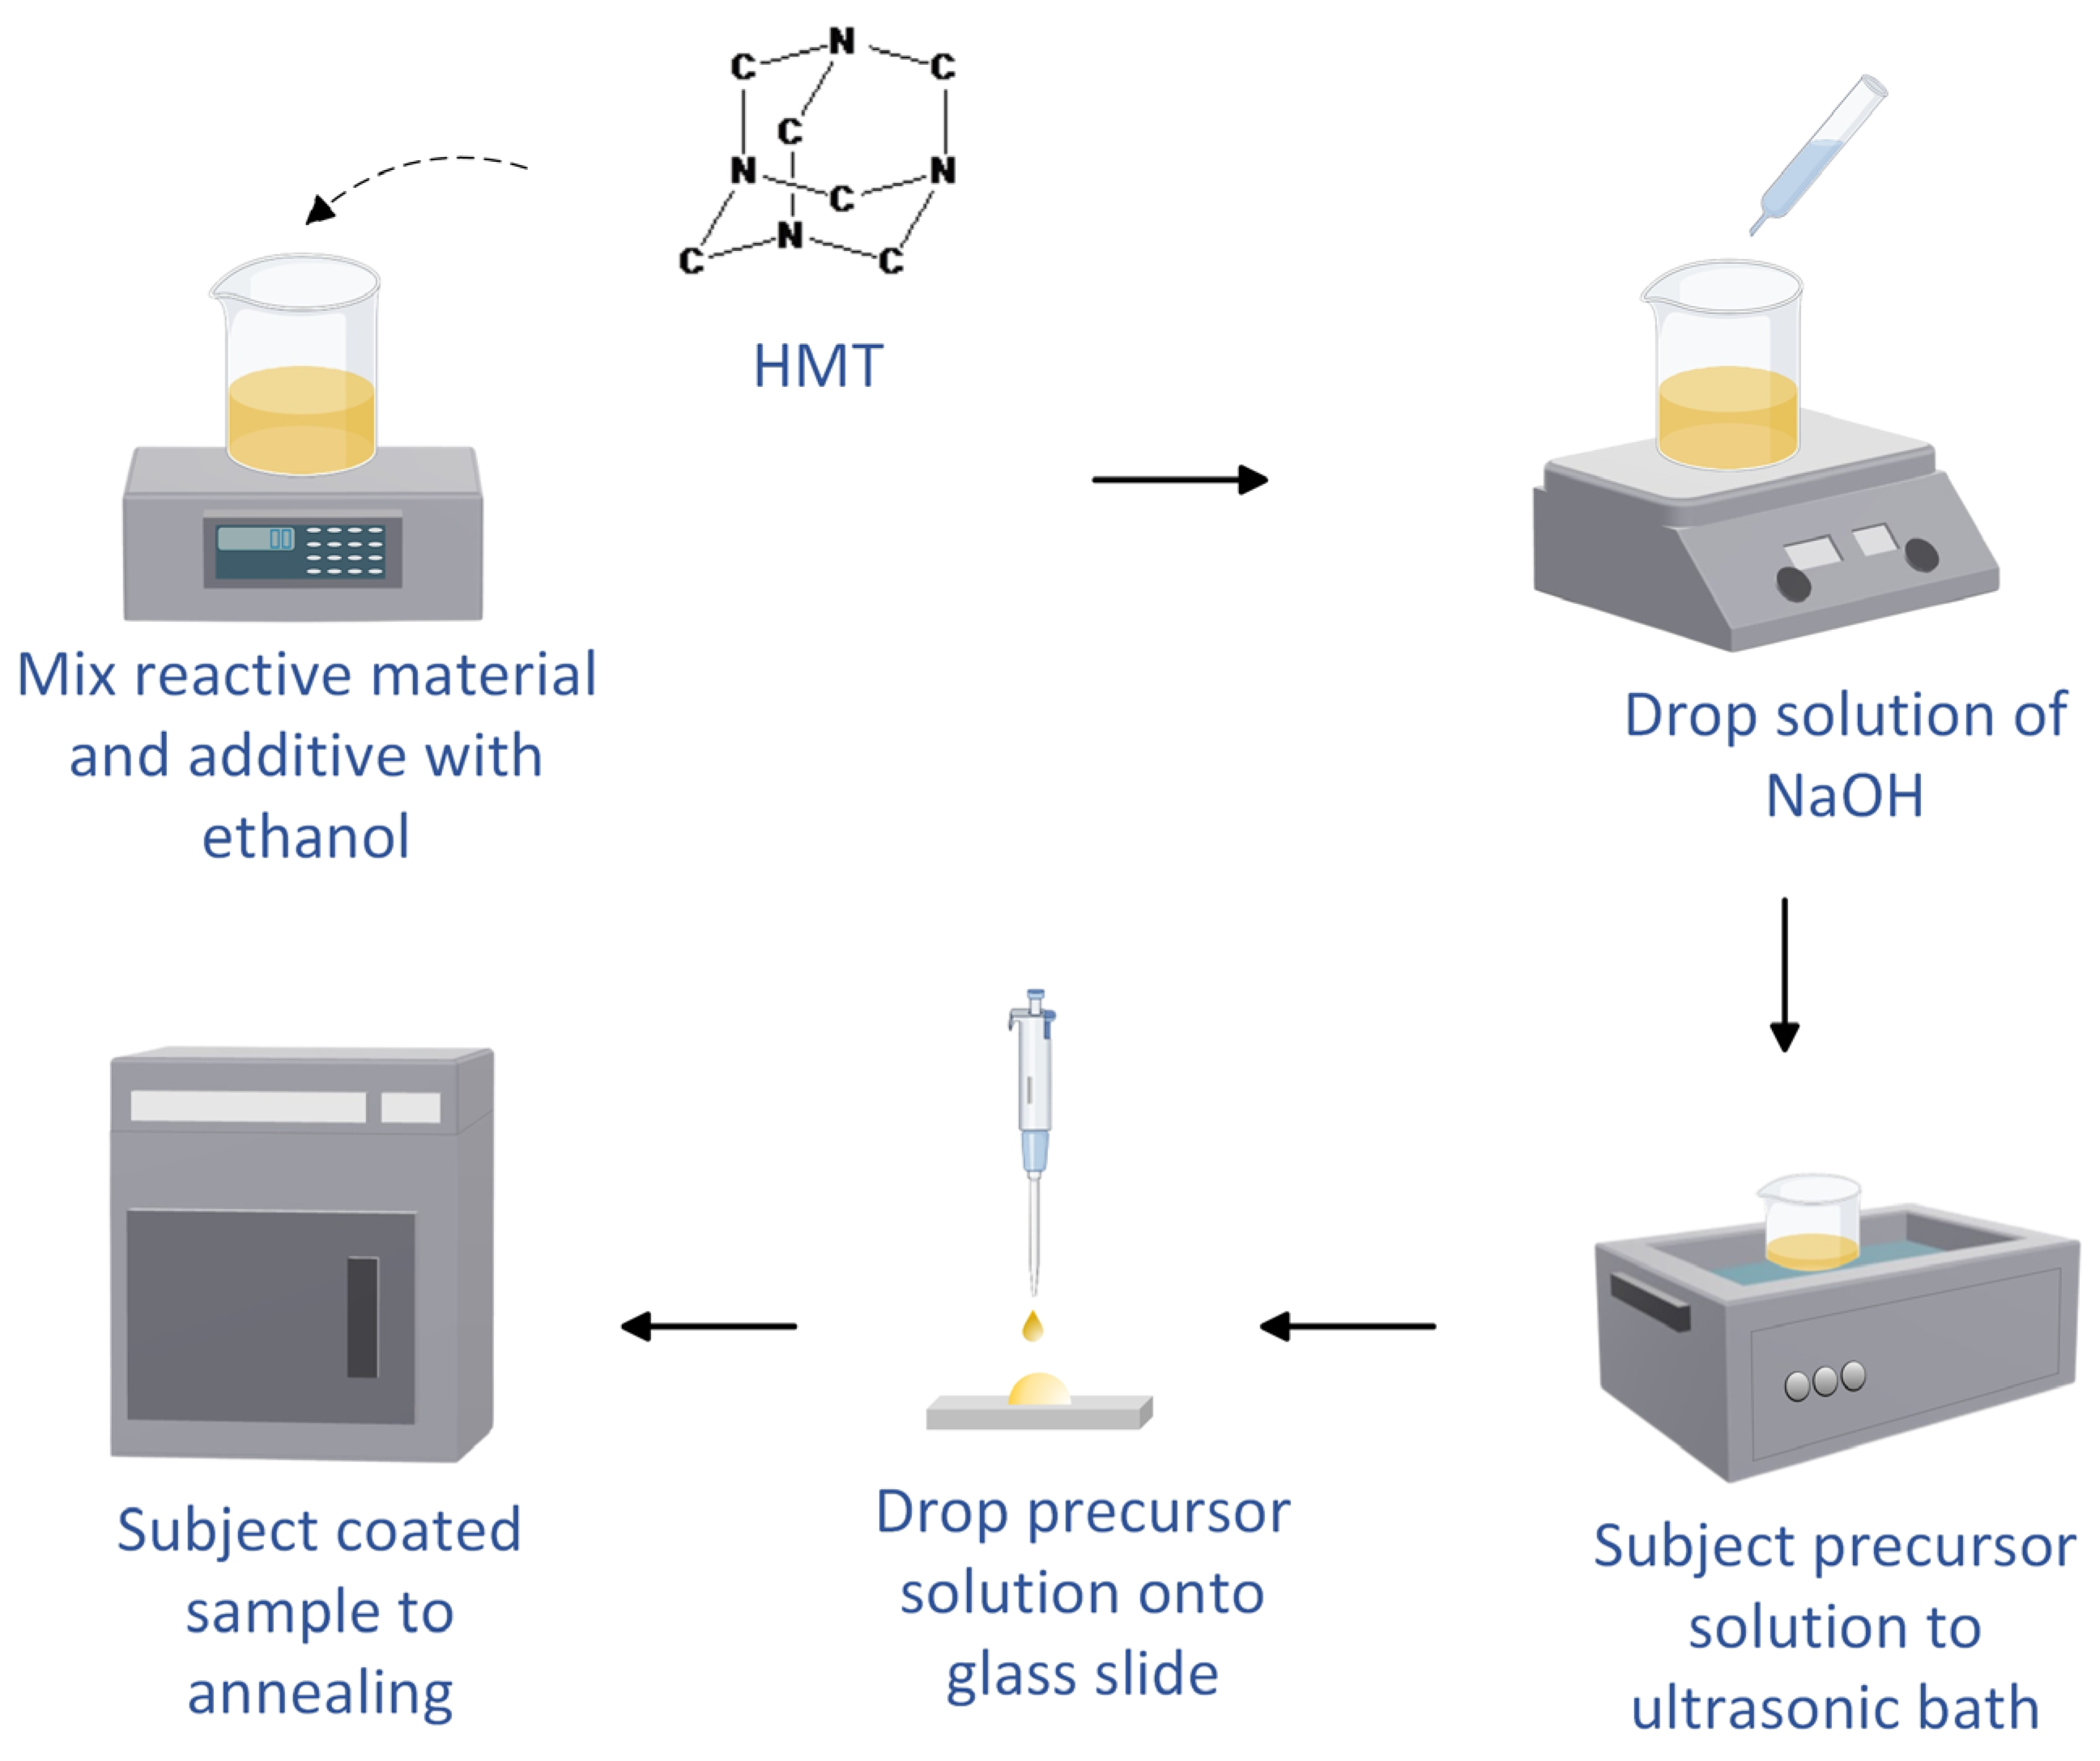
Figure 1. Schematic diagram of low-temperature hydrothermal synthesis.
Nanomaterials 15 01508 g001
Figure 2. Hygroscopicity test result of 2.5 h annealing time, illustrated as mass uptake ratio with incremental and decremental RH.
Nanomaterials 15 01508 g002
Figure 3. Hygroscopicity test result of 3.0 h annealing time, illustrated as mass uptake ratio with incremental and decremental RH.
Nanomaterials 15 01508 g003
Figure 4. Hygroscopicity test result of 3.5 h annealing time, illustrated as mass uptake ratio with incremental and decremental RH.
Nanomaterials 15 01508 g004
Figure 5. Hygroscopicity test result of 100 °C annealing temperature, illustrated as mass uptake ratio with incremental and decremental RH.
Nanomaterials 15 01508 g005
Figure 6. Hygroscopicity test result of 180 °C annealing temperature, illustrated as mass uptake ratio with incremental and decremental RH.
Nanomaterials 15 01508 g006
Figure 7. Hygroscopicity test result of 3 layers SnO2-HMT, illustrated as mass uptake ratio with incremental and decremental RH.
Nanomaterials 15 01508 g007
Figure 8. Hygroscopicity test result of hybrid layers ZnO/SnO2-HMT, illustrated as mass uptake ratio with incremental and decremental RH.
Nanomaterials 15 01508 g008
Figure 9. FTIR spectra of 2.5 h, 3 h, and 3.5 h annealing time.
Nanomaterials 15 01508 g009
Figure 10. FTIR spectra of 100 °C, 140 °C, and 180 °C annealing temperature.
Nanomaterials 15 01508 g010
Figure 11. Microscope image at 20× magnification of (a) 2.5 h, (b) 3 h, and (c) 3.5 h annealing time.
Nanomaterials 15 01508 g011
Figure 12. Microscope image at 20× magnification of (a) 100 °C and (b) 180 °C annealing temperature.
Nanomaterials 15 01508 g012
Figure 13. Microscope image at 20× magnification of (a) 3 layers SnO2-HMT and (b) hybrid layers ZnO/SnO2-HMT.
Nanomaterials 15 01508 g013
Figure 14. FESEM of SnO2-HMT single layer under magnification of (a) 2000×, (b) 10,000x, (c) 30,000×.
Nanomaterials 15 01508 g014
Figure 15. FESEM of SnO2-HMT multilayer under magnification of (a) 2000×, (b) 10,000×, (c) 30,000×.
Nanomaterials 15 01508 g015
Figure 16. Conceptual schematic diagram of water–surface interaction. Adapted from [14].
Nanomaterials 15 01508 g016
Figure 17. Reflected wavelength of SnO2-HMT-coated FBG at different RH levels (first incremental RH cycle).
Nanomaterials 15 01508 g017
Figure 18. Reflected wavelength of SnO2-HMT-coated FBG at different RH levels (second incremental RH cycle).
Nanomaterials 15 01508 g018
Figure 19. Reflected wavelength of SnO2-HMT-coated FBG at different RH levels (third incremental RH cycle).
Nanomaterials 15 01508 g019
Table 1. Metal oxide in various sensing applications.
Metal OxideTarget ApplicationsAdvantagesRef
TiO2Chemical/gas sensingChemically and thermally stable[4]
ZnOHumidity sensingChemically and thermally stable[9]
ZnO/SnO2 compositeHumidity sensingImproved surface area, increased oxygen vacancies[5]
CeO2BiosensingMechanically stable, fast electron transfer kinetics[10]
Ni-doped Fe2O3BiosensingNon-toxicity, anti-interference[11]
Cr2O3Gas sensingCorrosion resistant[12]
V2O5Gas sensingChemically and thermally stable[13]
SiO2Humidity sensingPorous nature[14]
TiO2/ZnO compositeHumidity sensingIncreased oxygen vacancies, good linearity[15]
SnO2-HMTHumidity sensingEnhanced hygroscopicity, negligible hysteresisThis work
Table 2. Summary of hygroscopicity test performance.
Annealing Time (hours)Annealing
Temperature (°C)
m value
(Incremental RH)
m value
(Decremental RH)
Hysteresis
2.51400.16330.1807Slightly higher
3.01400.16440.1648Negligible
3.51400.16320.2033Significant
3.01000.19170.1981Significant
3.01800.07670.0533Slightly higher
Table 3. Optical spectrum analysis of three humidity cycles.
Humidity Cycle%RHReflected Wavelength (nm)Bragg Wavelength Shift (pm)Sensitivity (pm)
First401540.7001.5
501540.7220
601540.7440
701540.7550
801540.7660
Second401540.7001.7
501540.7330
601540.7550
701540.7660
801540.7770
Third401540.7200.9
501540.720
601540.7310
701540.7530
801540.7530
Disclaimer/Publisher’s Note: The statements, opinions and data contained in all publications are solely those of the individual author(s) and contributor(s) and not of MDPI and/or the editor(s). MDPI and/or the editor(s) disclaim responsibility for any injury to people or property resulting from any ideas, methods, instructions or products referred to in the content.