
New Experimental Spectra and Quantitative Modeling of the Bending Dyad of Silane in the 900 cm−1 Region for Its 3 Isotopologues

 , ,
, ,  , , and
Abstract
:
1. Introduction
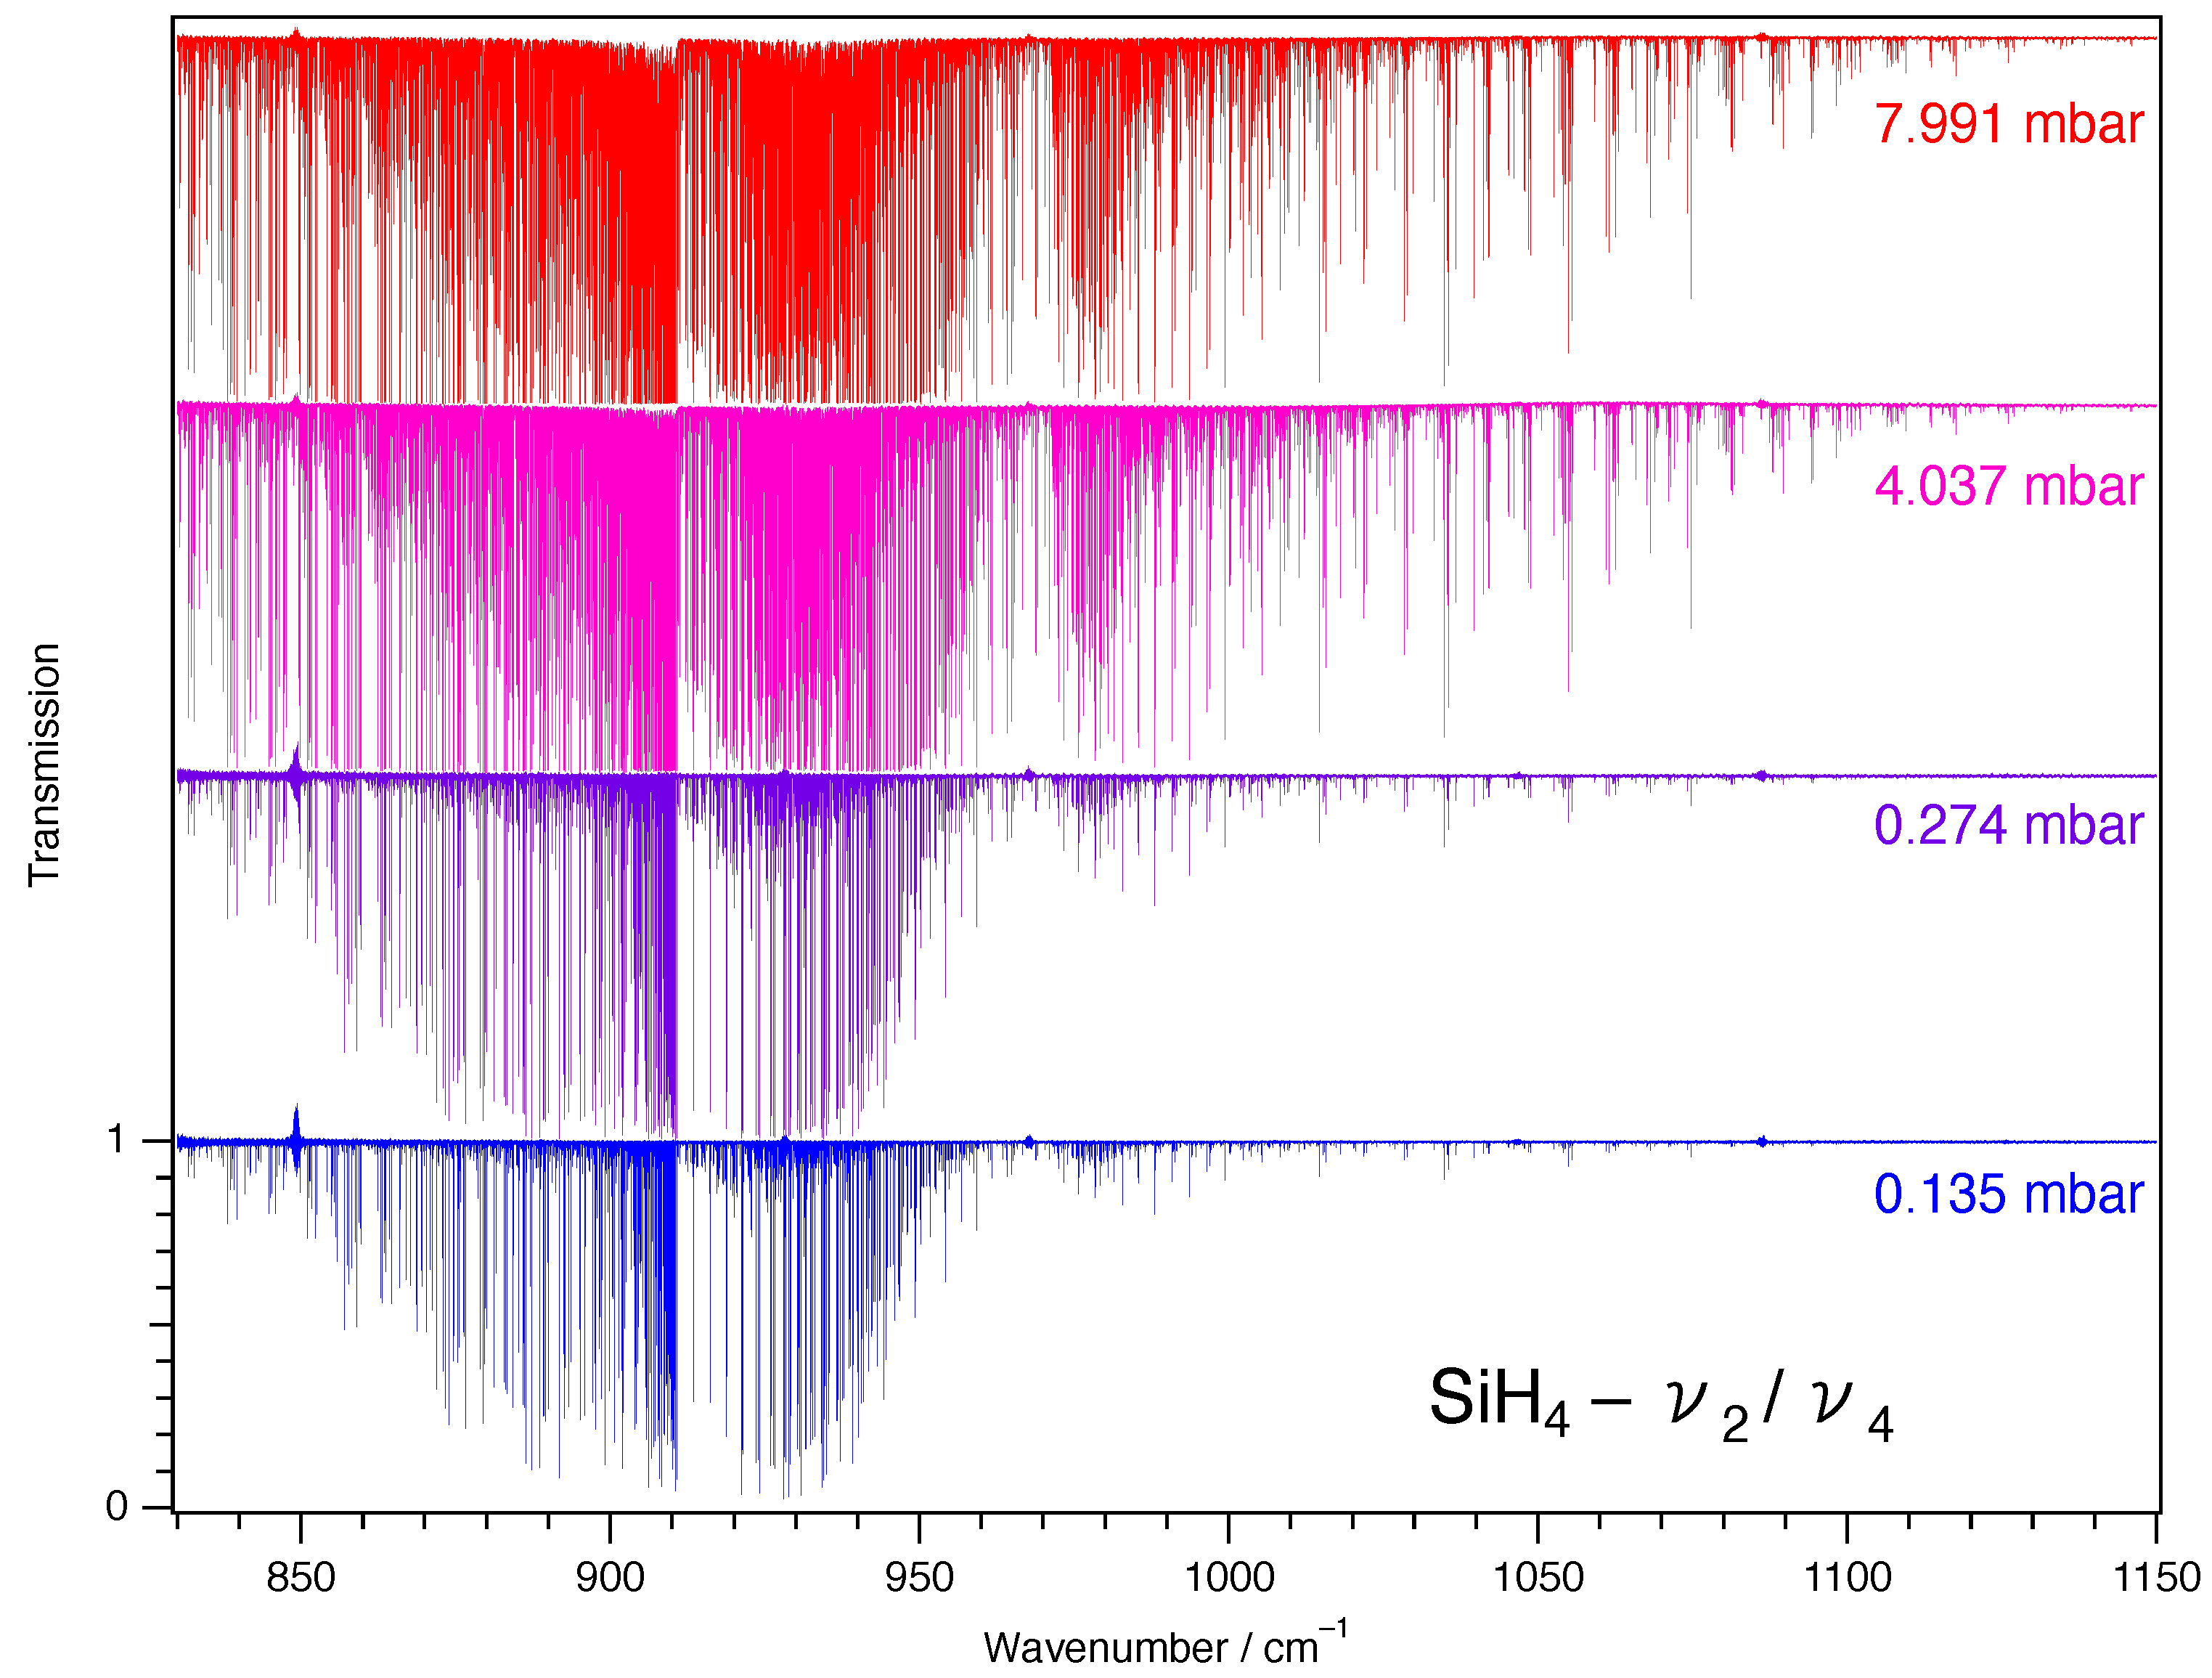
2. Experimental Details
3. Theoretical Background
3.1. Effective Hamiltonian
- The ground state effective Hamiltonian
- The bending dyad effective Hamiltonian
3.2. Effective Dipole Moment Operator
3.3. Basis Sets
- For the doubly degenerate mode , we use a symmetrized doubly degenerate harmonic oscillator basis set denotedwith for the dyad under consideration, and being the usual vibrational angular momentum quantum numbers and .
- For the triply degenerate mode , we use a symmetrized triply degenerate harmonic oscillator basis set denotedwith for the dyad under consideration, and being the usual vibrational angular momentum quantum numbers and , while is a multiplicity index.
4. Line Intensity Measurements and Uncertainty Analysis
4.1. Line Intensities
4.2. Uncertainty Analysis
5. Analysis and Discussion
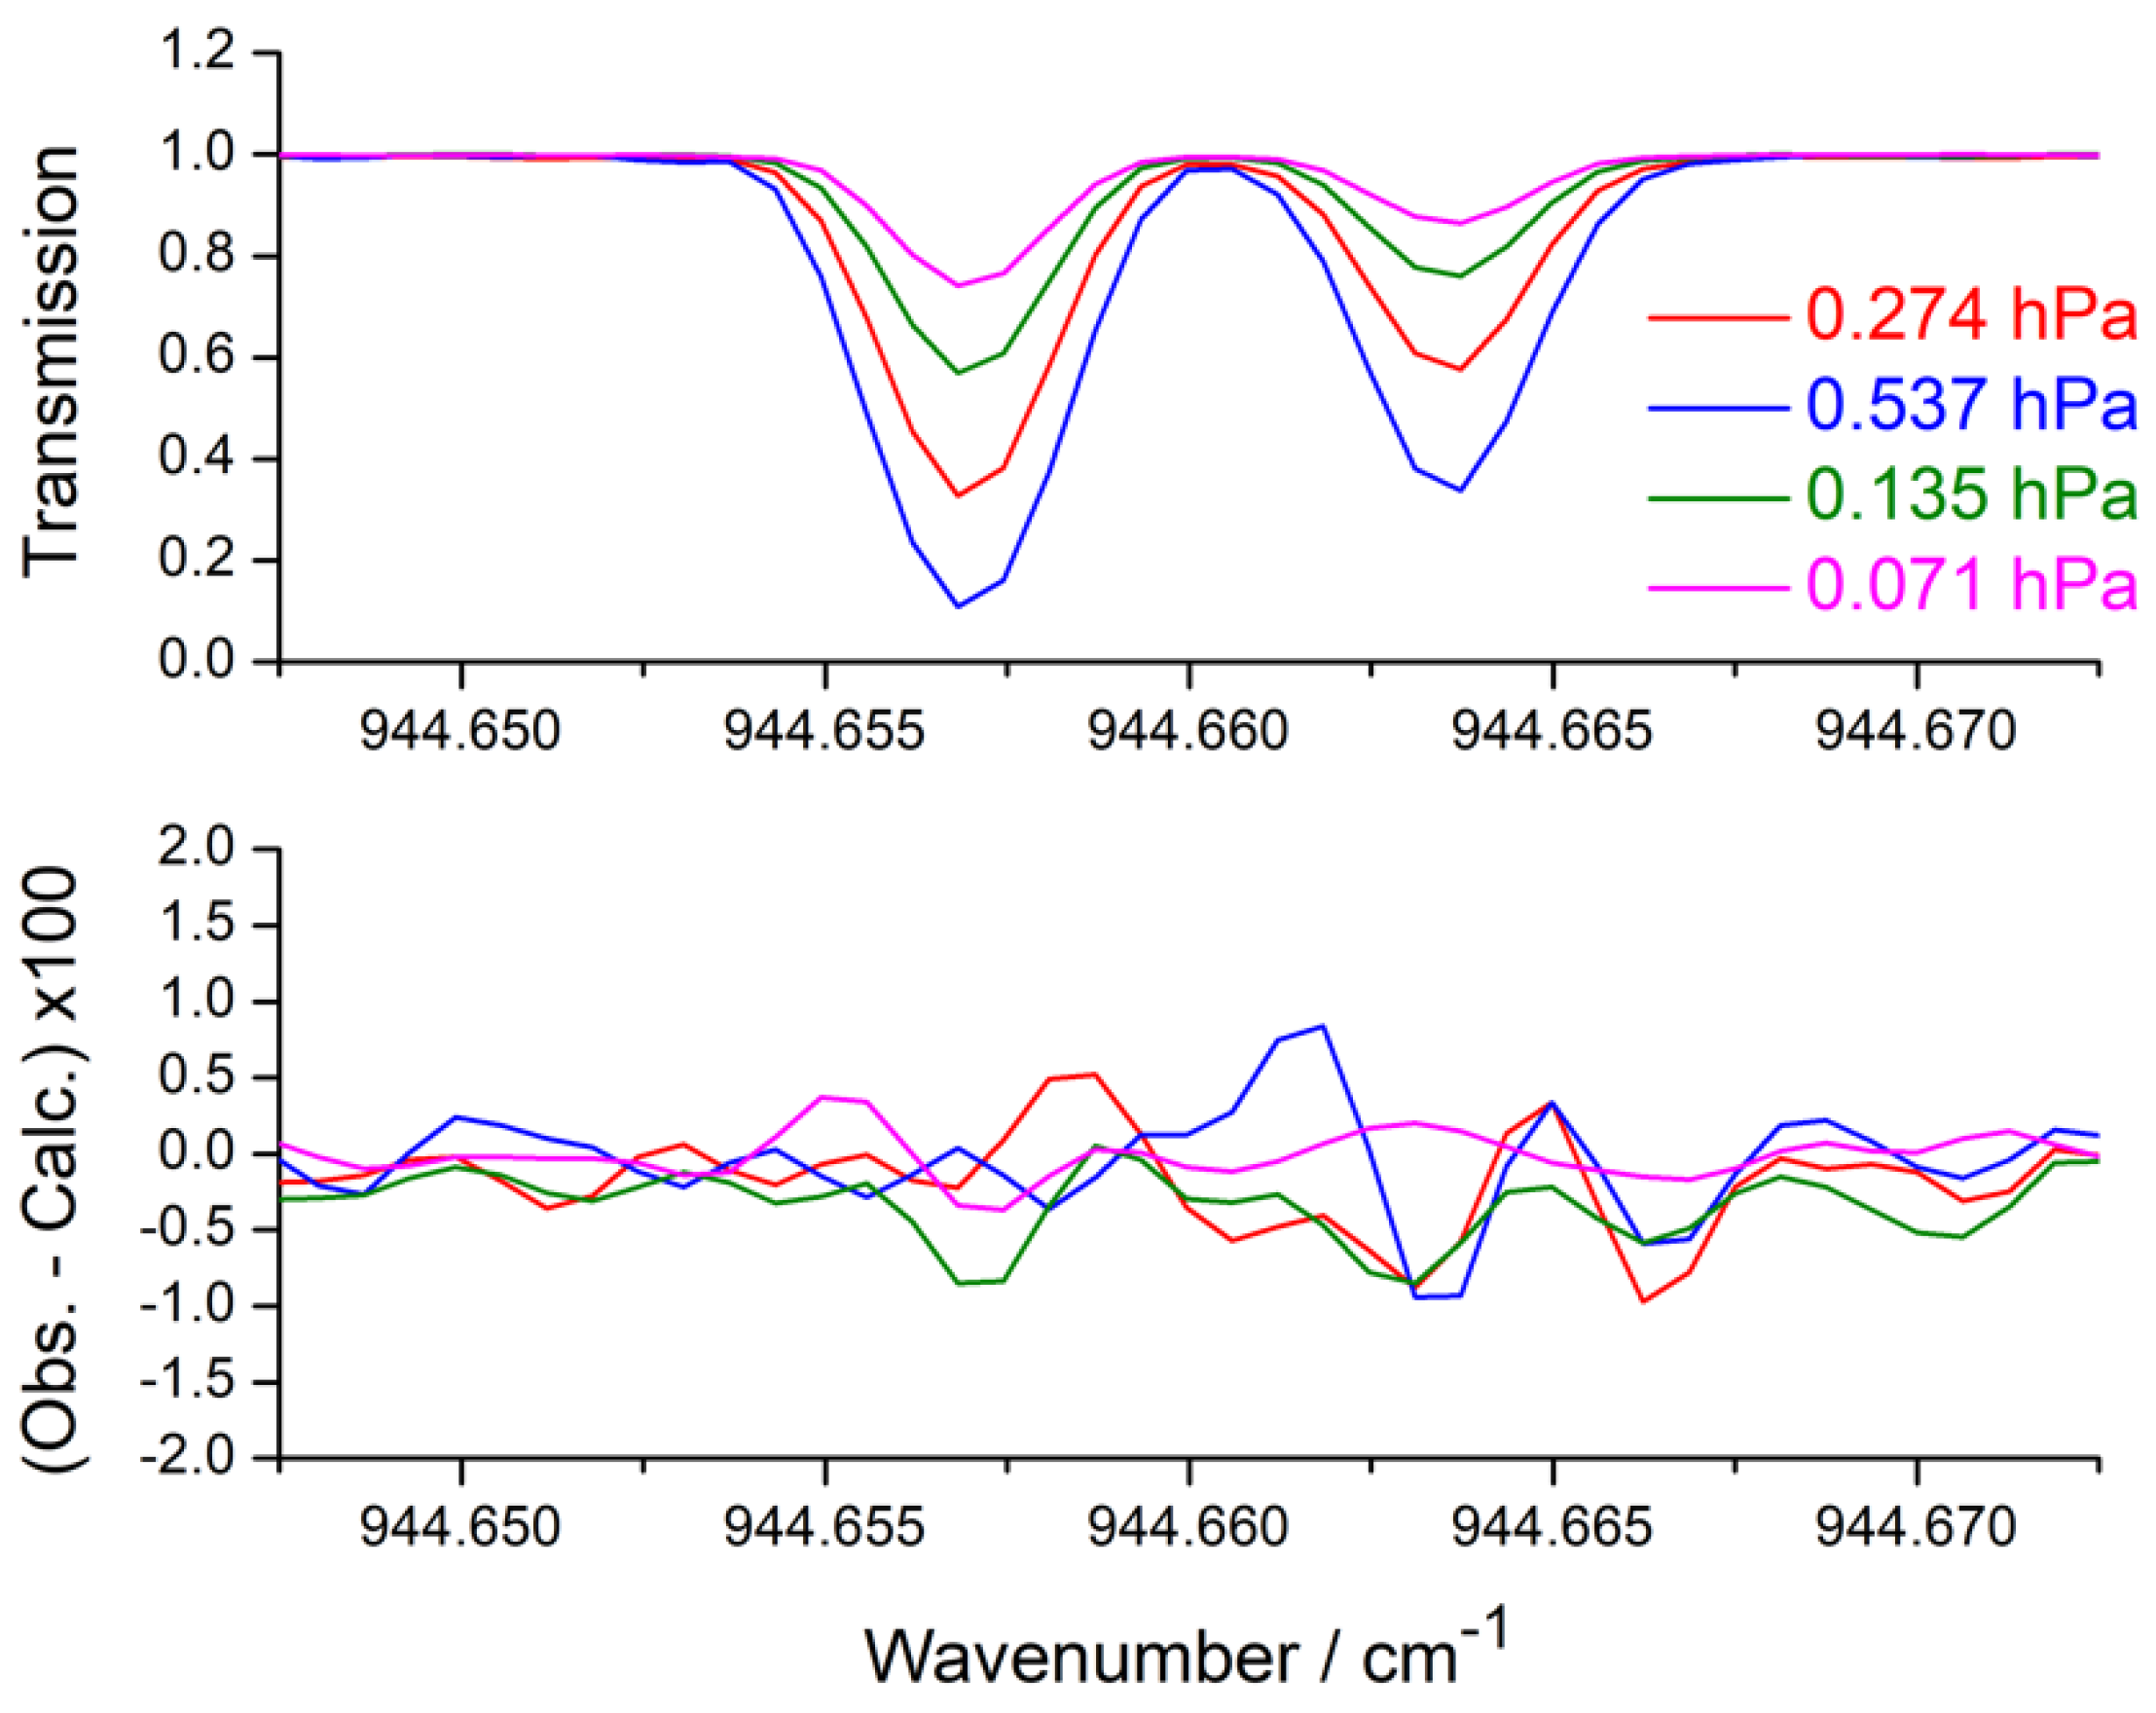
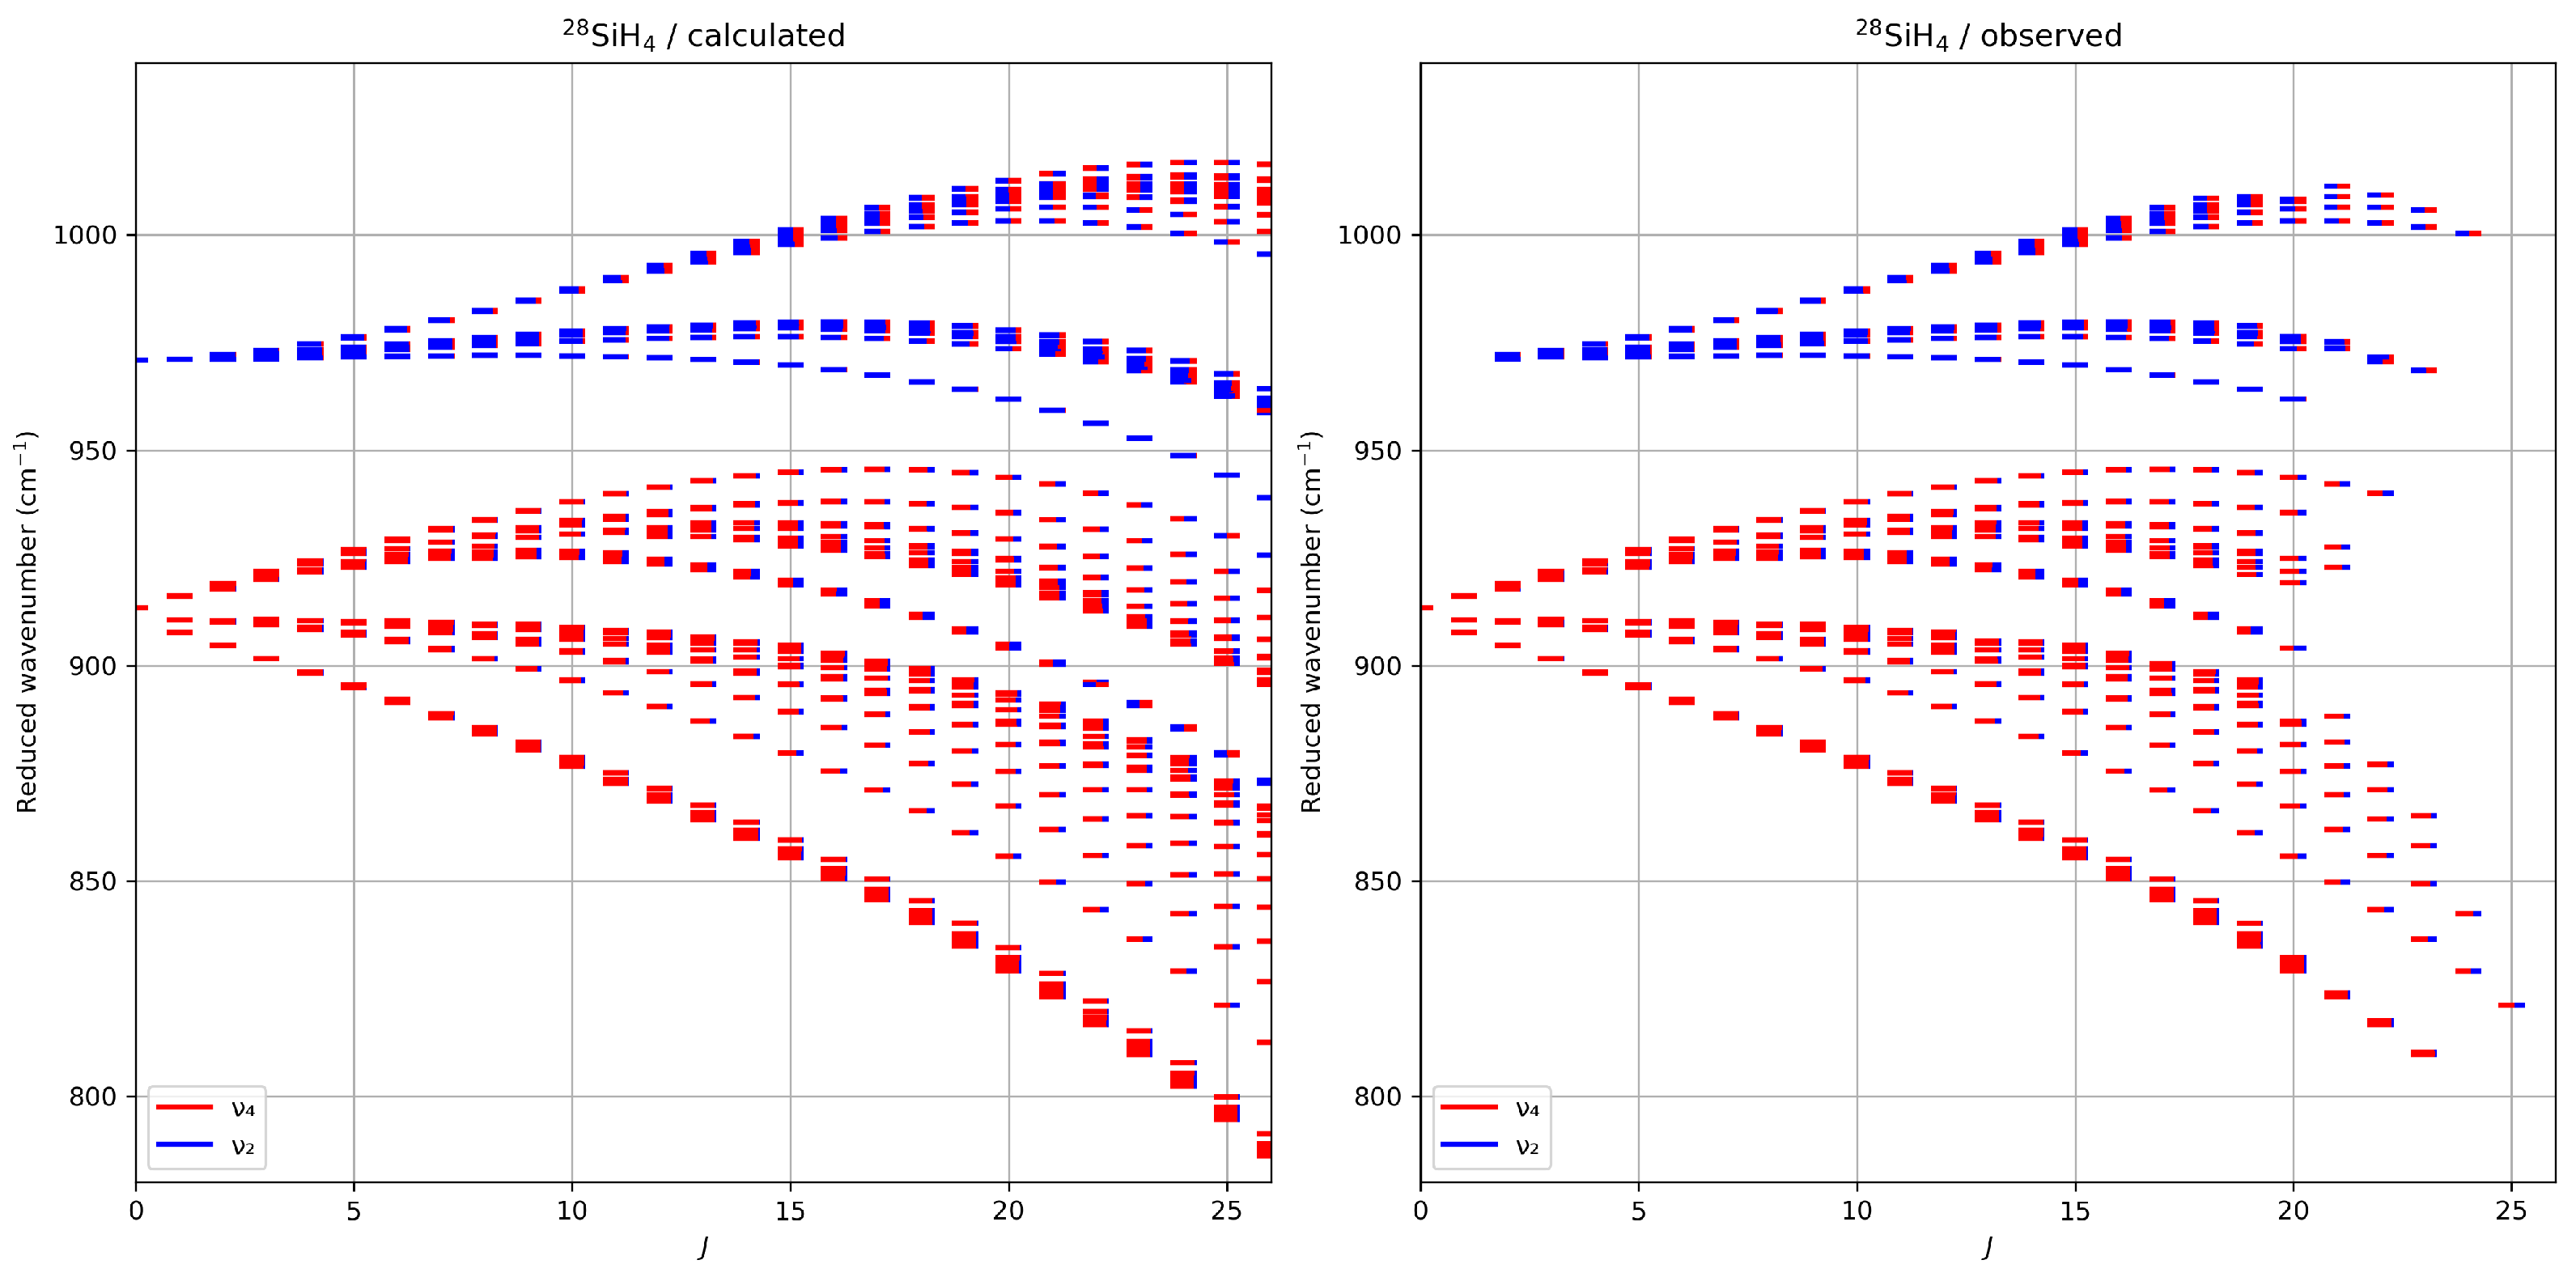
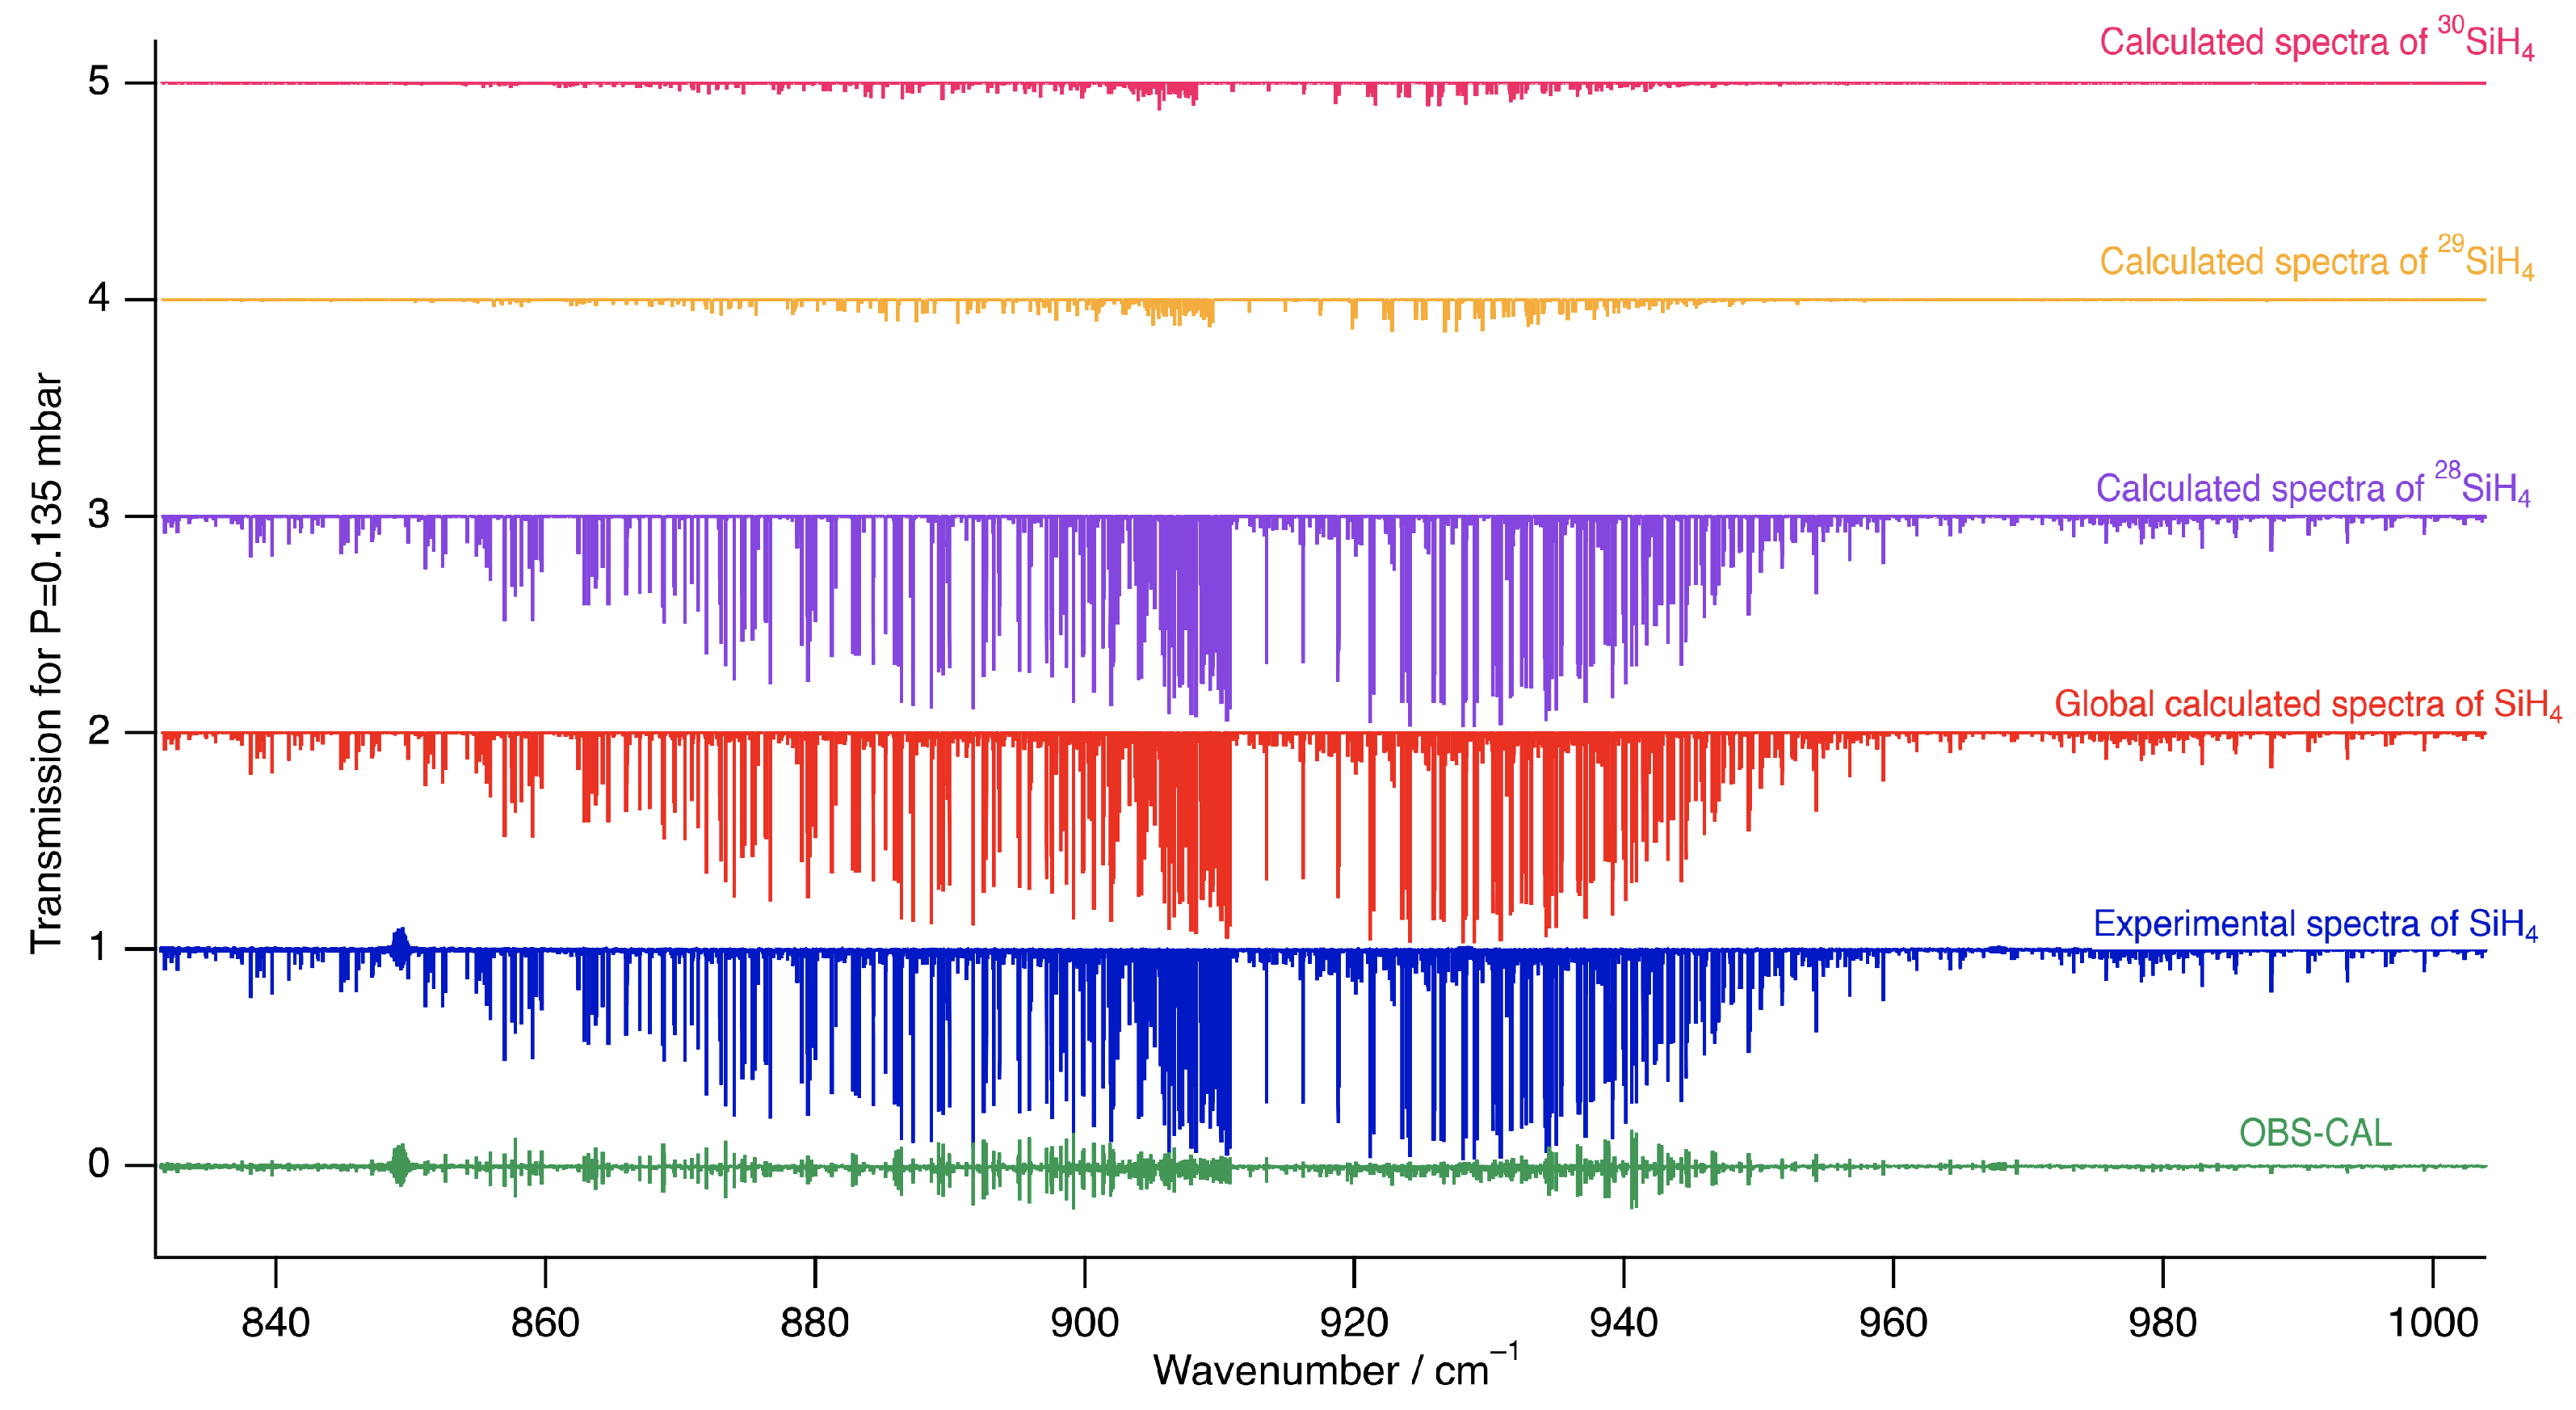
5.1. Line Positions
5.2. Line Intensities
6. SiCaSDa Database Update
7. Conclusions and Perspectives
Author Contributions
Funding
Institutional Review Board Statement
Informed Consent Statement
Data Availability Statement
Acknowledgments
Conflicts of Interest
Abbreviations
| STDS | Spherical Top Data System |
| XTDS | Xtended Top Data System |
| RMS | Root Mean Square |
References
- Steward, W.B.; Nielsen, H.H. The Infrared absorption spectrum of silane. J. Chem. Phys. 1934, 2, 712. [Google Scholar] [CrossRef]
- Steward, W.B.; Nielsen, H.H. The infrared absorption spectrum of silane. Phys. Rev. 1935, 47, 828. [Google Scholar] [CrossRef]
- Goldhaber, D.M.; Betz, A. Silane in IRC+ 10216. Astrophys. J. 1984, 279, L55–L58. [Google Scholar] [CrossRef]
- Treffers, R.R.; Larson, H.P.; Fink, U.; Gautier, T.N. Upper limits to trace constituents in Jupiter’s atmosphere from an analysis of its 5-μm spectrum. Icarus 1978, 34, 331–343. [Google Scholar] [CrossRef]
- Larson, H.P.; Fink, U.; Smith, H.A.; Davis, D.S. The middle-infrared spectrum of Saturn-Evidence for phosphine and upper limits to other trace atmospheric constituents. Astrophys. J. 1980, 240, 327–337. [Google Scholar] [CrossRef]
- Seager, S.; Bains, W.; Hu, R. Biosignature gases in H2-dominated atmospheres on rocky exoplanets. Astrophys. J. 2013, 777, 95. [Google Scholar] [CrossRef]
- Greenwood, N.N.; Earnshaw, A. Chemistry of the Elements, 2nd ed.; Butterworth-Heinemann: Oxford, UK, 1997. [Google Scholar]
- Schneider, J.P.; Kay, M.S. Biochemistry: Concepts and Connections; Pearson: Boston, MA, USA, 2006. [Google Scholar]
- Ulenikov, O.N.; Gromova, O.V.; Bekhtereva, E.S.; Raspopova, N.I.; Kashirina, N.V.; Fomchenko, A.L.; Sydow, C.; Bauerecker, S. High resolution study of MSiH4 (M = 28, 29, 30) in the Dyad Region: Analysis of line positions, intensities and half-widths. J. Quant. Spectrosc. Radiat. Transf. 2017, 203, 496–510. [Google Scholar] [CrossRef]
- Faye, M.; Bordessoule, M.; Kanouté, B.; Brubach, J.B.; Roy, P.; Manceron, L. Improved mid infrared detector for high spectral or spatial resolution and synchrotron radiation use. Rev. Sci. Instrum. 2016, 87, 063119. [Google Scholar] [CrossRef]
- Anantharajah, A.; Kwabia Tchana, F.; Manceron, L.; Ndao, M.; Flaud, J.M.; Landsheere, X. Integrated band intensities and absorption cross sections of phosgene Cl2CO in the mid-infrared at 199, 250 and 300 K. J. Quant. Spectrosc. Radiat. Transf. 2019, 234, 71–77. [Google Scholar] [CrossRef]
- Amyay, B.; Gardez, A.; Georges, R.; Biennier, L.; Vander Auwera, J.; Richard, C.; Boudon, V. New investigation of the ν3 C–H stretching region of 12CH4 through the analysis of high temperature infrared emission spectra. J. Chem. Phys. 2018, 148, 134306. [Google Scholar] [CrossRef]
- Richard, C.; Boudon, V.; Rizopoulos, A.; Vander Auwera, J.; Kwabia Tchan, F. Line positions and intensities for the ν2/ν4 bands of 5 isotopologues of germane near 11.5 μm. J. Quant. Spectrosc. Radiat. Transf. 2021, 255, 107248. [Google Scholar] [CrossRef]
- Merkulova, M.; Boudon, V.; Manceron, L. Analysis of high-resolution spectra of SiF4 combination bands. J. Mol. Spectrosc. 2023, 391, 111738. [Google Scholar] [CrossRef]
- Hecht, K.T. The Vibration-Rotation Energies of Tetrahedral XY4 Molecules: Part I. Theory of Spherical Top Molecules. J. Mol. Spectrosc. 1961, 5, 355–389. [Google Scholar] [CrossRef]
- Champion, J.P.; Loëte, M.; Pierre, G. Spherical Top Spectra; Academic Press: San Diego, CA, USA, 1992; pp. 339–422. [Google Scholar] [CrossRef]
- Boudon, V.; Champion, J.P.; Gabard, T.; Loëte, M.; Michelot, F.; Pierre, G.; Rotger, M.; Wenger, C.; Rey, M. Symmetry-adapted tensorial formalism to model rovibrational and rovibronic spectra of molecules pertaining to various point groups. J. Mol. Spectrosc. 2004, 228, 620–634. [Google Scholar] [CrossRef]
- Boudon, V.; Champion, J.P.; Gabard, T.; Loëte, M.; Rotger, M.; Wenger, C. Spherical top theory and molecular spectra. In Handbook of High-Resolution Spectroscopy; John Wiley & Sons, Ltd.: Hoboken, NJ, USA, 2011; Volume 3, pp. 1437–1460. [Google Scholar] [CrossRef]
- Loëte, M. Complete development of the dipole moment of tetrahedral molecules. Application to triply degenerate bands and to the dyad ν2 and ν4. Can. J. Phys. 1983, 61, 1242–1259. [Google Scholar] [CrossRef]
- Louviot, M.; Boudon, V.; Manceron, L.; Roy, P.; Bermejo, D.; Martínez, R.Z. High-resolution spectroscopy and structure of osmium tetroxide. A benchmark study on 192OsO4. Inorg. Chem. 2012, 51, 10356–10365. [Google Scholar] [CrossRef]
- Reymond-Laruinaz, S.; Faye, M.; Boudon, V.; Doizi, D.; Manceron, L. High-resolution infrared spectroscopy and analysis of the ν2/ν4 bending dyad of ruthenium tetroxide. J. Mol. Spectrosc. 2017, 336, 29–35. [Google Scholar] [CrossRef]
- Boudon, V.; Manceron, L.; Richard, C. High-resolution spectroscopy and analysis of the ν3, ν4 and 2ν4 bands of SiF4 in natural isotopic abundance. J. Quant. Spectrosc. Radiat. Transf. 2020, 253, 107114. [Google Scholar] [CrossRef]
- Vander Auwera, J.; Reymond-Laruinaz, S.; Boudon, V.; Doizi, D.; Manceron, L. Line intensity measurements and analysis in the ν3 band of ruthenium tetroxide. J. Quant. Spectrosc. Radiat. Transf. 2018, 204, 103–111. [Google Scholar] [CrossRef]
- Herman, R.; Wallis, R. Influence of Vibration-Rotation Interaction on Line Intensities in Vibration-Rotation Bands of Diatomic Molecules. J. Chem. Phys. 1955, 23, 637–646. [Google Scholar] [CrossRef]
- Stone, A.J. Transformation between cartesian and spherical tensors. Mol. Phys. 1975, 29, 1461–1471. [Google Scholar] [CrossRef]
- Gordon, I.E.; Rothman, L.S.; Hill, C.; Kochanova, R.V.; Tan, Y.; Bernath, P.F.; Birk, M.; Boudon, V.; Campargue, A.; Chance, K.V.; et al. The HITRAN2016 molecular spectroscopic database. J. Quant. Spectrosc. Radiat. Transf. 2017, 203, 3–69. [Google Scholar] [CrossRef]
- Jacquinet-Husson, N.; Armante, R.; Scott, N.A.; Chedin, A.; Crepeau, L.; Boutammine, C.; Bouhdaoui, A.; Crevoisier, C.; Capelle, V.; Boonne, C.; et al. The 2015 edition of the GEISA spectroscopic database. J. Mol. Spectrosc. 2016, 327, 31–72. [Google Scholar] [CrossRef]
- Jacquemart, D.; Kwabia Tchana, F.; Lacome, N.; Kleiner, I. A complete set of line parameters for CH3I in the 10-µm spectral region. J. Quant. Spectrosc. Radiat. Transf. 2007, 105, 264–302. [Google Scholar] [CrossRef]
- Perrin, A.; Jacquemart, D.; Kwabia Tchana, F.; Lacome, N. Absolute line intensities measurements and calculations for the 5.7 and 3.6 µm bands of formaldehyde. J. Quant. Spectrosc. Radiat. Transf. 2009, 110, 700–716. [Google Scholar] [CrossRef]
- Raddaoui, E.; Troitsyna, L.; Dudaryonok, A.; Soulard, P.; Guinet, M.; Aroui, H.; Buldyreva, J.; Lavrentieva, N.; Jacquemart, D. Line parameters measurements and modeling for the ν2 band of CH3I: A complete line list for atmospheric databases. J. Quant. Spectrosc. Radiat. Transf. 2019, 232, 165–179. [Google Scholar] [CrossRef]
- Wenger, C.; Champion, J.P. Spherical top data system (STDS) software for the simulation of spherical top spectra. J. Quant. Spectrosc. Radiat. Transf. 1998, 59, 471–480. [Google Scholar] [CrossRef]
- Wenger, C.; Boudon, V.; Rotger, M.; Sanzharov, M.; Champion, J.P. XTDS and SPVIEW: Graphical tools for the analysis and simulation of high-resolution molecular spectra. J. Mol. Spectrosc. 2008, 251, 102–113. [Google Scholar] [CrossRef]
- Ballard, J.; Knight, R.J.; Vander Auwera, J.; Herman, M.; Di Lonardo, G.; Masciarelli, G.; Nicolaisen, F.M.; Beukes, J.A.; Christensen, L.K.; McPheat, R.; et al. An intercomparison of laboratory measurements of absorption cross-sections and integrated absorption intensities for HCFC-22. J. Quant. Spectrosc. Radiat. Transf. 2000, 66, 109–128. [Google Scholar] [CrossRef]
- Pierre, G.; Valentin, A.; Henry, L. Etude par transformée de Fourier du spectre du silane dans la région de 1000 cm−1. Analyse de la diade ν2 et ν4. Can. J. Phys. 1986, 64, 341–350. [Google Scholar] [CrossRef]
- Robiette, A.; Gray, D.; Birss, F. The effective vibration-rotation hamiltonian for triply-degenerate fundamentals of tetrahedral XY4 molecules. Mol. Phys. 1976, 32, 1591–1607. [Google Scholar] [CrossRef]
- Loëte, M.; Richard, C.; Boudon, V. Isotopic relations for tetrahedral and octahedral molecules. J. Mol. Struct. 2020, 1206, 127729. [Google Scholar] [CrossRef]
- Richard, C.; Fathallah, O.B.; Hardy, P.; Kamel, R.; Merkulova, M.; Rotger, M.; Ulenikov, O.; Boudon, V. CaSDa24: Latest updates to the Dijon calculated spectroscopic databases. J. Quant. Spectrosc. Radiat. Transf. 2024, 327, 109127. [Google Scholar] [CrossRef]
- Rothman, L.S.; Jacquemart, D.; Barbe, A.; Chris Benner, D.; Birk, M.; Brown, L.R.; Carleer, M.R.; Chackerian, J.C.; Chance, K.; Coudert, L.H.; et al. The HITRAN 2004 molecular spectroscopic database. J. Quant. Spectrosc. Radiat. Transf. 2005, 96, 139–204. [Google Scholar] [CrossRef]


| Spectrum | P (SiH4)/hPa | #Scans |
|---|---|---|
| S1 | 0.0710 (4) | 396 |
| S2 | 0.1350 (8) | 364 |
| S3 | 0.2740 (14) | 210 |
| S4 | 0.5370 (27) | 206 |
| S5 | 1.0040 (50) | 392 |
| S6 | 2.014 (10) | 416 |
| S7 | 4.037 (20) | 404 |
| S8 | 7.991 (40) | 500 |
| S9 | 16.02 (8) | 358 |
| S10 | 32.00 (16) | 412 |
| S11 | 63.95 (32) | 404 |
| Isotope | Abundance | Nb. Data | * | |
|---|---|---|---|---|
| 28SiH4 | 92.23 | 2464 | 25 | 0.353 |
| 29SiH4 | 4.67 | 592 | 22 | 0.275 |
| 30SiH4 | 3.10 | 514 | 24 | 0.769 |
| Order | Value/cm−1 | Notation of Robiette et al. [35] | |||||
|---|---|---|---|---|---|---|---|
| 28SiH4 Ref. [9] | Ref. [34] | ||||||
| 0 | 2.8590790619 † | ||||||
| 2 | −3.6917820769 † | ×10−5 | |||||
| 2 | −1.7071029198 † | ×10 −6 | |||||
| 4 | 1.9961361842 † | ×10−9 | |||||
| 4 | −5.9757956144 † | ×10−11 | |||||
| 4 | −1.4561902784 † | ×10−11 | |||||
| 5 | −6.0184004392 † | ×10−13 | |||||
| 5 | −1.9811867799 † | ×10−15 | |||||
| 5 | −9.2968388902 † | ×10−16 | |||||
| 5 | −1.4443328483 † | ×10−16 | |||||
| Order | Value/cm−1 | Notation of Robiette et al. [35] | |||||||||
|---|---|---|---|---|---|---|---|---|---|---|---|
| 28SiH4 Ref. [9] | 28SiH4 | 29SiH4 Ref. [9] | 29SiH4 | 30SiH4 Ref. [9] | 30SiH4 | (When Defined) | |||||
| 0 | 970.9344501 (89) | 970.93468 (13) | 970.9484153 (47) | 970.94853 (37) | 970.9614826 (76) | 970.96186 (36) | |||||
| 2 | −3.326 (25) | −0.05107 | −4.17 (47) | −0.10214 (75) | −1.24 (36) | ×10−3 | |||||
| 2 | −0.965273 (30) | −1.2545 (22) | −0.969766 | −1.330 (42) | 0.974259 (69) | −1.074 (31) | ×10−2 | ||||
| 3 | 2.4228 (54) | 3.052 (23) | † | 3.63 (42) | † | 2.75 (11) | ×10−5 | ||||
| 4 | −8.07 (12) | −7.01 (87) | −5.44 (82) | ×10−7 | |||||||
| 4 | −3.927 (22) | −5.49 (61) | † | −5.3 (3.5) | † | −3.27 (50) | ×10−8 | ||||
| 4 | −2.826 (40) | −2.77 (26) | −5.8 (1.7) | ×10−7 | |||||||
| 4 | 4.434 (62) | 3.83 (78) | 3.55 (18) | ×10−7 | |||||||
| 5 | −0.17611 (81) | −3.04 (88) | † | † | † | † | ×10−10 | ||||
| Order | Value/cm−1 | Notation of Robiette et al. [35] | |||||||||
|---|---|---|---|---|---|---|---|---|---|---|---|
| 28SiH4 Ref. [9] | 28SiH4 | 29SiH4 Ref. [9] | 29SiH4 | 30SiH4 Ref. [9] | 30SiH4 | (When Defined) | |||||
| 0 | 913.4687855 (78) | 913.46833 (11) | 912.18249 (19) | 910.97900 (17) | |||||||
| 1 | 6.0271851 (21) | 6.030710 (42) | 6.0520511 (16) | 6.05634 (49) | 6.0752223 (19) | 6.07642 (37) | Coriolis) | ||||
| 2 | 3.9654 (16) | 2.610 (16) | 4.04084 (36) | 3.15 (31) | 4.1519 (50) | 1.17 (24) | ×10−3 | ||||
| 2 | −3.05434 (18) | −6.373 (24) | −3.061987 (68) | −7.17 (47) | −3.07064 (80) | −4.20 (35) | ×10−3 | ||||
| 2 | −12.22340 (24) | −9.716 (19) | −12.17770 (60) | −9.06 (36) | −12.13367 (55) | −10.128 (27) | ×10−3 | ||||
| 3 | 6.8348 (88) | 5.718 (33) | 6.8677 (36) | 4.96 (60) | 6.8851 (47) | 6.44 (18) | ×10−5 | ||||
| 3 | −5.3703 (69) | −6.306 (32) | † | −7.04 (58) | † | −5.69 (17) | ×10−5 | ||||
| 4 | −7.0296 (83) | −1.373 (85) | † | −1.99 (61) | † | −3.04 (54) | ×10−7 | ||||
| 4 | 2.556 (17) | 2.749 (96) | † | 1.91 (82) | † | −8.6 (3.6) | ×10−7 | ||||
| 4 | 2.785 (69) | 2.260 (43) | † | 2.13 (54) | † | 2.44 (26) | ×10−7 | ||||
| 4 | 2.19 (10) | 1.871 (32) | † | 1.68 (34) | † | 5.0 (1.3) | ×10−7 | ||||
| 4 | 2.808 (14) | 5.488 (47) | † | 6.17 (40) | † | 4.30 (40) | ×10−7 | ||||
| 4 | 2.028 (20) | 5.679 (35) | † | 5.44 (39) | † | 6.78 (21) | ×10−7 | ||||
| 5 | 2.93 (12) | 2.36 (65) | 3.43 (65) | ×10−9 | |||||||
| 5 | −3.176 (19) | 1.08 (12) | † | 1.73 (60) | † | † | ×10−9 | ||||
| 5 | 3.225 (61) | 3.21 (36) | 1.03 (31) | ×10−9 | |||||||
| 5 | 5.71 (19) | 4.33 (86) | † | † | † | † | ×10−10 | ||||
| Order | Value/cm−1 | Notation of Robiette et al. [35] | |||||||||
|---|---|---|---|---|---|---|---|---|---|---|---|
| 28SiH4 Ref. [9] | 28SiH4 | 29SiH4 Ref. [9] | 29SiH4 | 30SiH4 Ref. [9] | 30SiH4 | (When Defined) | |||||
| 1 | −5.0694654 (44) | −5.15123 (60) | −5.06113221 (71) | −5.165 (12) | −5.053409 (20) | −5.0824 (92) | |||||
| 2 | −2.20982 (25) | −1.9509 (16) | −2.21014 | −1.905 (26) | −2.210459 (64) | −2.125 (27) | ×10−2 | (undefined) | |||
| 3 | −1.27456 (61) | −1.1996 (24) | −1.27513 | −1.256 (42) | −1.275703 (47) | † | ×10−4 | ||||
| Parameter | Order | Value/Debye | |||||||||
|---|---|---|---|---|---|---|---|---|---|---|---|
| 28SiH4 Ref. [9] | 28SiH4 | 29SiH4 Ref. [9] | 29SiH4 | 30SiH4 Ref. [9] | 30SiH4 | ||||||
| 1 | 1 | 1 (1,) | 2.768 (37) | † | † | ×10−4 | |||||
| 2 | 2 | 2 (2,) | −2.450 (31) | † | † | ×10−5 | |||||
| 3 | 0 | 0 (0,) | 3.9099 (17) | 4.03036 (86) | 3.9410 (36) | 4.0579 (26) | 3.9763 (45) | 4.0782 (28) | ×10−1 | ||
| 4 | 1 | 1 (1,) | −3.955 (54) | −3.958 (34) | † | † | † | † | ×10−4 | ||
| 5 | 2 | 2 (0,) | −3.074 (37) | −1.52 (66) | † | † | † | † | ×10−5 | ||
| 6 | 2 | 2 (2,) | 3.72 (26) | † | † | ×10−6 | |||||
| 7 | 2 | 2 (2,) | −5.78 (25) | † | † | ×10−6 | |||||
| Data (intensities) | 472 | 37 | 55 | ||||||||
| Jmax | 21 | 13 | 15 | ||||||||
| drms/% | 3.116 | 4.464 | 3.601 | ||||||||
| St. Dev. | 3.813 | 4.081 | 2.867 | ||||||||
| Transitions | Number Dipolar | Dipolar Wavenumber | Dipolar Intensity |
|---|---|---|---|
| cm−1 | cm−1/(molecule.cm−2) | ||
| 28SiH4 | |||
| Scheme 1 (2, 1, 2, 1) | |||
| 6649 | 714–1154 | 1 × 10⁻²³–6 × 10⁻¹⁹ | |
| 29SiH4 | |||
| Scheme 1 (2, 1, 2, 1) | |||
| 6920 | 732–1180 | 1 × 10⁻²³–6 × 10⁻¹⁹ | |
| 30SiH4 | |||
| Scheme 1 (2, 1, 2, 1) | |||
| 6521 | 711–1154 | 1 × 10⁻²³–6 × 10⁻¹⁹ | |
| Total | 20,090 |
Disclaimer/Publisher’s Note: The statements, opinions and data contained in all publications are solely those of the individual author(s) and contributor(s) and not of MDPI and/or the editor(s). MDPI and/or the editor(s) disclaim responsibility for any injury to people or property resulting from any ideas, methods, instructions or products referred to in the content. |
© 2025 by the authors. Licensee MDPI, Basel, Switzerland. This article is an open access article distributed under the terms and conditions of the Creative Commons Attribution (CC BY) license (https://creativecommons.org/licenses/by/4.0/).
Share and Cite
Kamel, R.; Boudon, V.; Richard, C.; Raddaoui, E.; Landsheere, X.; Manceron, L.; Kwabia Tchana, F. New Experimental Spectra and Quantitative Modeling of the Bending Dyad of Silane in the 900 cm−1 Region for Its 3 Isotopologues. Molecules 2025, 30, 1992. https://doi.org/10.3390/molecules30091992
Kamel R, Boudon V, Richard C, Raddaoui E, Landsheere X, Manceron L, Kwabia Tchana F. New Experimental Spectra and Quantitative Modeling of the Bending Dyad of Silane in the 900 cm−1 Region for Its 3 Isotopologues. Molecules. 2025; 30(9):1992. https://doi.org/10.3390/molecules30091992
Chicago/Turabian StyleKamel, Raef, Vincent Boudon, Cyril Richard, Emna Raddaoui, Xavier Landsheere, Laurent Manceron, and Fridolin Kwabia Tchana. 2025. "New Experimental Spectra and Quantitative Modeling of the Bending Dyad of Silane in the 900 cm−1 Region for Its 3 Isotopologues" Molecules 30, no. 9: 1992. https://doi.org/10.3390/molecules30091992
APA StyleKamel, R., Boudon, V., Richard, C., Raddaoui, E., Landsheere, X., Manceron, L., & Kwabia Tchana, F. (2025). New Experimental Spectra and Quantitative Modeling of the Bending Dyad of Silane in the 900 cm−1 Region for Its 3 Isotopologues. Molecules, 30(9), 1992. https://doi.org/10.3390/molecules30091992