Article

The Far-Infrared Absorption Spectrum of HD16O: Experimental Line Positions, Accurate Empirical Energy Levels, and a Recommended Line List

by
Semen N. Mikhailenko
1,
Ekaterina V. Karlovets
2,3,
Aleksandra O. Koroleva
2,4 and
Alain Campargue
2,*
1
V.E. Zuev Institute of Atmospheric Optics, SB, Russian Academy of Science, 1, Academician Zuev Square, 634055 Tomsk, Russia
2
University Grenoble Alpes, CNRS, LIPhy, 38000 Grenoble, France
3
Department of Optics and Spectroscopy, Tomsk State University, 36, Lenin Avenue, 634050 Tomsk, Russia
4
A.V. Gaponov-Grekhov Institute of Applied Physics of the Russian Academy of Sciences, 40, Ul’yanov Street, 603950 Nizhny Novgorod, Russia
*
Author to whom correspondence should be addressed.
Molecules 2024, 29(23), 5508; https://doi.org/10.3390/molecules29235508
Submission received: 22 October 2024 / Revised: 12 November 2024 / Accepted: 15 November 2024 / Published: 21 November 2024
(This article belongs to the Special Issue Molecular Spectroscopy and Molecular Structure in Europe)

Abstract

:
The far-infrared absorption spectrum of monodeuterated water vapor, HD16O, is analyzed using three high-sensitivity absorption spectra recorded by high-resolution Fourier transform spectroscopy at the SOLEIL synchrotron facility. The gas sample was obtained using a 1:1 mixture of H2O and D2O leading to a HDO abundance close to 50%. The room temperature spectra recorded in the 50–720 cm−1 range cover most of the rotational band. The sensitivity of the recordings allows for lowering by three orders of magnitude the detectivity threshold of previous absorption studies in the region. Line centers are determined with a typical accuracy of 5 × 10⁻⁵ cm−1 for well-isolated lines. The combined line list of 8522 water lines is assigned to 9186 transitions of the nine stable water isotopologues (H2XO, HDXO, and D2XO with X = 16, 17, and 18). Regarding the HD16O isotopologue, a total of 2443 transitions are presently assigned while about 530 absorption transitions were available prior to our SOLEIL recordings. The comparison with the HITRAN list of HD16O transitions is discussed in detail. The obtained set of accurate HD16O transition frequencies is merged with literature sources to generate a set of 1121 accurate empirical rotation–vibration energies for the first five vibrational states (000), (010), (100), (020), and (001). The comparison to the previous dataset from an IUPAC task group illustrates a gain in the average energy accuracy by more than one order of magnitude. Based on these levels, a recommended list of transitions between the first five vibrational states is proposed for HD16O in the 0–4650 cm−1 frequency range.

Graphical Abstract

1. Introduction

We are involved in a long-term project aiming at improving our knowledge of the spectrum of the nine stable isotopologues of water vapor in the far infrared (50–720 cm−1). This work relies on a series of high-quality spectra recorded during a one-week measurement campaign in October 2021, at the AILES beam line of the SOLEIL synchrotron near Paris (https://www.synchrotron-soleil.fr/en accessed on 10 April 2024). A total of twenty-one spectra of water vapor samples with a variety of isotopic compositions (natural, 17O-enriched, D2O, H2O:D2O mixture, and a mixture of the 17O-enriched sample with D2O) were recorded by high-resolution Fourier transform spectroscopy (FTS) at room temperature. The experimental conditions are listed in Table 1 where the isotopic composition of the sample injected in the cell is indicated. [In fact, due to the statistical exchange of the oxygen and hydrogen atoms between the various water molecules and to exchanges between the gas phase and water molecules adsorbed on the walls of the cell, the nine stable isotopologues (H2XO, HDXO, and D2XO with X = 16, 17, and 18) are present in each sample and may contribute to the recorded spectra.]
The present contribution is devoted to the analysis of the spectra #19–21 corresponding to a 1:1 mixture of H2O and D2O providing a maximum relative abundance in HDO (50%). It follows the analysis of the natural sample spectra (#1–5) [1], 17O-enriched spectra (#6–9) [2], and D2O spectra (#15–18) [3]. These studies indicated that as a result of the brightness of the synchrotron radiation and of the long pathlength (151.75 m), the sensitivity of the SOLEIL absorption spectra improves by about three orders of magnitude that of all the previous absorption studies available in the region. Our detectivity threshold corresponds typically to line intensities of 10−25 cm/molecule while the most sensitive previous observations were at the 10−22 cm/molecule level [1,2,3]. From the large sets of newly measured line positions, energy levels can be newly determined, and a general improvement in the energy level accuracy has been achieved for H216O [1], H217O and HD17O [2], D2XO (X = 16–18) [3], and H218O and HD18O [4]. These previous works included systematic comparisons to the current water line lists provided by spectroscopic databases [5,6,7] and proposed a number of improvements.
The studied FIR region corresponds to the purely rotational transitions in the (000) ground vibrational state and weaker rotational transitions in the first vibrational states which are slightly populated at room temperature. It is worth noting that the lower and upper states of the observed FIR transitions are the lower states of transitions observed in all the spectral ranges. Thus, the correction of energy levels based on the studied FIR spectra propagates over the whole frequency range of the water vapor spectrum. This gives particular importance to the FIR region in the elaboration of spectroscopic databases.
Furthermore, the FIR region is of first importance for the Earth’s radiation budget. The thermal radiation mission FORUM (Far-infrared-Outgoing-Radiation Understanding and Monitoring; https://www.forum-ee9.eu/ accessed on 10 September 2024) of the European Space Agency (ESA) to be launched in 2027 will be dedicated to the “observational gap across the far-infrared (from 100 to 667 cm−1), never before sounded in its entirety from space”. Water vapor absorption being very strong in this region (line intensities up to 3 × 10⁻¹⁸ cm/molecule), a prerequisite for remote sensing is an accurate characterization of the water vapor spectrum including the weak lines due to the minor isotopologues as they may overlap the absorption features used to monitor other species of interest.
As mentioned above, the present work is mainly dedicated to the HD16O species which is the fourth most abundant isotopologues in natural water (abundance of 3.1 × 10⁻⁴). Although a large number of new HD16O transitions was identified in the analysis of the D2O spectra (#15–18) [3], the set of observations will be significantly enlarged using spectra #19–21 which correspond to the maximum possible HD16O abundance of 50%. In the next section, we present shortly the recordings, the line list retrieval, and the frequency calibration of spectra #19–21. The rovibrational assignments are presented in Section 3. Although the nine stable water isotopologues are found to contribute to the analyzed spectra, a detailed analysis will be mostly focused on the HD16O species. In Section 4, we propose a new set of HD16O empirical energy levels for the first five vibrational states: (000), (010), (100), (020), and (001) based on the HD16O line positions derived from spectra #19–21, from spectra #15–18 analyzed in Ref. [3] and a selection of previous works by absorption spectroscopy. The comparison to the previous set of energy levels derived ten years ago by a task group (TG) of the International Union of Pure and Applied Chemistry (IUPAC-TG) will be discussed. As the main output of the present work, an empirical line list will be generated for HD16O in the 0–4650 cm−1 region using as a basis the results of the variational calculations by Schwenke and Partridge (SP) [8,9], most of the line positions being adjusted according to the accurate empirical values of the lower and upper energy levels derived in this work.

2. Experiment and Line List

The unique properties of the AILES beam line at the SOLEIL synchrotron source in terms of brightness, broad-band emission, and stability make it an ideal tool for high-resolution FTS in the FIR. This applies not only to absorption lines but also to weak absorption continua, in particular the water vapor continuum [10,11,12].

2.1. FTS Recordings

The twenty-one FTS spectra listed in Table 1 were recorded following a mostly identical procedure which has been described in detail in Refs. [1,2,3] and will not be repeated here. Briefly, a Bruker 125 interferometer with a 6 µm mylar-composite beam splitter and a 4 K cooled Si bolometer detector were used for the recordings covering the 50–720 cm−1 range. The multipass absorption cell is used in a White-type configuration and has a 252 cm length. The total absorption pathlength was set to 151.75 ± 1.5 m corresponding to 60 passes. For spectra #19–21 under analysis, the cell was filled with a 1:1 mixture of H2O and D2O in order to maximize the HDO abundance at 50%. The used D2O sample (from Sigma-Aldrich, St. Louis, MO, USA) has a stated enrichment in deuterium larger than 99.96%. The sequence of the recordings and the corresponding experimental conditions are detailed in Table 2. The first spectrum (#19) was recorded at a pressure of 4 mbar, and then part of the sample was evacuated and a second spectrum was recorded at 0.3 mbar. The last spectrum (#21) was acquired by pumping continuously on the cell in order to measure part of the stronger lines which are saturated at higher pressure (see Figure 1). The used gauge does not allow measuring pressures in those conditions. The #21 pressure value of 10 µbar is an estimated value obtained from a comparison with variational intensities performed after the rovibrational assignment of the spectrum (see below). Spectrum #19 at 4 mbar was recorded with a spectral resolution of 0.002 cm−1 while, for the two others at lower pressure, the maximum spectral resolution of 0.00102 cm−1 was adopted. About 200 scans were co-added corresponding to an acquisition time of about 10 h at 0.001 cm−1 spectral resolution. The baseline fluctuations were corrected by division by a spectrum acquired at a lower resolution (0.05 cm−1), prior to or after each high-resolution recording (see Table 2). During the recordings, the temperature was found to vary in the 295.5 ± 0.3 K interval. An overview of spectrum #19 recorded at 4 mbar is displayed in Figure 1, which includes successive zooms illustrating the spectral congestion and the sensitivity.
The transmittances of spectra #19–21 obtained after baseline correction are provided as a Supplementary Material (SM0).

2.2. Global Experimental Line List

Let us first indicate that considering the high quality of the ab initio intensity values in the considered low energy region, the experimental accuracy required for valuable tests of the intensity calculations (1% or below) seems to be out of reach with the FTS spectra at disposal. Our uncertainties on the experimental intensities are related to the fact that (i) even at the highest resolution of the recordings (0.001 cm−1), the apparatus function gives a dominant contribution to the line profile; (ii) the line profile is described by a too small number of points [typically, four points at full width at half-maximum (FWHM)]; and (iii) an accurate determination of the isotopic composition of our samples is difficult. The goal of the line parameter retrieval was, thus, mainly to determine accurately the line centers and provide reasonable intensity values (which are valuable in the assignment process). From comparisons to the ab initio values, we estimate that our intensity values are accurate within 10% in the best cases (dominant isotopologues, spectrum #19 or #20, intermediate line intensity, and unblended lines). Each of the #19–21 transmittance spectra was fitted independently assuming the standard Voigt line profile as line shape (with adjusted Gaussian and Lorentzian widths) and no particular care was taken for the treatment of the apparatus function. The line parameters were obtained using a homemade multiline fitting program written in LabVIEW with DLL written in C++. Figure 2 illustrates the line profile fitting of the three spectra in a small spectral interval near 356.4 cm−1. The large range of the pressures of the recordings (about a factor of 400) and small noise level allowed retrieving line intensities spanning nearly five orders of magnitude. Saturated lines (transmittance at center less than a few %) were omitted from the fit when a lower pressure spectrum was available. The (obs. − calc.) residuals of the transmittance included in Figure 2 are close to the noise level [(αminL) ~ 1% root mean square (RMS)]. Taking into account the absorption pathlength, L = 151.75 m, this value corresponds to a noise equivalent absorption, αmin, of 7 × 10⁻⁷ cm−1. At the highest pressure (4 mbar), the achieved noise level allows for the detection of lines with an intensity as low as 2 × 10⁻²⁵ cm/molecule, as illustrated by the D2O line with an intensity of 4.0 × 10⁻²⁵ cm/molecule observed at 356.34175 cm−1 in Figure 2.
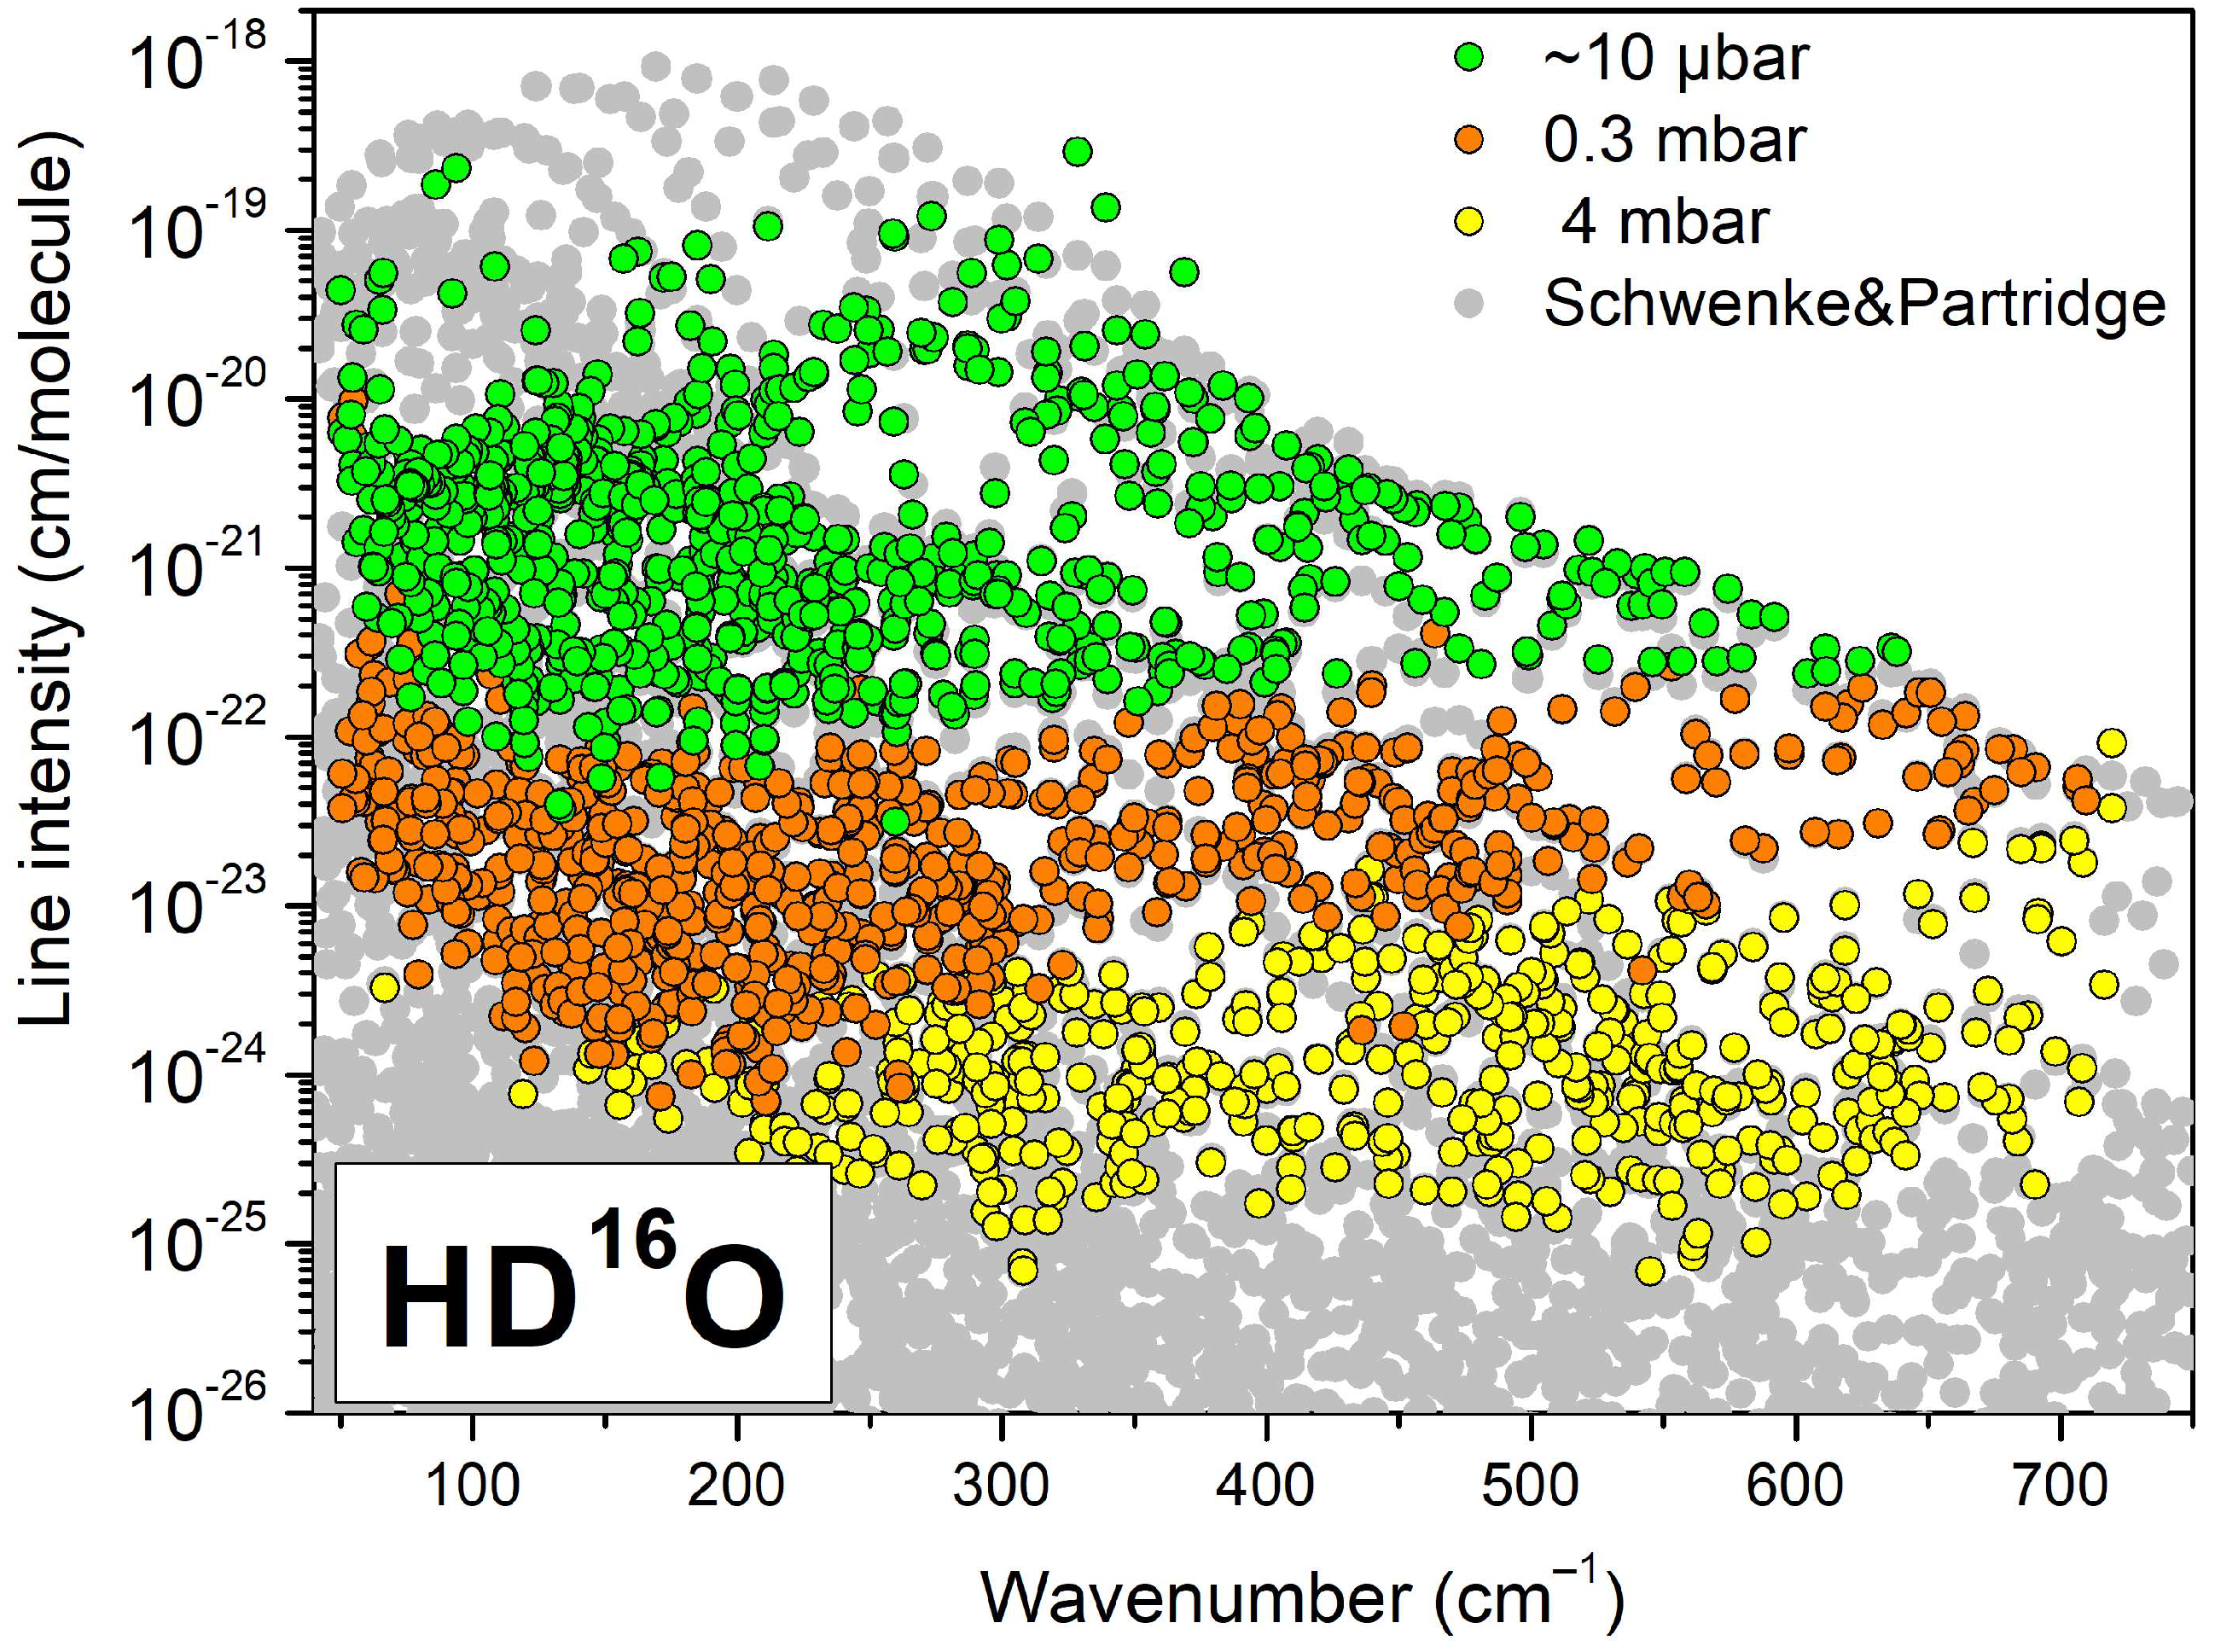
The global line list obtained by combining the three individual lists counts a total of about 8600 entries and is provided as a Supplementary Material (SM1). Depending on the line intensity, for each line, the parameters retrieved from the spectrum corresponding to the best condition were selected. The source (#19, 20, or 21) is indicated for each line. The spectra at 10 µbar (#21), 0.3 mbar (#20), and 4 mbar (#19) were used for about 3140, 3420, and 2030 lines, respectively. The HD16O lines are plotted in Figure 3 with distinct symbols according to the used spectrum. The variational spectrum (SP) calculated by Tashkun using the results of Schwenke and Partridge [8,9] and available at https://spectra.iao.ru/ accessed on 10 September 2024, is plotted as background. As obvious from Figure 3, the intensity values of the strongest lines are underestimated by a factor that can be larger than 10. These intensity values were retrieved from spectrum #21 at the lowest pressure (~10 µbar). Even at this residual pressure obtained by evacuating the cell by continuously pumping during the recording, the lines with intensity larger than 10−20 cm/molecule remain strongly saturated leading to inaccurate intensity values. The accuracy of the corresponding line position is also affected. The position uncertainty as provided by the fit and included in the SM1 global list will be taken into account in the derivation of the energy level values (see below).
The experimental intensities of the global line list include the isotopic abundance factor which depends on the spectra. The variation in the isotopic composition is due to exchanges between the gas phase and water adsorbed in the walls of the cell which has a different isotopic composition reflecting the “history” of the cell (see Table 1). After the assignment of the spectra (see next section), it was possible to estimate the relative abundances for the nine isotopologues in each spectrum by intensity comparison with SP variational intensities [8,9]. The obtained abundance values can be found in the headings of the SM1 global list while the minimum and maximum abundances are given in Table 3. Overall, the H2O:HDO:D2O abundance ratio remains close to 1:2:1 in the three spectra #19–21 but the small abundances of the 17O and 18O isotopologues vary greatly according to the spectrum. The highest concentration of these isotopologues is found in spectrum #21 at the lowest pressure. This is probably due to the continuous desorption of 17O- and 18O-enriched water from the walls of the cell which has a larger impact at the low 10 µbar pressure of spectrum #21.
The SP variational intensities are included for comparison in the global experimental line list. For each isotopologue, SP intensities were multiplied by a factor independent of the spectrum and roughly corresponding to the maximum abundance value of the considered isotopologue (see Table 3).
The absolute frequency calibration of the global list was performed considering the line positions of spectra #20 and #21 which are not significantly affected by the self-pressure shift [13,14]. The experimental positions of about 290 H216O lines (νobs) were compared to reference values reported in Ref. [15] with accuracy better than 1 × 10⁻⁶ cm−1. The differences between the experimental line centers and the reference values were fitted as a linear function. The obtained empirical correction of the frequencies is dνcorr = +8.5 × 10⁻⁵ – 7.0 × 10⁻⁷νobs. An RMS deviation of 2.76 × 10⁻⁵ cm−1 was obtained for the linear fit, thus mostly determined by the experimental uncertainty on the line centers. This value gives an estimate of our accuracy on the reported positions of “good” lines. It is worth noting the consistency of the present frequency calibration with those performed in Refs. [2,3] following the same procedure. The differences between the correction laws are at most 2 × 10⁻⁵ cm−1 for the whole spectral region, confirming the stability of the experimental set up over the measurement period.
In the SM1 global line list, the fit error on the line position determination is included. For a significant fraction of the lines, the fit uncertainty was found to be smaller than 3 × 10⁻⁵ cm−1 and is believed to underestimate the real uncertainty on the line position. For all these lines, we replaced the fit uncertainty with a value of 3 × 10⁻⁵ cm−1. Note that the position uncertainty of the weakest, highly blended lines or saturated lines can reach a value of 8 × 10⁻⁴ cm−1 in the worst cases.

3. Rovibrational Assignments

Over a total of more than 8600 lines, 8522 were assigned to 9186 transitions belonging to the nine stable water isotopologues. The number of transitions, maximum values of the J and K quantum numbers, and range of observations are given in Table 3 for each isotopologue. [In the following, we will use the standard normal-mode–rigid-rotor notation ( V 1 V 2 V 3 )   J K a K c ( V 1 V 2 V 3 )   J K a K c to designate the transitions, where V 1 ,   V 2 ,   a n d   V 3 are the vibrational quantum numbers for the symmetric stretch, bend, and asymmetric stretch modes, respectively, and J, Ka, and Kc are rigid-rotor asymmetric-top quantum numbers. The single and double primes correspond to the final (upper) and initial (lower) transition states, respectively.] After the assignment of a few impurity lines (50, 5, and 3 lines of CO2, HF, and DF, respectively), 48 very weak lines were left unassigned at the end of the assignment procedure.

3.1. H2XO (X = 16, 17, and 18)

Detailed reviews of the literature studies of vibrational–rotational spectra of H216O, H217O, and H218O in our spectral region have been included in Ref. [1], Ref. [2], and Ref. [4], respectively. The SOLEIL spectra recorded with suitable isotopic enrichment (see Table 1) made it possible to significantly increase the number of observed lines of these H2XO isotopologues, especially for H218O [4] and H217O [2]. Since the H2XO concentrations of the presently analyzed #19–21 spectra are lower than in Refs. [1,2,4], no new H2XO transitions were detected and the number of observed lines is smaller: 1035, 356, and 406 compared to 1310 in Ref. [1], 1206 in Ref. [2], and 1150 Ref. [4] for H216O, H217O, and H218O, respectively.
A systematic comparison of the present H2XO line positions (νTW) to their values in Refs. [1,2,4] (νRef) gives a very good agreement with the root mean square R M S = i = 1 N ( ν i T W ν i R e f ) 2 / N values of 15.8 × 10⁻⁵, 12.8 × 10⁻⁵, and 13.7 × 10⁻⁵ cm−1 for 917, 1773, and 1777 positions from Ref. [1], Ref. [2], and Ref. [4], respectively. A similar comparison with the W2020 line list [7] gives an RMS = 30.2 × 10⁻⁵ cm−1 for a total of 1797 transitions.

3.2. D2XO (X = 16, 17, and 18)

We have dedicated Ref. [3] to the analysis of the spectra #15–18 recorded with a highly enriched D2O sample. The literature review of the FIR studies of the D2XO isotopologues is included in this reference. The sensitivity of the SOLEIL spectra allowed a considerable extension of the observations for these species. For instance, more than 2057 energy levels were newly reported for D216O. The D2XO concentrations in spectra #19–21 under study are about four times lower than in Ref. [3] (see above Table 3 and Table 2 of Ref. [3]) and only a subset of the observations of Ref. [3] is presently detected: 2152, 538, and 704 for D216O, D217O, and D218O, respectively, compared to 2886, 1088, and 1169. Nevertheless, twenty-eight transitions that were not reported in Ref. [3] are presently measured. All but one corresponds to transitions between levels empirically determined in Ref. [3]. The new transitions are listed in Table 4 which includes their assignment and a comparison to the empirical positions recommended in Ref. [3]. The overall agreement is satisfactory with position differences exceeding 4 × 10⁻⁴ cm−1 for only four transitions which are close to our detection level (line intensity smaller than 4 × 10⁻²⁵ cm/molecule).
The 23 7 16–22 6 17 pure rotational transition at 460.35106 cm−1 has its 23 7 16 upper level newly detected by absorption. From the measured position value, the corresponding term value is calculated at 3875.90790 cm−1. Note that our transition assignment coincides with that given by Mellau et al. [16] and Zobov et al. [17] in their analysis of emission spectra. The IUPAC-TG [18] energy value of the (000) 23 7 16 level (3875.90782(53) cm−1) relies exclusively on emission data and is found in perfect agreement with our determination by absorption.

3.3. HD16O

Although the SM1 global list includes all the HDXO (X = 16, 17, and 18) assignments, we will limit our detailed analysis to the HD16O isotopologue because the relative abundance of the HD17O and HD8O species is more than one order of magnitude larger in the spectra #10–14 which remain to be treated (see Table 1). Extended new observations are expected from these spectra and a separate contribution will be dedicated to HD17O and HD18O.
In Ref. [3] dedicated to the D2O species (spectra #15–18), due to exchanges with water adsorbed in the cell, the HD16O abundance was relatively high (up to 25% in spectrum #15) and a large number of new HD16O absorption lines were assigned but not discussed in details. In the following, these observations will be considered together with the present results, in particular for the derivation of the energy levels.
The literature review indicates that previous studies of the HD16O spectrum in the rotational range are limited: (i) the line positions of 60 transitions between 151 and 420 cm−1 were published by Kaupinen et al. from absorption spectrum analysis of natural abundance water sample [19]; (ii) the absorption spectra of water vapor enriched in deuterium by Johns [20], Paso and Horneman [21], and Toth [22] expanded the range of observed lines to the 50.27–719.55 cm−1 interval and the number of transitions to 532; and finally, (iii) our recent analyses of the SOLEIL spectra [1,2,4] have increased to 781 the number of (distinct) transitions observed by absorption, all belonging to the (000)–(000) and (010)–(010) rotational bands.
Regarding emission spectroscopy, Janca et al. reported more than 1400 transitions in the 381–720 cm−1 region from their high-temperature emission spectra [23]. These transitions involve levels of the eight lowest vibrational states: (000), (010), (100), (020), (001), (110), (030), and (011). Among the 1422 transitions of Ref. [23], 765 belong to the (000)–(000) and (010)–(010) rotational bands but they involve high rotational levels, and only 62 of these emission transitions are observed in absorption.
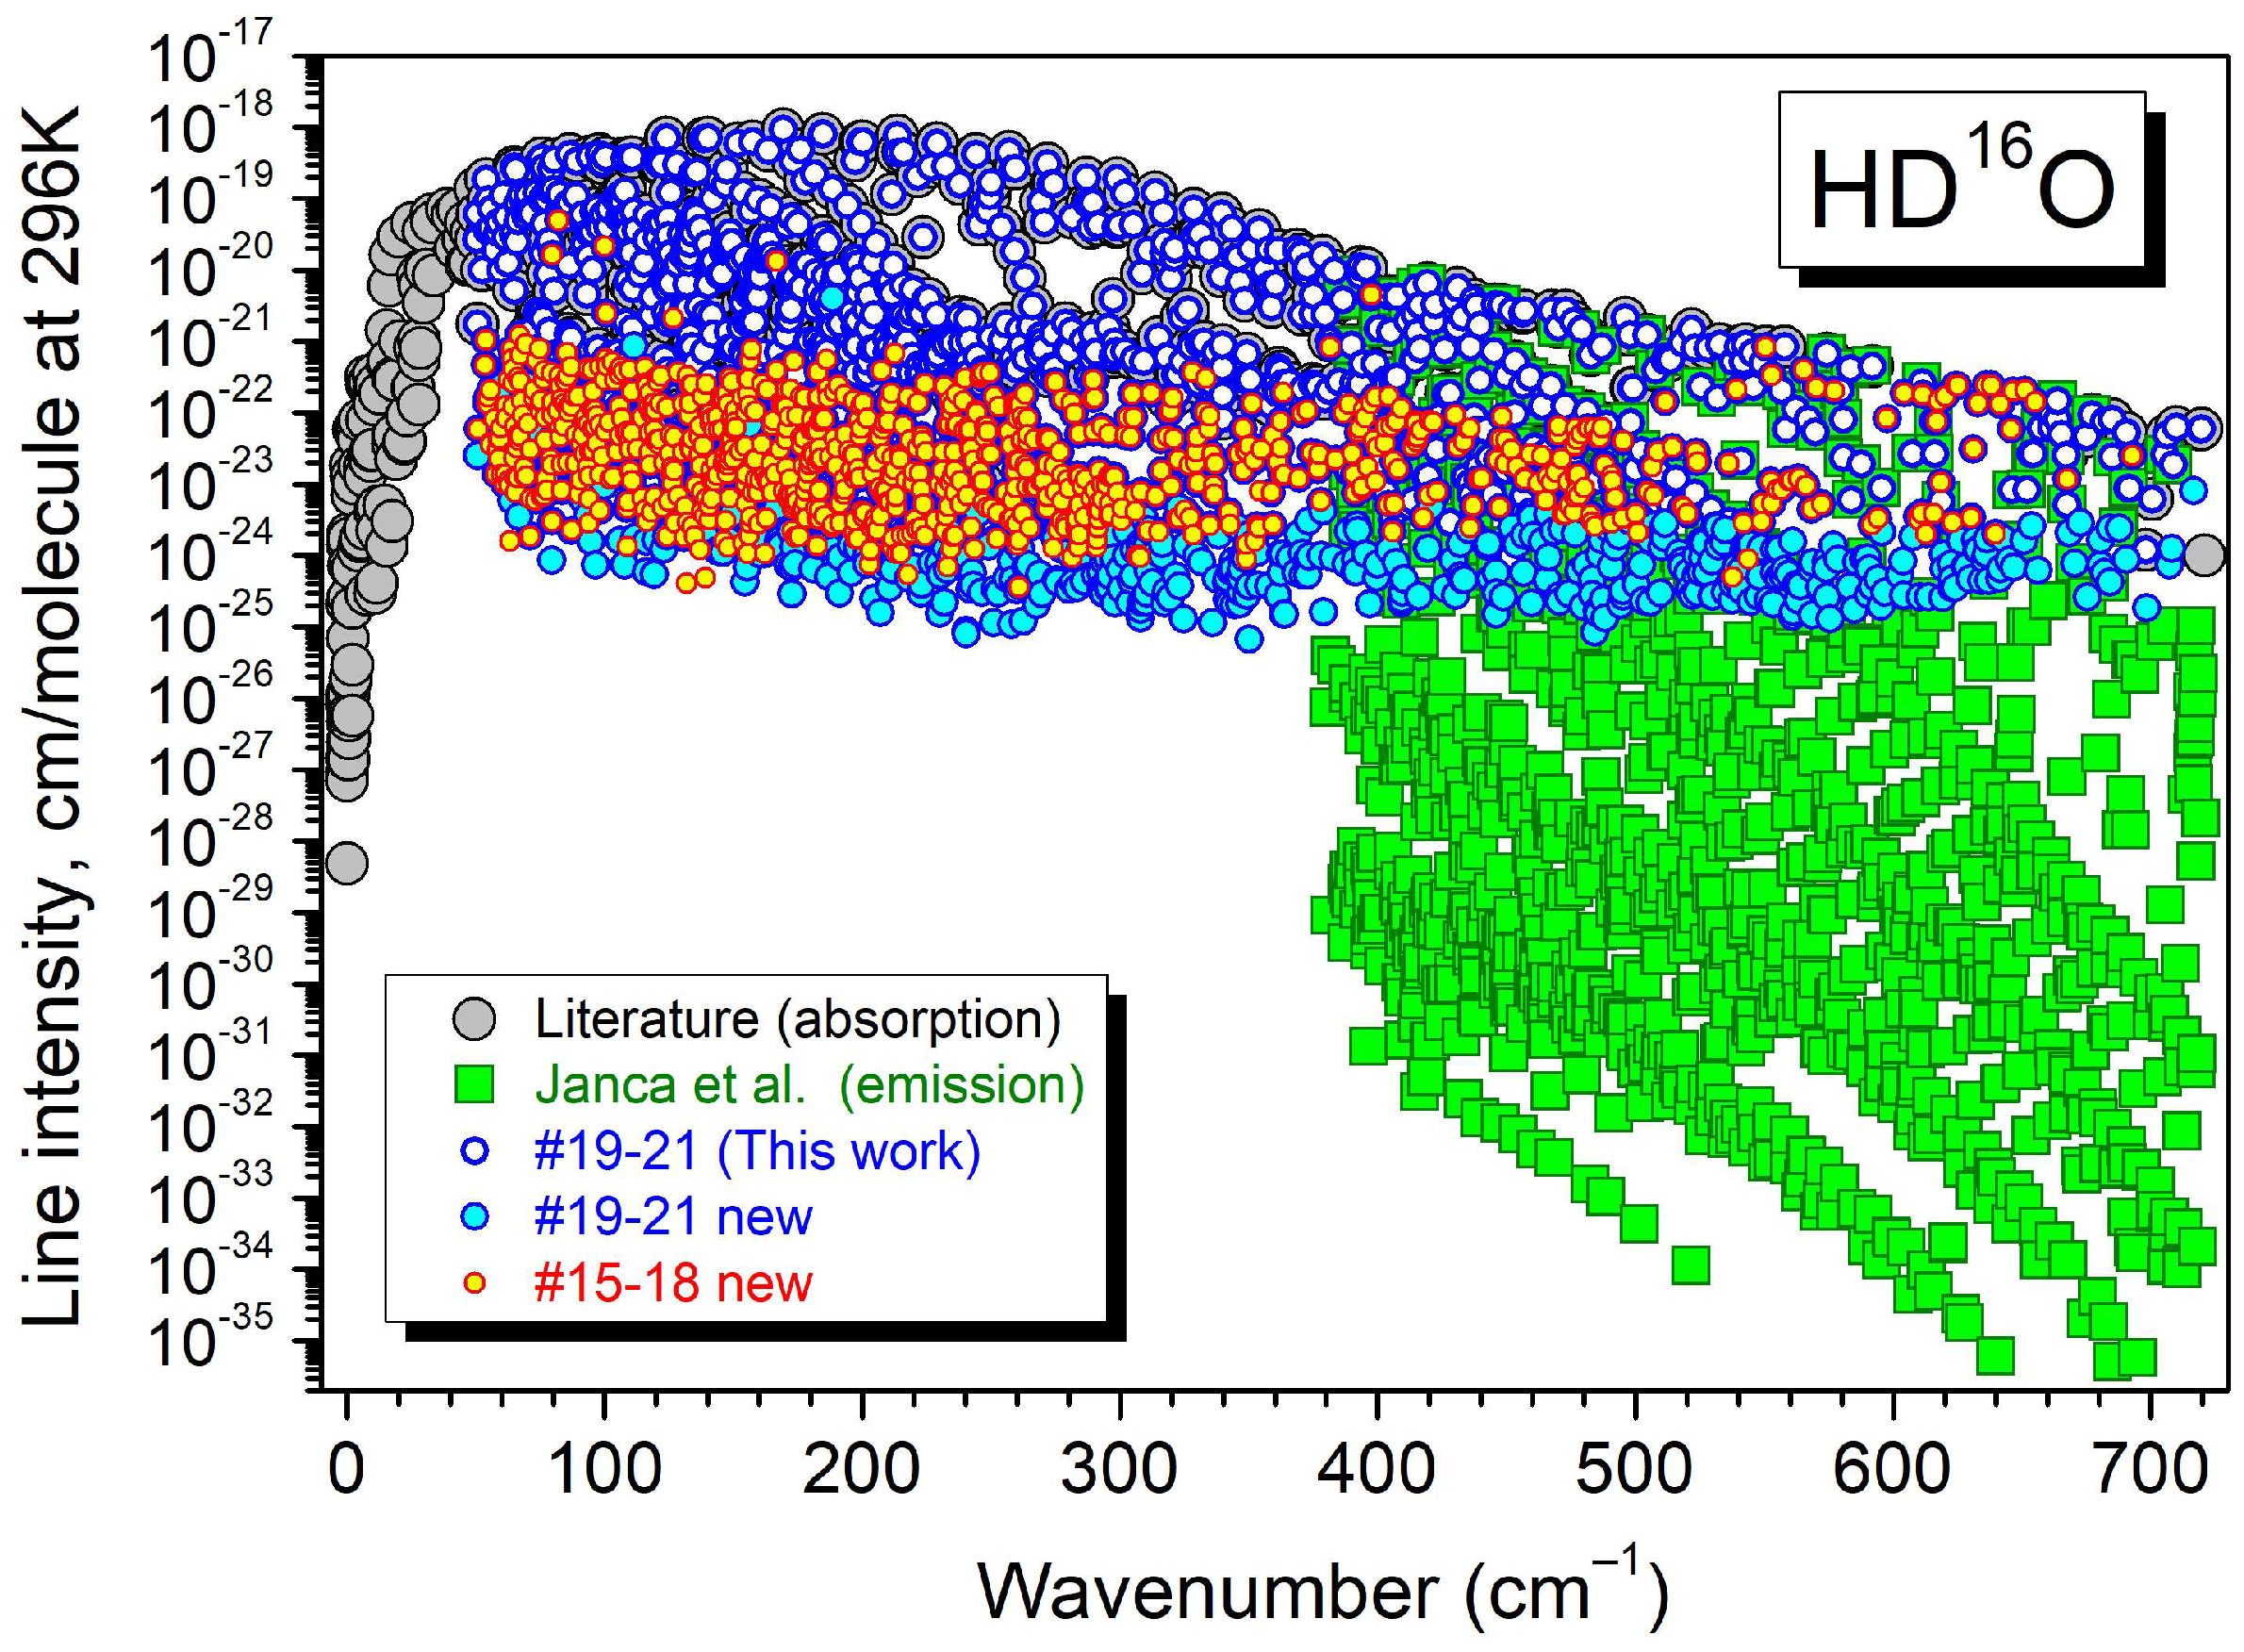
In the analysis of spectra #15–18 [3], we measured 1924 absorption transitions of HD16O, 1039 of them being newly reported compared to both the absorption [1,2,4,19,20,21,22] and emission [23] literature studies. A total of 2443 transitions are presently measured from spectra #19–21. They belong to the four rotational bands of the first four vibrational states: (000), (010), (100), and (020). The transitions of the (020)–(020) and (100)–(100) rotational bands are observed for the first time in absorption. The band-by-band statistics and Jmax and Ka max values are given in Table 5. A total of 533 of these 2443 transitions are new compared to all the previously reported data, including Ref. [3]. An overview of the literature and SOLEIL observations is presented in Figure 4 where new observations are highlighted. Overall, 1572 transitions observed in the SOLEIL spectra #15–18 and #19–21 are new compared to previous studies.
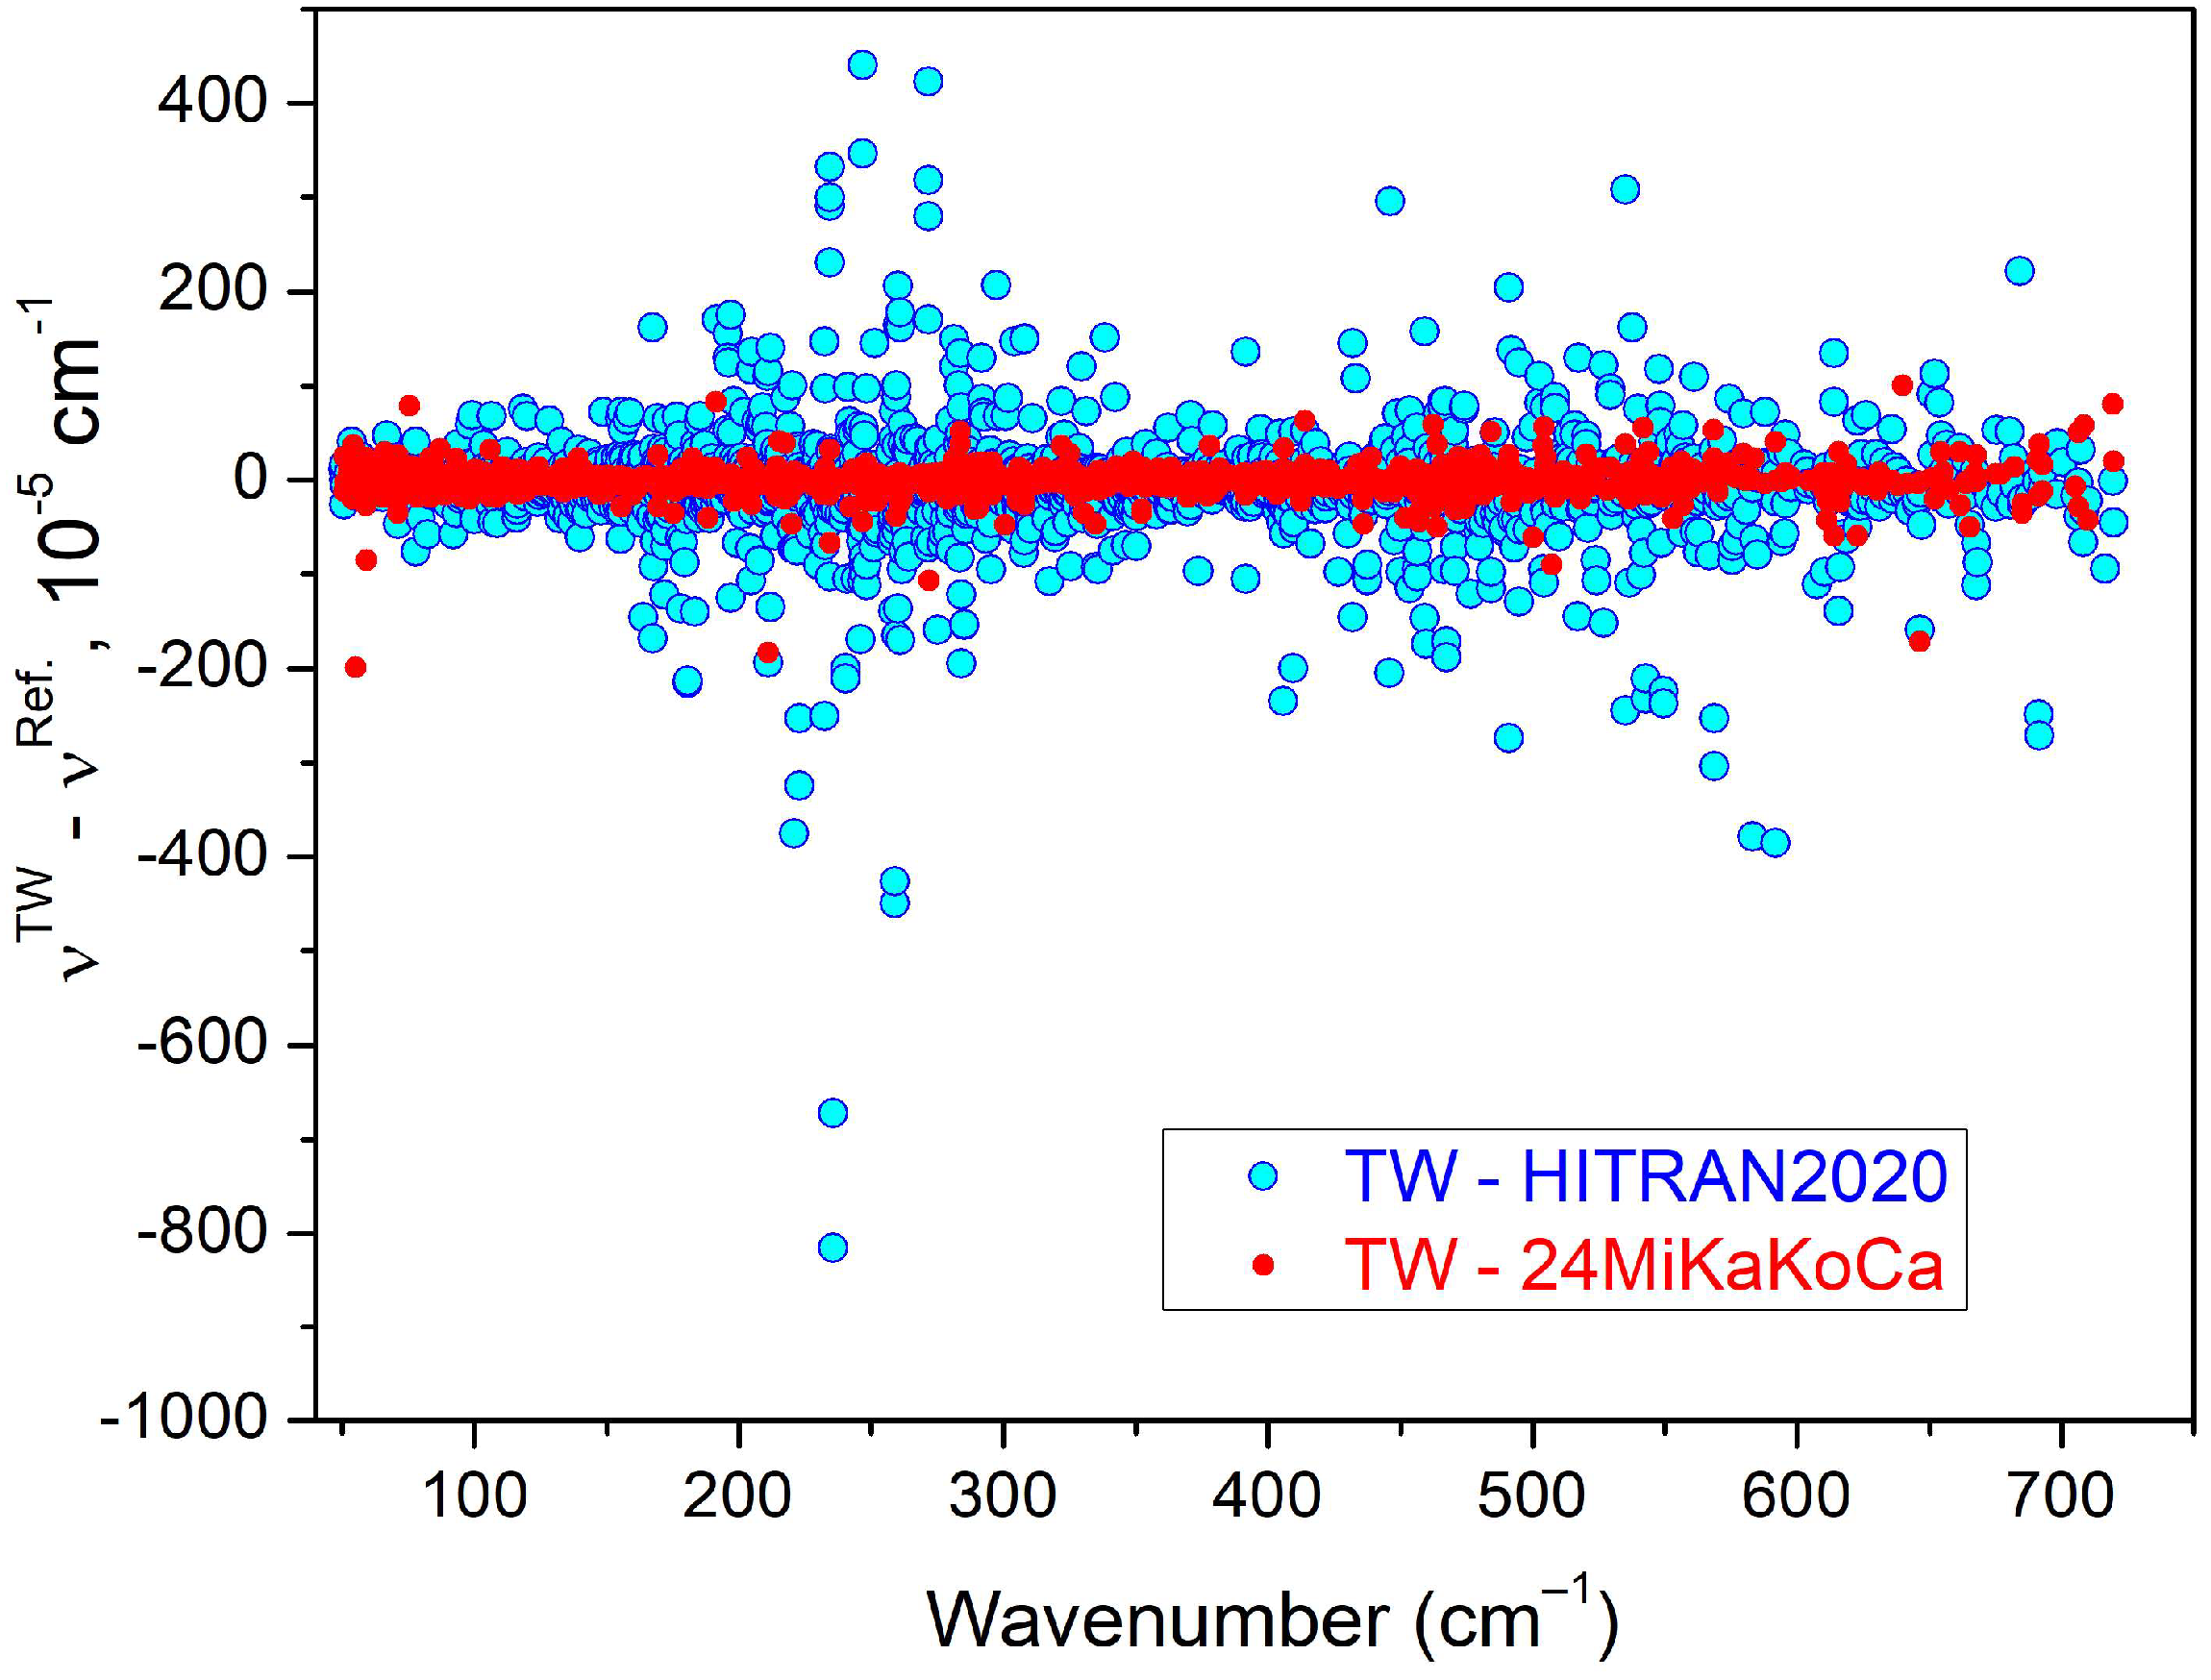
The dν = νTW − νRef. [3] differences between the present line positions and those of Ref. [3] are illustrated in Figure 5. We obtain an RMS value of 13.8 × 10⁻⁵ cm−1 for 1907 position differences. The position differences exceed 0.001 cm−1 for four lines, three of them being highly blended. The examination of the spectrum indicates that the present determinations should be preferred.
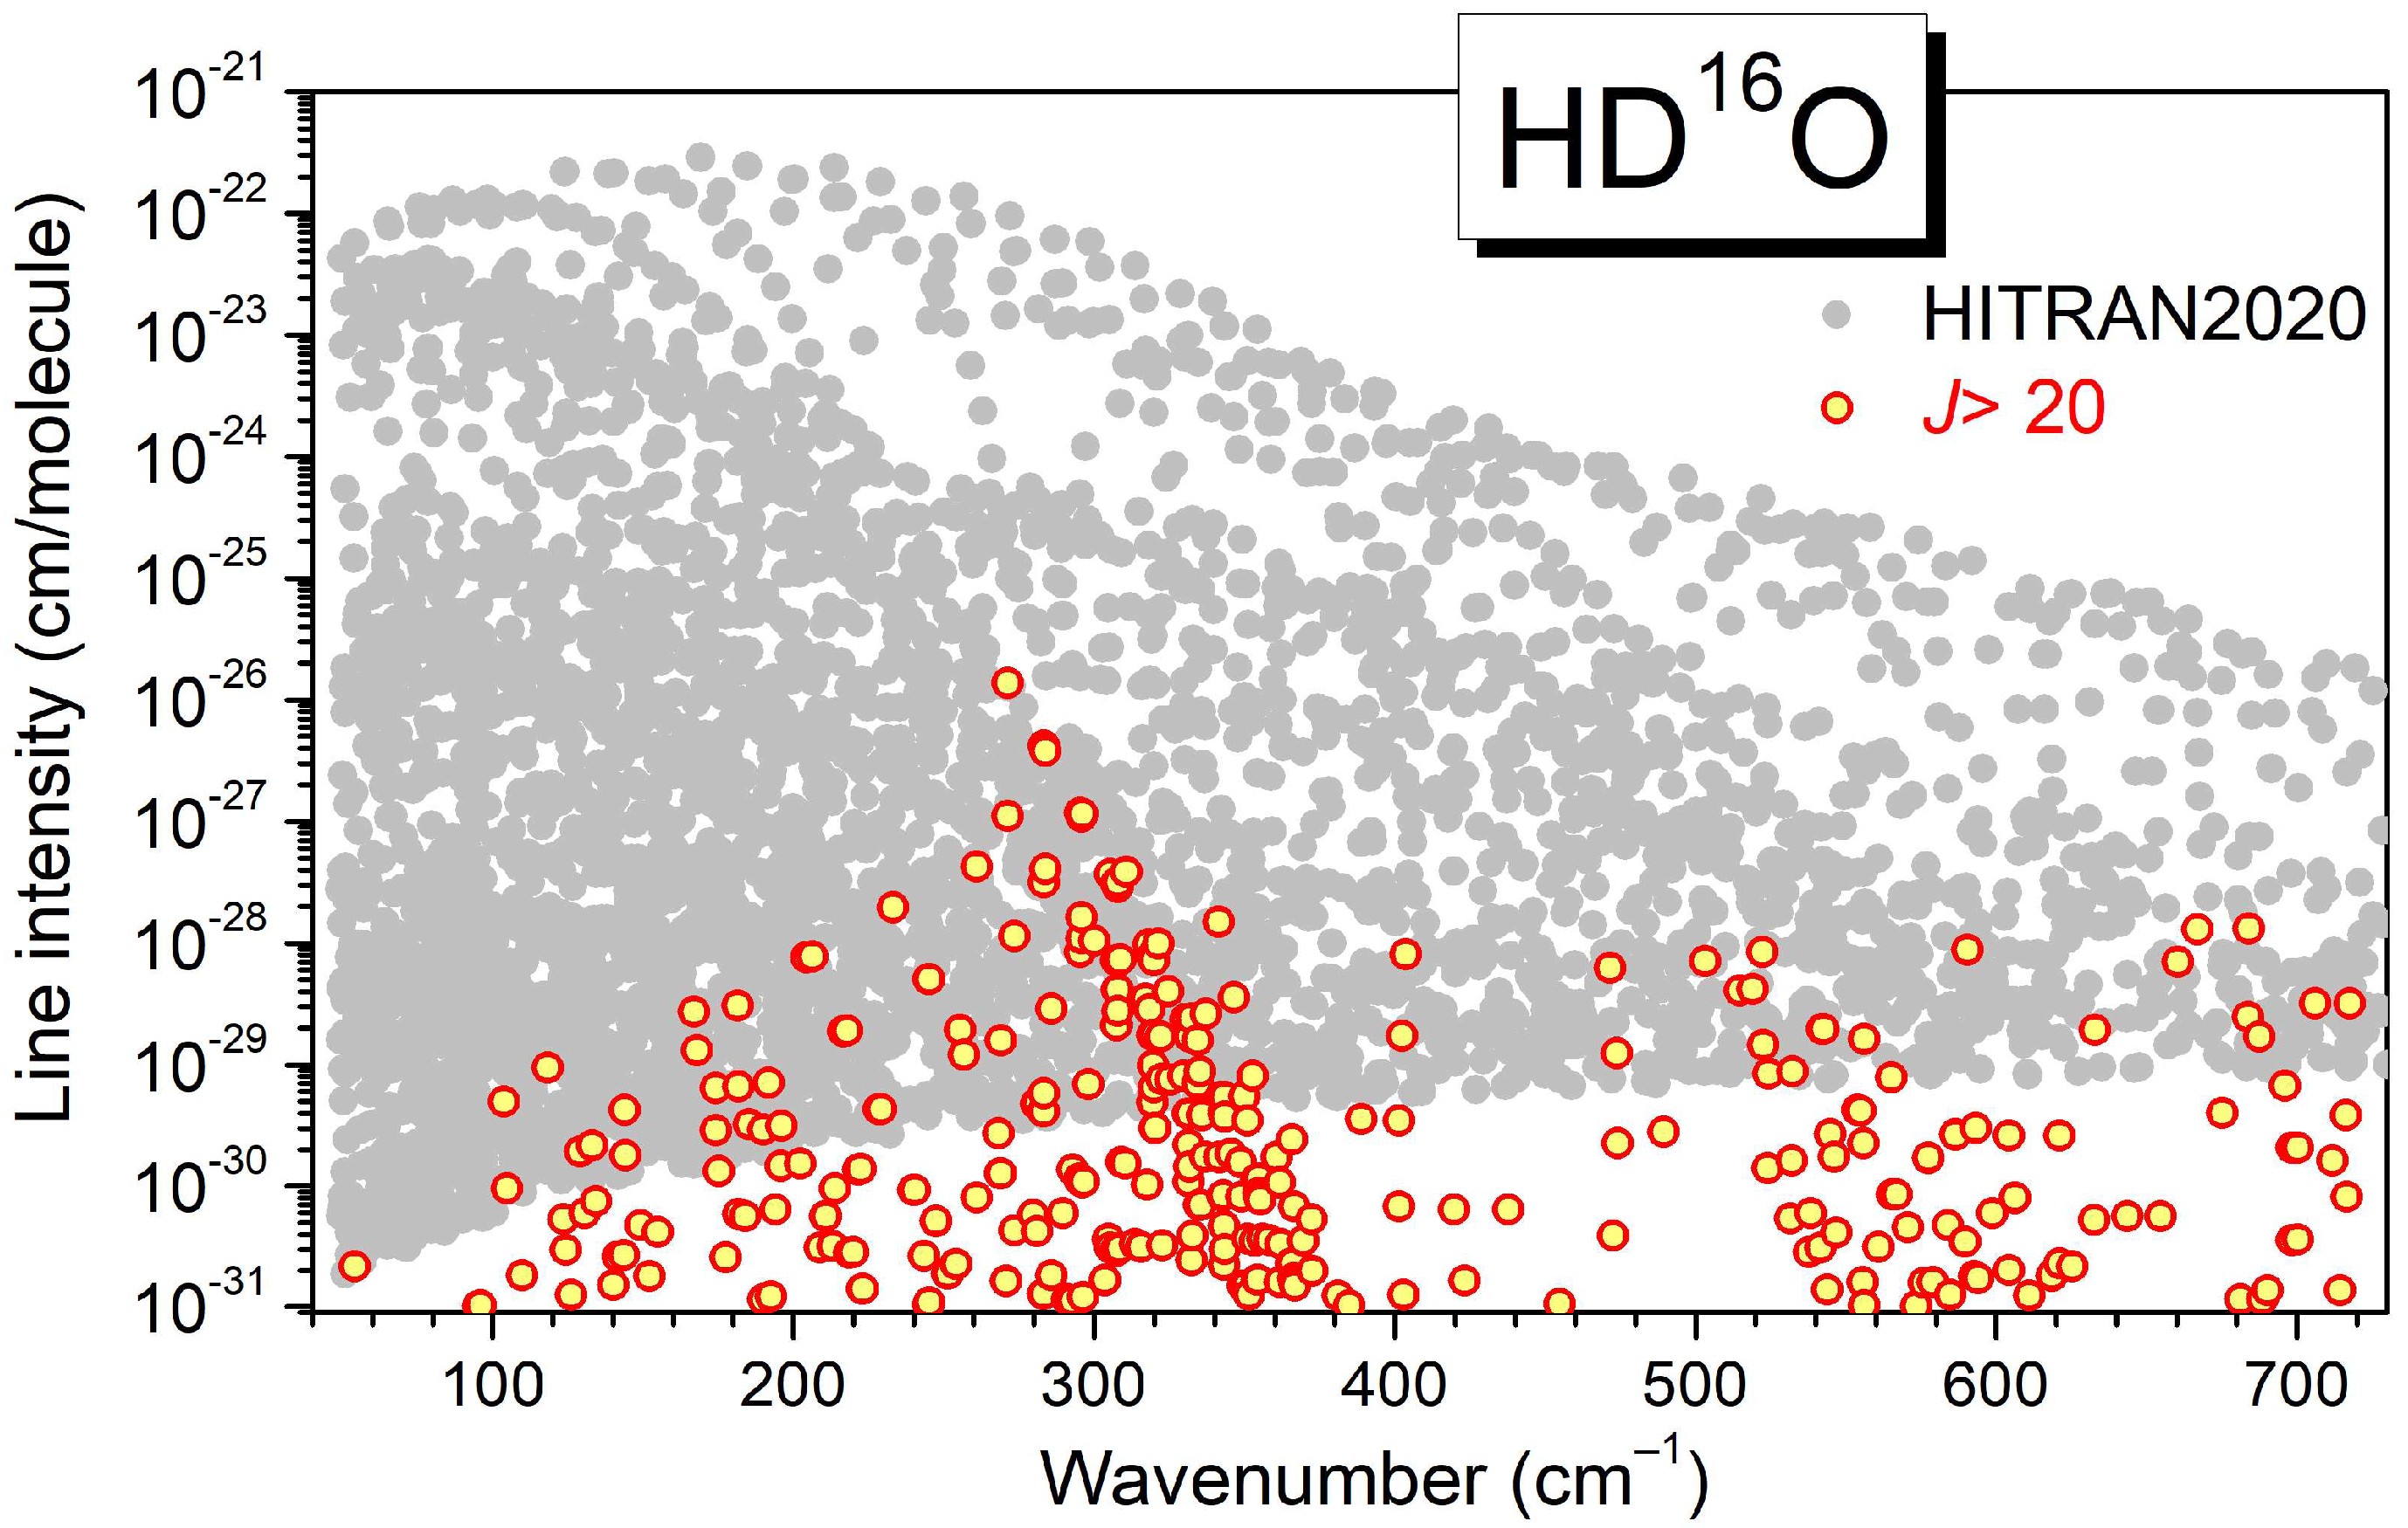
Let us now consider the position comparison to the HITRAN2020 data [5]. The source of the HITRAN line positions of HD16O is the variational line list elaborated by Kyuberis et al. [24]. In the considered region, all the transition frequencies were adjusted according to the IUPAC-TG empirical energy levels [25]. The RMS value of the dν = νTW − νHITRAN2020 differences is 57.2 × 10⁻⁵ cm−1 for 2402 positions (see Figure 5). The deviation exceeds 0.001 cm−1 for more than 130 positions, the largest one (−0.00815 cm−1) corresponds to the 19 2 18–19 1 19 pure rotational transition at 235.76381 cm−1. Finally, more than 40 observed transitions with upper rotation number J′ between 21 and 25 are missing in the HITRAN line list [5,24]. Their line intensities range between 7 × 10⁻²⁹ and 1.4 × 10⁻²⁶ cm/molecule (taking into account the HD16O natural abundance of 3.10693 × 10⁻⁴), which is largely higher than the HD16O intensity cut-off in the range under study (see below).
The complete line-by-line comparison of the present HD16O line positions with those of Ref. [3] and HITRAN2020 [5] is provided as a Supplementary File (SM2). Some examples of significant position shifts between the SOLEIL spectra and the HITRAN2020 database are illustrated in Figure 6.

4. Empirical Energy Levels and a Recommended Line List for HD16O

The present SOLEIL line positions of HD16O and those of Ref. [3] were combined with previous absorption studies to determine accurate empirical values of the energy levels for the first vibrational states of HD16O. In the set of HD16O levels obtained in 2010 by an IUPAC-TG [25], the large set of emission data by Janca et al. [23] (more than 11,000 positions) played a determining role. Their declared experimental uncertainty of 1.0 × 10⁻³ cm−1 [23] was considered as underestimated by the IUPAC-TG (only 67.9% of the 7592 lines were validated within the declared uncertainty) [25]. A value of 0.002 cm−1 seems to be more reasonable for the position uncertainty of these high-temperature emission data. Since our SOLEIL positions have a more than 10 times smaller uncertainty, the emission line positions of Ref. [23] were not used for the present determination of the empirical energy levels which, thus, relies exclusively on absorption data.
The collected dataset of line positions includes about 12800 entries from 0.016 to 4368.7 cm−1. In addition to the present HD16O positions and those of Ref. [3], 36 sources involving the first eight vibrational levels—(000), (010), (100), (020), (001), (110), (030), and (011)—were selected from the literature. All the available microwave measurements [26,27,28,29,30,31,32,33,34,35,36,37,38,39,40,41,42,43,44,45] and infrared absorption measurements below 4400 cm−1 associated with the lowest vibrational states [19,20,21,22,46,47,48,49,50,51,52,53,54,55,56,57] were taken into account. Since all the HD16O transitions reported in Refs. [1,2,4] were observed under better conditions in spectra #15–18 [3] and #19–21 (present study), they were not used for the energy determination. The empirical term values of the rotation–vibration levels were recovered using the Ritz combination principle. The RITZ computer code developed by S.A. Tashkun [58,59,60] was used for this purpose. The obtained set of 1121 empirical rotation–vibration energies for the first five vibrational states (000), (010), (100), (020), and (001) is given as a separate Supplementary Material (SM3).
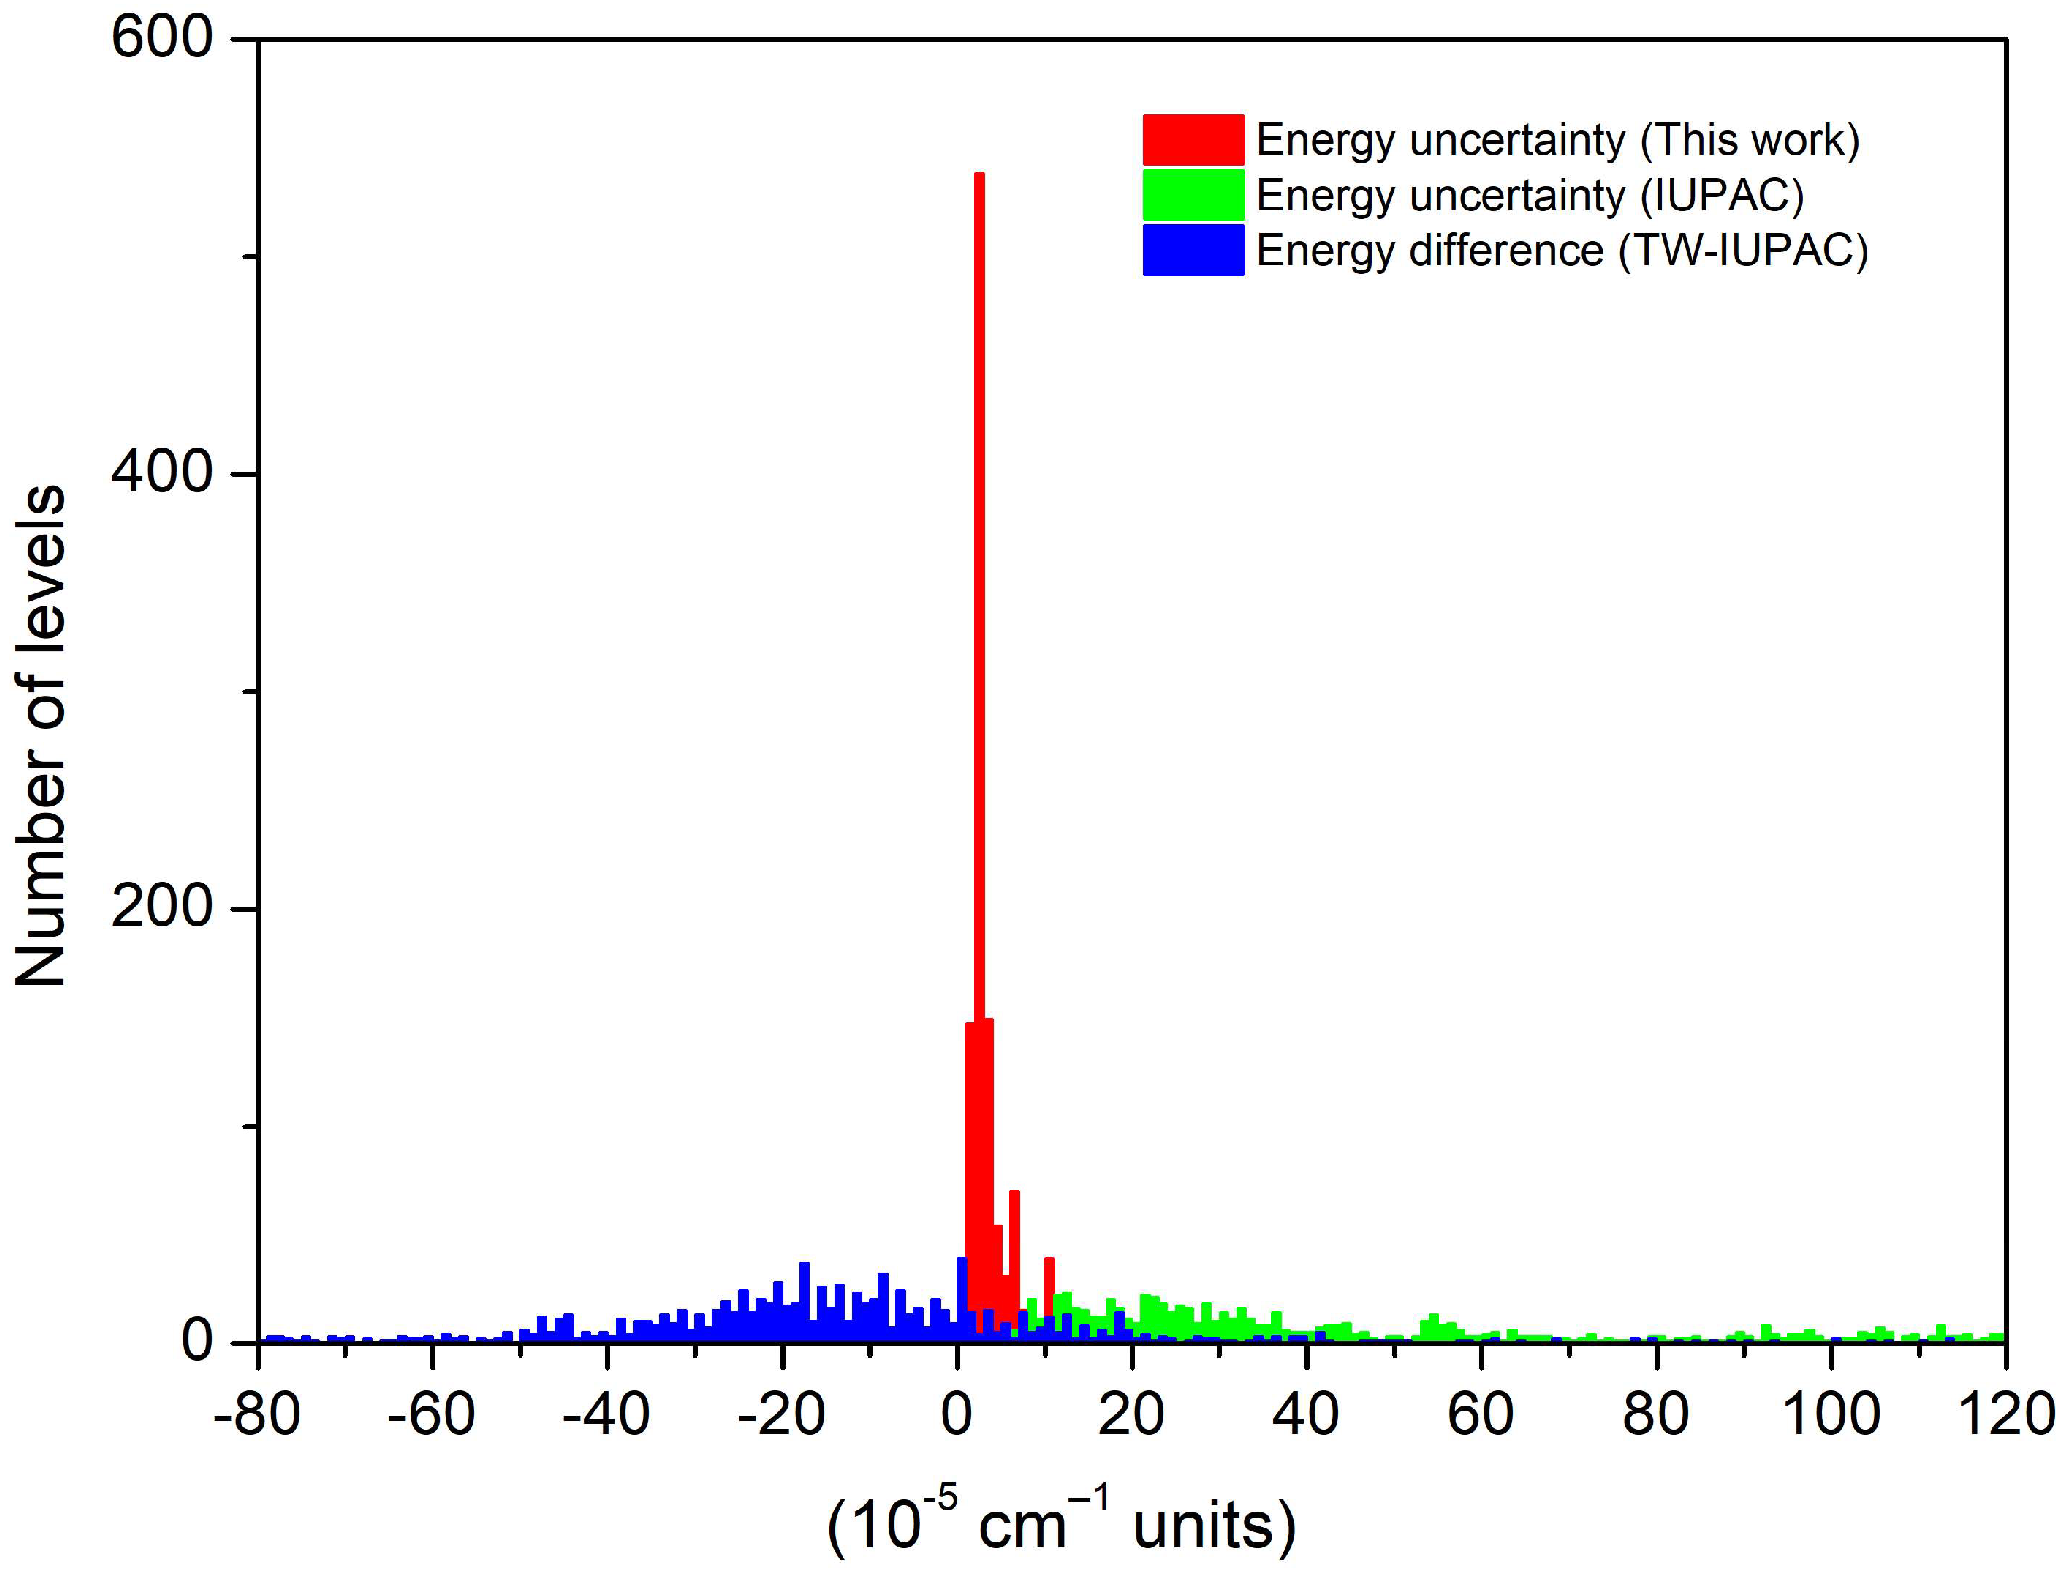
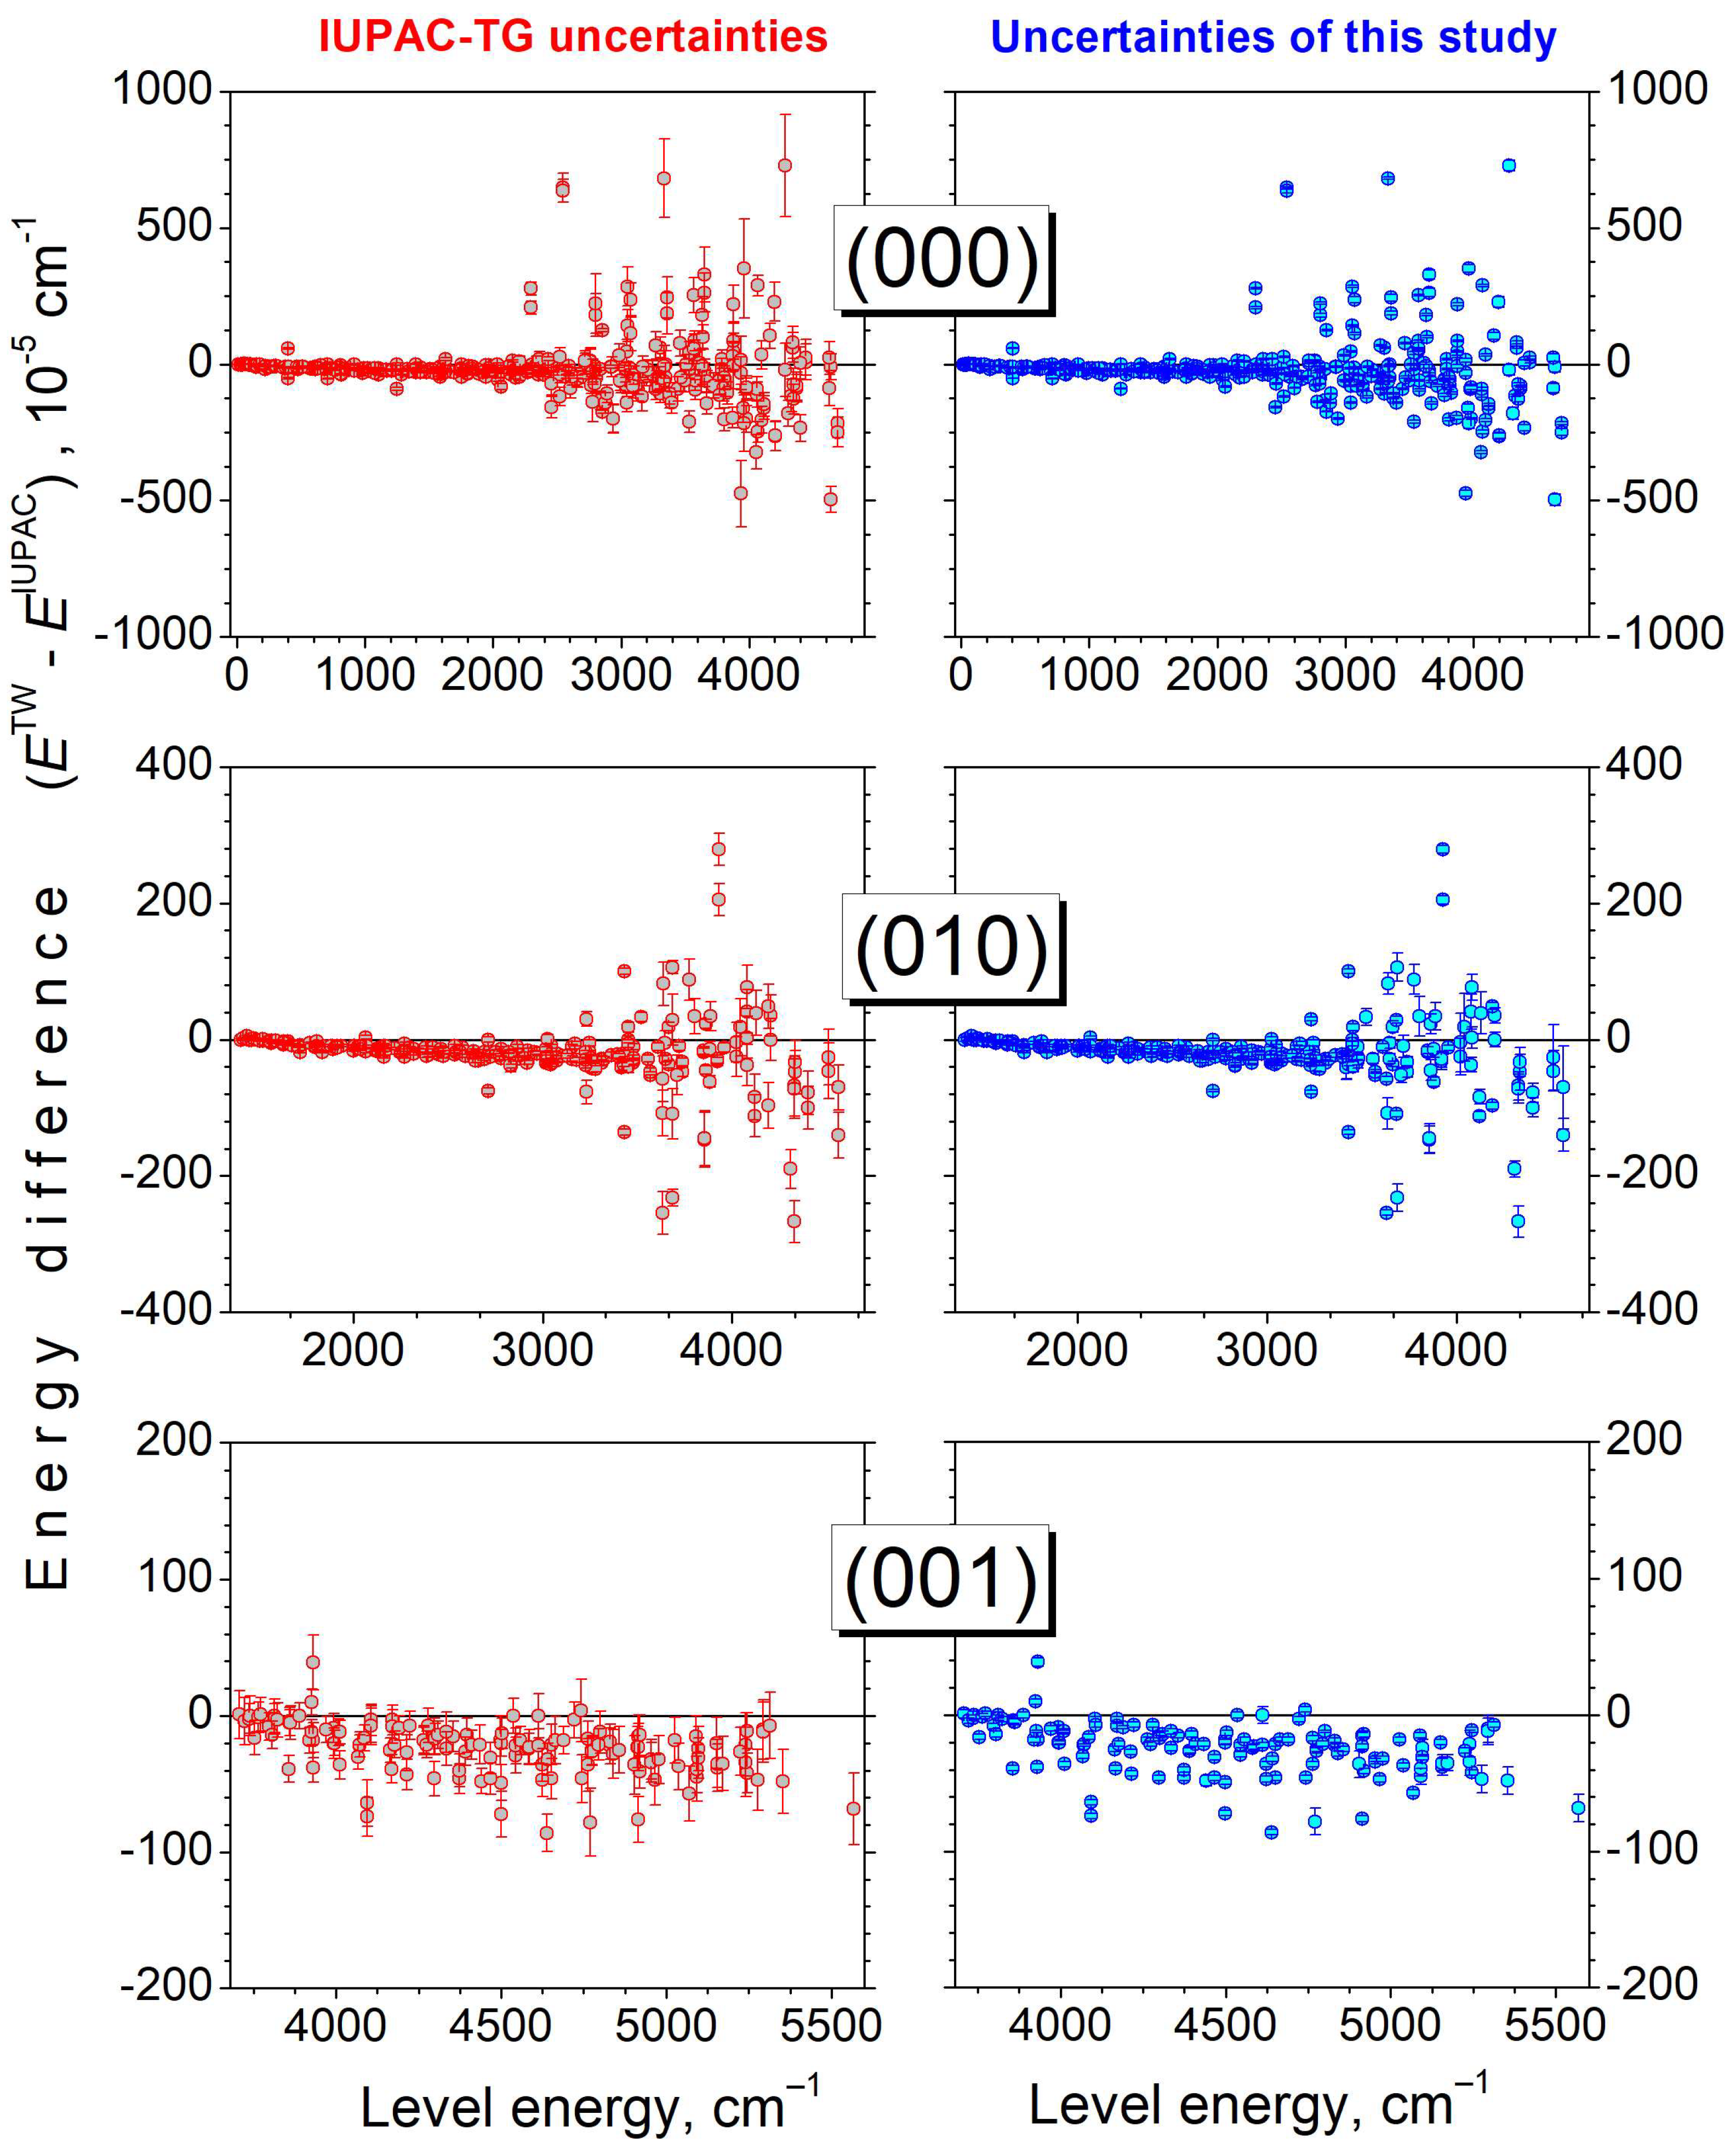
Although no new energy level is determined compared to the IUPAC-TG [25], our set of energy levels represents an important gain in terms of accuracy (see the comparison in the SM3 Supplementary). The use of about 2500 high-precision positions retrieved from the SOLEIL spectra together with the rejection of the emission data [23] leads to a significant improvement in the confidence intervals. It is illustrated in Figure 7 where the histograms of the level uncertainties are compared. For 1121 levels, the mean uncertainty is 1.41 × 10⁻³ cm−1 with an RMS of 1.91 × 10⁻³ cm−1 for the IUPAC-TG to be compared to 3.93 × 10⁻⁵ cm−1 and 4.97 × 10⁻⁵ cm−1, respectively, in our case. We have included in Figure 7 the histogram of the ETWEIUPAC energy differences. On average, the IUPAC-TG values are larger by 1.92 × 10⁻⁴ cm−1 and the standard deviation (1.11 × 10⁻³ cm−1) is consistent with the IUPAC-TG error bars. The systematic overestimation of the IUPAC-TG energy values is illustrated in Figure 8 where the energy differences are plotted versus the energy of the rotational levels of the (000), (010), and (001) vibrational states. This figure shows that the accuracy improvement concerns not only the four rotational bands observed in the SOLEIL spectra (Table 5) but also the (001)–(001) band for which no transitions were observed in the SOLEIL spectra.
According to Figure 8, the overestimation of the IUPAC-TG energies is negligible at low rotational energy and increases mostly linearly with the energy [up to 5 × 10⁻⁴ cm−1 for rotational energies around 3000 cm−1 in the (000) ground state]. The deviations have similar amplitude for the different vibrational levels which might indicate that the energy differences in the ground state are propagated in the excited levels. We tried to trace the origin of this observation by considering a possible calibration error of the emission spectra of Janca et al. [23] used by the IUPAC-TG [25]. The transition frequencies reported by Janca et al. were calculated using our energy levels and compared to their original values but no clear systematic trends could be evidenced. Note that the observed deviations are clear but well below the uncertainty of Janca et al.’s positions (~10−3 cm−1).
For ten levels (not considered in the above comparison and excluded from the SM3 Supplementary Material), our derived energy value differs from the IUPAC-TG value by more than 0.06 cm−1. None of these problematic levels is involved in the FIR transitions observed in the SOLEIL spectra. Thus, our energy values rely exclusively on one of the thirty-six sources of absorption line positions that we selected in the literature, more specifically from Refs. [46,48,53]. While all the IUPAC-TG energies were determined from several (from 3 to 9) emission line positions reported by Janca et al. [23], all but one of our values rely on a single transition from Refs. [46,48,53], as detailed in the following:
(i)
The (010) 20 0 20 and (010) 20 1 20 energies (dE = −0.096 cm−1) were obtained from the 1643.8755 cm−1 line position assigned by Toth to the 20 0 20–19 1 19 and 20 1 20–19 0 19 transitions of the ν2 band [53],
(ii)
The (100) 13 7 7 and (100) 15 2 14 levels with the dE values of −0.097 and −0.061 cm−1, respectively, were determined on the basis of the results of Papineau et al. [46]. The (100) 13 7 7 energy relies on the 3078.740 cm−1 wavenumber assigned to the 13 7 7–126 6 transition of the ν1 band. The (100) 15 2 14 energy was obtained from the 2904.200 and 2904.655 cm−1 wavenumbers assigned to the 15 2 14–14 2 13and 15 2 14–141 13 transitions of the same ν1 band,
(iii)
(The 9 9 1, 9 9 0, 10 8 3, 10 9 2, 10 9 1, and 15 2 14 levels of the (001) vibrational states have dE values of −0.097, −0.097, 0.081, −0.140, −0.140 and 0.266 cm−1, respectively. Our energy value relies on line positions of ν3 transitions given by Toth and Brault [48]: 9 9 1–8 8 0 and 9 9 0–8 8 1 at 4007.7146 cm−1, 10 8 3–9 7 2 at 4012.5627 cm−1, 10 9 2–9 8 1 and 10 9 1–9 8 2 at 4021.6755 cm−1, 15 2 14–14 2 13 at 3895.4251 cm−1.
In order to resolve these conflictive situations, we performed a comparison of the empirical energy (Eemp) (obtained in this work and given by the IUPAC-TG) with the corresponding SP variational values (ESP) from Ref. [8]. Indeed, it is well known that the dE = EempESP energy differences show a smooth dependency on the rotational numbers J and Ka (see, for example, Figure 6 in Ref. [16] or Figure 7 in Ref. [61]). For example, the smooth J dependence of the dE energy difference in the (010) E(J Ka = 0 Kc = J) series allows for predicting the energy of the (010) 20 0 20 level within typically 5 × 10⁻³ cm−1 and thus discriminating the correct value between our energy and the IUPAC-TG value which differ by nearly 0.1 cm−1. In this case and for the nine other levels, the IUPAC-TG energy values obtained from emission transitions [23] were confirmed and thus found preferable to those obtained from the absorption transitions of Refs. [46,48,53], indicating a probable erroneous assignment in those references.
The overview of the 4451 HD16O transitions provided by the HITRAN2020 database in the 50–720 cm−1 range is presented in Figure 9. The HITRAN intensity cut-off (including the HD16O natural abundance factor of 3.10693 × 10⁻⁴) varies from 1.8 × 10⁻³⁰ cm/molecule at 50 cm−1 to 16 × 10−30 cm/molecule at 720 cm−1. The HITRAN maximum value of the rotational quantum number is J = 20 but in the present SOLEIL spectra, transitions with J values up to 25 were assigned and have intensities larger than the HITRAN intensity cut-off. In Figure 9, we have superimposed to the HITRAN list the SP variational transitions with J > 20 [8,9]. Overall, about 400 J > 20 transitions are predicted with an intensity larger than 1 × 10⁻³⁰ cm/molecule. About 160 have an intensity larger than the HITRAN cut-off (the maximum intensity value of these missing transitions is above 1 × 10⁻²⁶ cm/molecule).
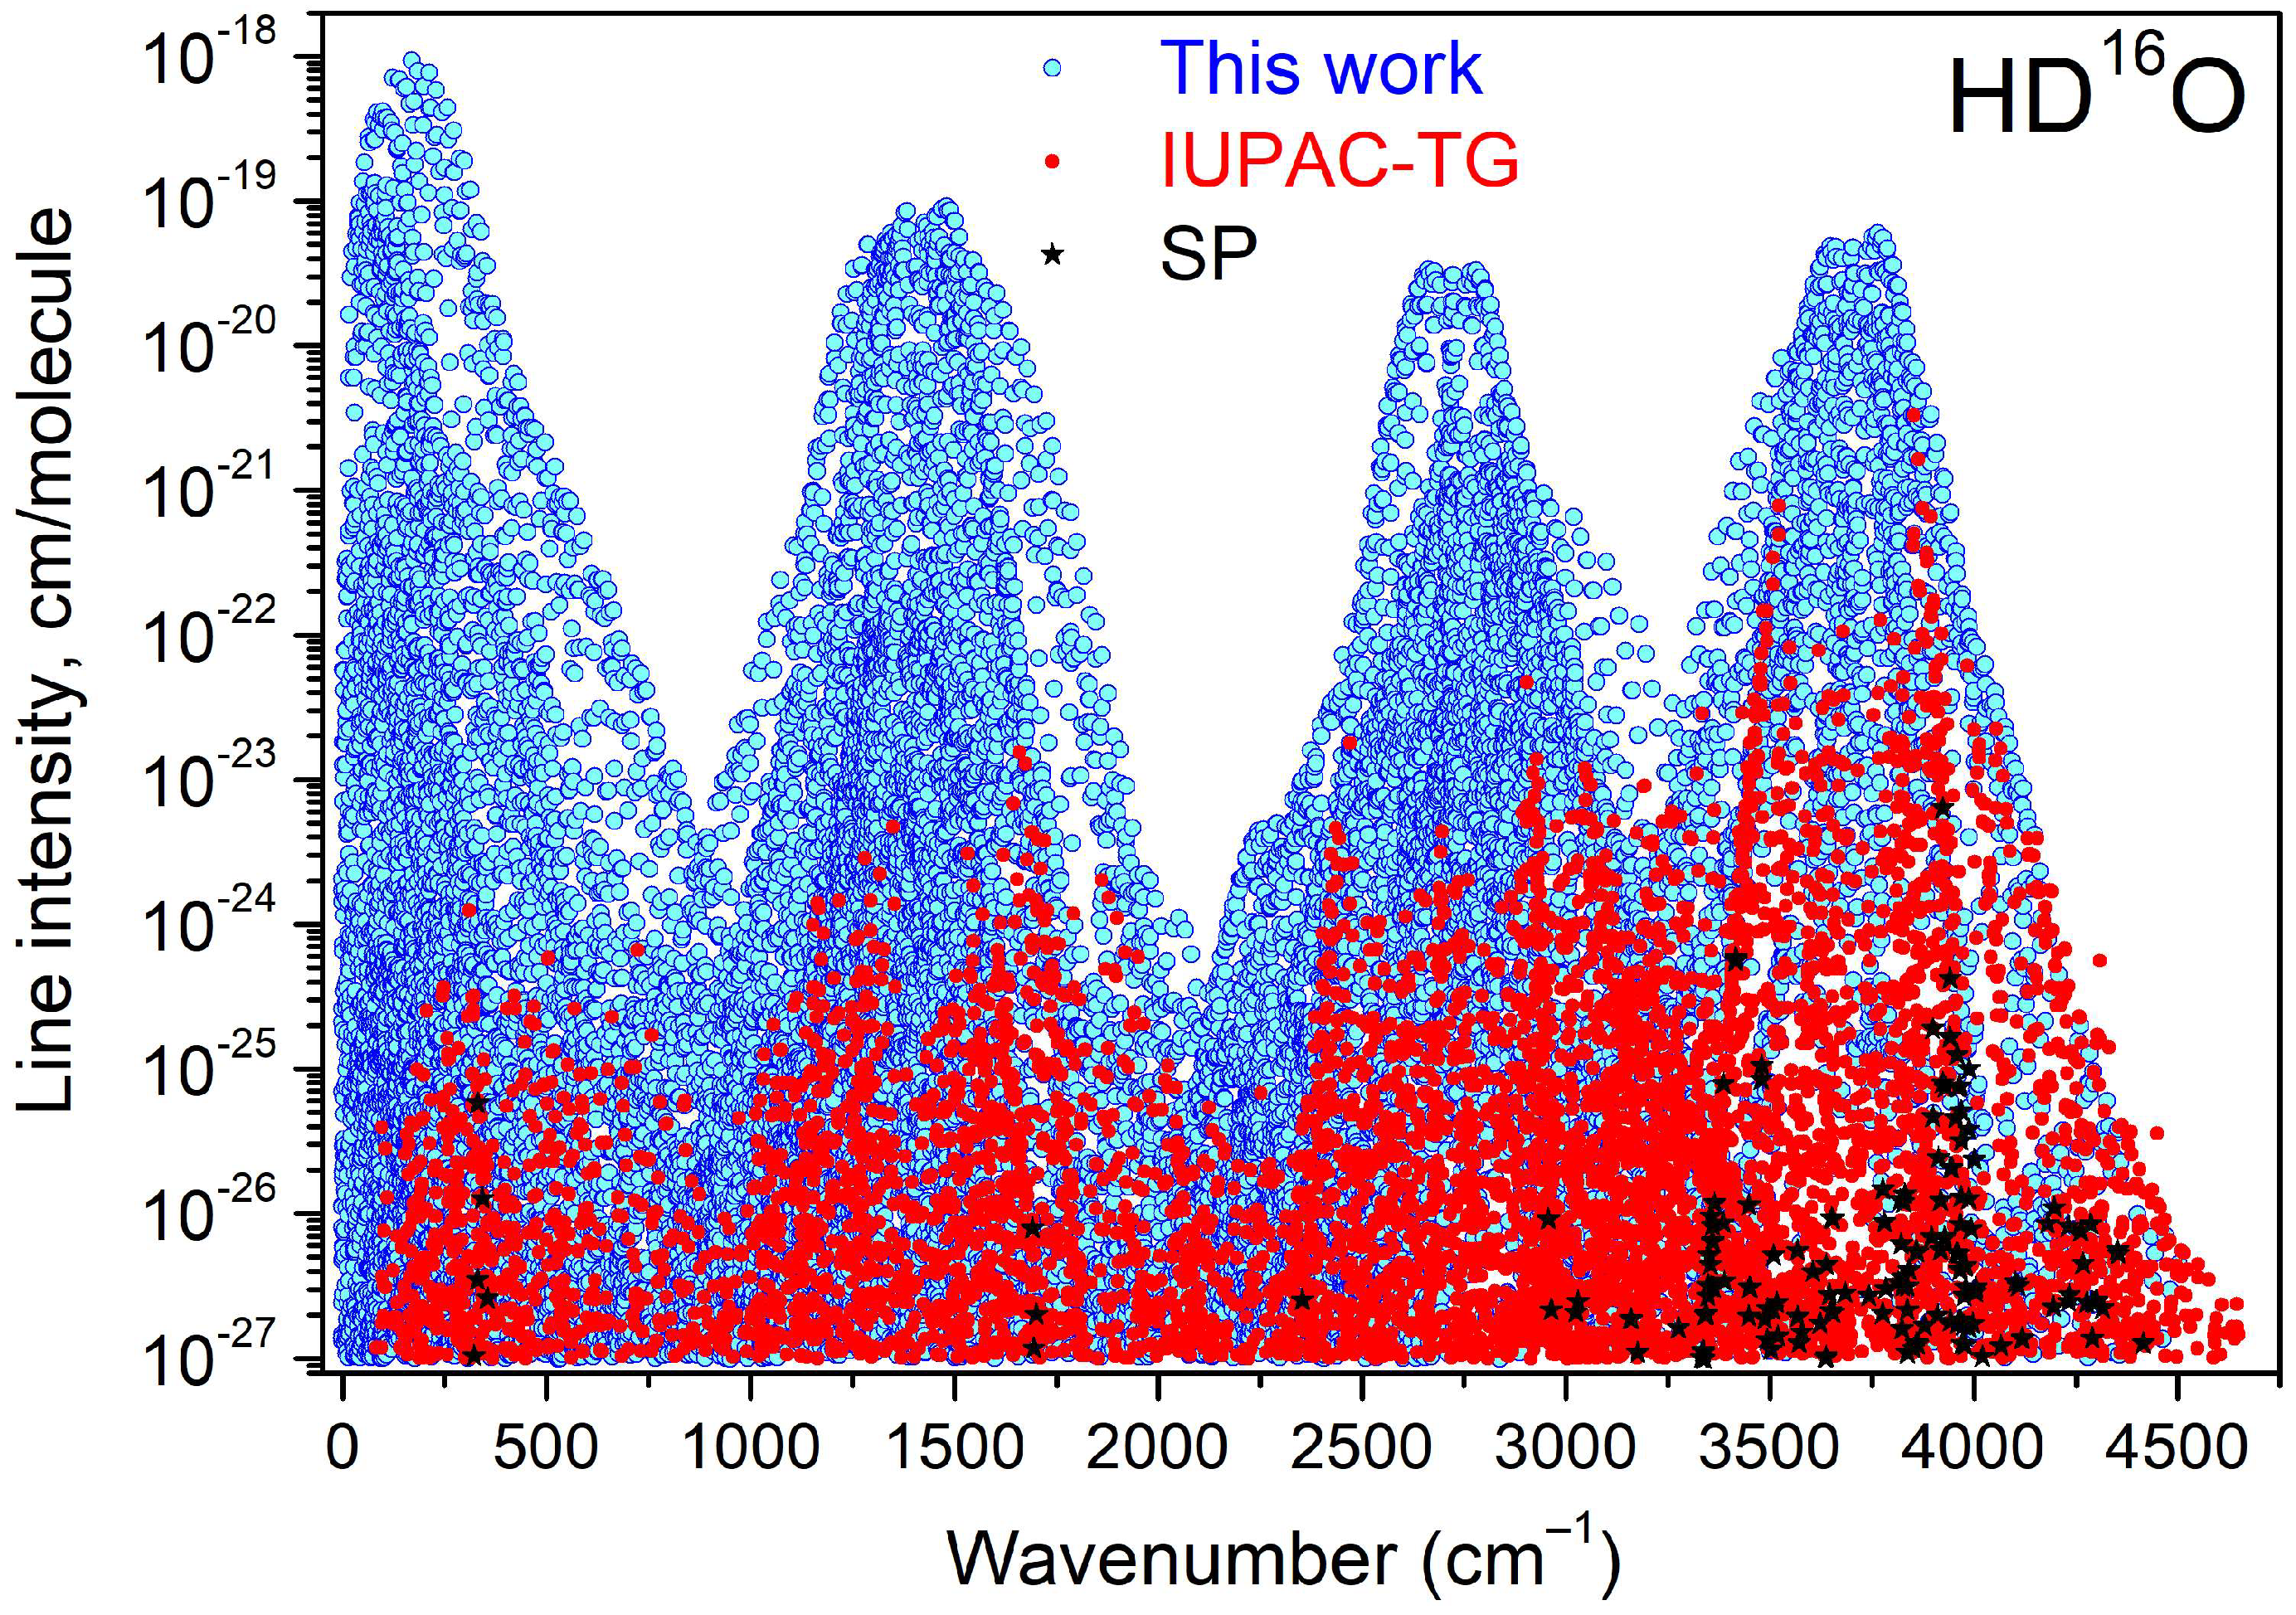
A recommended absorption line list at 296 K for the different bands of HD16O involving the (000), (010), (020), (001), and (100) vibration states is provided as a Supplementary Material (SM4). This list uses as a basis the SP variational line list calculated by Tashkun using the VTET program of Schwenke [62]. The intensity cut-off was fixed to 1 × 10⁻²⁷ cm/molecule for pure HD16O at 296 K (3 × 10⁻³¹ cm/molecule if the abundance factor is included). The line list includes about 31000 transitions belonging to a total of fourteen bands and spans the 0–4650 cm−1 range. For all the transitions involving lower and upper levels with known empirical energy values, the variational frequency has been substituted by its empirical value using our energy values when available and the IUPAC-TG values otherwise. For a small fraction of transitions, empirical energy values are missing and the SP variational frequency was kept unchanged. The overview of the recommended list is given on the upper panel of Figure 10 where transitions with the empirical and variational frequencies are presented with different symbols. Note that while in our region corresponding to the rotation bands (0–700 cm−1), it has been possible to empirically correct most of the line positions using our energy values; at higher frequencies, a significant fraction of the transitions have their frequencies relying on the IUPAC-TG energy levels.

5. Concluding Remarks

Three long-pass FTS spectra recorded in the far infrared at the SOLEIL synchrotron have been analyzed to extend the set of HD16O lines measured by absorption. Overall, the previous [1,2,3,4] and present analyses of different SOLEIL spectra have increased the number of absorption line positions measured between 50 and 720 cm−1 from about 530 available in the literature to more than 2350. For the first time, rotational absorption lines in the (010), (100), and (020) excited states were detected. The typical line position accuracy (better than 10−4 cm−1) has allowed for the reduction in the error bars of the energy levels of the first five vibrational states of HD16O. Compared to the most relevant previous set elaborated by an IUPAC task group fifteen years ago [25], the average energy uncertainty is reduced from 1.4 × 10⁻³ cm−1 to about 4 × 10⁻⁵ cm−1. As the considered states are the lowest states of most of the rovibrational transitions, this improvement will impact the accuracy of the line positions in all the frequency regions of the HD16O spectrum.
As the main output of the present work, a recommended line list is provided for the fourteen HD16O bands involving the first five vibrational levels. This list covering the 0–4650 cm−1 frequency range is proposed for improving the line list of natural water vapor in the far-infrared region, of particular importance for atmospheric applications.

Supplementary Materials

The following supporting information can be downloaded at https://www.mdpi.com/article/10.3390/molecules29235508/s1. The three analyzed FTS spectra (SM0), the complete line list of the analyzed FTS spectra (SM1), HD16O line position comparison to the literature (SM2), the derived set of HD16O energy levels (SM3), and recommended line lists elaborated for HD16O (SM4).

Author Contributions

Conceptualization, S.N.M. and A.C.; methodology, S.N.M. and A.C.; software, E.V.K., A.O.K. and S.N.M.; validation, S.N.M. and A.C.; formal analysis, E.V.K. and A.O.K.; investigation, E.V.K., A.O.K., S.N.M. and A.C.; data curation, E.V.K. and A.O.K.; writing—original draft preparation, S.N.M. and A.C.; writing—review and editing, S.N.M. and A.C.; project administration, A.C.; funding acquisition, A.C. and S.N.M. All authors have read and agreed to the published version of the manuscript.

Funding

This research received no external funding.

Data Availability Statement

The data that support the findings of this study are available within the article and its Supplementary Material.

Acknowledgments

The authors are indebted to O. Pirali (ISMO) for his help during the recordings of the FIR spectra at the SOLEIL synchrotron (Project No20210051). SNM activity was supported by the Ministry of Science and Higher Education of the Russian Federation (V.E. Zuev Institute of Atmospheric Optics, SB, RAS). EVK contribution was carried out with the partial financial support of the Ministry of Science and Higher Education of the Russian Federation (Agreement No. 075-15-2024-557 dated 25 April 2024).

Conflicts of Interest

The authors have no conflicts to disclose.

References

  1. Toureille, M.; Koroleva, A.O.; Mikhailenko, S.N.; Pirali, O.; Campargue, A. Water vapor absorption spectroscopy in the far-infrared (50–720 cm−1). Part 1: Natural water. J. Quant. Spectrosc. Radiat. Transf. 2022, 291, 108326. [Google Scholar] [CrossRef]
  2. Karlovets, E.V.; Mikhailenko, S.N.; Koroleva, A.O.; Campargue, A. Water vapor absorption spectroscopy and validation tests of databases in the far-infrared (50–720 cm−1). Part 2: H217O and HD17O. J. Quant. Spectrosc. Radiat. Transf. 2024, 314, 108829. [Google Scholar] [CrossRef]
  3. Mikhailenko, S.N.; Karlovets, E.V.; Koroleva, A.O.; Campargue, A. The far infrared absorption spectrum of D216O, D217O, and D218O: Experimental line positions, empirical energy levels and recommended line lists. J. Phys. Chem. Ref. Data 2024, 53, 023102. [Google Scholar] [CrossRef]
  4. Mikhailenko, S.N.; Béguier, S.; Odintsova, T.A.; Tretyakov, M.Y.; Pirali, O.; Campargue, A. The far-infrared spectrum of 18O enriched water vapour (40–700 cm−1). J. Quant. Spectrosc. Radiat. Transf. 2020, 253, 107105. [Google Scholar] [CrossRef]
  5. Gordon, I.E.; Rothman, L.S.; Hargreaves, R.J.; Hashemi, R.; Karlovets, E.V.; Skinner, F.M.; Yurchenko, S.N. The HITRAN2020 molecular spectroscopic database. J. Quant. Spectrosc. Radiat. Transf. 2022, 277, 107949. [Google Scholar] [CrossRef]
  6. Delahaye, T.; Armante, R.; Scott, N.A.; Jacquinet-Husson, N.; Chédin, A.; Crépeau, L.; Yurchenko, S. The 2020 edition of the GEISA spectroscopic database. J. Mol. Spectrosc. 2021, 380, 111510. [Google Scholar] [CrossRef]
  7. Furtenbacher, T.; Tóbiás, R.; Tennyson, J.; Polyansky, O.L.; Kyuberis, A.A.; Ovsyannikov, R.I.; Császár, A.G. W2020: A database of validated rovibrational experimental transitions and empirical energy levels of water isotopologues. II. H217O and H218O with an update to H216O. J. Phys. Chem. Ref. Data 2020, 49, 43103. [Google Scholar] [CrossRef]
  8. Partridge, H.; Schwenke, D.W. The determination of an accurate isotope dependent potential energy surface for water from extensive ab initio calculations and experimental data. J. Chem. Phys. 1997, 106, 4618–4639. [Google Scholar] [CrossRef]
  9. Schwenke, D.W.; Partridge, H. Convergence testing of the analytic representation of an ab initio dipole moment function for water: Improved fitting yield improved intensity. J. Chem. Phys. 2000, 113, 6592–6597. [Google Scholar] [CrossRef]
  10. Odintsova, T.A.; Tretyakov, M.Y.; Simonova, A.; Ptashnik, I.; Pirali, O.; Campargue, A. Measurement and temperature dependence of the water vapor self-continuum in the 70–700 cm−1 range. J. Mol. Struct. 2020, 1210, 128046. [Google Scholar] [CrossRef]
  11. Odintsova, T.A.; Koroleva, A.O.; Simonova, A.A.; Campargue, A.; Tretyakov, M.Y. The atmospheric continuum in the “terahertz gap”: Review of experiments at SOLEIL synchrotron and modeling. J. Mol. Spectrosc. 2022, 386, 111603. [Google Scholar] [CrossRef]
  12. Koroleva, A.O.; Odintsova, T.A.; Tretyakov, M.Y.; Pirali, O.; Campargue, A. The foreign-continuum absorption of water vapour in the far-infrared (50–500 cm−1). J. Quant. Spectrosc. Radiat. Transf. 2021, 261, 107486. [Google Scholar] [CrossRef]
  13. Toth, R.A.; Brown, L.R.; Plymate, C. Self-broadened widths and frequency shifts of water vapor lines between 590 and 2400 cm−1. J. Quant. Spectrosc. Radiat. Transf. 1998, 59, 529–562. [Google Scholar] [CrossRef]
  14. Podobedov, V.B.; Plusquellic, D.F.; Fraser, G.T. THz laser study of self-pressure and temperature broadening and shifts of water vapor lines for pressures up to 1.4 kPa. J. Quant. Spectrosc. Radiat. Transf. 2004, 87, 377–385. [Google Scholar] [CrossRef]
  15. Tóbiás, R.; Diouf, M.L.; Cozijn, F.M.J.; Ubachs, W.; Császár, A.G. A paths lead to hubs in the spectroscopic networks of water isotopologues H216O and H218O. Commun. Chem. 2024, 7, 34. [Google Scholar] [CrossRef]
  16. Mellau, G.; Mikhailenko, S.N.; Starikova, E.N.; Tashkun, S.A.; Over, H.; Tyuterev, V.G. Rotational levels of the (000) and (010) states of D216O from hot emission spectra in the 320–860 cm−1 region. J. Mol. Spectrosc. 2004, 224, 32–60. [Google Scholar] [CrossRef]
  17. Zobov, N.F.; Ovsannikov, R.I.; Shirin, S.V.; Polyansky, O.L.; Tennyson, J.; Janka, A.; Bernath, P.F. Infrared emission spectrum of hot D2O. J. Mol. Spectrosc. 2006, 240, 112–119. [Google Scholar] [CrossRef]
  18. Tennyson, J.; Bernath, P.F.; Brown, L.R.; Campargue, A.; Császár, A.G.; Daumont, L.; Vasilenko, I.A. IUPAC critical evaluation of the rotational-vibrational spectra of water vapor. Part IV: Energy levels and transition wavenumbers for D216O, D217O, and D218O. J. Quant. Spectrosc. Radiat. Transf. 2014, 142, 93–108. [Google Scholar] [CrossRef]
  19. Kaupinen, J.; Karkkainen, T.; Kyro, E. High-resolution spectrum of water vapor between 30 and 720 cm−1. J. Mol. Spectrosc. 1978, 71, 15–45. [Google Scholar] [CrossRef]
  20. Johns, J.W.C. High-resolution far-infrared (20–350 cm−1) spectra of several species of H2O. J. Opt. Soc. Am. B 1985, 2, 1340–1354. [Google Scholar] [CrossRef]
  21. Paso, R.; Horneman, V.M. High-resolution rotational absorption spectra of H216O, HD16O, and D216O between 110 and 500 cm−1. J. Opt. Soc. Am. B 1995, 12, 1813–1837. [Google Scholar] [CrossRef]
  22. Toth, R.A. HDO and D2O low pressure, long path spectra in the 600–3100 cm−1 region. I. HDO line positions and strengths. J. Mol. Spectrosc. 1999, 195, 73–97. [Google Scholar] [CrossRef] [PubMed]
  23. Janca, A.; Tereszchuk, K.; Bernath, P.F.; Zobov, N.F.; Shirin, S.V.; Polyansky, O.L.; Tennyson, J. Emission spectrum of hot HDO below 4000 cm−1. J. Mol. Spectrosc. 2003, 219, 132–135. [Google Scholar] [CrossRef]
  24. Kyuberis, A.A.; Zobov, N.F.; Naumenko, O.V.; Voronin, B.A.; Polyansky, O.L.; Lodi, L.; Tennyson, J. Room temperature line lists for deuterated water. J. Quant. Spectrosc. Radiat. Transf. 2017, 203, 175–185. [Google Scholar] [CrossRef]
  25. Tennyson, J.; Bernath, P.F.; Brown, L.R.; Campargue, A.; Császár, A.G.; Daumont, L.; Voronin, B.A. IUPAC critical evaluation of the rotational-vibrational spectra of water vapor. Part II. Energy levels and transition wavenumbers for HD16O, HD17O, and HD18O. J. Quant. Spectrosc. Radiat. Transf. 2010, 111, 2160–2184. [Google Scholar] [CrossRef]
  26. Townes, C.H.; Merrit, F.R. Water spectrum near one-centimeter wave-length. Phys. Rev. 1946, 70, 558–559. [Google Scholar] [CrossRef]
  27. Strandberg, M.W.P.; Wentink, T., Jr.; Hillger, R.E.; Wannier, G.H.; Deutsch, M.L. Stark spectrum of HDO. Phys. Rev. 1948, 73, 188. [Google Scholar] [CrossRef]
  28. McAfee, K.B., Jr. A Study of the Absorption of Some Gases at Microwave Frequencies. Ph.D. Thesis, Harvard University, Harvard, MA, USA, 1949. [Google Scholar]
  29. Strandberd, M.W.P. Rotational absorption spectrum of HDO. J. Chem. Phys. 1949, 17, 901–904. [Google Scholar] [CrossRef]
  30. Beers, Y.; Weisbaum, S. An ultra-high-frequency rotational line of HDO. Phys. Rev. 1953, 91, 1014. [Google Scholar] [CrossRef]
  31. Jen, C.K.; Bianco, D.R.; Massey, J.T. Some heavy water rotational absorption lines. J. Chem. Phys. 1953, 21, 520–525. [Google Scholar] [CrossRef]
  32. Crawford, H.D. Two new lines in the microwave spectrum of heavy water. J. Chem. Phys. 1953, 21, 2099. [Google Scholar] [CrossRef]
  33. Posener, D.W.; Strandberg, M.W.P. Centrifugal distortion in asymmetric top molecules. III. H2O, D2O, and HDO. Phys. Rev. 1954, 95, 374–384. [Google Scholar] [CrossRef]
  34. Weisbaum, S.; Beers, Y.; Herrmann, G. Low-frequency rotational spectrum of HDO. J. Chem. Phys. 1955, 23, 1601–1605. [Google Scholar] [CrossRef]
  35. Erlandson, G.; Cox, J. Millimeter-wave lines of heavy water. J. Chem. Phys. 1956, 25, 778–779. [Google Scholar] [CrossRef]
  36. Posener, D.W. Hyperfine structure in the microwave spectrum of water. Austr. J. Phys. 1957, 10, 276–285. [Google Scholar] [CrossRef]
  37. Treacy, E.B.; Beers, Y. Hyperfine structure of the rotational spectrum of HDO. J. Chem. Phys. 1962, 36, 1473–1480. [Google Scholar] [CrossRef]
  38. Verhoeven, J.; Bluyssen, H.; Dymanus, A. Hyperfine structure of HDO and D2O by beam maser spectroscopy. Phys. Lett. 1968, A26, 424–425. [Google Scholar] [CrossRef]
  39. Steenbeckeliers, G.; Bellet, J. Spectre de rotation de l’eau lourde. Comp. Rend. Acad. Sci. 1970, B270, 1039–1041. [Google Scholar]
  40. Bellet, J.; Steenbeckeliers, G. Calcul des constantes rotationnelles des molecules H2O, HDO et D2O dans leurs etats fondamentaux de vibration. Comp. Rend. Acad. Sci. 1970, B271, 1208–1211. [Google Scholar]
  41. De Lucia, F.C.; Cook, R.L.; Helminger, P.; Gordy, W. Millimeter and submillimeter wave rotational spectrum and centrifugal distortion effects of HDO. J. Chem. Phys. 1971, 55, 5334–5339. [Google Scholar] [CrossRef]
  42. Lafferty, W.; Bellet, J.; Steenbeckeliers, G. Spectre microonde des transitions de faible intensite de la molecule HDO. Etude de la molecule dans l’etat vibrationnel excite2. Comp. Rend. Acad. Sci. 1971, B273, 388. [Google Scholar]
  43. Messer, J.K.; De Lucia, F.C.; Helminger, P. Submillimeter spectroscopy of the major isotopes of water. J. Mol. Spectrosc. 1984, 105, 139–155. [Google Scholar] [CrossRef]
  44. Baskakov, O.I.; Alekseev, V.A.; Alekseev, E.A.; Polevoi, B.I. New submillimeter rotational lines of water and its isotopes. Opt. Spectrosc. 1987, 63, 1016–1018. [Google Scholar]
  45. Goyette, T.M.; Ferguson, D.W.; De Lucia, F.C.; Dutta, J.M.; Jones, C.R. The pressure broadening of HDO by O2, N2, H2, and He between 100 and 600 K. J. Mol. Spectrosc. 1993, 162, 366–374. [Google Scholar] [CrossRef]
  46. Papineau, N.; Camy-Peyret, C.; Flaud, J.M.; Guelachvili, G. The 2ν2 and ν1 bands of HD16O. J. Mol. Spectrosc. 1982, 92, 451–468. [Google Scholar] [CrossRef]
  47. Toth, R.A.; Gupta, V.D.; Brault, J.W. Line positions and strengths of HDO in the 2400–3300 cm−1 region. Appl. Opt. 1982, 21, 3337–3345. [Google Scholar] [CrossRef] [PubMed]
  48. Toth, R.A.; Brault, J.W. Line positions and strengths in the (001), (110), and (030) bands of HDO. Appl. Opt. 1983, 22, 908–926. [Google Scholar] [CrossRef]
  49. Guelachvili, G. Experimental Doppler-limited spectra of the ν2 bands of H216O, H217O, H218O, and HDO by Fourier-transform spectroscopy: Secondary wave-number standards between 1066 and 2296 cm−1. J. Opt. Soc. Am. 1983, 73, 137–150. [Google Scholar] [CrossRef]
  50. Flaud, J.-M.; Camy-Peyret, C.; Mahmoudi, A. The ν2 band of HD16O. Int. J. IR MMW 1986, 7, 1063–1090. [Google Scholar] [CrossRef]
  51. Rinsland, C.P.; Smith, M.A.H.; Malathy Devi, V.; Benner, D.C. Measurements of Lorentz-broadening coefficients and pressure-induced line shift coefficients in the ν2 band of HD16O. J. Mol. Spectrosc. 1991, 150, 640–646. [Google Scholar] [CrossRef]
  52. Rinsland, C.P.; Smith, M.A.H.; Malathy Devi, V.; Benner, D.C. Measurements of Lorentz-broadening coefficients and pressure-induced line-shift coefficients in the ν1 band of HD16O and the ν3 band of D216O. J. Mol. Spectrosc. 1992, 156, 507–511. [Google Scholar] [CrossRef]
  53. Toth, R.A. HD16O, HD18O, and HD17O transition frequencies and strengths in the ν2 bands. J. Mol. Spectrosc. 1993, 162, 20–40. [Google Scholar] [CrossRef]
  54. Siemsen, K.J.; Bernard, J.E.; Madej, A.A.; Marmet, L. Absolute frequency measurement of an HDO absorption line near 1480 cm−1. J. Mol. Spectrosc. 2000, 199, 144–145. [Google Scholar] [CrossRef] [PubMed]
  55. Toth, R.A. Line Lists of Water Vapor Parameters from 500- to 8000 cm−1. Available online: https://mark4sun.jpl.nasa.gov/h2o.html (accessed on 11 November 2024).
  56. Malathy Devi, V.; Benner, D.C.; Sung, K.; Crawford, T.J.; Gamache, R.R.; Renaud, C.L.; Villanueva, G.L. Line parameters for CO2– and self–broadening in the ν1 band of HD16O. J. Quant. Spectrosc. Radiat. Transf. 2017, 203, 133–157. [Google Scholar] [CrossRef]
  57. Malathy Devi, V.; Benner, D.C.; Sung, K.; Crawford, T.J.; Gamache, R.R.; Renaud, C.L.; Villanueva, G.L. Line parameters for CO2– and self–broadening in the ν3 band of HD16O. J. Quant. Spectrosc. Radiat. Transf. 2017, 203, 158–174. [Google Scholar] [CrossRef]
  58. Tashkun, S.A.; Perevalov, V.I.; Teffo, J.-L. Global fittings of the vibrational-rotational line positions of the 12C16O17O and 12C16O18O isotopic species of carbon dioxide. J. Mol. Spectrosc. 2001, 210, 137–145. [Google Scholar] [CrossRef]
  59. Tashkun, S.A.; Velichko, T.I.; Mikhailenko, S.N. Critical evaluation of measured pure-rotation and rotation-vibration line positions and an experimental dataset of energy levels of 12C16O in X1Σ+ state. J. Quant. Spectrosc. Radiat. Transf. 2010, 111, 1106–1116. [Google Scholar] [CrossRef]
  60. Tashkun, S.; Barbe, A.; Mikhailenko, S.; Starikova, E.; Tyuterev, V. Complete RITZ set of rovibrational energy levels of 16O3 deduced from experimental spectra: Critical analysis of transition frequencies in spectroscopic databases. J. Phys. Chem. Ref. 2024, accepted. [Google Scholar]
  61. Mellau, G.C.; Mikhailenko, S.N.; Tyuterev, V.G. Hot water emission spectra: Rotational energy levels of the (000) and (010) states of HD17O. J. Mol. Spectrosc. 2015, 308–309, 6–19. [Google Scholar] [CrossRef]
  62. Schwenke, D.W. Variational calculations of rovibrational energy levels and transition intensities for tetratomic molecules. J. Phys. Chem. 1996, 100, 2867–2884, Erratum in J. Phys. Chem. 1996, 100, 18884. [Google Scholar] [CrossRef]
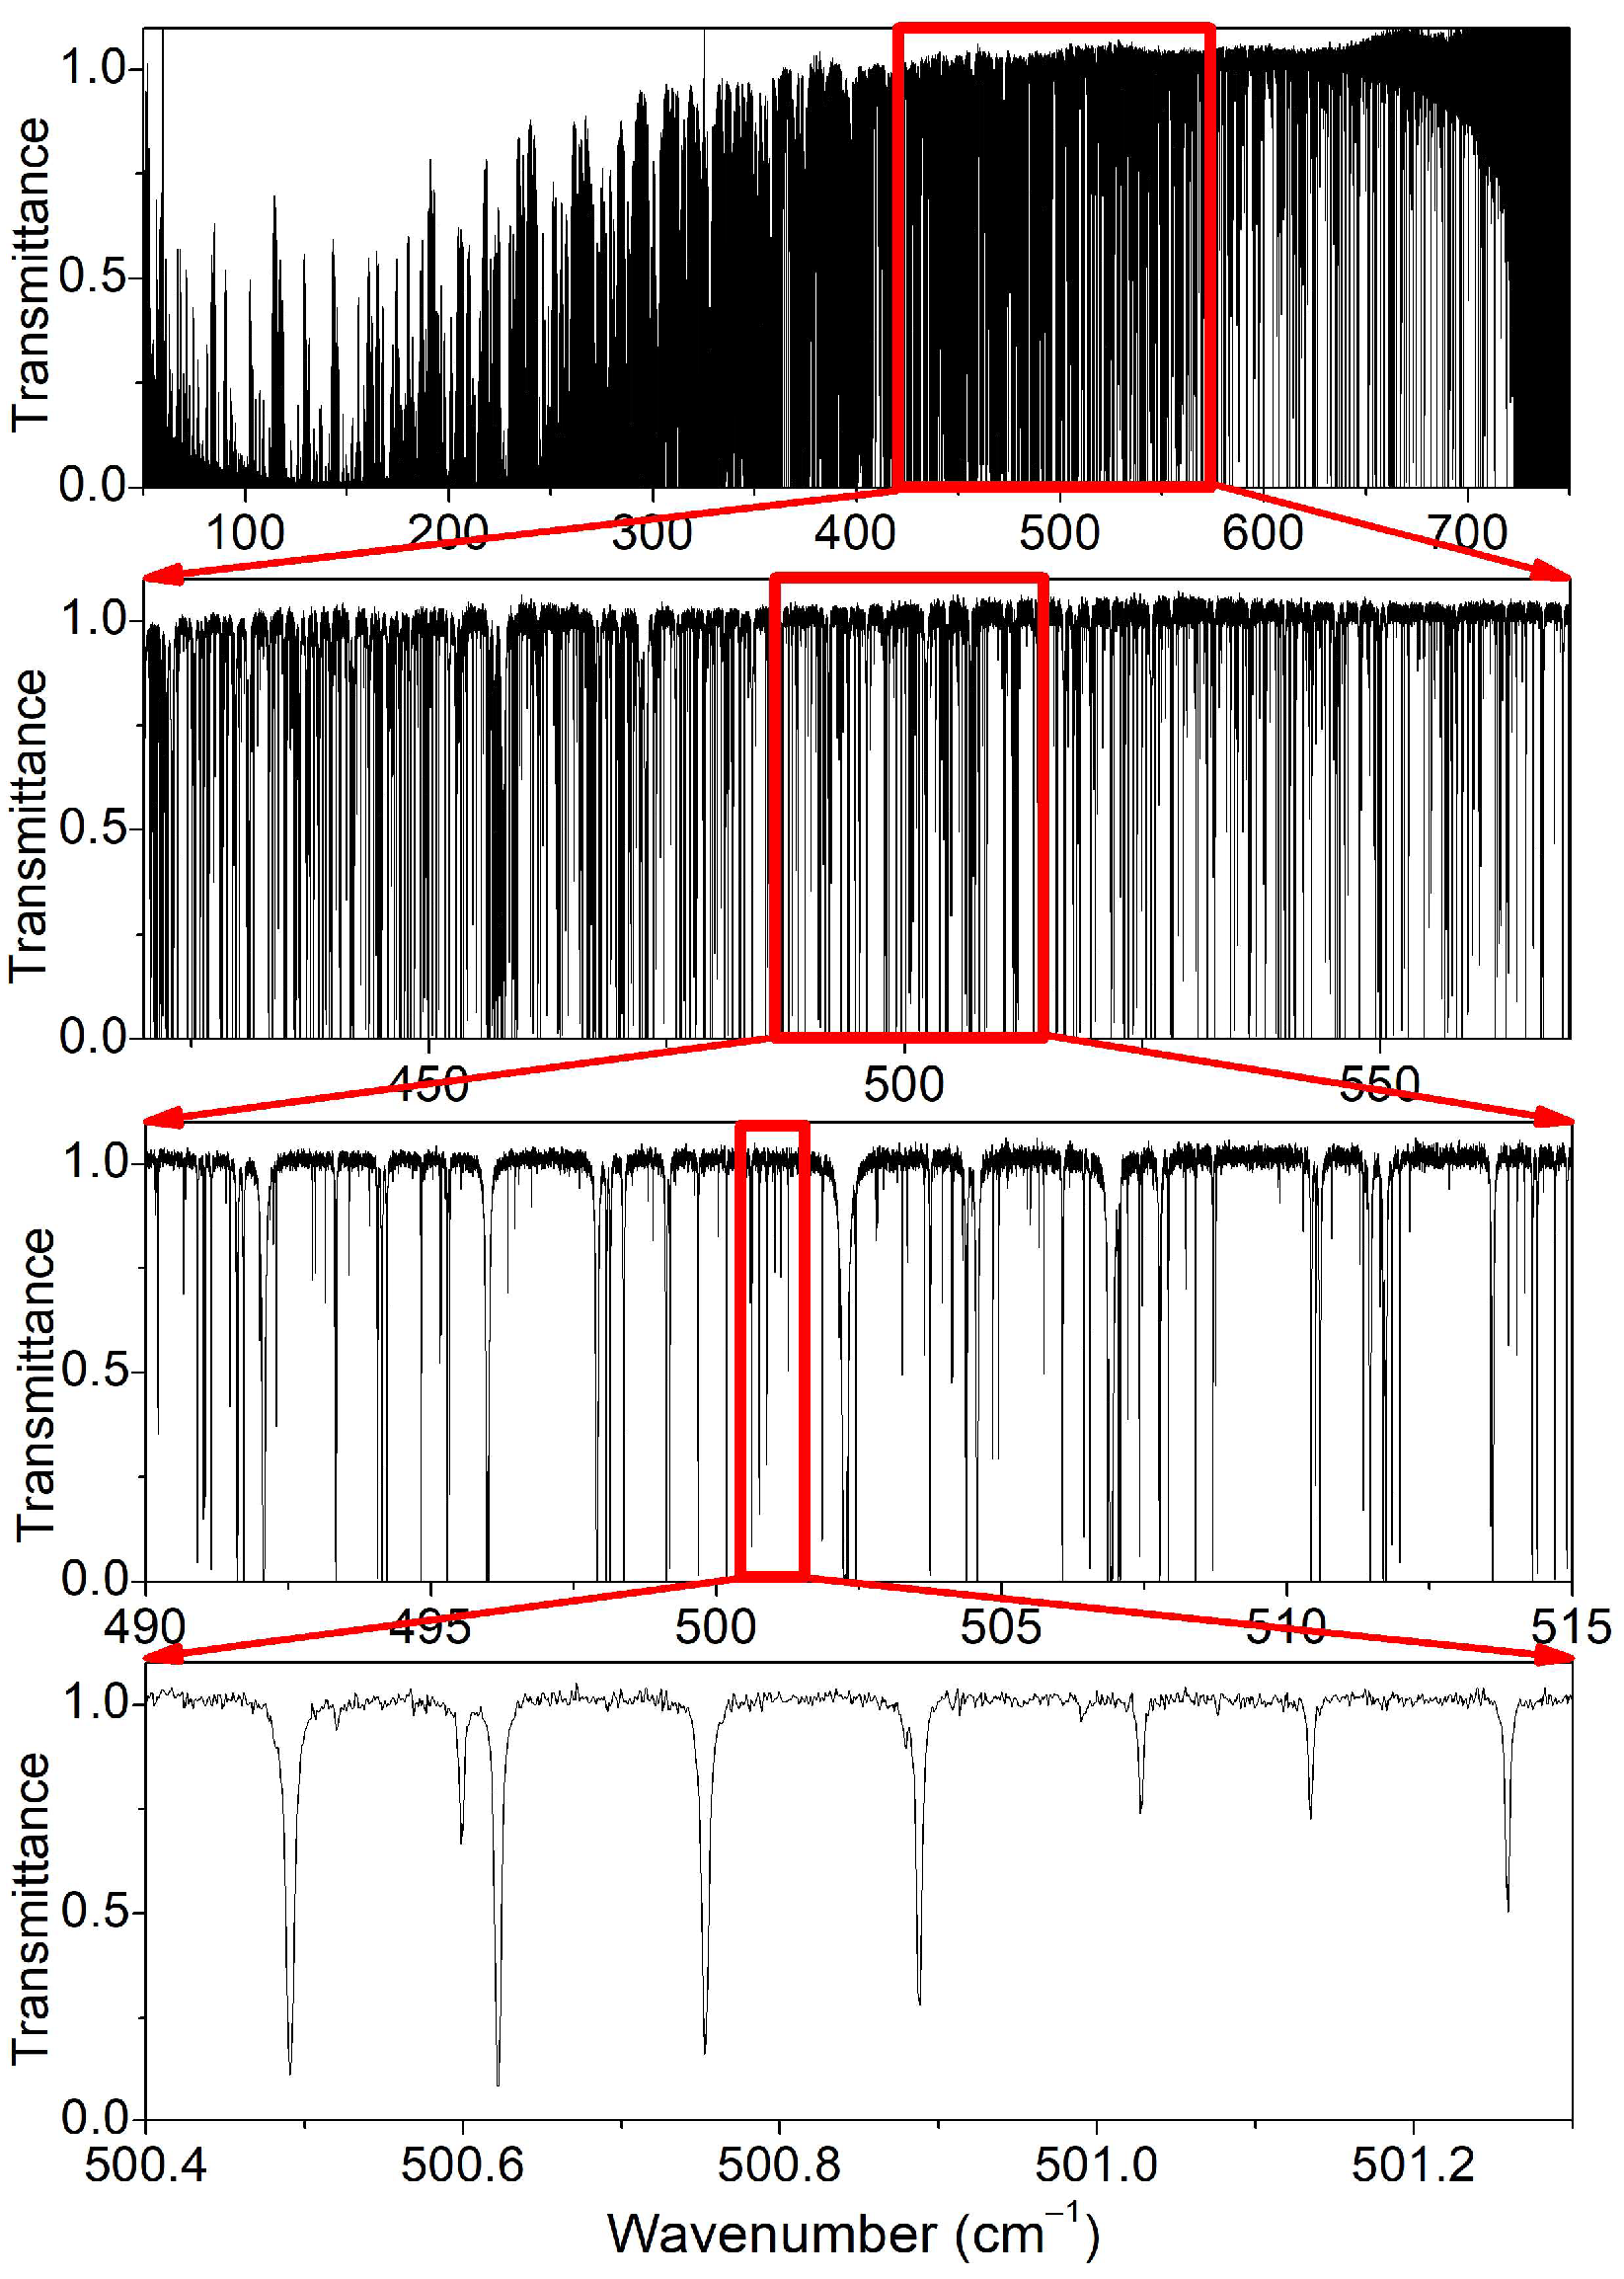
Figure 1. Successive zooms of the FTS spectrum #19 of deuterated water recorded at the SOLEIL synchrotron with a pressure of 4 mbar between 50 and 700 cm−1.
Molecules 29 05508 g001
Figure 2. Line parameter retrieval from the FTS spectra #19–21 of deuterated water near 356.4 cm−1. The line profile fit was performed in narrow spectral intervals around the lines that were not too saturated. Upper panel: Recorded spectra at about 10 µbar, 0.3 mbar, and 4 mbar (#21, #20, and #19, respectively) with corresponding best-fit spectra (blue, red, and green, respectively). Lower panel: Corresponding (obs. − calc.) residuals in %.
Molecules 29 05508 g002
Figure 3. Overview of the HD16O lines retrieved from spectra #19–21 of deuterated water between 50 and 720 cm−1. The global experimental line list was obtained by combining the lists at about 10 µbar (#21), 0.3 mbar (#20), and 4 mbar (#19) (green, orange, and yellow dots, respectively). Note that the strongest lines retrieved from the lowest pressure spectrum are measured with strongly underestimated intensities (see text). The gray dots correspond to the SP variational list [8,9].
Molecules 29 05508 g003
Figure 4. Overview of the HD16O transitions observed by absorption and by emission below 720 cm−1 [23]. The line intensities from Schwenke and Partridge [8,9] were attached to the transition wavenumbers.
Molecules 29 05508 g004
Figure 5. Differences between the HD16O line positions measured from the SOLEIL spectra in the present study and in Ref. [3] (24MiKaKoCa) (red dots) and differences between the present and HITRAN2020 values [5] (cyan dots).
Molecules 29 05508 g005
Figure 6. Comparison between the FTS spectrum (black line) of HD16O transitions to the spectra simulations (red line) based on the HITRAN2020 database in four spectral intervals showing significant differences.
Molecules 29 05508 g006
Figure 7. Histograms of the uncertainties of the present and IUPAC-TG [25] energy levels of HD16O (red and green, respectively). The blue histogram corresponds to the differences in the energy values obtained in this work (TW) and those recommended by the IUPAC-TG.
Molecules 29 05508 g007
Figure 8. Energy differences, ETWEIUPAC, of the energy levels of the ground, (010), and (001) vibrational states of HD16O determined in this work (TW) and recommended by the IUPAC-TG [25].
Molecules 29 05508 g008
Figure 9. Overview of the HD16O line list provided in the HITRAN2020 database (gray dots) [5] and of the lines with J > 20 predicted by Schwenke and Partridge (red circles) [8,9]. The HITRAN list is limited to J ≤ 20 transitions.
Molecules 29 05508 g009
Figure 10. Overview of the HD16O recommended line lists based on the variational calculations by Schwenke and Partridge [8,9]. Except those corresponding to the black stars, the transition frequencies have been empirically corrected, using either presently determined or IUPAC-TG energy levels (cyan and red symbols, respectively).
Molecules 29 05508 g010
Table 1. Experimental conditions of the room temperature FTS spectra of the various isotopic samples of water vapor recorded at the SOLEIL synchrotron. The absorption pathlength was 151.75 m.
LabelSample aMax. Pressure
(mbar)
Nb of P bRef.
#1–5Natural6.75[1]
#6–941% H217O,
27% H218O,
22% H216O
3.854[2]
#10–1450% D2O
20.5% H217O
13.5% H218O
11% H216O
8.05
#15–18D2O8.04[3]
#192150% H216O
50% D2O
4.03This work
Notes: a rough isotopic composition of the water sample injected in the cell. b number of different pressure values used for the recordings.
Table 2. Experimental conditions of the three FTS spectra of HDO under analysis.
LabelRecordingPressureResolution, cm−1Number of Scans
#19Sample≈4 mbar0.002160
BaselinePumping on the cell0.05200
#20Sample≈0.3 mbar0.001100
BaselinePumping on the cell0.05200
#21Sample≈10 µbar a0.001160
BaselinePumping on the cell0.05200
a the used pressure gauge does not allow measuring so low pressure value and the given 10 µbar value is an approximate value obtained by intensity comparison with calculations.
Table 3. Statistics of assigned water transitions.
MoleculeAbundance,
Min–Max, in %
Factor a
(%)
Number of Transitions bJmaxKamaxcRegion, cm−1
H216O24.650–24.91025.0.01035211351.434–718.657
H217O0.025–0.1400.15356161153.509–667.815
H218O0.070–0.2100.2406171153.569–702.589
HD16O49.250–49.785502443251450.277–719.550
HD17O0.045–0.3200.3701191150.134–631.440
HD18O0.170–0.4300.45851201252.187–654.961
D216O24.330–25.865252152291750.210–690.430
D217O0.025–0.2000.52538211450.425–490.178
D218O0.070–0.4700.2704231451.538–516.600
a the calculated intensity values included in the global list were obtained by multiplying the SP variational intensity of the pure species by this factor. Note that the sum of these factors is larger than 100%. b number of assigned transitions. c J is the rotational angular momentum quantum number and Ka corresponds to the projection of the angular momentum onto the a axis.
Table 4. Comparison of newly observed D2XO (X = 16, 17, and 18) absorption line positions with their empirically calculated values from Ref. [3].
PositiondFInt_SPIsoVJKaKcV″J″Ka″Kc″Pos_calc
50.21024212.129 × 10−23D216O01033001032150.21043−19
124.2384631.338 × 10−23 010771010762124.23852−6
124.25938137.880 × 10−25 0002061500020516124.259362
124.31025122.093 × 10−24 0101431201014213124.31029−4
140.98902322.371 × 10−23 00015960001587140.9888715
167.54655222.078 × 10−25 010121030101294167.546514
212.70450303.205 × 10−25 020954020845212.704491
231.5947135.643 × 10−25 020964020853231.59484−13
252.9740182.135 × 10−25 020881020770252.97418−17
261.5465562.118 × 10−25 0002702700026126261.54785−130
261.7807362.006 × 10−25 0002622500025124261.78130−57
262.52074508.240 × 10−26 000138600014311262.52090−16
265.59588101.397 × 10−25 020981020872265.59627−39
328.10894101.818 × 10−24 0101211201011101328.10904−10
365.73560121.967 × 10−25 0101511401014105365.7354119
460.35106815.608 × 10−26 0002371600022617
462.29782795.180 × 10−26 0001711700017810462.297792
544.67069221.538 × 10−24 00010101000972544.6705316
656.61455381.844 × 10−25 000131210001294656.61476−21
683.17223471.504 × 10−25 000151230001496683.17338−115
62.28061355.340 × 10−23D217O00044100043262.280592
78.6154296.384 × 10−23 00095500094678.615366
99.78119159.088 × 10−25 0001459000136899.7810118
96.21984141.755 × 10−22D218O00092700083696.22005−21
103.97704172.675 × 10−25 010661010652103.9764658
177.9747769.695 × 10−24 010660010551177.97499−22
285.06436462.464 × 10−25 01011920101083285.06453−17
312.95597212.174 × 10−25 01011570101028312.9556037
Notes: Position—measured line position (cm−1); dF—position uncertainty (10−5 cm−1); Int_SP—variational [8,9] line intensity (cm/molecule) multiplied by the maximum value of the isotopic abundances (D216O—0.25; D217O—0.002; D218O—0.005); Iso—isotopologue; VJKaKc′—vibration and rotation numbers of the upper state; V″J″Ka″Kc″—vibration and rotation numbers of the lower state; Pos_calc—calculated line position (recommended line lists) of Ref. [3]; —position difference νTWνRef. [3] (10−5 cm−1).
Table 5. General information on the HD16O transitions assigned in the three analyzed spectra between 50 and 720 cm−1.
BandNTaJmaxKa maxRegion, cm−1
(000)–(000)1778251450.27–719.55
(010)–(010)617181150.73–698.49
(020)–(020)1896145.53–310.23
(100)–(100)309896.60–350.15
Total2443251450.27–719.55
a number of assigned transitions.
Disclaimer/Publisher’s Note: The statements, opinions and data contained in all publications are solely those of the individual author(s) and contributor(s) and not of MDPI and/or the editor(s). MDPI and/or the editor(s) disclaim responsibility for any injury to people or property resulting from any ideas, methods, instructions or products referred to in the content.