Article

Overexpression of Tetrahymena Cysteine Synthetase 1 Promotes Cadmium Removal by Biosynthesizing Cadmium Sulfide Quantum Dots in Escherichia coli

1
Key Laboratory of Chemical Biology and Molecular Engineering of Ministry of Education, Institute of Biotechnology, Shanxi University, Taiyuan 030006, China
2
School of Life Science, Shanxi University, Taiyuan 030006, China
3
Shanxi Key Laboratory of Biotechnology, Taiyuan 030006, China
*
Authors to whom correspondence should be addressed.
Int. J. Mol. Sci. 2025, 26(8), 3685; https://doi.org/10.3390/ijms26083685
Submission received: 8 March 2025 / Revised: 10 April 2025 / Accepted: 11 April 2025 / Published: 13 April 2025
(This article belongs to the Section Molecular Toxicology)

Abstract

:
Heavy metal cadmium causes significant contamination in aquatic ecosystems. The biomineralization of cadmium represents a vital biological mechanism for handling cadmium stress in diverse microorganisms. To improve the biomineralization capacity of cadmium by microorganisms in aquatic environments, Tetrahymena cysteine synthetase 1 (TtCsa1) was overexpressed in E. coli. The tolerance of E. coli/pET-28a-TtCSA1 to cadmium was enhanced by expressing TtCsa1. Upon addition of cysteine, E. coli/pET-28a-TtCSA1 generated more H2S, which reacted with Cd2+ to form CdS quantum dots (QDs), resulting in a stronger fluorescence signal. The UV-visible absorption and fluorescence spectra of the culture supernatant of E. coli/pET-28a-TtCSA1 showed characteristic peaks corresponding to CdS QDs. Transmission Electron Microscopy (TEM) images confirmed that the formation of CdS QDs and their agglomeration in the E. coli cells. X-ray Diffraction Analysis (XRD) analysis further confirmed the presence of QDs and their crystalline nature. In rich medium, E. coli/pET-28a-TtCSA1 achieved removal rates of 99.5%, 98.2%, 56.5%, and 49.4%, respectively, for Cd2+ concentrations of 0.15, 0.3, 0.45, and 0.6 mM within 48 h. In simulated wastewater, E. coli/pET-28a-TtCSA1 achieved removal rates of 99.4%, 94.3%, 90.1%, and 89.8%, respectively, for Cd2+ concentrations of 0.3, 0.45, 0.6, and 0.75 mM within 12 h. These results demonstrate that overexpressing TtCsa1 in E. coli can significantly enhance its ability to biomineralize Cd2+ in rich medium and simulated wastewater, which has potential applications in bioremediation of aquatic environments contaminated with heavy metals.

1. Introduction

With the rapid development of industry and the expansion of commercial applications, environmental heavy metal pollution has become increasingly severe [1,2,3]. Among these pollutants, cadmium is a highly toxic heavy metal that has caused significant contamination in aquatic ecosystems. It disrupts the normal physiological activities of organisms, accumulates through the food chain, and poses serious threats to human health, including a potential contribution to cancer [4,5,6]. Due to the non-biodegradable nature of cadmium, its removal from water bodies is challenging once it enters these ecosystems, underscoring the urgency of developing effective removal methods. Consequently, the development of efficient strategies for mitigating cadmium pollution in the environment has garnered widespread global attention [7,8,9].
Various methods have been employed to remove cadmium from aquatic environments, including chemical precipitation, physical adsorption, and biosorption [7,10,11]. These traditional methods are effective, but often lead to high resource consumption and potential for secondary environmental pollution. In contrast, bioremediation, modulating the metabolic pathways of microorganisms, has gained significant attention due to its cost-effectiveness and environmental friendliness [12]. Consequently, extensive research has been conducted to explore more efficient biological approaches for cadmium removal. The biological removal of cadmium primarily relies on metabolic pathways inherent to microorganisms, such as biosorption, biotransformation, and biomineralization [13,14]. Notably, biomineralization produces cadmium sulfide quantum dots (CdS QDs) while removing cadmium from the environment [15,16].
Various strategies have been developed to enhance microbial biomineralization, among which cysteine is a commonly used exogenous additive [17,18]. This amino acid serves as a crucial precursor for the synthesis of hydrogen sulfide (H2S) [19,20]. The resulting H2S plays a pivotal role in mitigating heavy metal stress by forming metal sulfides in various microorganisms [21,22,23]. Under cadmium stress, deep-sea bacterium Idiomarina sp. OT37-5b produces CdS QDs on its cell surfaces. The addition of L-cysteine not only enhances cell survival but also achieves nearly 99% cadmium removal [24,25]. Similarly, the direct addition of sodium sulfide, an exogenous H2S donor, promotes the generation of more CdS QDs in Tetrahymena thermophila [7]. When Rhodopseudomonas palustris is co-stressed with cadmium and cysteine, the cells primarily depend on biomineralization to generate CdS QDs, facilitating the removal of cadmium from the aquatic environment [26]. These findings show that cysteine not only protects microorganisms from heavy metal stress but also promotes the efficient production of CdS QDs.
The metabolic pathways inherent to microorganisms are frequently limited by intracellular enzyme levels and microbial activity. To enhance the substrate utilization capacity of microorganisms, the overexpression of proteins through engineered microbes represents a viable strategy [27,28,29]. For instance, the overexpression of glutathione synthetase in yeast has been demonstrated to significantly enhance the biomineralization capacity of cadmium [30]. Similarly, transgenic tobacco that overexpressed cysteine synthase exhibited increased tolerance to heavy metals [31]. Escherichia coli exhibits strong environmental adaptability and is widely utilized for protein overexpression due to its modifications for enhanced performance [32]. The overexpression of glutathione synthetase enzymes GshA and GshB in E. coli simultaneously increases cadmium tolerance and bioaccumulation. The overexpression of cysteine desulfurase significantly increases the production of CdS QDs, which can be applied in photocatalytic dye degradation. Therefore, the construction of suitable engineered strains would be highly beneficial for advancing practical applications in cadmium removal and related fields [33].
In our previous studies, we identified a Tetrahymena cysteine synthase (TtCsa1) that utilizes cysteine as a substrate for the synthesis of H2S. TtCSA1 knockdown also decreases the intracellular synthesis of cysteine and glutathione, which consequently impairs the ability of cells to resist heavy metal stress [34]. H2S synthesis plays a critical role in enabling Tetrahymena to cope with cadmium stress by promoting the formation of CdS QDs [35]. TtCsa1 also drives the biomineralization of CdS QDs in vitro [36]. However, it has not been confirmed whether the overexpression of TtCsa1 can enhance the ability of cells to mineralize and produce CdS. Tetrahymena is not a well-established system for protein engineering and large-scale applications. To address this limitation, TtCsa1 was overexpressed in E. coli. The engineered E. coli/pET-28a-TtCSA1 significantly enhanced the cadmium tolerance. Upon the addition of cysteine, E. coli/pET-28a-TtCSA1 generated more H2S, which reacted with Cd2+ to form CdS QDs. It effectively removed cadmium contamination in LB medium and simulated wastewater. The findings offer a promising way for developing more efficient cadmium-resistant microorganisms for environmental cleanup and for understanding the biological mechanisms of heavy metal tolerance in microorganisms.

2. Results

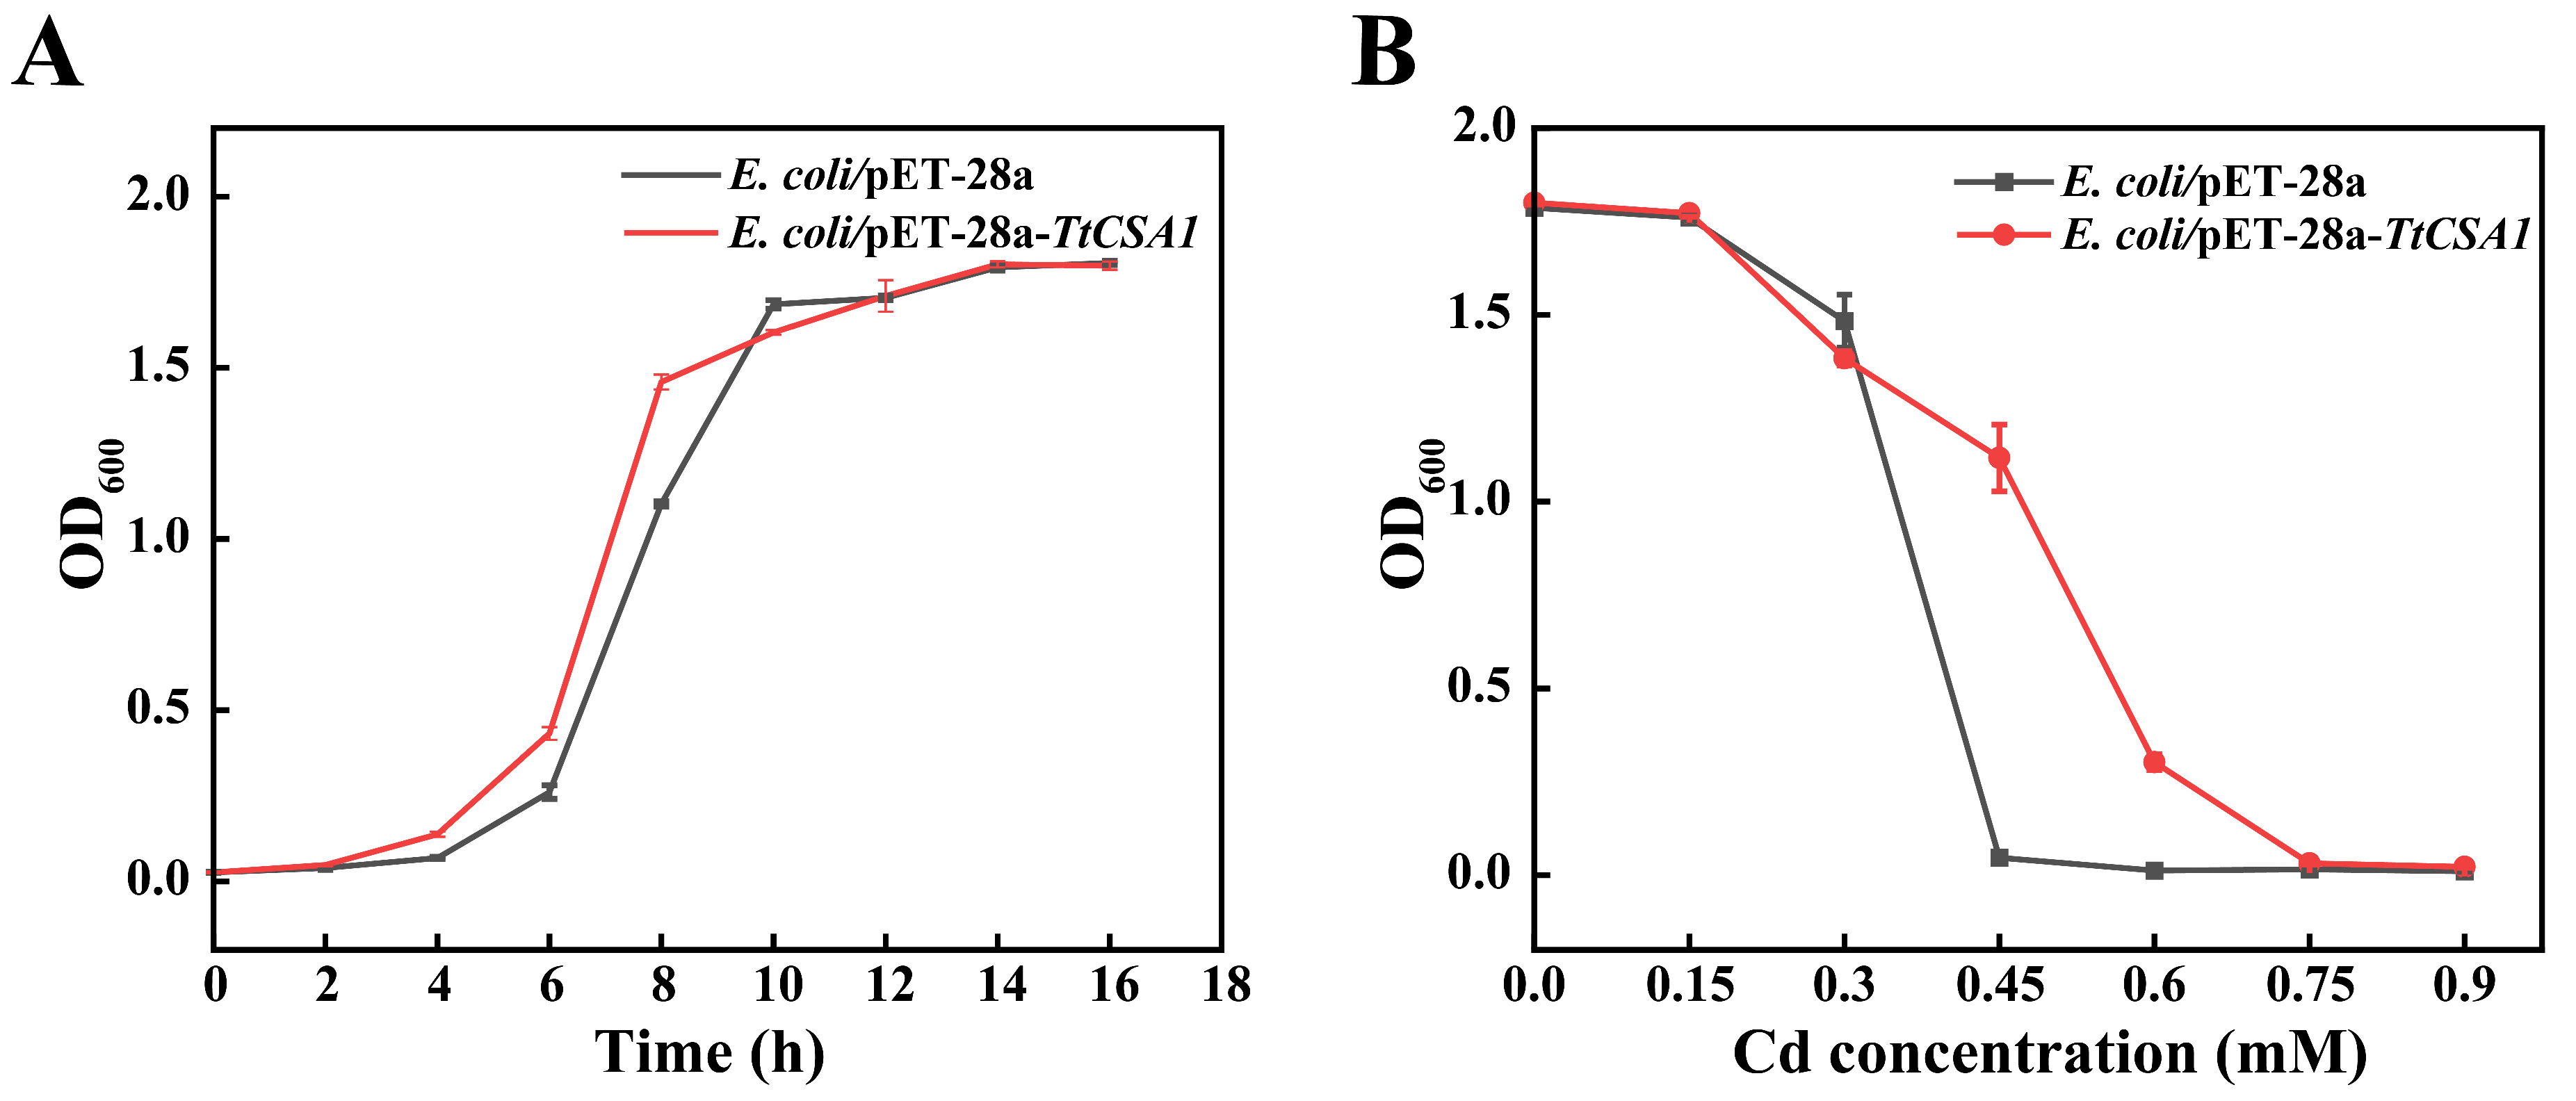
2.1. Overexpression of TtCsa1 Significantly Enhances Cadmium Resistance in E. coli

TtCsa1 exhibits enzymatic activity for H2S production in T. thermophila [34]. The expression of TtCSA1 is significantly upregulated in the presence of cadmium. TtCsa1 plays a crucial role in biomineralization-based detoxification of cadmium in T. thermophila [33]. To investigate whether the heterologous expression of TtCsa1 enhances E. coli ’s biomineralization capability, TtCsa1 was expressed in E. coli/pET-28a-TtCSA1. SDS-PAGE analysis showed the soluble expression of His-Csa1 in E. coli/pET-28a-TtCSA1 (Figure S1). There was no significant difference in the viability of E. coli/pET-28a and E. coli/pET-28a-TtCSA1 after IPTG induction (Figure 1A). After induction with IPTG, E. coli/pET-28a and E. coli/pET-28a-TtCSA1 were subjected to 24 h of cadmium ion stress at varying concentrations. The results indicated that the minimum inhibitory concentration (MIC) of E. coli/pET-28a was 0.6 mM, while the MIC for E. coli/pET-28a-TtCSA1 was 0.9 mM (Figure 1B).

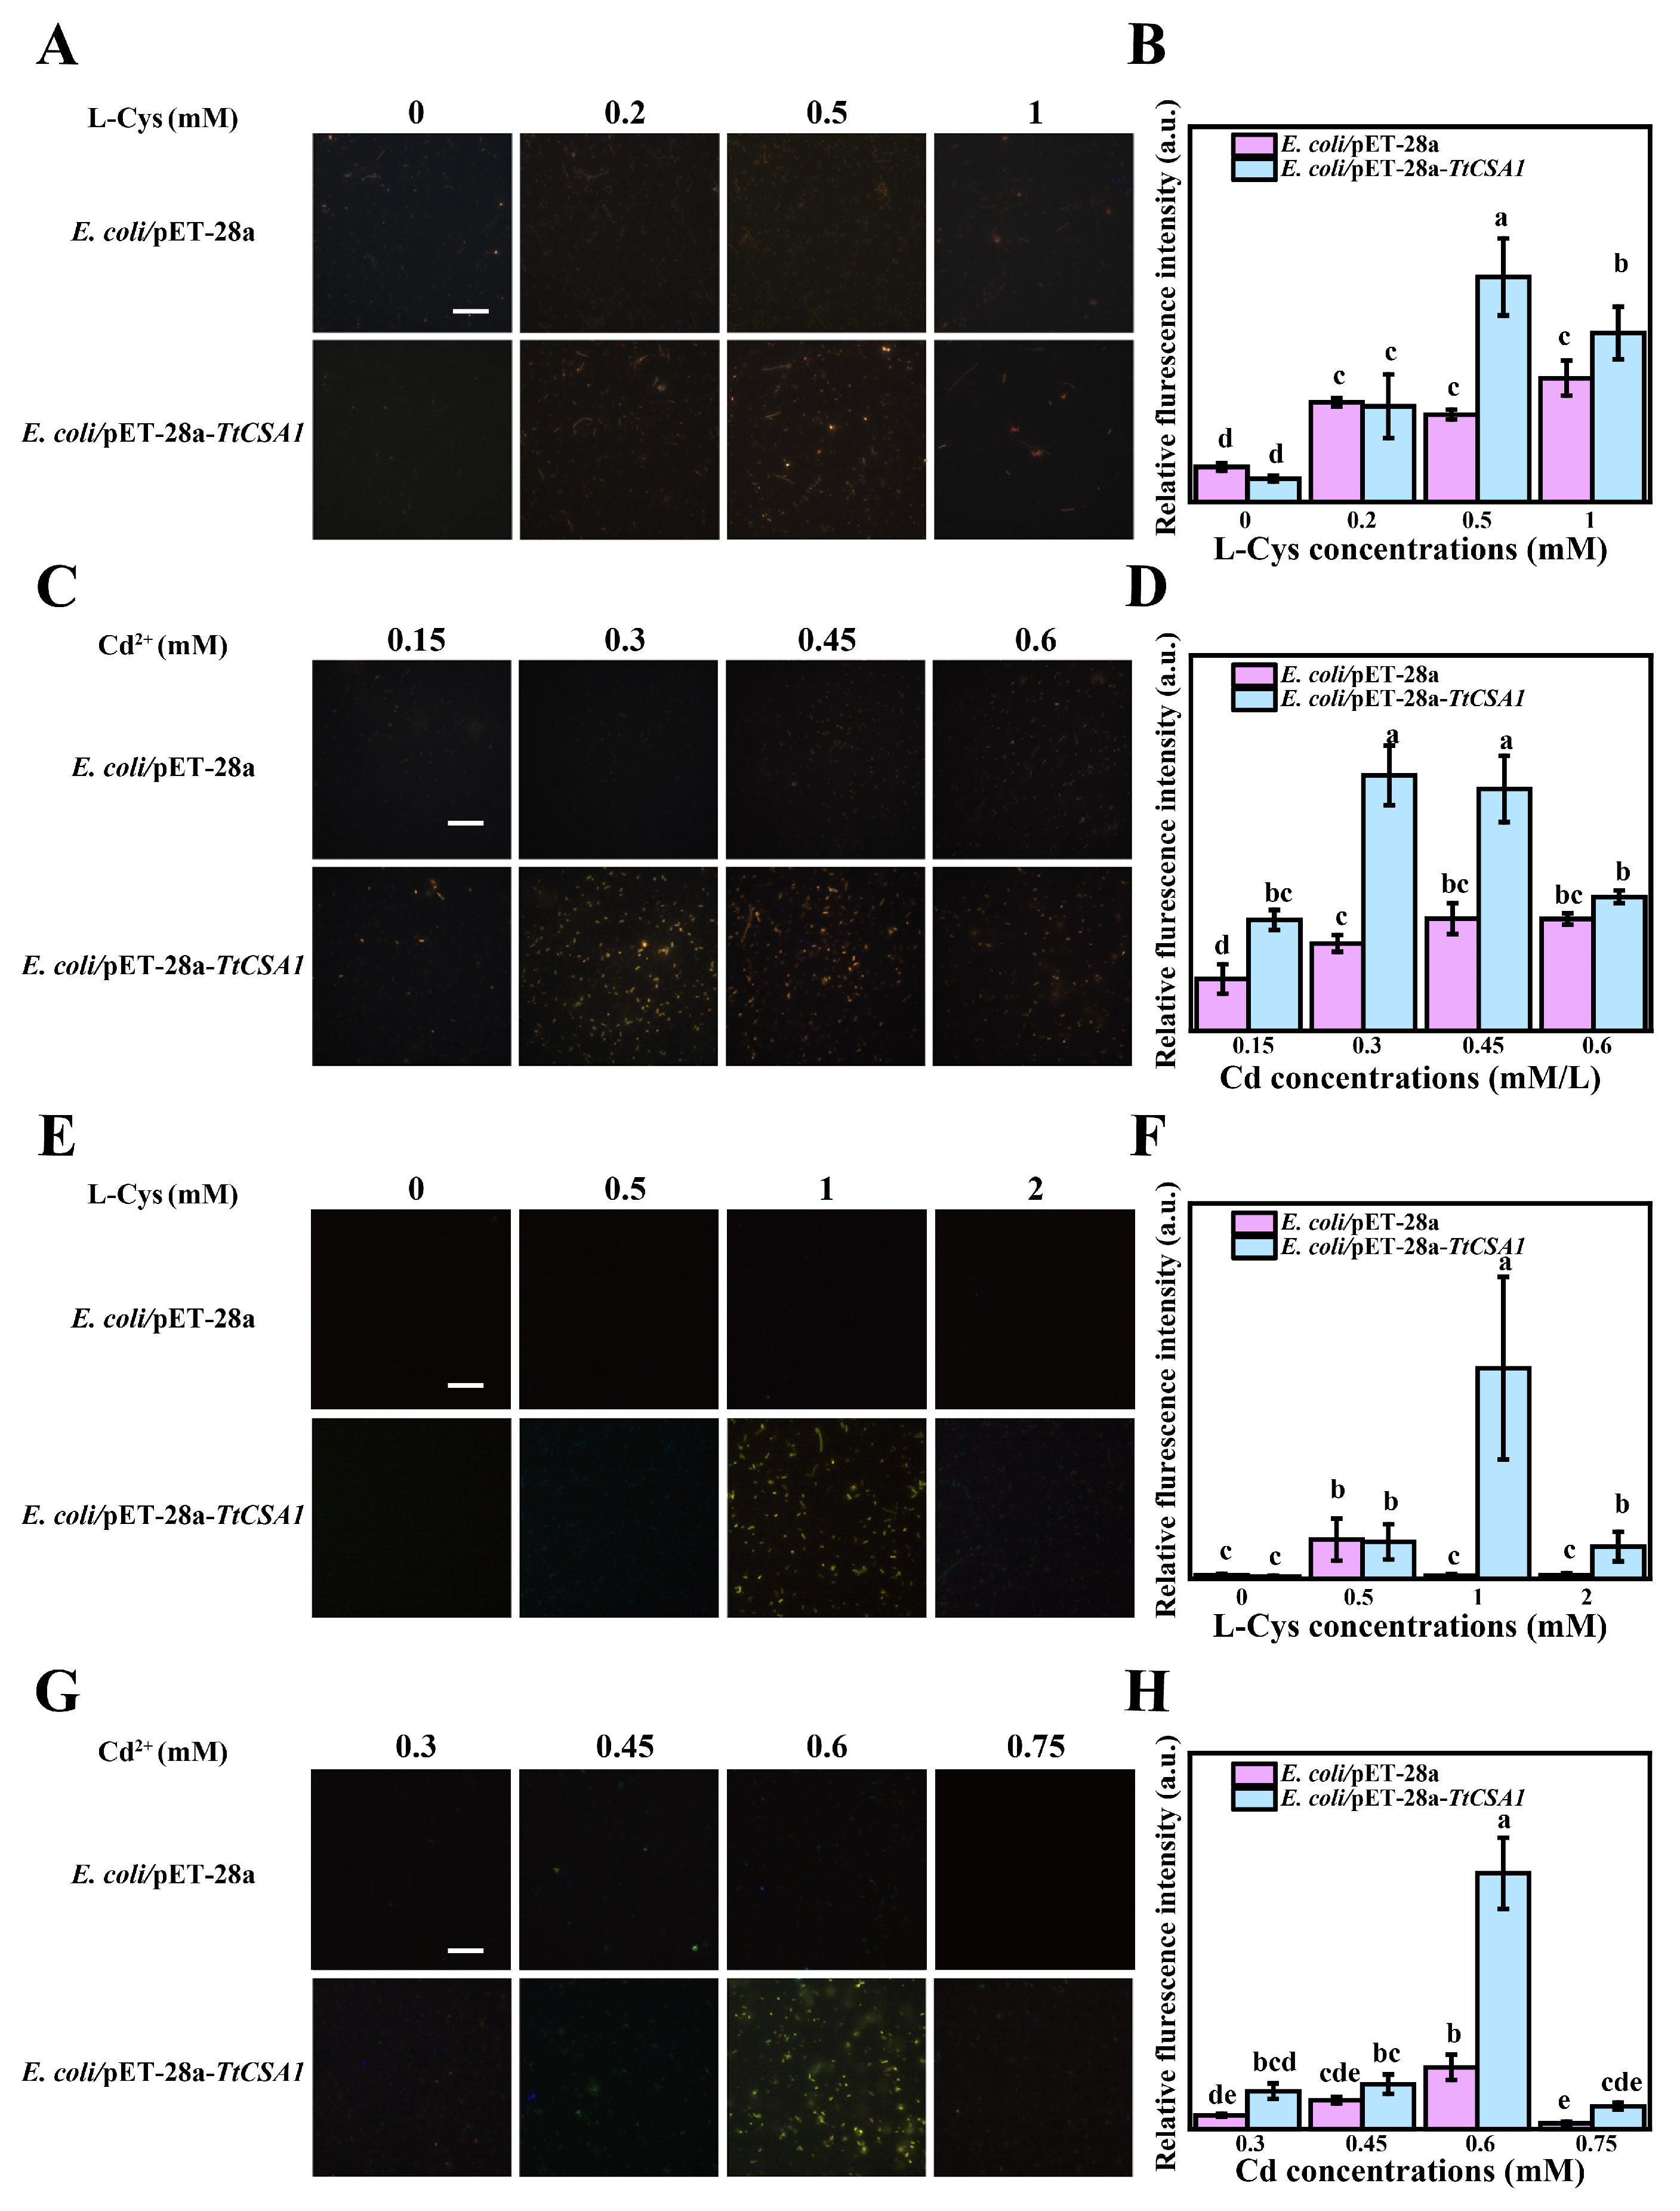
2.2. TtCsa1 and Cysteine Enhance Biomineralization of Cd in E. coli

Previous studies have demonstrated that cysteine enhances the biomineralization capacity of Tetrahymena cells [7]. Under 0.45 mM cadmium stress, E. coli/pET-28a and E. coli/pET-28a-TtCSA1 were exposed to different concentrations of L-cysteine. The fluorescence intensity of QDs produced by E. coli/pET-28a-TtCSA1 was stronger compared to that in E. coli/pET-28a. The highest QD production was observed in E. coli/pET-28a-TtCSA1 incubating with 0.5 mM L-cysteine (Figure 2A,B). Furthermore, E. coli/pET-28a-TtCSA1 formed more QDs compared to E. coli/pET-28a at different concentrations of Cd2+ (Figure 2C,D). Bright-field imaging also revealed that the biomineralization particles were distributed at the cellular poles and extensively across other regions of the cells in E. coli/pET-28a-TtCSA1 (Figure S2A). The UV-visible absorption and fluorescence spectra of the culture supernatant of E. coli/pET-28a-TtCSA1 exhibited a redshift with prolonged incubation time, indicating an increase in the size of CdS QDs. The intensity of the UV absorption and fluorescence emission peaks in E. coli/pET-28a-TtCSA1 was higher than that in E. coli/pET-28a, suggesting that TtCsa1 promotes CdS QD production (Figure 3A,B).
To evaluate the biomineralization capability of E. coli/pET-28a-TtCSA1 in wastewater, environmental water samples from the Fen River in Taiyuan were used to simulate heavy metal-contaminated wastewater. When the cells were treated with 0.3 mM cadmium ions and different concentrations of L-cysteine, the fluorescence intensity of CdS QDs produced by E. coli/pET-28a-TtCSA1 was significantly higher than that of E. coli/pET-28a (Figure 2E,F). Bright-field imaging revealed that E. coli/pET-28a-TtCSA1 produced significantly more particles compared to E. coli/pET-28a (Figure S2B). The fluorescence intensity of CdS QDs generated by E. coli/pET-28a-TtCSA1 was consistently higher than that in E. coli/pET-28a (Figure 2G,H). Furthermore, UV-visible absorption and fluorescence spectra of the culture supernatant indicated the presence of CdS peaks in the supernatant of E. coli/pET-28a-TtCSA1 (Figure 3C,D).

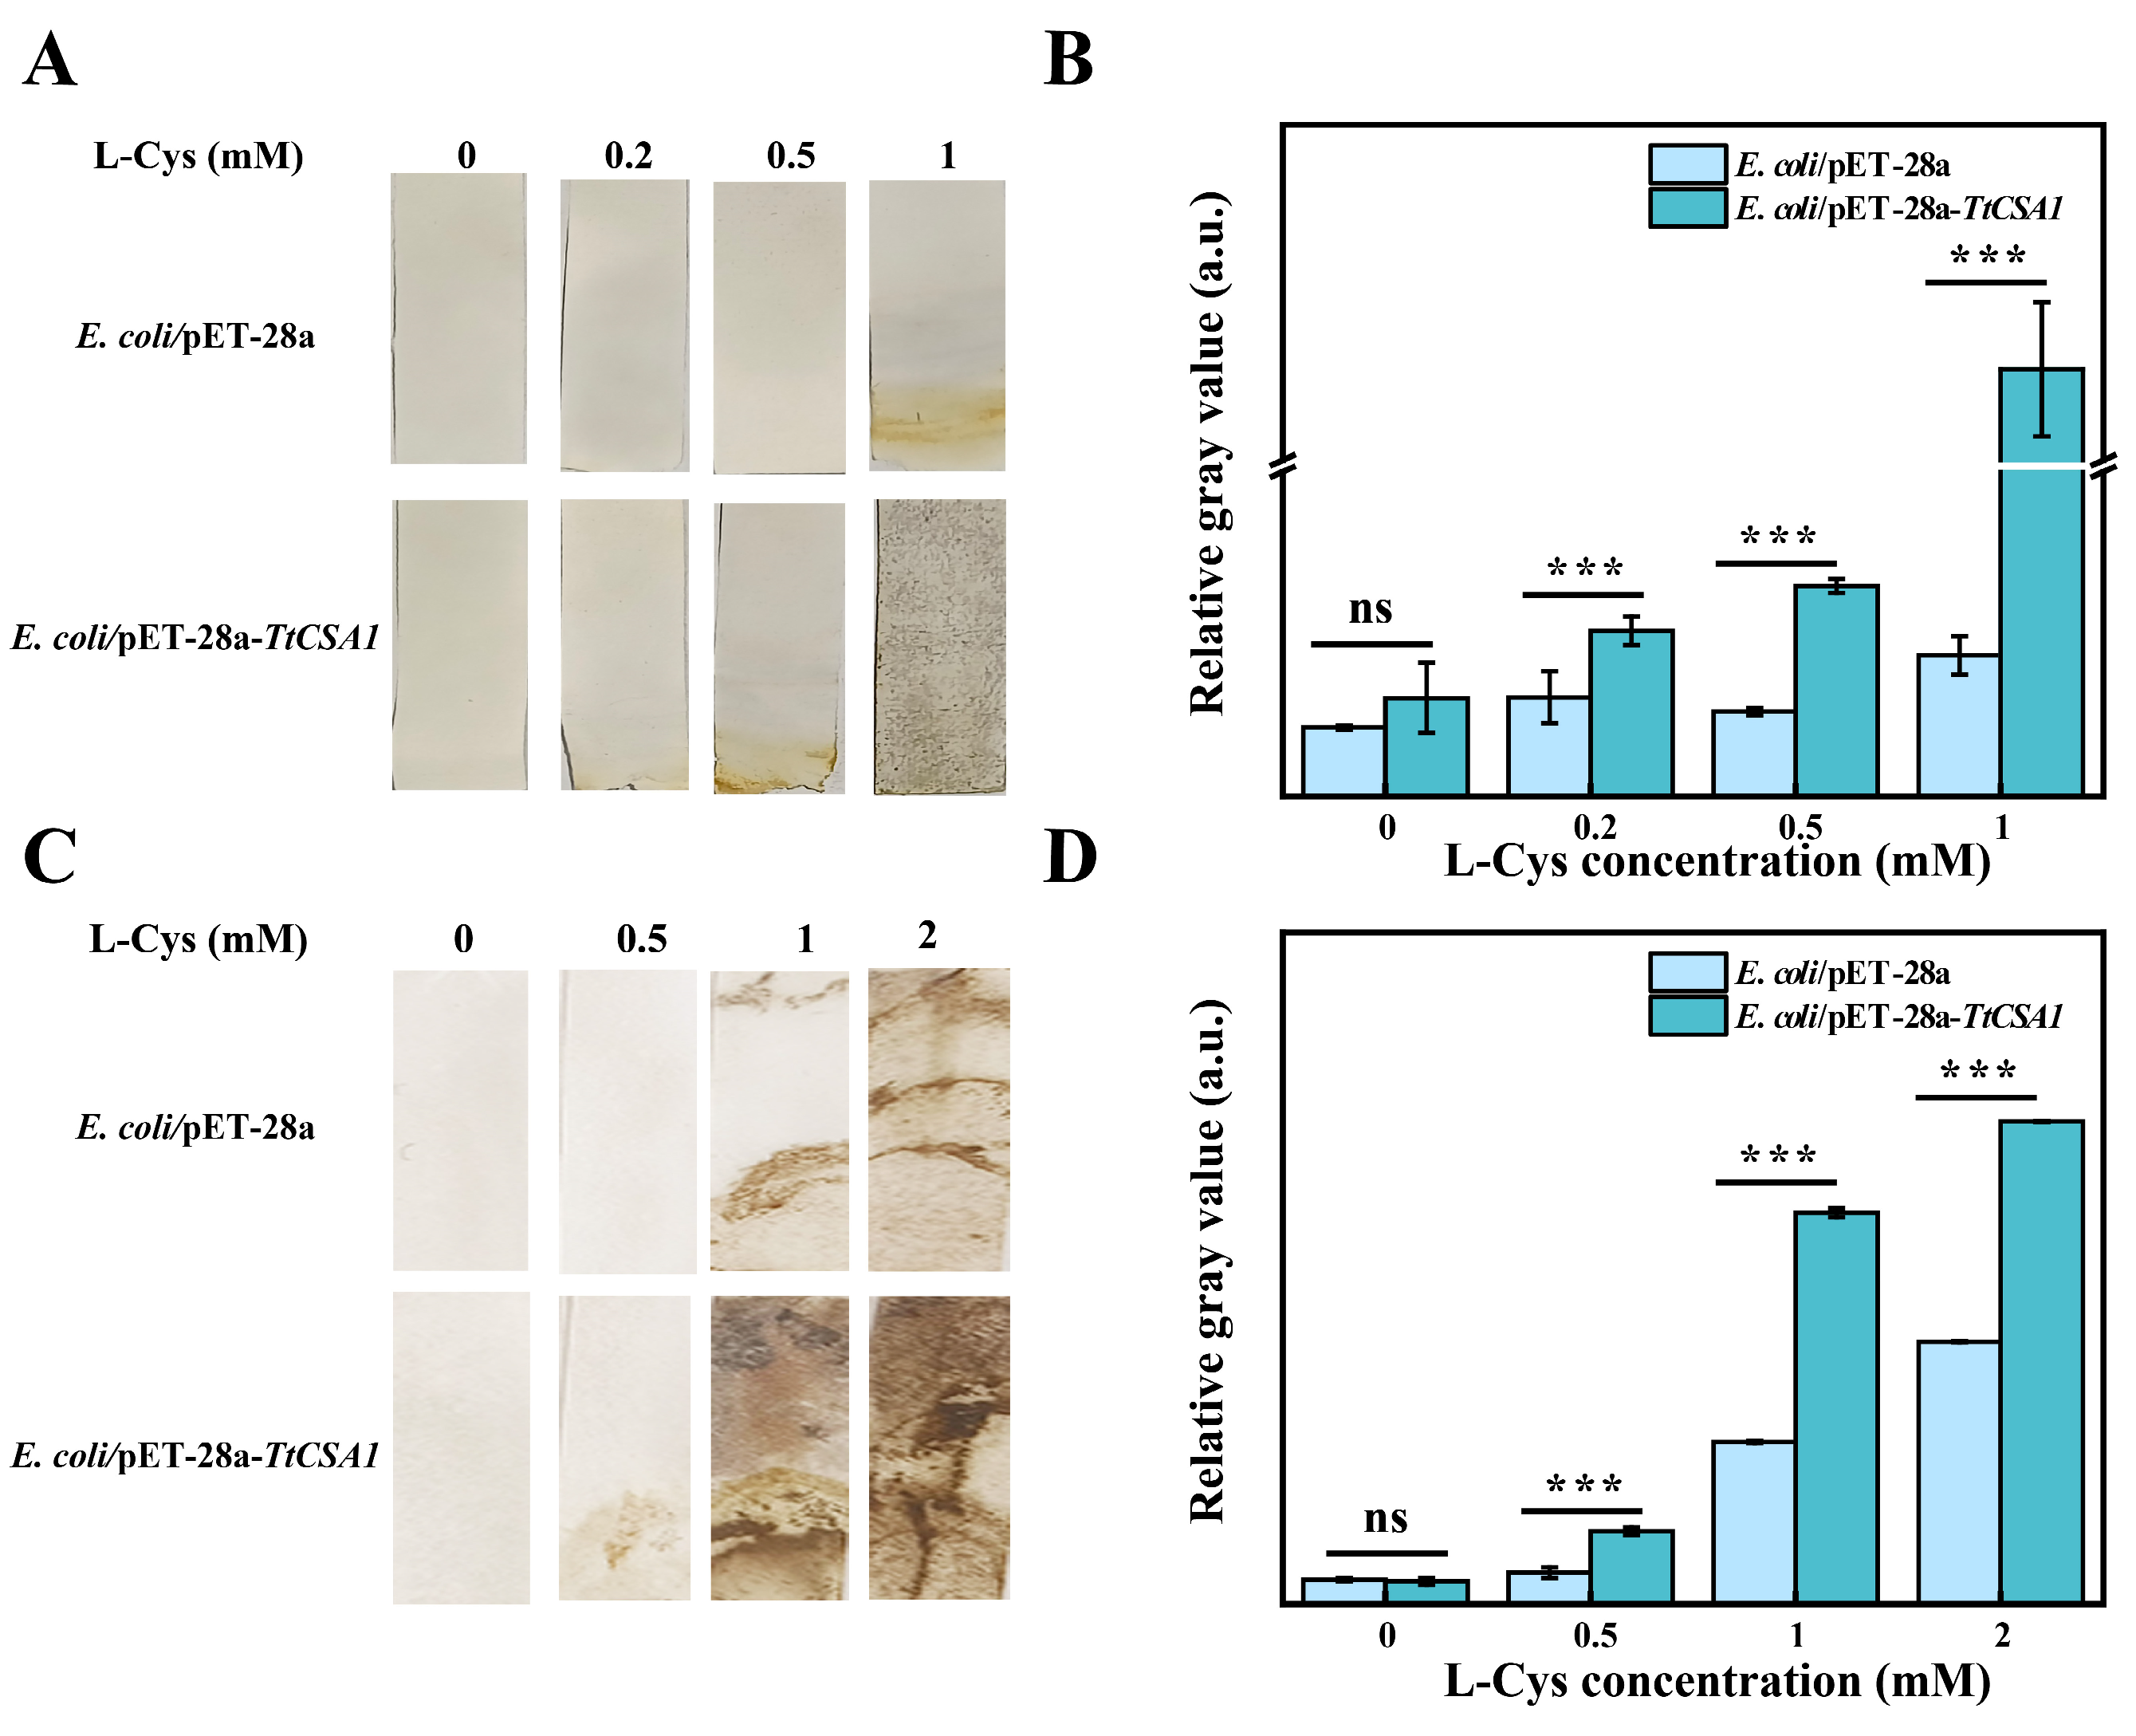
2.3. E. coli/pET-28a-TtCSA1 Produces More H2S upon the Addition of Cysteine

Cadmium can enter cells through mechanisms such as ingestion and ion channels, causing harm to the cells [37,38]. The biomineralization of CdS through H2S is an important mechanism for reducing cadmium toxicity [16]. We further investigated the production of H2S in E. coli. In the LB rich medium, E. coli/pET-28a-TtCSA1 produced more H2S than E. coli/pET-28a upon the addition of L-cysteine (Figure 4A,B). In simulated wastewater, E. coli/pET-28a-TtCSA1 also produced more H2S than E. coli/pET-28a upon the addition of L-cysteine (Figure 4C,D). When different concentrations of cadmium were added to LB containing 0.5 mM L-cysteine, a decrease in detected H2S was observed with increasing cadmium concentration (Figure S3A,B). A similar decrease in detected H2S with increasing cadmium concentration was also observed in simulated wastewater (Figure S3C,D). These results imply that more CdS QDs were formed in the E. coli/pET-28a-TtCSA1 with increasing cadmium concentrations.

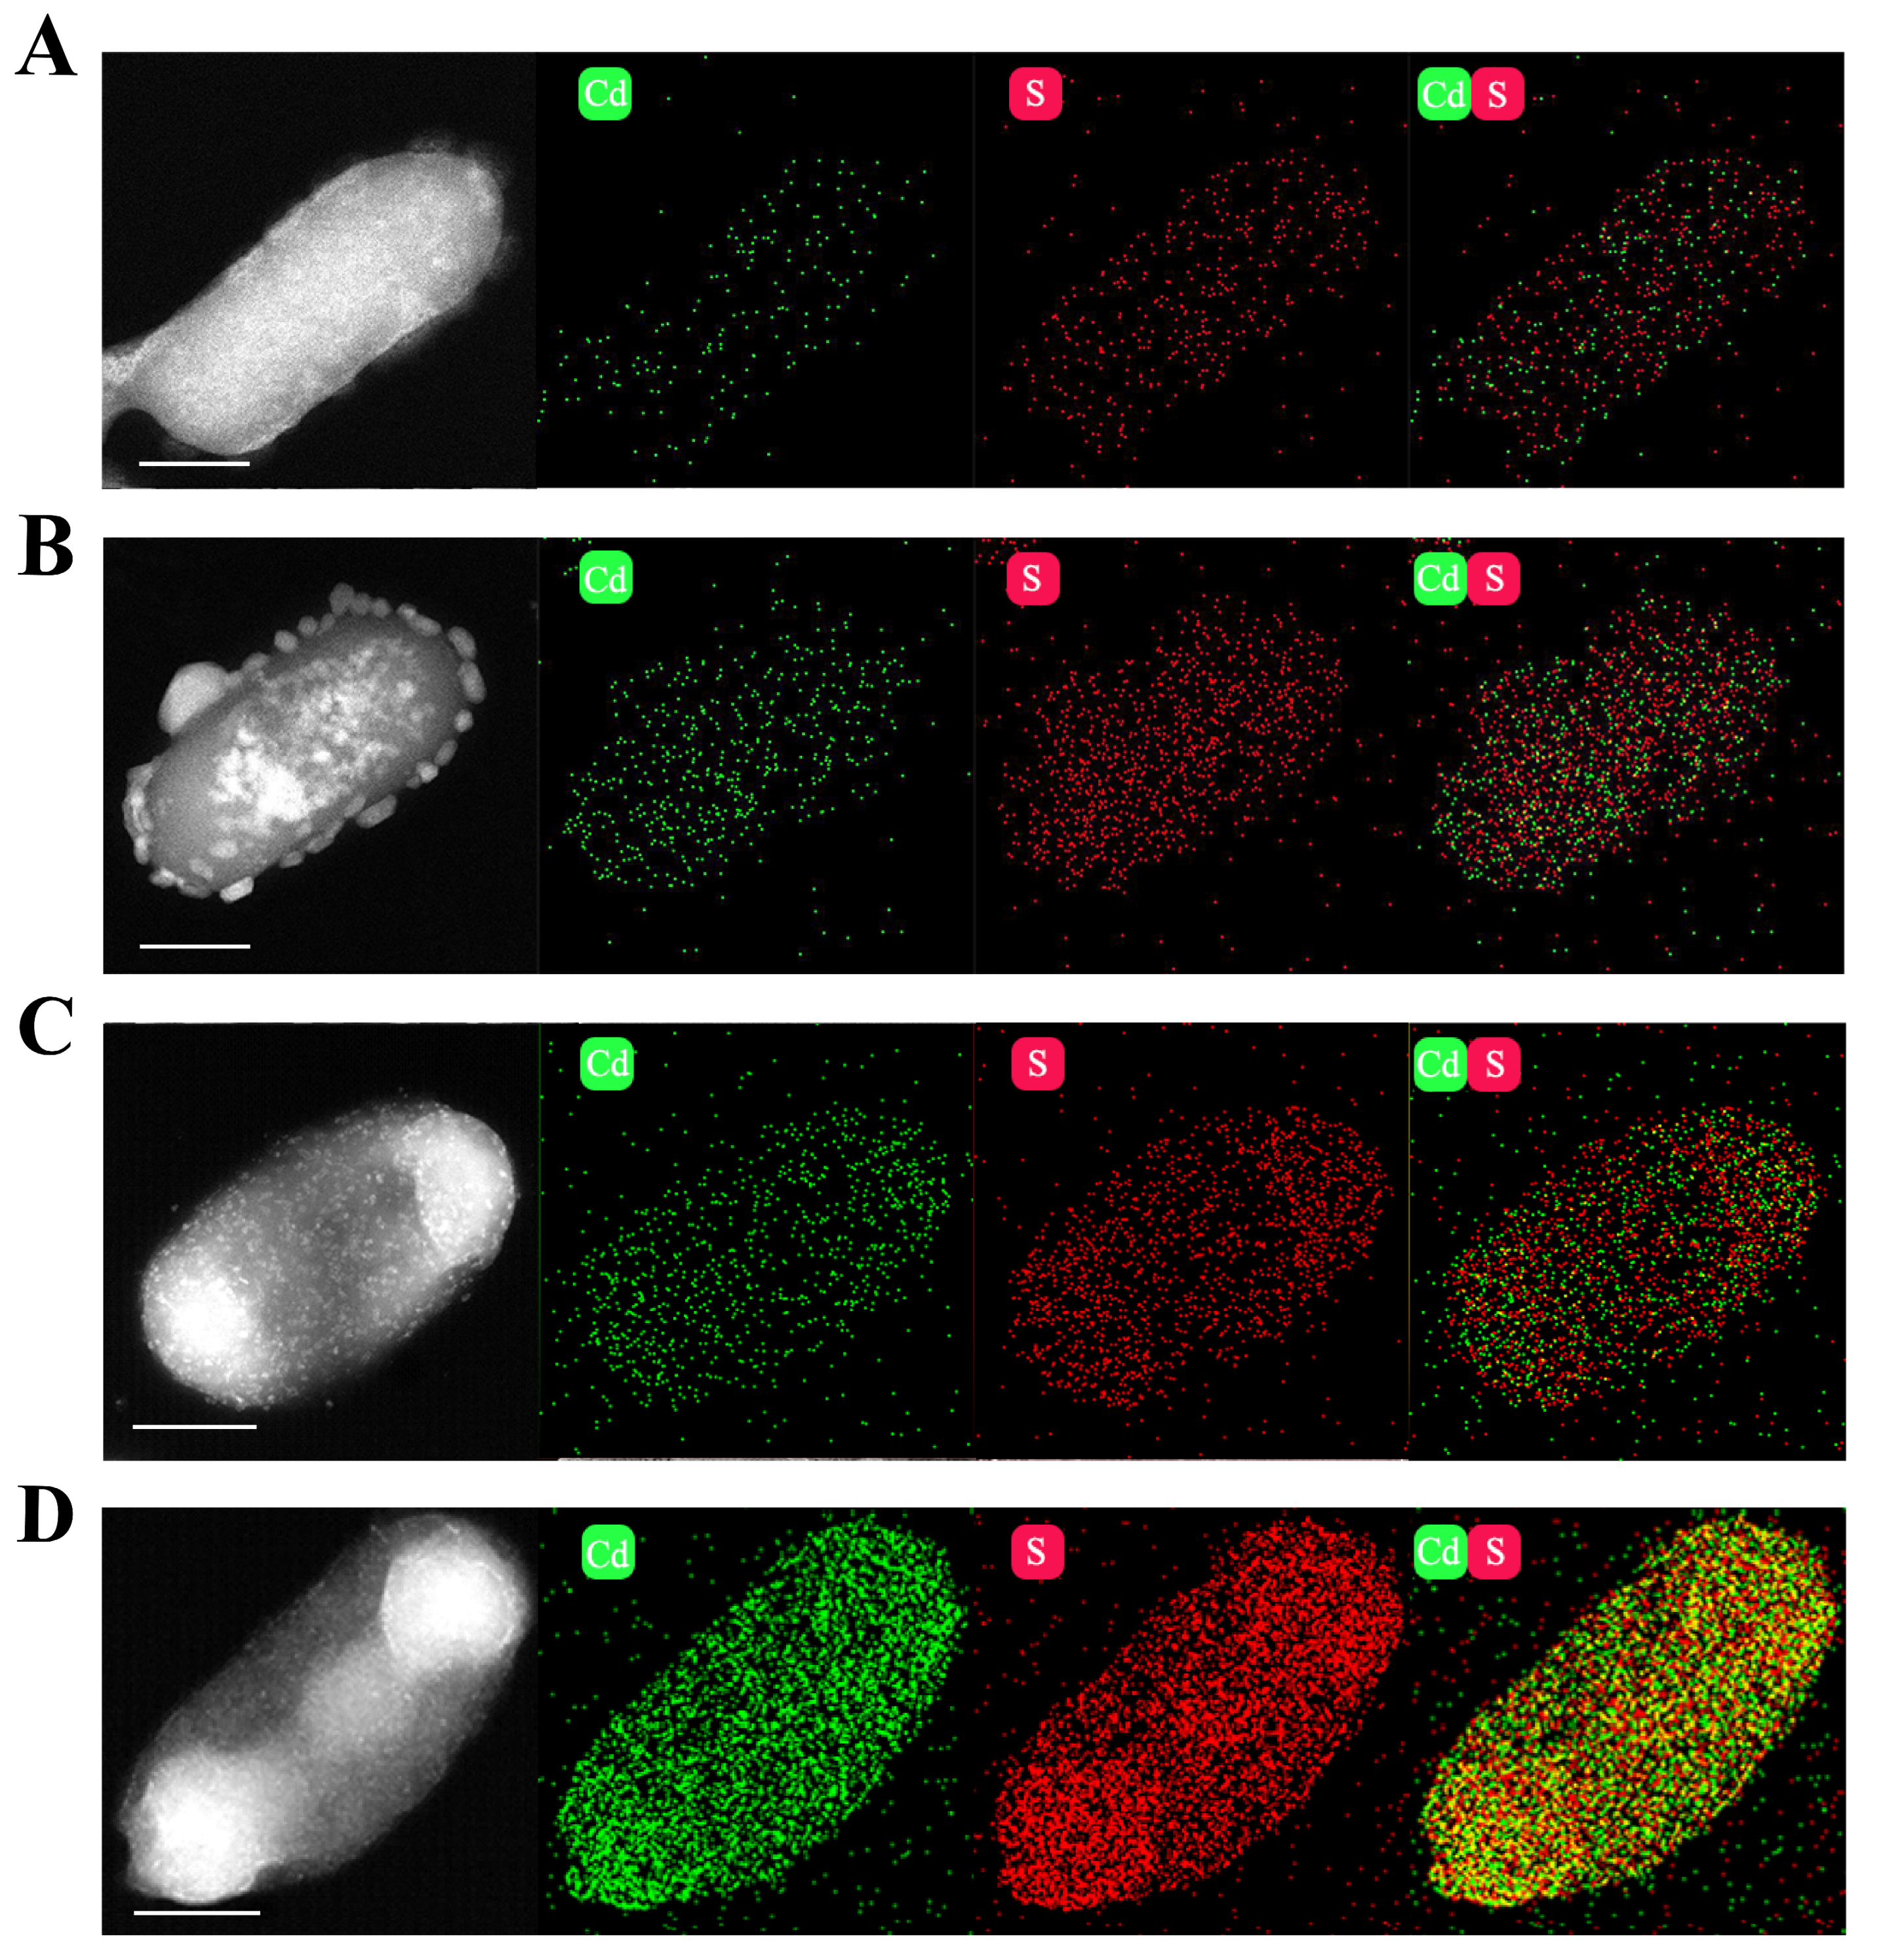
2.4. Characterization of CdS Quantum Dots in E. coli

E. coli/pET-28a and E. coli/pET-28a-TtCSA1 maintained normal cell morphology following 48 h of cadmium ion stress and cysteine incubation in both rich medium and simulated wastewater (Figure S4). High-resolution Transmission Electron Microscopy (TEM) demonstrated that E. coli/pET-28a-TtCSA1 exhibited greater attachment of CdS particles compared to E. coli/pET-28a in rich medium (Figure 5A,B). Furthermore, larger aggregates of cadmium sulfide particles were attached to the surface of E. coli/pET-28a-TtCSA1 in wastewater (Figure 5C,D). Energy Dispersive Spectroscopy (EDS) mapping also indicated that E. coli/pET-28a-TtCSA1 contained higher amounts of cadmium and sulfur elements than E. coli/pET-28a (Figure 6A–D). Interestingly, E. coli/pET-28a-TtCSA1 contained higher amounts of cadmium and sulfur elements in wastewater than in rich medium (Figure 6B,D). X-ray diffraction analysis (XRD) indicated that the cadmium sulfide produced by E. coli/pET-28a in LB and simulated wastewater did not match the standard CdS pattern, whereas the XRD pattern of the cadmium sulfide produced by E. coli/pET-28a-TtCSA1 was attributed to the sphalerite type. The diffraction peaks at 28.217° and 32.778° corresponded to the (111) and (220) crystal planes of CdS (JCPDS No. 21-0829) (Figure S5) [39].

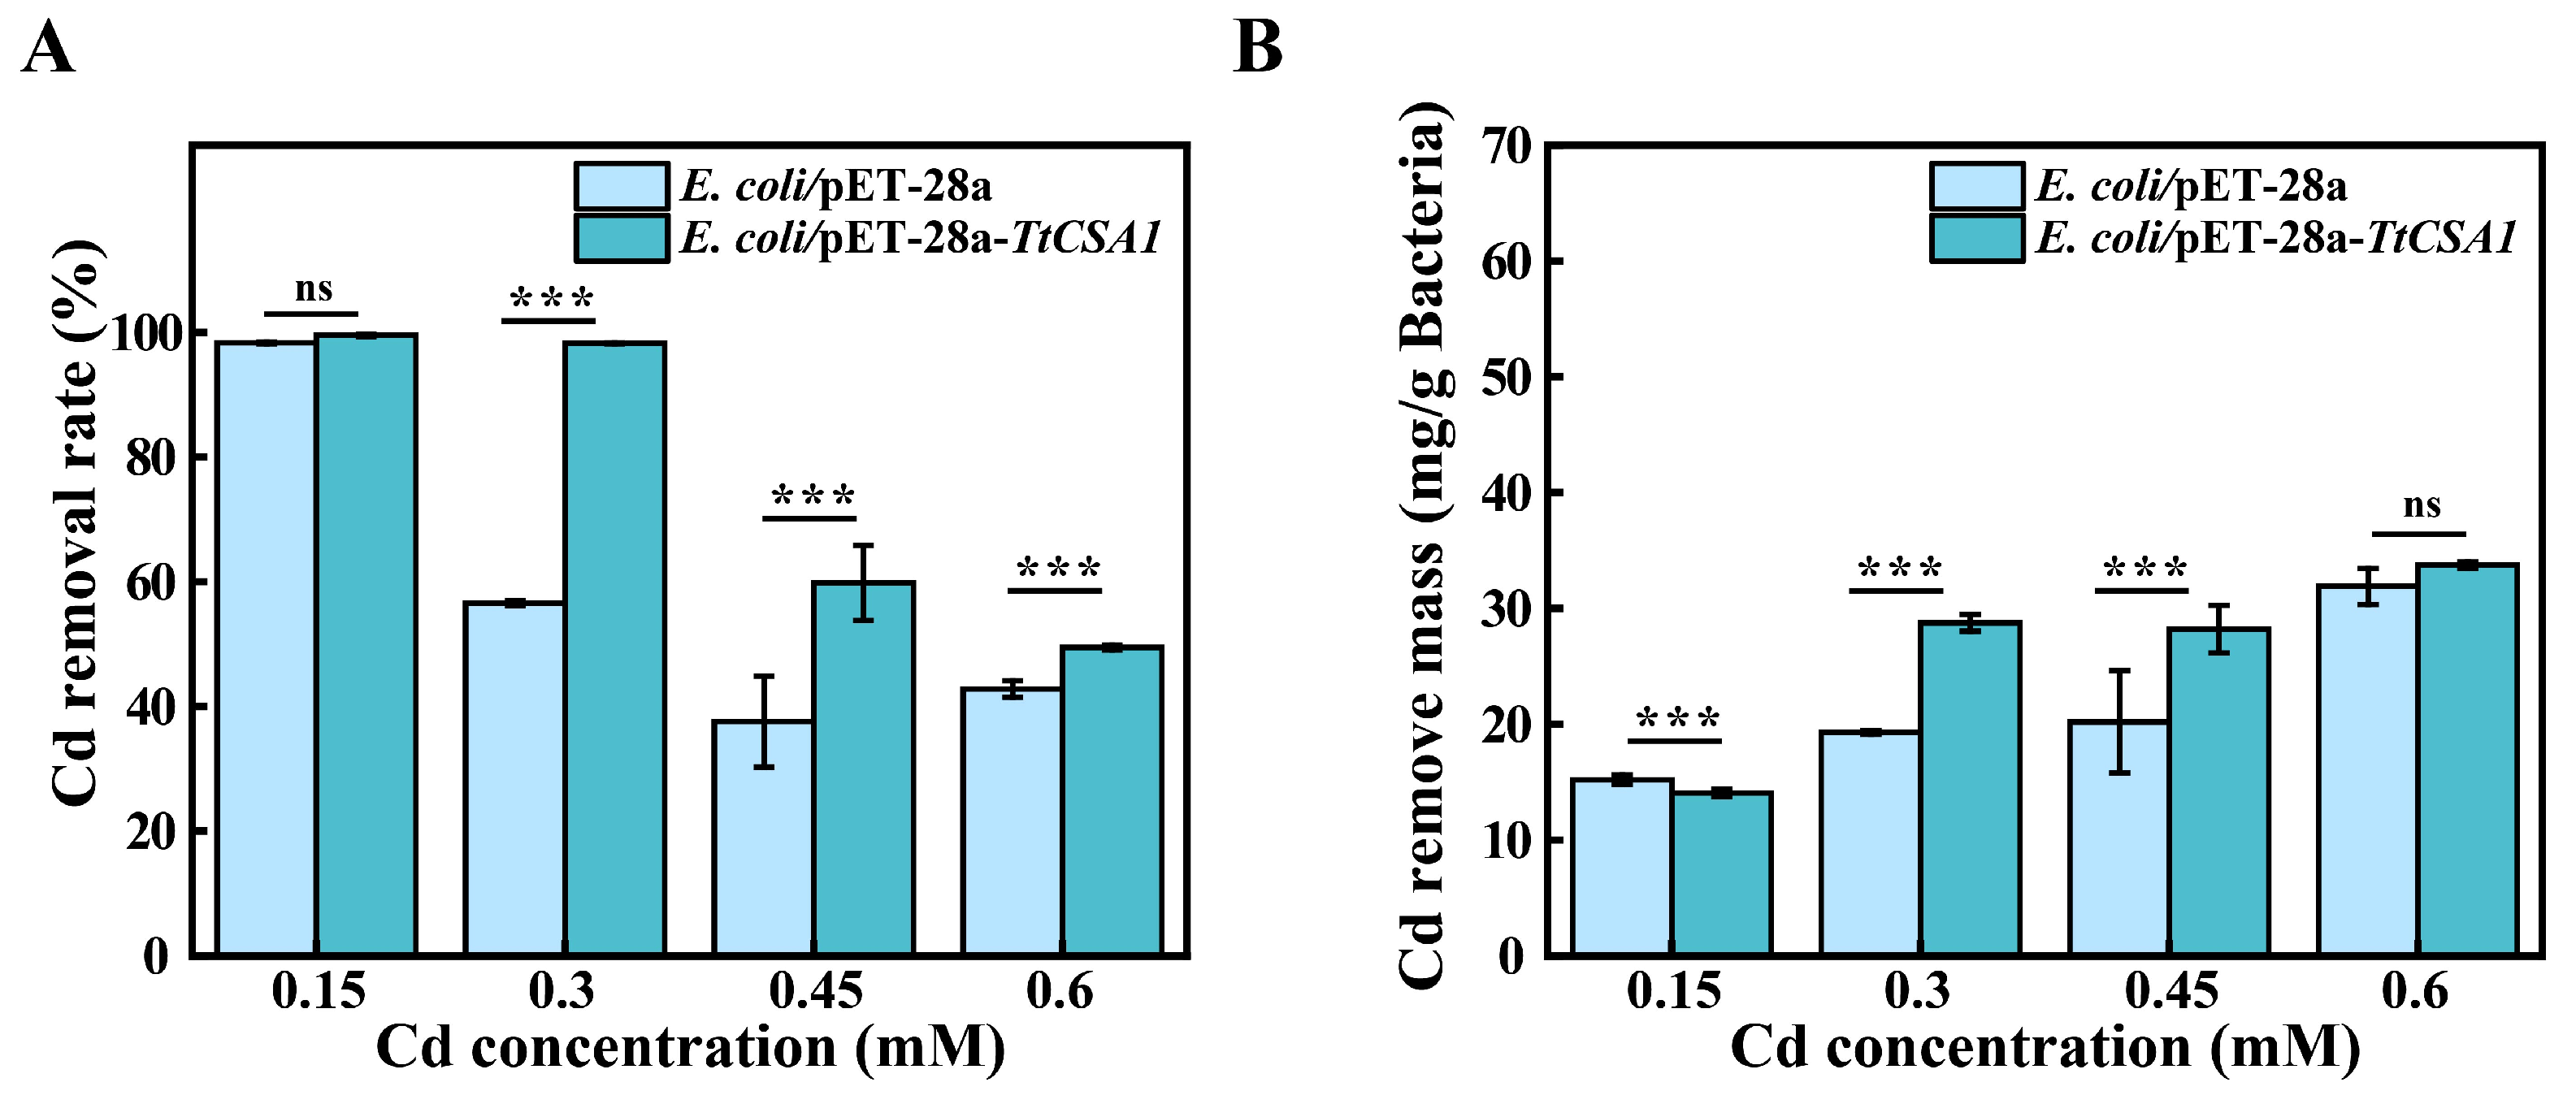
2.5. Removal of Cadmium Ions from Rich Medium

E. coli/pET-28a-TtCSA1 formed CdS QDs in a rich medium. To evaluate the removal rates of Cd2+, the cadmium content in the medium was determined using ICP-OES/MS. E. coli/pET-28a-TtCSA1 and E. coli/pET-28a achieved removal rates of 99.5% and 98.3%, respectively, for 0.15 mM Cd2+ (Figure 7A). E. coli/pET-28a-TtCSA1 achieved 98.2% and 59.8% removal rates for 0.3 mM and 0.45 mM cadmium solutions, respectively, with the removal mass per gram of dry weight bacteria being 28.7 mg and 28.2 mg, respectively. E. coli/pET-28a only achieved removal rates of 56.5% and 37.5% for 0.3 mM and 0.45 mM cadmium solutions, respectively, with the removal mass per gram of dry weight bacteria being 19.3 mg and 20.2 mg, respectively (Figure 7B). For 0.6 mM Cd2+ solutions, E. coli/pET-28a-TtCSA1 and E. coli/pET-28a removed 49.4% and 42.8%, respectively, but there was no significant difference in the removal efficiency of heavy metals per gram of dry weight bacteria, attributed to the enhanced survival of E. coli/pET-28a-TtCSA1.

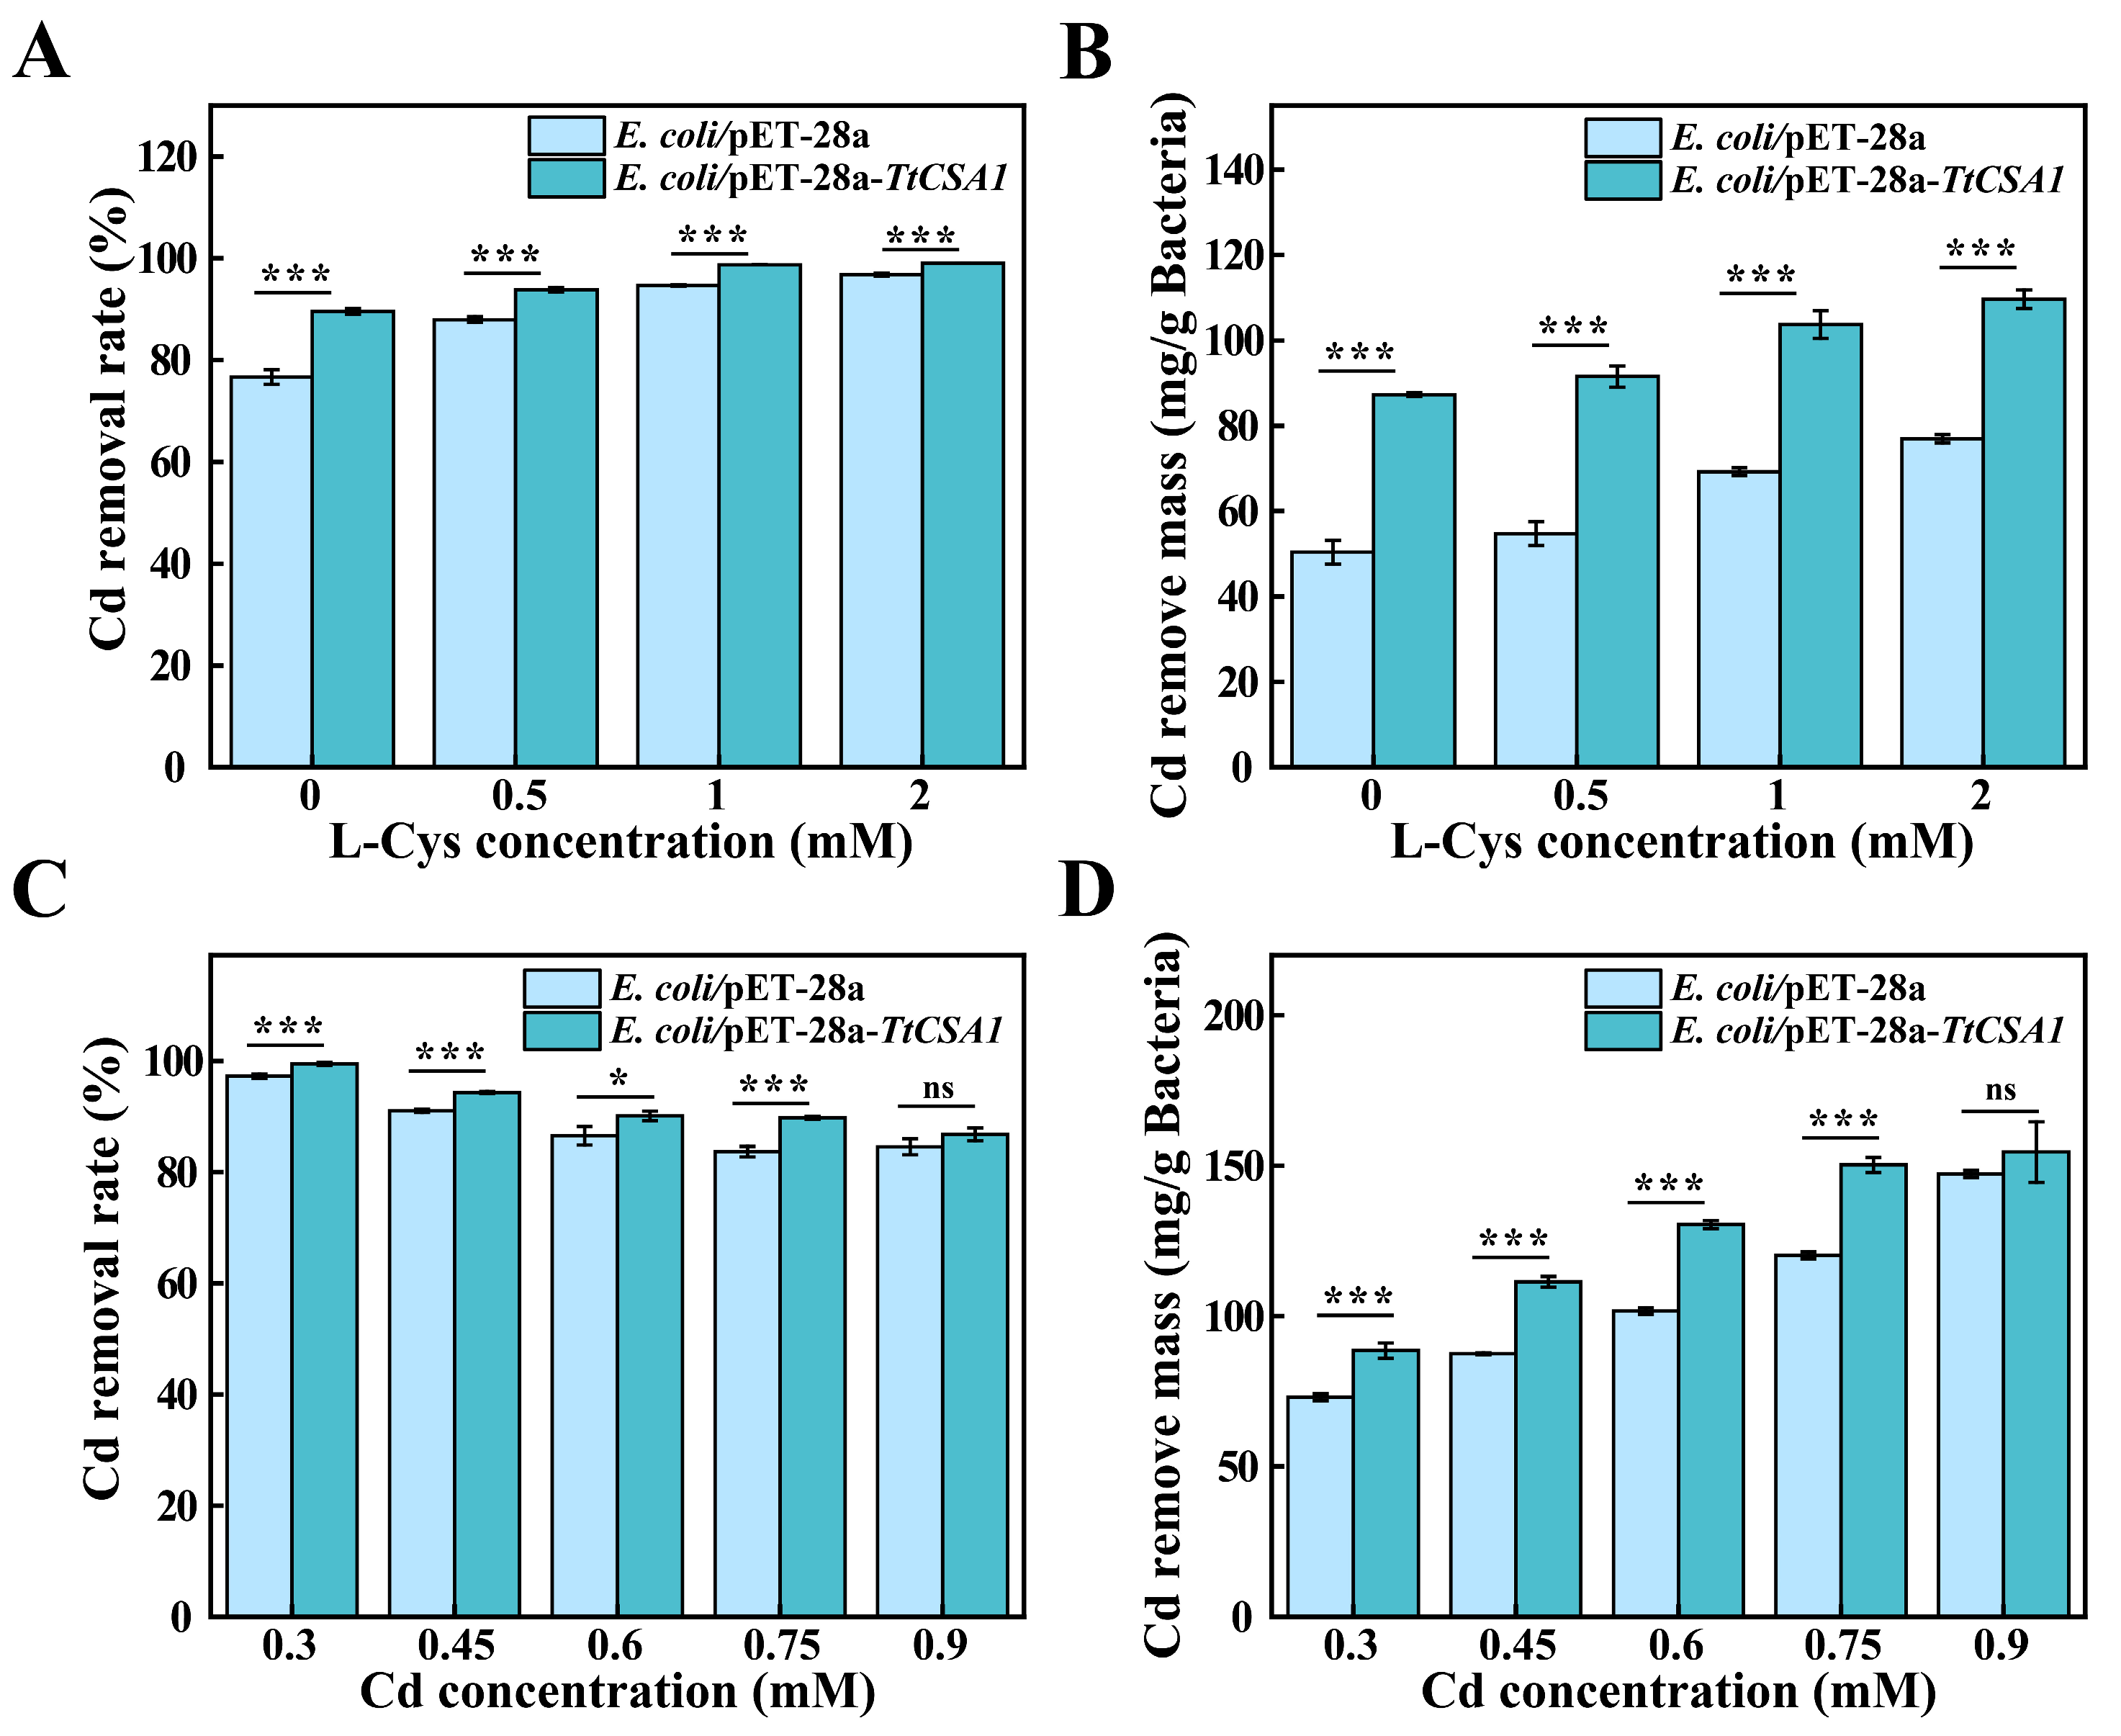
2.6. Removal of Cadmium Ions from Simulated Wastewater

The removal rates of cadmium in simulated wastewater were further assessed under different conditions. The removal rates of E. coli/pET-28a-TtCSA1 and E. coli/pET-28a for 0.3 mM cadmium were 89.5% and 76.6%, respectively (Figure 8A). E. coli/pET-28a-TtCSA1 also had a higher removal mass of Cd2+ per gram of dry weight bacteria than E. coli/pET-28a (Figure 8B) and exhibited higher proliferation capacity compared to E. coli/pET-28a (Figure S6). With the addition of 2 mM L-cysteine, the removal rates of E. coli/pET-28a-TtCSA1 and E. coli/pET-28a reached 99.0% and 96.8%, respectively. Subsequently, the removal rates of different concentrations of cadmium ions were assessed under 2 mM L-cysteine addition. The removal rates of 0.3, 0.45, 0.6, and 0.75 mM Cd2+ by E. coli/pET-28a were 97.2%, 91.0%, 86.5% and 83.7%, respectively. The removal mass of Cd2+ per gram of dry weight bacteria was 73.0 mg, 87.5 mg, 100.6 mg, and 121.7 mg, respectively. The removal rates of 0.3, 0.45, 0.6, and 0.75 mM Cd2+ by E. coli/pET-28a-TtCSA1 were 99.4%, 94.3%, 90.1%, and 89.8%, respectively. The removal mass of cadmium ions per gram dry weight was 88.6 mg, 111.4 mg, 130.4 mg and 150.3 mg, respectively. The removal rates of cadmium by E. coli/pET-28a-TtCSA1 were higher than those in E. coli/pET-28a (Figure 8C,D).

3. Discussion

The pathways associated with H2S synthesis play a crucial role in cellular responses to cadmium stress [40,41]. In Arabidopsis thaliana, overexpression of the hydrogen sulfide-related gene AtLCD enhances the organism’s ability to cope with cadmium stress [42]. E. coli overexpressing cysteine desulfurase produces increased amounts of sulfide, which facilitates cadmium precipitation [43]. Overexpression of the glutathione gene LmGSTF3 in Lemna minor significantly enhances its capacity to withstand cadmium stress [44]. Our previous studies demonstrated that reduced expression of TtCSA1 in T. thermophila significantly impacts cellular responses to cadmium stress [36]. In this study, we found that overexpression of TtCsa1 in E. coli significantly improved cellular survival in rich medium under cadmium stress (Figure 1). Furthermore, E. coli/pET-28a-TtCSA1 overexpressing TtCsa1 exhibited greater cadmium tolerance in wastewater conditions (Figure S6).
Biomineralization leading to the formation of CdS is a crucial mechanism that enables microorganisms to cope with cadmium stress [16,35]. TtCsa1 has been identified as an enzyme that utilizes cysteine to produce H2S [34]. In the presence of cysteine, cells primarily alleviate cadmium toxicity through biomineralization, resulting in the generation of CdS [26]. In this study, the addition of L-cysteine promotes CdS QD formation in E. coli/pET-28a-TtCSA1, with stronger fluorescence intensity and a faster production rate (Figure 2). This enhancement is attributed to the rapid generation of H2S (Figure 4). The CdS QDs were also produced in the extracellular aquatic environment and exhibited a red shift with prolonged incubation time. This phenomenon indicates an increase in the particle size of CdS QDs (Figure 3) [45]. This change parallels CdS QDs generated through a single enzyme system in vitro [36]. These findings suggest that the CdS QDs undergo aggregation, leading to an increase in particle size. Transmission electron microscopy (TEM) analyses further confirmed the presence of CdS QDs and aggregates around the cell surface (Figure 5). The CdS produced in LB showed a granular distribution, while the CdS produced in wastewater showed a large mass distribution, which may be caused by the high rate of cell absorption of cadmium and cysteine in wastewater.
Under rich medium conditions, E. coli/pET-28a-TtCSA1 demonstrated superior removal efficiency across different cadmium concentrations ranging from 0.3 to 0.6 mM (Figure 7). This enhanced efficiency is attributed to the expression of TtCsa1.TtCsa1 rapidly catalyzes cysteine to generate H2S, which serves as a critical substrate for biomineralization and subsequent CdS formation. The biosynthesis of CdS QDs facilitates cadmium bioremoval. Importantly, E. coli/pET-28a-TtCSA1 maintained a higher cadmium removal rate in simulated wastewater (Figure 8). Under nutrient conditions, the cadmium removal rate by Bacteria G303 was 94.7% for 0.4 mM cadmium within 96 h [17]. The E. coli/pLC67 strain achieved a removal rate of 99% for 0.4 mM cadmium within 48 h [43]. Additionally, the deep-sea bacterium Pseudomonas stutzeri 273 demonstrated a 76% removal rate for 0.4 mM cadmium within 24 h [16]. In wastewater, the alga Dunaliella salina showed an 11.3% removal rate for 0.66 mM cadmium over 24 h [46]. These results indicate that E. coli/pET-28a-TtCSA1 possesses comparable cadmium removal capabilities to those reported in existing bioremediation technologies. Compared to other biological methods, the E. coli/pET-28a-TtCSA1 exhibited a stronger cadmium removal rate in wastewater than under nutrient-rich conditions. This enhanced removal efficiency may be attributed to the robust cadmium resistance of E. coli/pET-28a-TtCSA1 in wastewater, whereas other organisms might experience a decline in cadmium tolerance due to nutrient deficiency in such environments. In the presence of cysteine, the increased production of H2S by E. coli/pET-28a-TtCSA1 directly facilitates the conversion of cadmium into less toxic CdS. This process significantly reduces the intracellular concentration of free cadmium ions. Given its efficiency and the ease of genetic modification, E. coli/pET-28a-TtCSA1 presents significant potential for applications in the removal of the environmental heavy metal cadmium. (Table S1).
Cadmium-contaminated water environments often contain other pollutants such as sulfates and phosphates [47,48]. Sulfate-reducing bacteria can effectively remove sulfate pollution from wastewater while generating S2⁻, which can subsequently react with cadmium to form cadmium sulfide [49]. This process is facilitated by the presence of sulfate reductases in these bacteria, including adenosine-5’-phosphosulfate reductase and sulfite reductase [50,51,52]. However, sulfate-reducing bacteria are strict anaerobes, which necessitate the creation of anaerobic environments for their application [53]. To enhance the application potential of sulfate-reducing bacteria in aerobic environments, expressing sulfate-reducing enzymes in E. coli may be a viable approach. Such genetically modified bacteria, through the overexpression of sulfate reductases, would possess enhanced capabilities for sulfate removal while simultaneously removing cadmium contamination. Given the diverse extreme environments in nature, the presence of various enzymes that confer resistance to these conditions suggests that expressing enzymes from other organisms in engineered strains may offer promising applications.
In summary, the heterologous expression of TtCsa1 in E. coli enhances its tolerance to cadmium and increases H2S production with the addition of cysteine. The resulting H2S subsequently participates in a biomineralization reaction with cadmium, leading to the formation of CdS QDs. This approach facilitates the effective bioremediation of cadmium from aquatic environments. The engineered E. coli/pET-28a-TtCSA1 possesses a greater advantage for cadmium bioremediation in both rich medium and wastewater.

4. Materials and Methods

4.1. Strains, Media, and Reagents

The DNA sequence of TtCSA1 was codon-optimized and cloned into the pET-28a plasmid, resulting in the construction of the plasmid pET-28a-TtCSA1 [34]. The plasmids pET-28a-TtCSA1 and pET-28a were transformed into Escherichia coli BL21 (DE3), and positive clones were screened to obtain the E. coli/pET-28a-TtCSA1 and E. coli/pET-28a strains [34]. The strains were cultured in LB medium (rich medium, 10 g/L peptone, 10 g/L NaCl, 5 g/L yeast extract, pH 7.4) at 37 °C with shaking at 180 rpm (Orbital shaker TS-2, Haimen Kylin-Bell Lab Instruments Co. Ltd,Jiangsu, China). Simulated wastewater was prepared using water collected from the Fen River in Taiyuan, which was added with cadmium and equilibrated overnight. L-cysteine (Sangon Biotech Co., Ltd., Shanghai, China) and cadmium chloride (Beijing Solaibao Technology Co., Ltd., Beijing, China) were prepared as stock solutions using ultrapure water.

4.2. Determination of Growth Curves and Minimum Inhibitory Concentration of Cadmium Ions

E. coli/pET-28a and E. coli/pET-28a-TtCSA1 were cultured overnight and inoculated into LB medium at a 1:100 volume ratio. The cultures were incubated at 37 °C until the optical density at 600 nm (OD600) reached 0.6. Adding 0.05mM IPTG induced protein expression for 24 h. Subsequently, the cells were inoculated into 10 mL of LB medium, maintaining a cell concentration of OD600 at 0.05, and the OD600 was measured at regular time intervals to monitor bacterial growth. To determine the minimum inhibitory concentration (MIC) of cadmium ions on the strains, E. coli/pET-28a and E. coli/pET-28a-TtCSA1 were cultured to an OD600 of 0.6, followed by the addition of 0.05 mM IPTG to induce protein expression at 16 °C for 24 h. After induction, the cells were inoculated into 10 mL of LB medium with an initial OD600 0.05, and cadmium chloride was added at concentrations of 0,0.15, 0.3, 0.45, 0.6, 0.75, and 0.9 mM. After 24 h of incubation at 37 °C, the OD600 of the cultures was measured.
To detect the growth curve of cells in simulated wastewater, water samples were collected from the Fen River in Taiyuan and added with cadmium to simulate wastewater [54]. Cells with induced protein expression were suspended in the wastewater, maintaining a cell concentration of OD600 at 1.1–1.2. After adding cadmium, the optical density of bacteria was measured at regular intervals.

4.3. Preparation of E. coli/CdS and Fluorescence Intensity Analysis

After protein induction, E. coli/pET-28a and E. coli/pET-28a-TtCSA1 were collected using centrifugation at 12,300 g for 10 min (Centrifuge 5804R, Eppendorf, Hamburg, Germany). The cell pellets were resuspended in 10 mL of fresh medium, maintaining a cell density of OD600 at 1.1–1.2. L-cysteine and cadmium ions were then added to the suspension to promote the intracellular synthesis of CdS QDs. The cultures were incubated at 37 °C with shaking at 180 rpm, and the formation of CdS QDs within the cells was monitored at regular time intervals.
To analyze the fluorescence properties of E. coli/CdS, the cells were collected by centrifugation at 6150 g for 1 min, washed twice with PBS, and resuspended. Fluorescence microscopy (BX51, OLYMPUS, Tokyo, Japan) was employed to observe the cells under UV light excitation, focusing on the fluorescence characteristics of CdS QDs within the cells. The fluorescence intensity of the cells was quantified using ImageJ software (V1.80.), providing a detailed analysis of the fluorescence characteristics [40].

4.4. Production and Detection of H2S

To investigate the production of H2S, E. coli/pET-28a and E. coli/pET-28a-TtCSA1 were collected after IPTG induction, resuspended, and adjusted to an OD600 of 1.1–1.2. A 5 mL aliquot of the cell suspension was transferred to a 15 mL test tube. To examine the effect of L-cysteine concentration on H2S production, cadmium ions and varying concentrations of L-cysteine (0, 0.2, 0.5, 1, 2, and 4 mM) were added to the system. Similarly, to evaluate the impact of cadmium ion concentration on H2S production, L-cysteine and different concentrations of cadmium ions (0, 0.15, 0.3, 0.45, 0.6, 0.75, and 0.9 mM) were added. A pre-moistened lead acetate test strip was placed 4 cm above the top of the test tube, and the tube cap was tightly sealed. The test tubes were incubated at 37 °C in a shaking incubator, and the lead acetate test strip was periodically observed for color changes [55].

4.5. The Absorption and Emission Spectrum of CdS QDs

E. coli/pET-28a and E. coli/pET-28a-TtCSA1 were centrifuged at 12,300 g for 10 min, and the supernatant was collected for analysis. The collected supernatant was used to analyze the ultraviolet absorption spectrum of cadmium sulfide QDs in the reaction system using a UV-visible spectrophotometer. Fluorescence emission spectra at an excitation wavelength of 350 nm were measured using a fluorescence spectrophotometer [56].

4.6. Characterization of CdS QDs by Transmission Electron Microscope and Energy Dispersive X-Ray Spectroscopy (EDX)

After protein induction, E. coli/pET-28a and E. coli/pET-28a-TtCSA1 were centrifuged at 12,300 g for 10 min, and the cells were resuspended in an equal volume of fresh medium to an OD600 of 1.1–1.2. The suspension was incubated with 0.3 mM cadmium chloride and 0.5 mM L-cysteine for 48 h, and the cells were collected at 12,300 g for 2 min. The cells fixed with 2.5% glutaraldehyde were loaded onto carbon film-coated copper grids by immersion, washed once with ultrapure water, and dried using blotting paper. The cells were then observed by a transmission electron microscope (JEOL JEM-F200, Hitachi, Tokyo, Japan). Energy dispersive X-ray spectroscopy (EDX) analysis was conducted at an accelerating voltage of 15 kV for 100 s [57]. For Scanning Electron Microscope (SEM) observation, the cells were washed twice with PBS and fixed with 2.5% glutaraldehyde at 4°C for 20 min. The cell pellets were washed with 100 mM PBS. Dehydration was performed using a graded ethanol series (30%, 50%, 70%, 90%, 95%, and absolute ethanol) for 10 min each. The cell suspension was placed on a lysine-coated coverslip, mounted on stubs, and sputter-coated with gold and platinum (10 nm) using a KAS-2000F ion sputter coater for 5 min. Then, the samples were observed using SEM (ZEISS Sigma 300, Jena, Germany).

4.7. X-Ray Diffraction of E. coli/pET-28a-TtCSA1-CdS

E. coli/pET-28a-CdS and E. coli/pET-28a-TtCSA1-CdS were washed twice with PBS, and resuspended in a small amount of ultrapure water. The cells were freeze-dried using a lyophilizer and subsequently ground into a powder. X-ray diffraction (XRD) patterns were recorded using an X-ray diffractometer (Panalytical Empyrean, Almelo, Netherlands) [15].

4.8. Cadmium Removal in LB Medium and Simulated Wastewater

E. coli/pET-28a-TtCSA1 and E. coli/pET-28a were collected after induction and washed twice with PBS. The cells were then resuspended in 10 mL of fresh LB medium in a 100 mL Erlenmeyer flask, maintaining an OD600 of 1.1–1.2. The cultures were supplemented with 0.5 mM L-cysteine and varying concentrations of cadmium ions (0.15, 0.3, 0.45, 0.6, and 0.75 mM) and incubated for 48 h. The cells were centrifuged at 12,300 g for 10 min. The supernatant was collected, and the cadmium content in the medium was determined using Inductively Coupled Plasma Optical Emission Spectrometry/Mass Spectrometry (ICP-OES/MS, Agilent 5110 (OES), CA,USA). The cell pellets were dried at 37 °C for 48 h to determine the biomass dry weight. The cadmium removal efficiency and adsorption capacity were calculated using the following equations:
R = (1 − C/C0) × 100%
Ee = q/m
where R is the bacterial cadmium removal efficiency (%), C0 is the initial cadmium concentration (mg/L), and C is the cadmium concentration in the culture supernatant after 48 h of bacterial growth (mg/L). Ee is the cadmium adsorption capacity of the bacteria (mg/g), q is the mass of cadmium adsorbed by the bacteria (mg), and m is the biomass weight (g) [7].
To investigate cadmium removal from wastewater. The cells were washed twice with PBS and resuspended to maintain an OD600 of 1.1–1.2. The cells were recollected by centrifugation and resuspended in simulated wastewater containing 0.3 mM cadmium ions in a 100 mL Erlenmeyer flask. Different concentrations of L-cysteine (0, 0.5, 1, 2, and 4 mM) were added, and the cultures were incubated in a shaker at 37 °C for 48 h. The methods for calculating cadmium removal efficiency and adsorption capacity were identical to those described previously. Additionally, the cells were suspended in simulated wastewater containing cadmium ions (0.3, 0.45, 0.6, 0.75, and 0.9 mM) and 2 mM L-cysteine, incubated in 100 mL Erlenmeyer flasks for 12 h, and cadmium removal efficiency and adsorption capacity were calculated as previously described.

4.9. Statistical Analysis

All experiments were conducted in triplicate, and the data are expressed as the mean ± standard deviation of the three experiments. Statistical analysis was performed using one-way analysis of variance (ANOVA). The Tukey’s multiple comparison test was utilized to evaluate significant differences between treatments. Statistical significance is denoted by a single asterisk for p < 0.05 and a triple asterisk for p < 0.01.

5. Conclusions

Heterologous expression of TtCsa1 enhances Escherichia coli’s tolerance for cadmium stress. E. coli/pET-28a-TtCSA1 produces higher levels of H2S under L-cysteine incubation, resulting in the formation of more CdS QDs. E. coli/pET-28a-TtCSA1 exhibits superior cadmium removal efficiency. It not only improves cadmium tolerance but also enhances cadmium biomineralization from both rich mediums and simulated wastewater. The engineered E. coli/pET-28a-TtCSA1 holds potential for application in cadmium bioremediation in wastewater.

Supplementary Materials

The supporting information can be downloaded at: https://www.mdpi.com/article/10.3390/ijms26083685/s1. References [7,16,17,24,26,41,43,49,58,59] are cited in the supplementary materials.

Author Contributions

Conceptualization, W.L. and W.W.; Validation, W.L. and J.L.; Formal Analysis, W.L.; Resources, W.W.; Data Curation, W.W.; Writing–Original Draft Preparation, W.L.; Writing–Review and Editing, J.X. and W.W.; Visualization, W.L. and Y.L.; Project Administration, W.W. All authors have read and agreed to the published version of the manuscript.

Funding

This work was supported by the National Natural Science Foundation of China (32270450, 32071449, 32470449), Shanxi Key Program International S and T Cooperation Projects (202104041101011), and Shanxi Scholarship Council of China (2024010).

Institutional Review Board Statement

Not applicable.

Informed Consent Statement

Not applicable.

Data Availability Statement

The additional data supporting the manuscript are available from the corresponding author upon request.

Acknowledgments

We thank Liu na from Shiyanjia Lab (www.shiyanjia.com) for the support of ICP-OES/MS test.

Conflicts of Interest

The authors declare no conflict of interest.

References

  1. Lu, Y.; Cheng, J.; Wang, J.; Zhang, F.; Tian, Y.; Liu, C.; Cao, L.; Zhou, Y. Efficient Remediation of Cadmium Contamination in Soil by Functionalized Biochar: Recent Advances, Challenges, and Future Prospects. Processes 2022, 10, 1627. [Google Scholar] [CrossRef]
  2. Cristani, M.; Naccari, C.; Nostro, A.; Pizzimenti, A.; Trombetta, D.; Pizzimenti, F. Possible use of Serratia marcescens in toxic metal biosorption (removal). Environ. Sci. Pollut. Res. 2012, 19, 161–168. [Google Scholar] [CrossRef] [PubMed]
  3. Wang, S.; Li, Q.; Li, Y.; Wan, S.; Yin, Z.; Zhao, S.; Dai, X.; Wang, R.; Wang, S.; Zhai, Y.; et al. Stress Response of Aphid Population Under Combined Stress of Cadmium and Lead and Its Effects on Development of Harmonia axyridis. Int. J. Mol. Sci. 2024, 25, 20. [Google Scholar] [CrossRef]
  4. Yang, Q.; Li, Z.; Lu, X.; Duan, Q.; Huang, L.; Bi, J. A review of soil heavy metal pollution from industrial and agricultural regions in China: Pollution and risk assessment. Sci. Total Environ. 2018, 642, 690–700. [Google Scholar] [CrossRef]
  5. Ko, D.; Kim, H.; Lee, H.; Yavuz, C.T.; Andersen, H.R.; Hwang, Y. Applicability of disulfide-polymer particles surface embedded on alginate beads for cadmium removal from airport derived stormwater. J. Environ. Chem. Eng. 2018, 6, 4124–4129. [Google Scholar] [CrossRef]
  6. Qiu, M.; Bi, X.; Liu, Y.; Li, H.; Li, D.; Chen, G. Toxicology Effects of Cadmium in Pomacea canaliculate: Accumulation, Oxidative Stress, Microbial Community, and Transcriptome Analysis. Int. J. Mol. Sci. 2025, 26, 2. [Google Scholar] [CrossRef] [PubMed]
  7. Tu, J.W.; Li, T.; Gao, Z.H.; Xiong, J.; Miao, W. Construction of CdS-Tetrahymena thermophila hybrid system by efficient cadmium adsorption for dye removal under light irradiation. J. Hazard. Mater. 2022, 439, 129683. [Google Scholar] [CrossRef]
  8. Kharel, H.L.; Jha, L.; Tan, M.; Selvaratnam, T. Removal of Cadmium (II) from Aqueous Solution Using Galdieria sulphuraria CCMEE 5587.1. BioTech 2024, 13, 28. [Google Scholar] [CrossRef]
  9. Yaashikaa, P.R.; Palanivelu, J.; Hemavathy, R.V. Sustainable approaches for removing toxic heavy metal from contaminated water: A comprehensive review of bioremediation and biosorption techniques. Chemosphere 2024, 357, 141933. [Google Scholar] [CrossRef]
  10. Lopes, C.S.C.; Teixeira, D.B.; Braz, B.F.; Santelli, R.E.; de Castilho, L.V.A.; Gomez, J.G.C.; Castro, R.P.V.; Seldin, L.; Freire, D.M.G. Application of rhamnolipid surfactant for remediation of toxic metals of long- and short-term contamination sites. Int. J. Environ. Sci. Technol. 2020, 18, 575–588. [Google Scholar] [CrossRef]
  11. Ahluwalia, S.S.; Goyal, D. Microbial and plant derived biomass for removal of heavy metals from wastewater. Bioresour. Technol. 2007, 98, 2243–2257. [Google Scholar] [CrossRef]
  12. Peng, W.; Li, X.; Song, J.; Jiang, W.; Liu, Y.; Fan, W. Bioremediation of cadmium- and zinc-contaminated soil using Rhodobacter sphaeroides. Chemosphere 2018, 197, 33–41. [Google Scholar] [CrossRef]
  13. Sreedevi, P.R.; Suresh, K.; Jiang, G. Bacterial bioremediation of heavy metals in wastewater: A review of processes and applications. J. Water Process Eng. 2022, 48, 102884. [Google Scholar] [CrossRef]
  14. Srivastava, S.; Agrawal, S.B.; Mondal, M.K. A review on progress of heavy metal removal using adsorbents of microbial and plant origin. Environ. Sci. Pollut. Res. 2015, 22, 15386–15415. [Google Scholar] [CrossRef]
  15. Chen, G.; Yi, B.; Zeng, G.; Niu, Q.; Yan, M.; Chen, A.; Du, J.; Huang, J.; Zhang, Q. Facile green extracellular biosynthesis of CdS quantum dots by white rot fungus Phanerochaete chrysosporium. Colloids Surf. B. 2014, 117, 199–205. [Google Scholar] [CrossRef] [PubMed]
  16. Ma, N.; Cai, R.; Sun, C. Threonine dehydratase enhances bacterial cadmium resistance via driving cysteine desulfuration and biomineralization of cadmium sulfide nanocrystals. J. Hazard. Mater. Adv. 2021, 417, 126102. [Google Scholar] [CrossRef] [PubMed]
  17. Zhang, S.; Song, M.; Zhang, J.; Wang, H. Cysteine and thiosulfate promoted cadmium immobilization in strain G303 by the formation of extracellular CdS. Sci. Total Environ. 2024, 923, 171457. [Google Scholar] [CrossRef]
  18. Xu, S.; Luo, X.; Huang, Q.; Chen, W. Calcium-crosslinked alginate-encapsulated bacteria for remediating of cadmium-polluted water and production of CdS nanoparticles. Appl. Microbiol. Biotechnol. 2021, 105, 2171–2179. [Google Scholar] [CrossRef]
  19. Arif, M.S.; Yasmeen, T.; Abbas, Z.; Ali, S.; Rizwan, M.; Aljarba, N.H.; Alkahtani, S.; Abdel-Daim, M.M. Role of Exogenous and Endogenous Hydrogen Sulfide (H2S) on Functional Traits of Plants Under Heavy Metal Stresses: A Recent Perspective. Front. Plant Sci. 2021, 11, 545453. [Google Scholar] [CrossRef]
  20. Venegas, F.A.; Saona, L.A.; Monrás, J.P.; Órdenes-Aenishanslins, N.; Giordana, M.F.; Ulloa, G.; Collao, B.; Bravo, D.; Pérez-Donoso, J.M. Biological phosphorylated molecules participate in the biomimetic and biological synthesis of cadmium sulphide quantum dots by promoting H2S release from cellular thiols. RSC Adv. 2017, 7, 40270–40278. [Google Scholar] [CrossRef]
  21. Tan, B.H.; Wong, P.T.H.; Bian, J.-S. Hydrogen sulfide: A novel signaling molecule in the central nervous system. Neurochem. Int. 2010, 56, 3–10. [Google Scholar] [CrossRef]
  22. Yan, Z.-Y.; Du, Q.-Q.; Qian, J.; Wan, D.-Y.; Wu, S.-M. Eco-friendly intracellular biosynthesis of CdS quantum dots without changing Escherichia coli’s antibiotic resistance. Enzyme Microb. Technol. 2017, 96, 96–102. [Google Scholar] [CrossRef]
  23. Li, L.; Wang, Y.; Shen, W. Roles of hydrogen sulfide and nitric oxide in the alleviation of cadmium-induced oxidative damage in alfalfa seedling roots. BioMetals 2012, 25, 617–631. [Google Scholar] [CrossRef]
  24. Ma, N.; Sha, Z.; Sun, C. Formation of cadmium sulfide nanoparticles mediates cadmium resistance and light utilization of the deep-sea bacterium Idiomarina sp. OT37-5b. Appl. Environ. Microbiol. 2021, 23, 934–948. [Google Scholar] [CrossRef] [PubMed]
  25. Gallardo, C.; Monras, J.P.; Plaza, D.O.; Collao, B.; Saona, L.A.; Duran-Toro, V.; Venegas, F.A.; Soto, C.; Ulloa, G.; Vasquez, C.C.; et al. Low-temperature biosynthesis of fluorescent semiconductor nanoparticles (CdS) by oxidative stress resistant Antarctic bacteria. J. Biotechnol. 2014, 187, 108–115. [Google Scholar] [CrossRef] [PubMed]
  26. Xing, S.F.; Tian, H.F.; Yan, Z.; Song, C.; Wang, S.G. Stability and biomineralization of cadmium sulfide nanoparticles biosynthesized by the bacterium Rhodopseudomonas palustris under light. J. Hazard. Mater. Adv. 2023, 458, 131937. [Google Scholar] [CrossRef] [PubMed]
  27. Shu, H.; Chang, S. The construction of an engineered bacterium to remove cadmium from wastewater. Water Sci. Technol. 2014, 70, 2015–2021. [Google Scholar] [CrossRef]
  28. Shen, J.J.; Qiao, Z.J.; Xing, T.J.; Zhang, L.P.; Liang, Y.L.; Jin, Z.P.; Yang, G.D.; Wang, R.; Pei, Y.X. Cadmium toxicity is alleviated by AtLCD and AtDCD inEscherichia coli. J. Appl. Microbiol. 2012, 113, 1130–1138. [Google Scholar] [CrossRef]
  29. Jafarian, V.; Ghaffari, F. A unique metallothionein-engineered in Escherichia coli for biosorption of lead, zinc, and cadmium; absorption or adsorption? Microbiology 2017, 86, 73–81. [Google Scholar] [CrossRef]
  30. Li, Y.; Cui, R.; Zhang, P. Mechanism-Oriented Controllability of Intracellular Quantum Dots Formation: The Role of Glutathione Metabolic Pathway. ACS Nano 2012, 7, 2240–2248. [Google Scholar] [CrossRef]
  31. Kawashima, C.G.; Noji, M.; Nakamura, M.; Ogra, Y. Heavy metal tolerance of transgenic tobacco plants over-expressing cysteine synthase. Biotechnol. Lett. 2004, 26, 153–157. [Google Scholar] [CrossRef] [PubMed]
  32. Zhang, Y.; Qi, K.; Jing, Y.; Zuo, J.; Hu, J.; Lv, X.; Chen, Z.; Mi, R.; Huang, Y.; Yu, S.; et al. LsrB-based and temperature-dependent identification of bacterial AI-2 receptor. AMB Express 2017, 7, 188. [Google Scholar] [CrossRef]
  33. Liu, Y.; Pei, R.; Huang, Z.; Xiao, J.; Yao, A.; Xu, K.; Li, Y.; Ullah, S.; Yu, Z.; Wang, Y.; et al. Green immobilization of CdS-Pt nanoparticles on recombinant Escherichia coli boosted by overexpressing cysteine desulfurase for photocatalysis application. Bioresour. Technol. Rep. 2021, 16, 100823. [Google Scholar] [CrossRef]
  34. Lv, H.; Xu, J.; Bo, T.; Wang, W. Characterization of Cystathionine β-Synthase TtCbs1 and Cysteine Synthase TtCsa1 Involved in Cysteine Biosynthesis in Tetrahymena thermophila. J. Eukaryotic Microbiol. 2021, 68, 12834. [Google Scholar] [CrossRef]
  35. Lv, H.; Xu, J.; Bo, T.; Wang, W. Comparative transcriptome analysis uncovers roles of hydrogen sulfide for alleviating cadmium toxicity in Tetrahymena thermophila. BMC Genom. 2021, 22, 21. [Google Scholar] [CrossRef] [PubMed]
  36. Lei, W.; Liu, J.; Zhang, W.; Xu, J.; Bo, T.; Wang, Z.; Wang, W. Photocatalytic degradation of methylene blue by CdS quantum dots biosynthesized by cysteine synthetase TtCsa1 from Tetrahymena thermophila. Int. J. Biol. Macromol. 2025, 305, 141166. [Google Scholar] [CrossRef]
  37. Wu, C.; Deng, C.F.; Zhang, J.X.; Pan, W.; Yang, L.Y.; Pan, K.; Tan, Q.G.; Yue, T.T.; Miao, A.J. Silica nanoparticles inhibit cadmium uptake by the protozoan Tetrahymena thermophila without the need for adsorption. J. Hazard. Mater. 2024, 466, 133569. [Google Scholar] [CrossRef] [PubMed]
  38. Meena, O.P. Heavy Metals Toxicity and the Environment Protection. Hilaris SRL 2021, 8, 326. [Google Scholar] [CrossRef]
  39. Yang, X.; Yang, Y.; Wang, B.; Wang, T.; Wang, Y.; Meng, D. Synthesis and photocatalytic property of cubic phase CdS. Solid State Sci. 2019, 92, 31–35. [Google Scholar] [CrossRef]
  40. Cui, Y.H.; Wu, J.H.; Wei, W.; Zhang, F.; Li, L.L.; Tian, L.J.; Li, W.W.; Lam, P.K.S.; Yu, H.Q. Intracellular Hybrid Biosystem in a Protozoan to Trigger Visible-Light-Driven Photocatalysis. ACS Appl. Mater. Interfaces. 2021, 13, 19846–19854. [Google Scholar] [CrossRef]
  41. Jia, H.; Wang, X.; Dou, Y.; Liu, D.; Si, W.; Fang, H.; Zhao, C.; Chen, S.; Xi, J.; Li, J. Hydrogen sulfide—Cysteine cycle system enhances cadmium tolerance through alleviating cadmium-induced oxidative stress and ion toxicity in Arabidopsis roots. Sci. Rep. 2016, 6, 39702. [Google Scholar] [CrossRef]
  42. Cao, H.; Liang, Y.; Zhang, L.; Liu, Z.; Liu, D.; Cao, X.; Deng, X.; Jin, Z.; Pei, Y. AtPRMT5-mediated AtLCD methylation improves Cd2+ tolerance via increased H2S production in Arabidopsis. Plant Physiol. 2022, 190, 2637–2650. [Google Scholar] [CrossRef]
  43. Wang, C.L.; Lum, A.M.; Ozuna, S.C.; Clark, D.S.; Keasling, J.D. Aerobic sulfide production and cadmium precipitation by Escherichia coli expressing the Treponema denticola cysteine desulfhydrase gene. Appl. Microbiol. Biotechnol. 2001, 56, 425–430. [Google Scholar] [CrossRef] [PubMed]
  44. Wang, X.; Huang, J.-H.; Meng, B.; Mao, K.; Zheng, M.; Tan, A.; Yang, G.; Feng, X. LmGSTF3 Overexpression Enhances Cadmium Tolerance in Lemna minor. Environ. Sci. Technol. 2024, 10, 1021. [Google Scholar] [CrossRef]
  45. Valenzuela-Ibaceta, F.; Torres-Olea, N.; Ramos-Zúñiga, J.; Dietz-Vargas, C.; Navarro, C.A.; Pérez-Donoso, J.M. Minicells as an Escherichia colimechanism for the accumulation and disposal of fluorescent cadmium sulphide nanoparticles. J. Nanobiotechnol. 2024, 22, 1. [Google Scholar] [CrossRef]
  46. Folgar, S.; Torres, E.; Pérez-Rama, M.; Cid, A.; Herrero, C.; Abalde, J. Dunaliella salina as marine microalga highly tolerant to but a poor remover of cadmium. J. Hazard. Mater. 2009, 165, 486–493. [Google Scholar] [CrossRef] [PubMed]
  47. Wakeman, K.D.; Erving, L.; Riekkola-Vanhanen, M.L.; Puhakka, J.A. Silage supports sulfate reduction in the treatment of metals- and sulfate-containing waste waters. Water Res. 2010, 44, 4932–4939. [Google Scholar] [CrossRef] [PubMed]
  48. Shi, Y.; Cheng, L.; Tao, M.; Tong, S.; Yao, X.; Liu, Y. Using modified quartz sand for phosphate pollution control in cemented phosphogypsum (PG) backfill. J. Clean. Prod. 2021, 283, 124652. [Google Scholar] [CrossRef]
  49. Ren, W.; Wan, C.; Li, Z.; Liu, X.; Zhang, R.; Yang, X.; Lee, D.J. Functional CdS nanocomposites recovered from biomineralization treatment ofsulfate wastewater and its applications in the perspective of photocatalysis and electrochemistry. Sci. Total Environ. 2020, 742, 140646. [Google Scholar] [CrossRef]
  50. Yagi, T.; Ogata, M. Catalytic properties of adenylylsulfate reductase from Desulfovibrio vulgaris Miyazaki. Biochimie 1996, 78, 838–846. [Google Scholar] [CrossRef]
  51. Dostal Webster, A.; Staley, C.; Hamilton, M.J.; Huang, M.; Fryxell, K.; Erickson, R.; Kabage, A.J.; Sadowsky, M.J.; Khoruts, A. Influence of short-term changes in dietary sulfur on the relative abundances of intestinal sulfate-reducing bacteria. Gut Microbes. 2019, 10, 447–457. [Google Scholar] [CrossRef] [PubMed]
  52. Larsen, O.; Lien, T.; Birkeland, N. A novel organization of the dissimilatory sulfite reductase operon of Thermodesulforhabdus norvegica verified by RT-PCR. FEMS Microbiol. Lett. 2001, 203, 81–85. [Google Scholar] [CrossRef] [PubMed]
  53. Begum, M.; Li, L.; Young, E.; Carey, M.; Li, G.; Zhu, Y.-G.; Banwart, S.; Meharg, A.A.; Meharg, C. Fertilization Enhances Grain Inorganic Arsenic Assimilation in Rice. Expos. Health 2023, 16, 417–430. [Google Scholar] [CrossRef]
  54. Huang, S.; Liu, X.; Hu, Q.; Wei, T.; Wang, J.; Chen, H.; Wu, C. Temperature-Driven Metalloprotein-Based Hybrid Hydrogels for Selective and Reversible Removal of Cadmium(II) from Water. ACS Appl. Mater. Interfaces 2019, 12, 2991–2998. [Google Scholar] [CrossRef] [PubMed]
  55. Xia, Y.; Lu, C.; Hou, N.; Xin, Y.; Liu, J.; Liu, H.; Xun, L. Sulfide production and oxidation by heterotrophic bacteria under aerobic conditions. ISME J. 2017, 11, 2754–2766. [Google Scholar] [CrossRef]
  56. Dunleavy, R.; Lu, L.; Kiely, C.J.; McIntosh, S.; Berger, B.W. Single-enzyme biomineralization of cadmium sulfide nanocrystals with controlled optical properties. Proc. Natl. Acad. Sci. USA 2016, 113, 5275–5280. [Google Scholar] [CrossRef]
  57. Zhu, Y.; Ma, N.; Jin, W.; Wu, S.; Sun, C. Genomic and Transcriptomic Insights into Calcium Carbonate Biomineralization by Marine Actinobacterium Brevibacterium linens BS258. Front. Microbiol. 2017, 8, 602. [Google Scholar] [CrossRef]
  58. Khan, I.; Aftab, M.; Shakir, S.; Ali, M.; Qayyum, S.; Rehman, M.U.; Haleem, K.S.; Touseef, I. Mycoremediation of heavy metal (Cd and Cr)–polluted soil through indigenous metallotolerant fungal isolates. Environ. Monit. Assess. 2019, 191, 9. [Google Scholar] [CrossRef]
  59. He, X.; Chen, W.; Huang, Q. Surface display of monkey metallothionein α tandem repeats and EGFP fusion protein on Pseudomonas putida X4 for biosorption and detection of cadmium. Appl. Microbiol. Biotechnol. 2011, 95, 1605–1613. [Google Scholar] [CrossRef]
Figure 1. Overexpression of His-Csa1 improves Cadmium Tolerance in E. coli. (A) Proliferation of E. coli/pET-28a and E. coli/pET-28a-TtCSA1. (B) Minimum inhibitory concentration (MIC) assay of cadmium ions for E. coli/pET-28a and E. coli/pET-28a-TtCSA1.
Ijms 26 03685 g001
Figure 2. Overexpression of His-TtCSA1 in E. coli catalyzes the formation of quantum dots in rich medium and wastewater. (A) The formation of quantum dots was observed after incubating E. coli/pET-28a and E. coli/pET-28a-TtCSA1 in LB medium containing 0.45 mM cadmium and varying concentrations of L-cysteine (0, 0.2, 0.5, and 1 mM) for 48 h. Scale bar, 20 µm. (B) Relative fluorescence intensity analysis of QDs in E. coli after 48 h of incubation, corresponding to the conditions shown in (A) (n = 300). (C) The formation of quantum dots was observed after incubating E. coli/pET-28a and E. coli/pET-28a-TtCSA1 with 0.5 mM L-cysteine and varying concentrations of cadmium (0, 0.15, 0.3, 0.45, and 0.6 mM) in LB medium for 48 h. Scale bar, 20 µm. (D) Relative fluorescence intensity analysis of QDs in E. coli after 48 h of incubation, corresponding to the conditions showed in (C) (n = 300) (E) The formation of quantum dots was observed after incubating E. coli/pET-28a and E. coli/pET-28a-TtCSA1 in wastewater containing 0.3 mM cadmium and varying concentrations of L-cysteine (0, 0.5, 1, and 2 mM) for 12 h. Scale bar, 20 µm. (F) Relative fluorescence intensity analysis of QDs in E. coli after 12 h of incubation, corresponding to the conditions shown in (E) (n = 300) (G). The formation of quantum dots was observed after incubating E. coli/pET-28a and E. coli/pET-28a-TtCSA1 with 1 mM L-cysteine and varying concentrations of cadmium (0.3, 0.45, 0.6, 0.75, and 0.9 mM) for 12 h in wastewater. Scale bar, 20 µm. (H) Relative fluorescence intensity analysis of QDs in E. coli after 12 h of incubation, corresponding to the conditions shown in (G) (n = 300). Data are means ± SE of three biological repeats, error bars indicate error standard. Means denoted by the same letter were not significantly different at P > 0.05, and different letters indicate statistically significantly differences (p < 0.05) by Duncan Multiple Range Test (DMRT).
Ijms 26 03685 g002
Figure 3. Spectral analysis of CdS generated using E. coli/pET-28a and E. coli/pET-28a-TtCSA1. (A) UV-Visible absorption spectra of the supernatants obtained after centrifugation of E. coli/pET-28a and E. coli/pET-28a-TtCSA1, incubated in LB medium containing 0.45 mM Cd2+ and 0.5 mM L-cysteine for 12, 24, and 48 h. (B) Corresponding fluorescence spectra for the samples described in (A). (C) UV-Visible absorption spectra of the supernatants obtained after centrifugation of E. coli/pET-28a and E. coli/pET-28a-TtCSA1 incubated in wastewater containing 0.6 mM Cd2+ and 1 mM L-cysteine for 12, 24, and 48 h. (D) Corresponding fluorescence spectra for the samples described in (C).
Ijms 26 03685 g003
Figure 4. Production of hydrogen sulfide in E. coli /pET-28a and E. coli/pET-28a-TtCSA1. (A) Detection of H2S generation using lead acetate paper after incubating E. coli/pET-28a and E. coli/pET-28a-TtCSA1 in rich medium containing 0.45 mM cadmium ions and varying concentrations of L-cysteine (0, 0.2, 0.5, and 1 mM) for 12 h. (B) Relative gray intensity analysis in (A). (C) Detection of H2S generation using lead acetate paper after incubating E. coli/pET-28a and E. coli/pET-28a-TtCSA1 with 0.3 mM cadmium ions and varying concentrations of L-cysteine (0, 5, 1, and 2 mM) in wastewater for 24 h. (D) Relative gray intensity analysis in (C). The symbols ns and *** represent non-significance (p > 0.05) and extremely significant differences (p < 0.01), respectively.
Ijms 26 03685 g004
Figure 5. Transmission Electron Microscopy (TEM) observation of E. coli treated with cadmium and cysteine. (A) The formation of cadmium sulfide was shown using TEM in E. coli/pET-28a after 48 h of incubation in LB medium. Scale bar, 1 μm. (B) The formation of cadmium sulfide was shown by TEM in E. coli/pET-28a-TtCSA1 after 48 h of incubation in LB medium. Scale bar, 1 μm. (C) The formation of cadmium sulfide was observed by TEM in E. coli/pET-28a after 48 h of incubation in wastewater. Scale bar, 1 μm. (D) The formation of cadmium sulfide was observed by TEM in E. coli/pET-28a-TtCSA1 after 48 h of incubation in wastewater. Scale bar, 1 μm.
Ijms 26 03685 g005
Figure 6. Energy dispersive X-ray (EDX) spectroscopy analysis of cadmium sulfide quantum dot generated in E. coli. (A) EDX spectroscopy analysis showing the elemental distribution on the surface of E. coli/pET-28a after incubation for 48 h in LB medium containing 0.45 mM cadmium ions and 0.5 mM L-cysteine. Scale bar, 500 nm. (B) EDX spectroscopy analysis showing the elemental distribution on the surface of E. coli/pET-28a-TtCSA1 after incubation for 48 h in LB medium containing 0.45 mM cadmium ions and 0.5 mM L-cysteine. Scale bar, 500 nm. (C) The elemental distribution analysis was shown using EDX spectroscopy in E. coli/pET-28a after 48 h of incubation in wastewater containing 0.6 mM cadmium ions and 1 mM L-cysteine. Scale bar, 500 nm. (D) The elemental distribution analysis was shown using EDX spectroscopy in E. coli/pET-28a-TtCSA1 after 48 h of incubation in wastewater containing 0.6 mM cadmium ions and 1 mM L-cysteine. Scale bar, 500 nm.
Ijms 26 03685 g006
Figure 7. E. coli/pET-28a-TtCSA1 effectively remove Cadmium in rich medium. (A) Removal rates of cadmium at different concentrations by E. coli/pET-28a and E. coli/pET-28a-TtCSA1 in LB medium supplemented with 0.5 mM L-cysteine. (B) Mass of cadmium removed per gram of dry weight of the biomass from the experiments in (A). The symbols ns and *** represent non-significance (p > 0.05) and extremely significant differences (p < 0.01), respectively.
Ijms 26 03685 g007
Figure 8. E. coli/pET-28a-TtCSA1 effectively removed cadmium in wastewater. (A) Removal rates of cadmium by E. coli strains in wastewater containing 0.3 mM Cd2+, with the addition of 0, 0.5, 1, and 2 mM L-cysteine. (B) Mass of cadmium removed per gram of dry weight of the biomass from the experiments in (A). (C) Removal rates of cadmium by E. coli strains in wastewater containing 2 mM L-cysteine, with varying concentrations of Cd2+ (0.3, 0.45, 0.6, 0.75, and 0.9 mM). (D) Mass of cadmium removed per gram of dry weight of the biomass from the experiments in Figure C. The symbols ns, *, and *** represent non-significance (p > 0.05), significant differences (p < 0.05), and extremely significant differences (p < 0.01), respectively.
Ijms 26 03685 g008
Disclaimer/Publisher’s Note: The statements, opinions and data contained in all publications are solely those of the individual author(s) and contributor(s) and not of MDPI and/or the editor(s). MDPI and/or the editor(s) disclaim responsibility for any injury to people or property resulting from any ideas, methods, instructions or products referred to in the content.

