1. Introduction
IgG4–related disease (IgG4–RD) is an autoimmune condition characterized by the infiltration of affected tissues by IgG4–positive plasma cells. It is a systemic disease that can affect several organs and tissues, leading to inflammation, fibrosis, and the formation of pseudotumors. IgG4–RD was initially identified in the pancreas (IgG4–related pancreatitis), but it can involve the pancreas, salivary gland, lacrimal gland, kidney, lung and retroperitoneum, giving rise to a spectrum of clinical manifestations [
1].
The clinical presentation of IgG4–RD varies depending on the organs involved. Patients may experience swelling, pain, and dysfunction of affected organs. In some cases, pseudotumors or mass–like lesions develop. An elevated serum level of IgG4 is a characteristic feature, but the diagnosis is typically confirmed by radiological and histopathological examination of biopsy samples [
2]. Histopathological examination of affected tissues reveals a dense lymphoplasmacytic infiltrate, fibrosis, and obliterative phlebitis (inflammation of veins). The presence of IgG4
+ plasma cells is a hallmark of IgG4–RD [
3].
Lacrimal glands (LGs) are commonly affected in autoimmune and inflammatory diseases because of their unique immunological and anatomical characteristics. The glands contain lymphoid tissue and are involved in the production of tears, which contain antimicrobial factors and immunoglobulins [
4]. This immunological environment makes the lacrimal glands susceptible to immune dysregulation in autoimmune diseases such as Sjögren syndrome and Mikulicz disease (a subtype of IgG4–related disease). The susceptibility of LGs to autoimmune involvement is a result of their immunological complexity, high density of immune cells, association with systemic autoimmune diseases, presence of gland–specific antigens, and their role in maintaining ocular surface health. The immunological and anatomical characteristics of LGs make them a common target in autoimmune and inflammatory conditions affecting the eyes and surrounding tissues [
4,
5].
Treatment of IgG4–RD typically involves corticosteroids, such as prednisone, to suppress the inflammatory response. In some cases, immunosuppressive medications may be considered. The response to treatment can be variable, and long–term management may be required. The variable treatment responses in IgG4–RD, often reliant on systemic steroids, underscore the intricate balance between immune dysregulation and therapeutic interventions. Exploring the dynamics of treatment responses and the immunologic influence on the clinical course of IgG4–RD could enable the development of tailored treatment regimens, optimization of outcomes, and identification of novel therapeutic targets [
5].
IgG4 RD, which is marked by aberrant immune responses, has been a focus of research into immune checkpoint (IC) modulation. ICs, which maintain immune homeostasis, are implicated in the pathogenesis of autoimmune diseases. Understanding these features is crucial for the development of IC inhibitors and other immunotherapies. The challenge lies in modulating the immune response to address the features of the condition, avoiding excessive immune activation in autoimmune diseases and enhancing immune recognition and response. Although our understanding of ICs in autoimmune diseases has advanced, the intricate relationship between IC and IgG4–RD, especially with LG involvement, is nascent [
6].
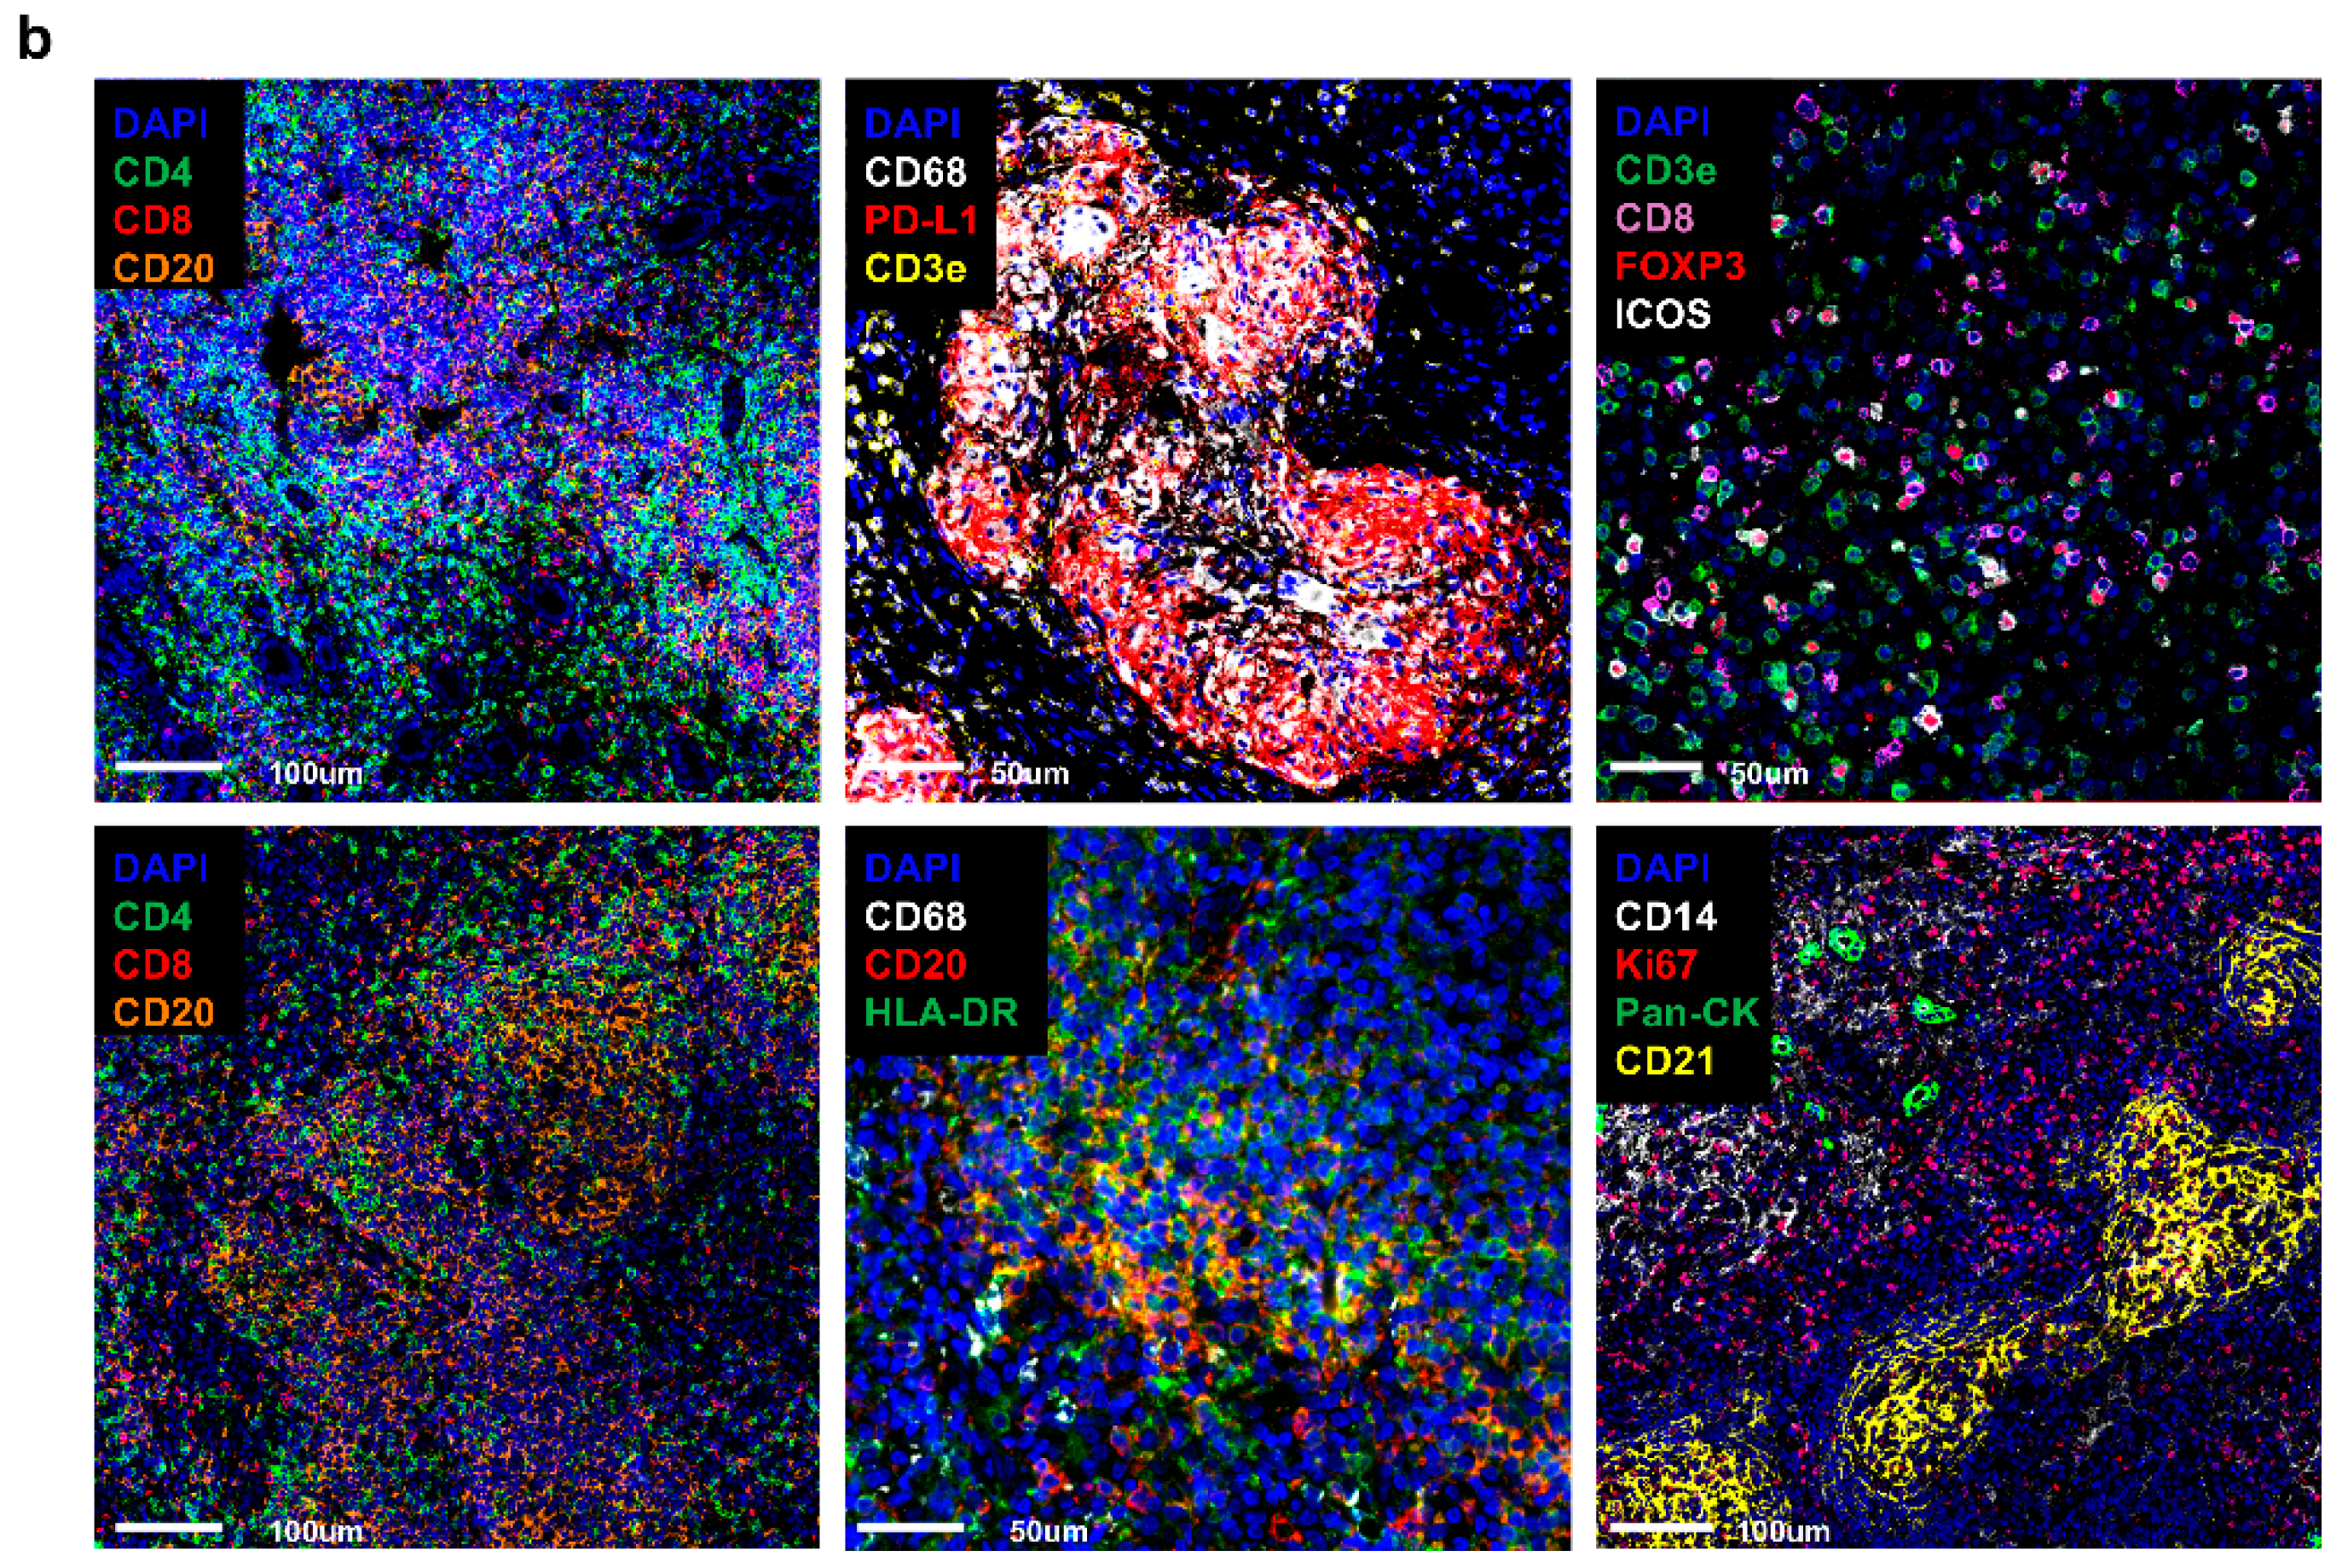
We explored the complex relationships between LG involvement, IC dysregulation, and clinical presentation in multiple organs. Although ICs are reportedly important in several autoimmune diseases, their functions in IgG4–RD, particularly with LG involvement, are unclear. We used immunohistochemical techniques, including CODEX (CO–Detection by indEXing), to evaluate the IC landscape in LG tissues by spatial cell biology analysis. The aim was to identify IC signatures and assess their implications in IgG4–RD.
To investigate the interplay between ICs and the clinical features of IgG4–RD with LG involvement, we assessed the correlations of the serum IgG4 level, IC modulation, and ocular manifestations and evaluated the effects of ICs on treatment responses in IgG4–RD with LG involvement. The findings contribute to the development of personalized therapeutic strategies and provide insight into the pathogenesis of IgG4–RD.
3. Discussion
IgG4–RD is an idiopathic, multi–organ inflammatory state that can manifest as chronic, relapsing, sclerosing inflammation in virtually any organ system. There is a wide range of presentations in orbital and ocular inflammation including sclerouveitis and pachymeningitis with optic neuritis resulting in permanent visual loss [
7]. IgG4–RD in the orbit, in particular in the LG, typically does not show obliterative phlebitis, although the plasma cell–rich inflammatory infiltrate is often tightly perivascular, and the number of IgG4–positive plasma cells is striking [
8]. Interestingly, in most patients, the serum level of IgG4 is elevated, and the orbit may be the initial or sometimes only manifestation of the disease [
9].
This study includes significant findings aimed at better understanding the diagnosis and immunological characteristics of IgG4–related disease (IgG4–RD). In particular, it was confirmed that conventional diagnostic criteria (such as serum IgG4 levels and IgG4/IgG ratios) have limited correlation with clinical manifestations, emphasizing the need for new diagnostic criteria tailored to different subtypes of IgG4–RD. These results suggest that immunological patterns may vary across different patient groups, highlighting the necessity for developing more refined diagnostic approaches. Such advancements could contribute to the early detection of IgG4–RD and the formulation of accurate treatment strategies.
Autoimmune responses are characterized by the activation of autoreactive T cells and the production of autoantibodies. This process results in inflammation and tissue damage due to the immune system’s attack on healthy cells. In autoimmune diseases, IC dysregulation may contribute to excessive immune activation against self–antigens, leading to autoimmunity. ICs such as PD–1 and CTLA–4 may modulate these autoreactive responses and promote the evasion by cancer cells of immune detection and destruction [
10]. The ICOS/ICOSL and PD–1/PD–L1 pathways are important in the early stages of neuromyelitis. ICOS and PD–1 have potential as therapeutic targets and biomarkers for the differential diagnosis of early–stage autoimmune neuromyelitis [
10]. Inflammation and damage occur at sites of autoimmune attack, which encompass heterogeneous interactions between immune cells and stromal elements, thereby influencing disease progression. Therefore, neighbor analysis of infiltrating immune cells and the immunosuppressive microenvironment are crucial considerations in immunotherapy.
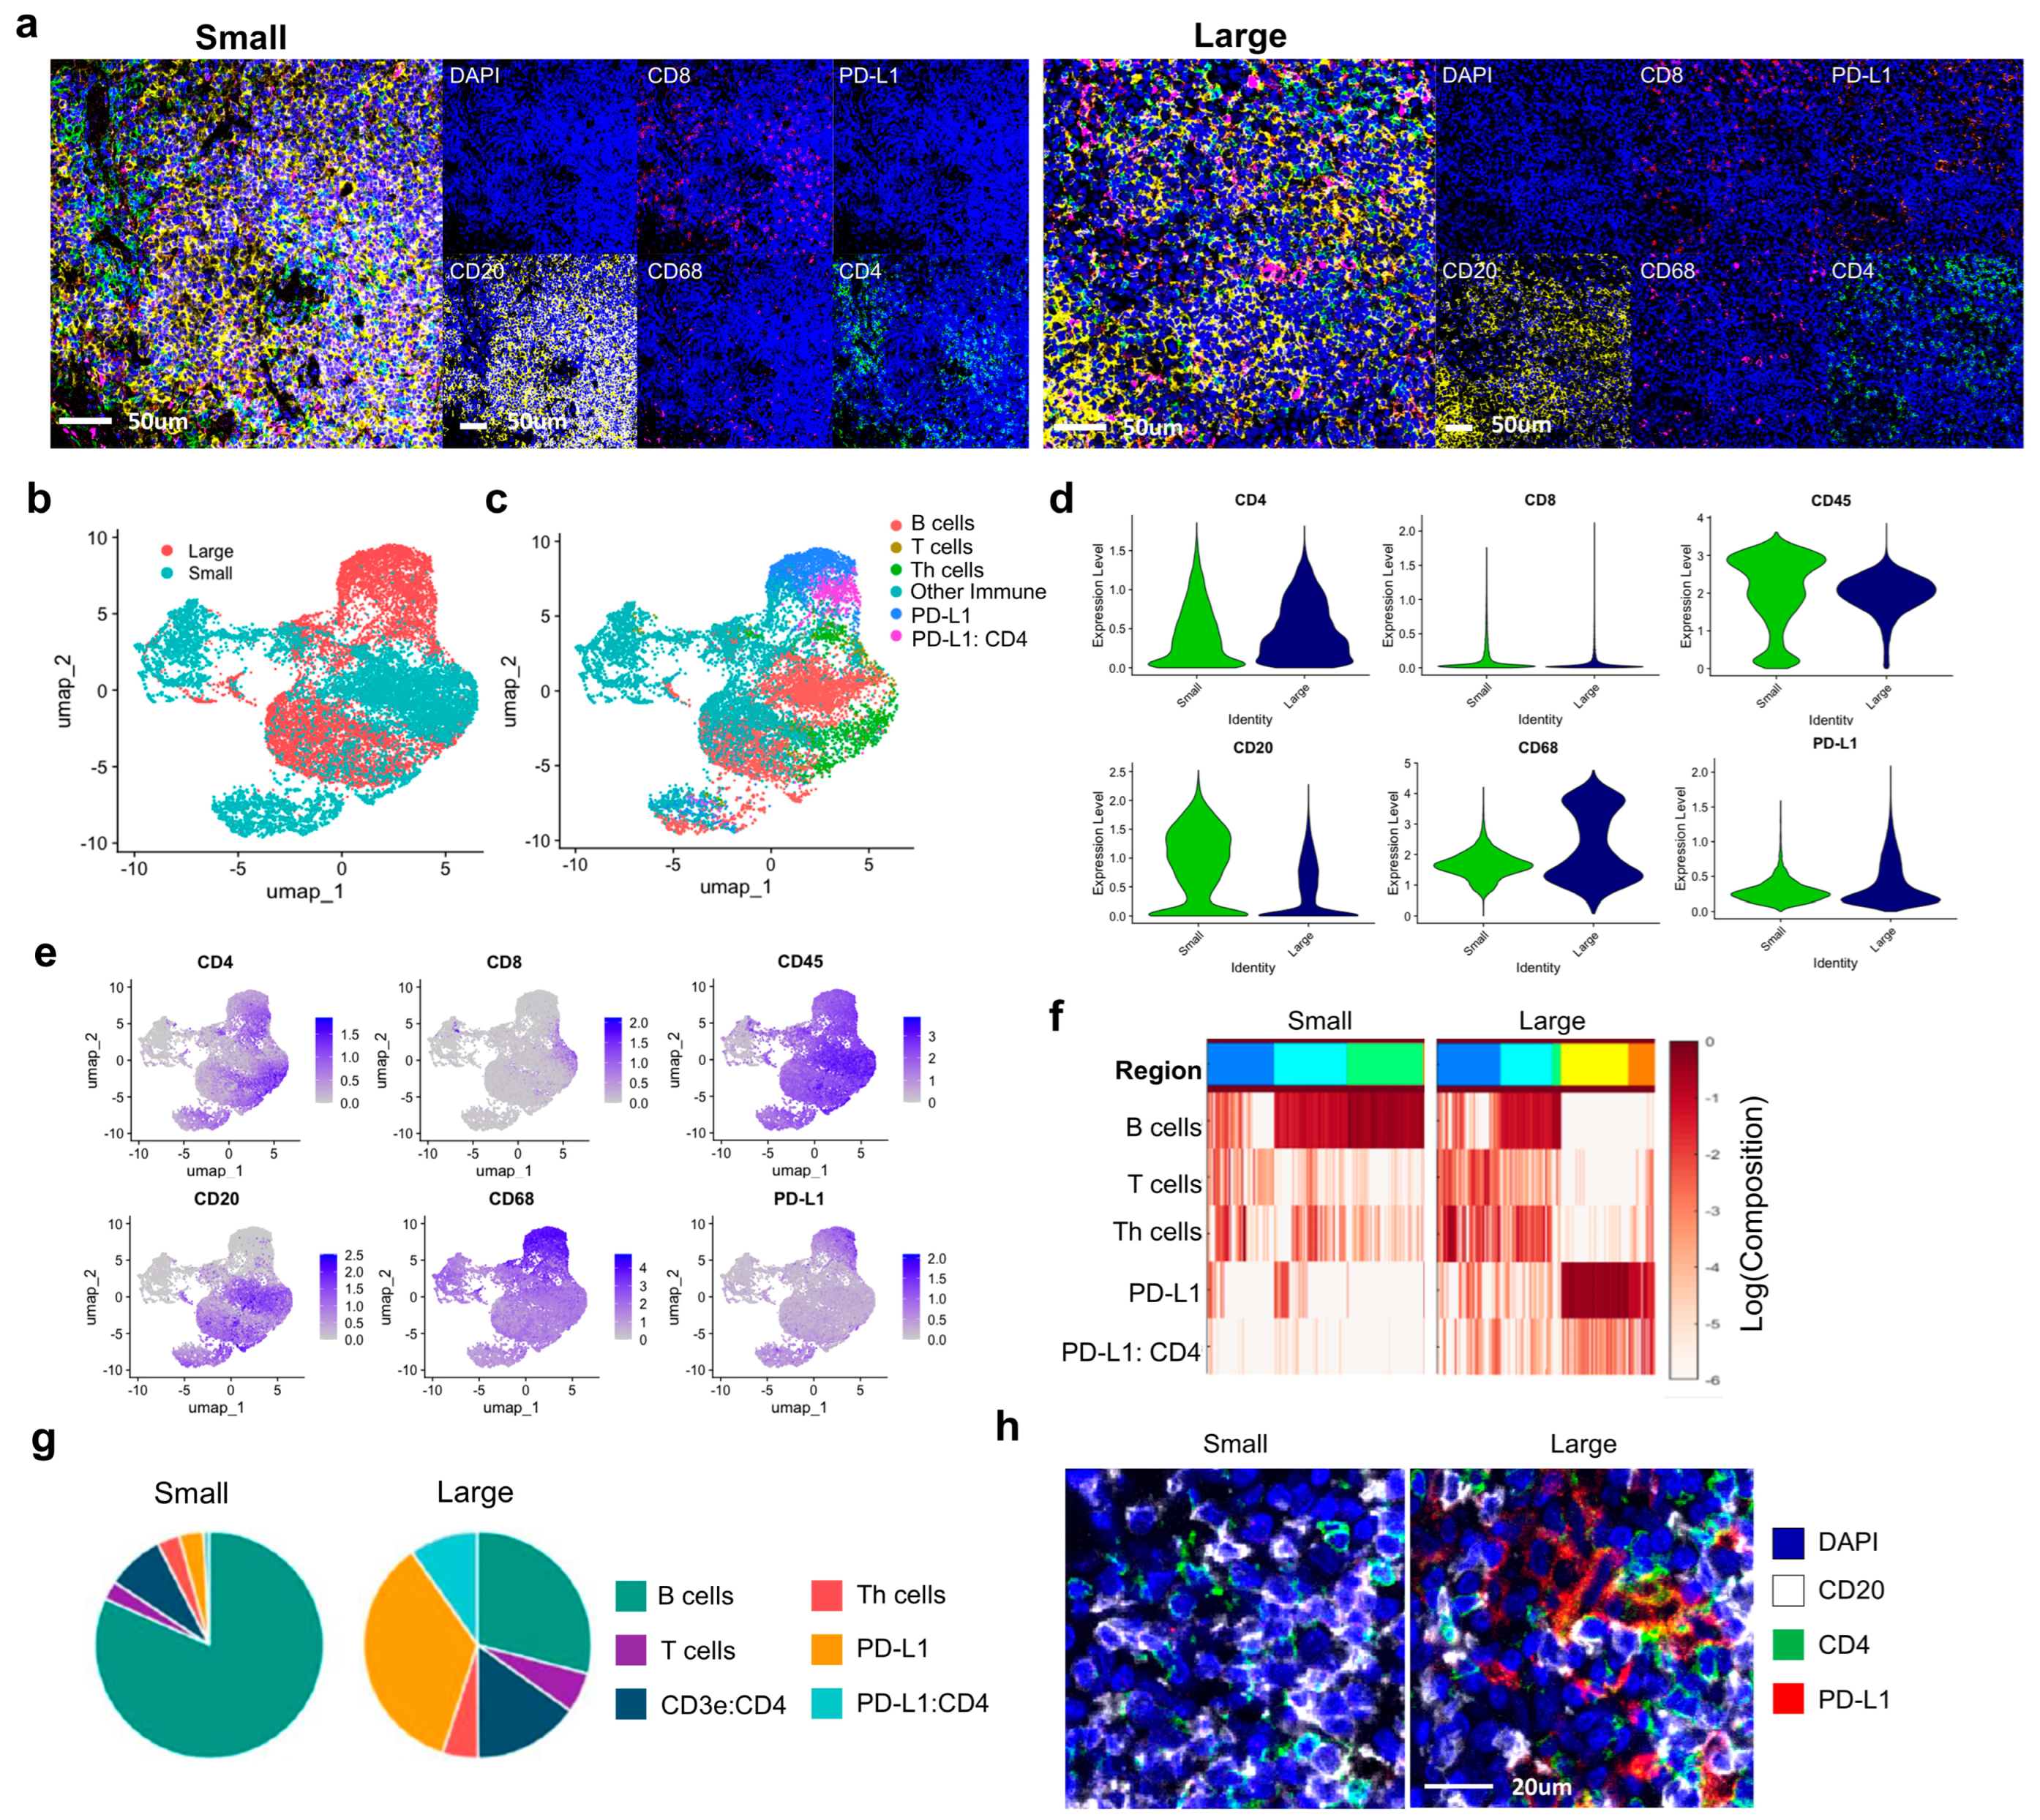
The increased expression of CD11c+ dendritic cells (DCs) and PD–L1 in non–responsive patients suggests that an immunosuppressive environment may be associated with treatment resistance (
Figure 3). This highlights how interactions among these immunosuppressive cells and molecules can facilitate immune regulation and disease progression within the tissue. The fact that the interaction between PD–L1 and CD11c+ DCs is particularly pronounced in non–responsive patients suggests that they may act as key factors in immune suppression and could be considered potential targets for new therapeutic approaches.
However, we must note that our unfavorable group included only one patient, which limits the strength of these conclusions. This study is exploratory, and the observed association does not establish a direct causal link between PD–L1+ DCs and treatment resistance. Further large–scale, multi–center studies are needed to confirm our findings and to clarify whether PD–L1+ DC enrichment reflects a compensatory immunosuppressive mechanism or potentially contributes to disease progression. Our findings of increased PD–L1 expression support the notion that, beyond conventional autoimmune mechanisms, immune checkpoint pathways may play a pivotal role in the pathogenesis of IgG4–RD. Indeed, Arora et al. [
11] demonstrated concurrent overexpression of PD–L1, PD–1, IDO1, and LAG3 in multiple organs (e.g., pancreas, salivary glands, lungs), and Zhang et al. [
12] further suggested that PD–L1 and PD–L2 could impact Treg differentiation. These observations indicate that IgG4–RD may not be driven solely by classic autoimmunity but also by the immunomodulatory effects of checkpoint molecules. Nevertheless, current evidence remains limited by small sample sizes and a lack of large–scale prospective studies. Future research should evaluate the causal link between PD–L1 expression and key clinical features—such as disease progression, fibrosis, and therapeutic response—while also clarifying whether immune checkpoint inhibitor therapy may trigger or exacerbate IgG4–RD in susceptible individuals. Expanding the evidence base in this area is critical for refining personalized treatment approaches.
Recent evidence also indicates that immune checkpoint molecules, particularly the PD–1/PD–L1 pathway, may play a pivotal role in the pathogenesis of IgG4–related disease. Multiple studies have shown that PD–L1 is overexpressed in a range of IgG4–RD lesions, including those of the pancreas, salivary glands, and lungs, often correlating with Treg infiltration and increased fibrosis [
11,
12]. These findings suggest that PD–L1–mediated immune suppression contributes to local tissue remodeling and disease progression. Furthermore, recent case reports have documented new–onset or exacerbation of IgG4–RD following immune checkpoint inhibitor therapy [
13,
14]. Taken together, these observations imply that PD–1/PD–L1 signaling not only underpins the immunopathology of IgG4–RD but also warrants careful clinical surveillance for IgG4–RD development or flare in patients receiving anti–PD–1/PD–L1 immunotherapies. Consequently, targeting the PD–1/PD–L1 axis, with close monitoring for potential complications, may offer additional insights into personalized treatment strategies for IgG4–RD in the future.
The findings that PD–L1 plays a crucial role in immune suppression and tissue stabilization in IgG4–RD present an opportunity for new treatment strategies. The potential of PD–L1–targeted immune therapies needs to be further explored through additional studies. Understanding the differences in immune responses between fibrotic and non–fibrotic regions in particular provides important insights for developing differentiated treatment strategies. Spatial analysis using Cytomap goes beyond simple quantitative analysis of cells and offers critical insights into the interactions and spatial distribution of immune cells, helping to better understand the tissue microenvironment. This study visually confirmed that PD–L1 expression is more widely distributed in larger tumor groups, demonstrating that spatial analysis is essential for understanding disease progression and immune response patterns.
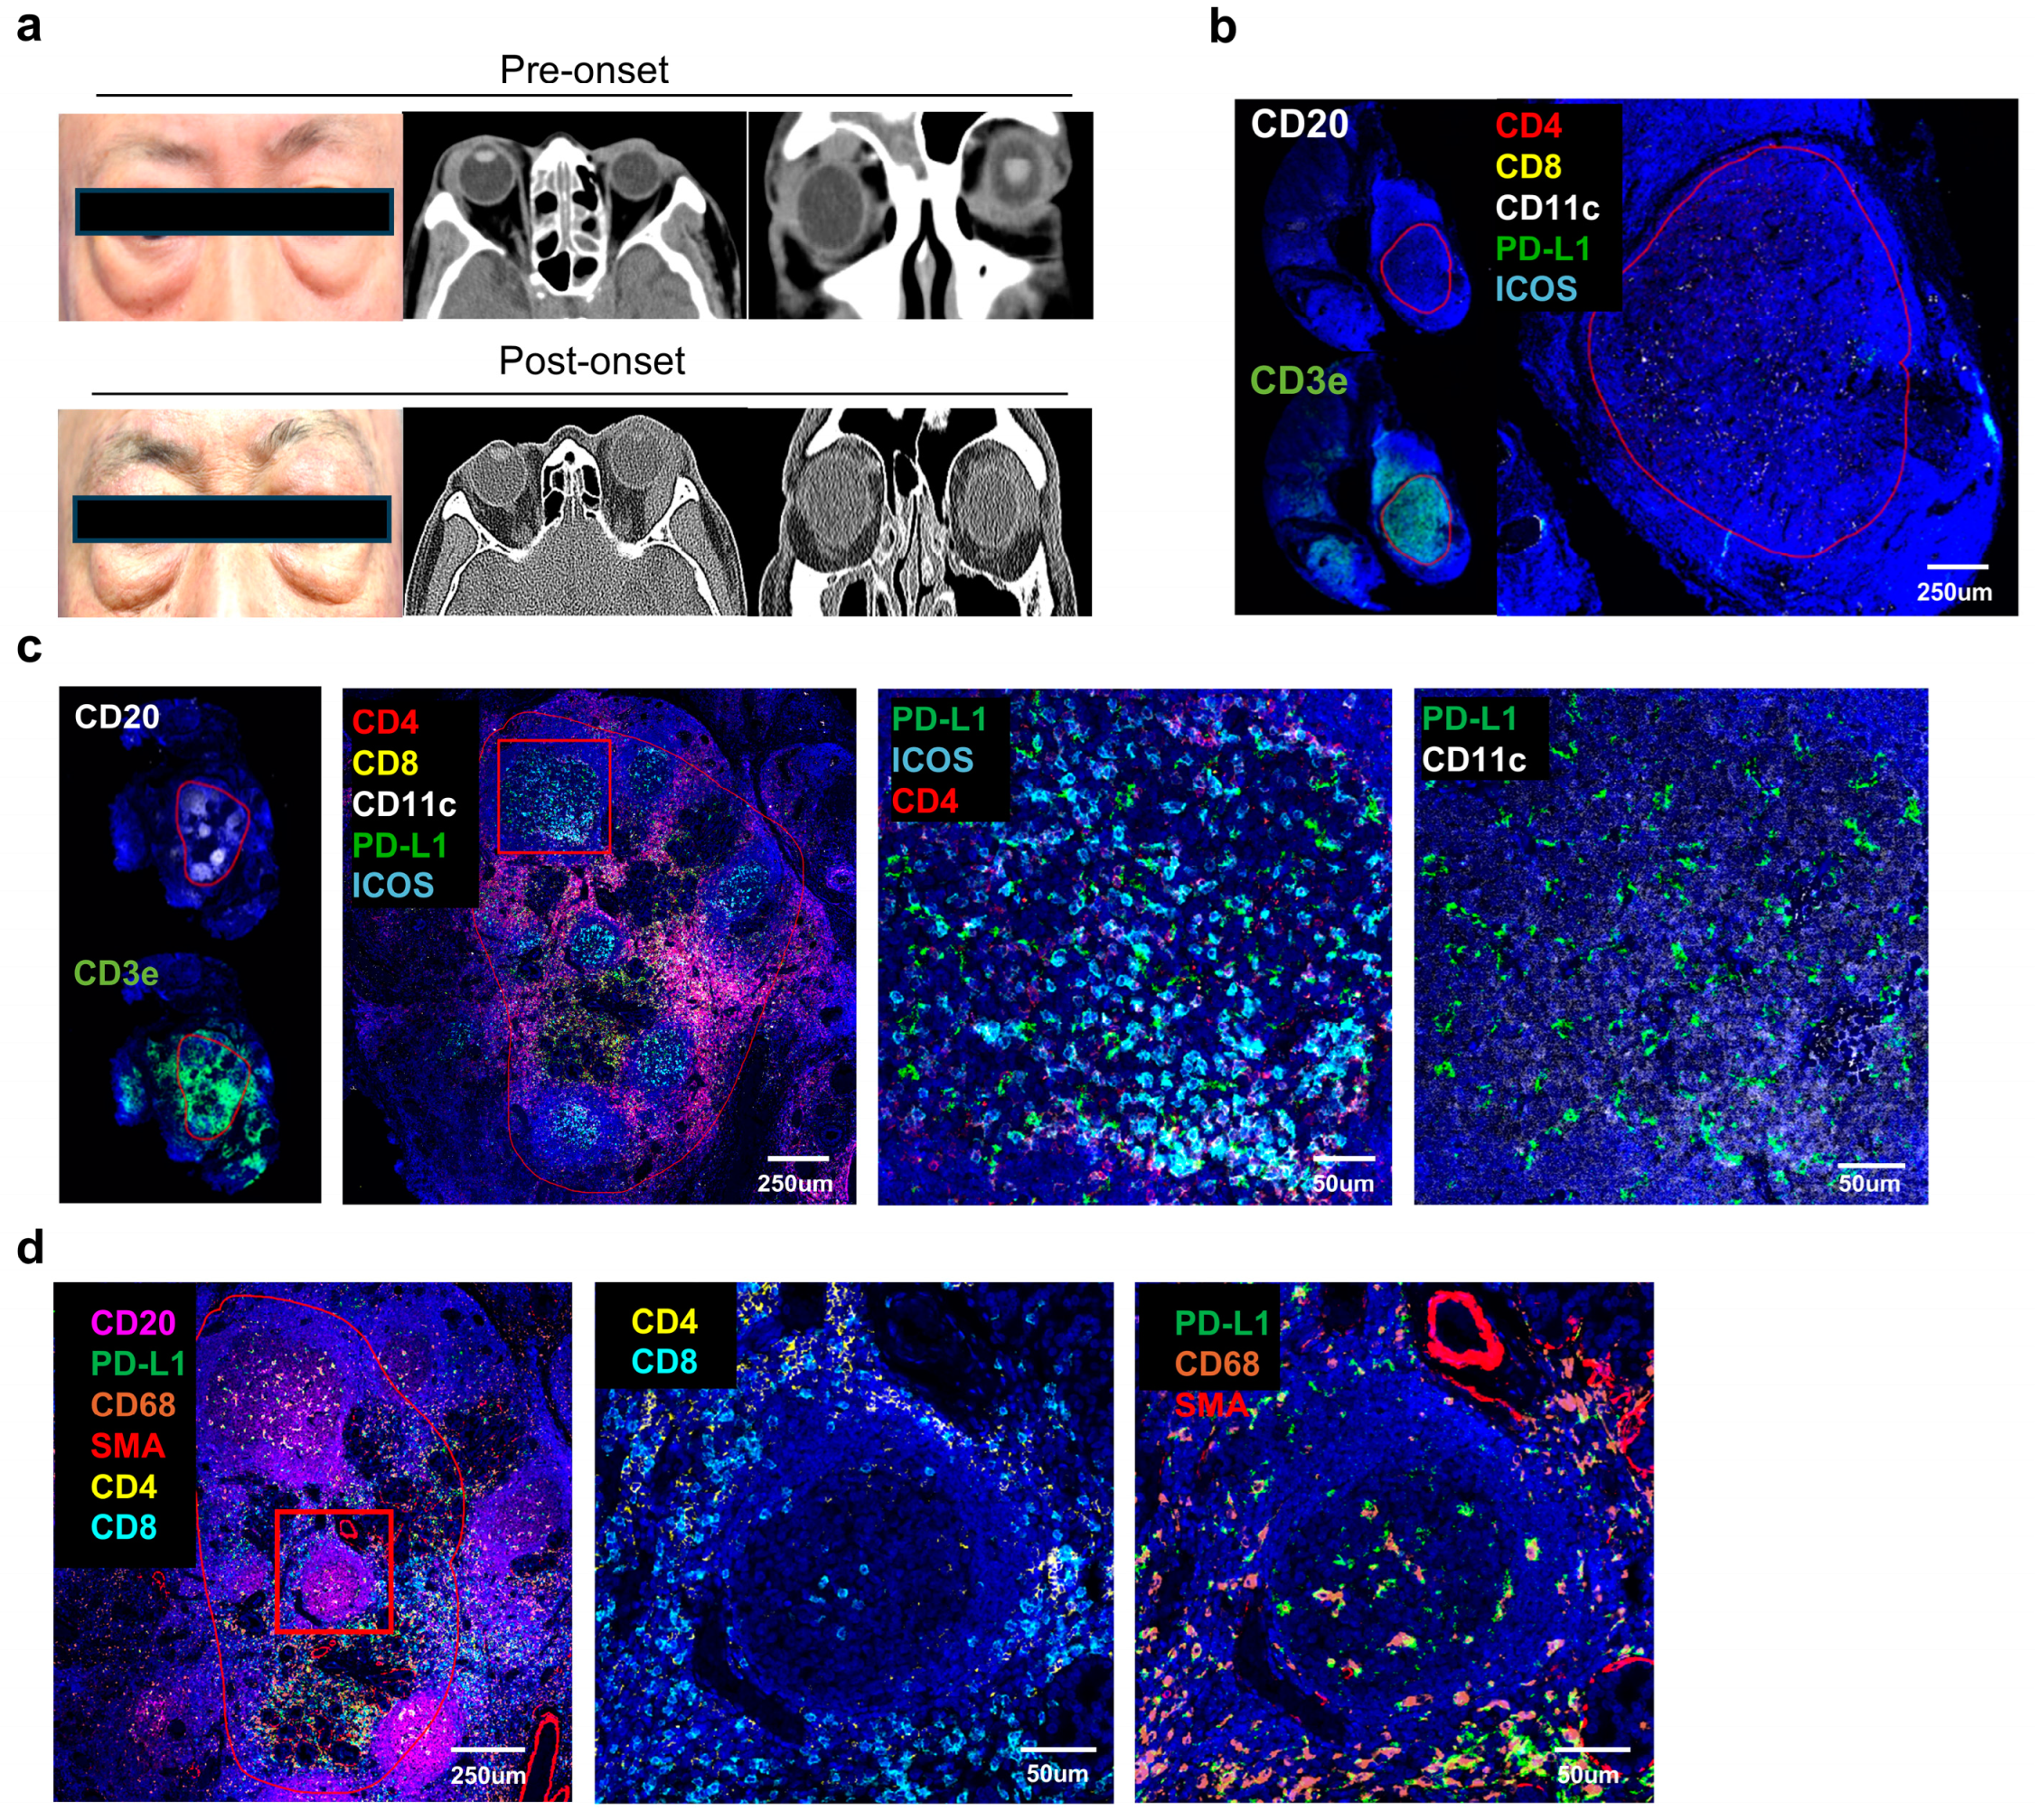
To our knowledge, there are no reports of LG–specific IgG4–RD with features similar to late–onset IgG4–RD developing from nonspecific dacryoadenitis. A middle–aged female was reported to present with swelling of the lower lid for enlargement of the right inferior rectus muscle belly [
15]. She presented 6 years prior with upper eyelid swelling, and five surgical biopsies revealed inflammatory pseudotumor, chronic inflammation, inflammatory lesions, IgG4–RD, and extranodal marginal zone B–cell lymphoma of mucosa–associated lymphoid tissue (MALT lymphoma) [
15,
16]. A pathological analysis encompassing multiple immunohistochemical assays and cell neighbor analysis could provide insight into the immunopathogenesis of IgG4–RD developing from chronic inflammation in an extraocular muscle.
Because a subset of lymphomas develops via chronic inflammation, such as
Helicobacter pylori–associated gastric MALT lymphoma, a subset of ocular adnexal MALT lymphomas (OAMLs) in the head–and–neck region arises from pre–existing IgG4–RD [
17]. IgG4–positive OAML has clinical features similar to IgG4–RD, such as involvement of the LG, extraocular muscles, and infraorbital nerve and lymph nodes but not the conjunctiva. However, treatment outcomes are favorable despite the underlying IgG4–RD [
10]. Large numbers of IgG4
+ plasma cells are present in lymphoma, suggesting a relationship between lymphoma and IgG4–related ocular disease [
15,
16]. The function and mechanism of IgG4 expression in the pathogenesis of lymphoma have been investigated. However, IgG4 expression may not markedly alter the recurrence of lacrimal lymphoma. This study was limited by its retrospective design and lack of immunohistological analysis, which prevented evaluation of between–group differences according to preoperative history of glucocorticoids, ocular nerve thickening, serum IgG4 level, and prognosis [
18]. Among IgG4–RD–specific causes, AID upregulation in addition to inflammation and NK–κB compounds or chromatin modifiers likely promote to develop lymphoma as drivers of oncogenesis in IgG4–RD to IgG4
+ MALT lymphoma [
18,
19].
This study demonstrates that interactions between PD–L1 and immune cells in IgG4–RD are associated with treatment resistance, underscoring the importance of personalized treatment strategies. However, this study has limitations, including the sample size and the lack of coverage for various organs affected by IgG4–RD.
While PD–L1 signaling is typically immunosuppressive, its exact role in autoimmune diseases, including IgG4–RD, remains complex. Dysregulation of PD–1/PD–L1 interactions has been implicated in various autoimmune conditions, where defective PD–1 signaling leads to persistent immune activation. In IgG4–RD, the presence of PD–L1+ dendritic cells (DCs) might reflect a compensatory mechanism aimed at suppressing excessive immune activation. However, whether this contributes to disease progression or is merely a consequence of chronic inflammation remains unclear and warrants further investigation.
Moreover, we did not measure soluble PD–1 (sPD–1) or soluble PD–L1 (sPD–L1) in the current study. Given that these soluble forms can act as decoys and modulate T cell activation, future studies should investigate sPD–1/sPD–L1 in IgG4–RD to determine whether they influence disease pathogenesis or therapeutic outcomes.
Future research should include multi–center clinical trials to evaluate the efficacy and safety of PD–L1–targeted therapies, as well as explore the immunological characteristics and diagnostic criteria differences among various IgG4–RD subtypes. Additionally, studying the dynamic changes among immune cells through spatial analysis could contribute to predicting disease progression and developing new treatment strategies.
Such follow–up studies would enhance the understanding of the complex immunological features of IgG4–RD, ultimately enabling the development of personalized therapies that improve patient outcomes.
4. Methods and Materials
4.1. Tissue Material
Our study included both male and female human participants, and similar findings were observed across both sexes. IgG4 samples were obtained from patients treated at eye department in CHA university Bundang medical center. Written informed consent was obtained from all patients. The use of diseased tissues for this research was approved by the Institutional Review Board (IRB) of CHA university Bundang medical center (IRB No. 2023-04-13). Seventeen patients were diagnosed with IgG4–related ophthalmic disease including possible, probable and definite disease groups based on the 2019 ACR/EULAR Classification Criteria from April 2017 to April 2023. They were treated with steroid and other medicine such as mycophenolate mofetil, azathioprine, and hydroxychloroquine. FFPE (Formalin–Fixed Paraffin–Embedded) tissue blocks of a cohort of 17 patients were retrieved from the pathology department at CHA university Bundang medical center (including 2 normal tissues and 23 IgG4 disease tissues). Detailed clinical information and characteristics for each patient are summarized in
Table 1 and
Table 2. Under the supervision of H.L. and K.I.K., cores from 23 key sites of IgG4 involvement were extracted to create a tissue microarray with a core diameter of 0.3 μm. TMAs were sectioned at a thickness of 4 μm and used for tissue staining. Finally, we could successfully analyze twenty–one samples including lacrimal gland (
n = 14), eyelids (
n = 5) and orbit (
n = 3), and normal samples.
4.2. Comparative Group Classification Criteria
In this study, the cohort of twelve patients diagnosed with IgG4–related disease in the lacrimal gland was divided into two groups based on serum diagnostic criteria and clinical symptoms including size, fibrosis, and treatment response. In categorizing patients (Ave ± SD, 362.7 ± 378.6 mg/dL) into two groups based on serum levels, tissues from 8 patients with pre–treatment serum IgG4 concentrations above 135 mg/dL were classified as high, while those from 4 patients with levels below 135 mg/dL were designated as low. For the analysis of mass size, axial length was measured from the anterior to posterior tips and axial width was measured from the widest point perpendicular to the length in orbital CT scan. The size was defined as the average of multiplications of length and width from both axial and coronal images. Twelve patients (median 35.3~278.7 mm2, 100.0 mm2) were divided into groups. The median value of 100.0 mm2 was used as a threshold to define the groups as either large or small. For the analysis of fibrosis, which was predominantly mild in 3 patients reviewed by K.I Kim, two criteria were established for definition. The first criterion defined regions where SMA was expressed around the Secondary Lymphoid Organ (SLO) structures as fibrotic, whereas structures showing only SLO were categorized as non–fibrotic. For treatment response, patients were defined at 6 months post–treatment. Response was defined as complete clinical and radiological resolution of ocular signs and symptoms. No response was defined as no improvement or disease worsening after 6 months of treatment. They included 8 responsive patients and 4 non–responsive patients.
4.3. Antibody Conjugation and Validation
We used commercial antibodies specifically intended for CODEX applications (PhenoCode Discovery Immune Profiling Human Protein Core CATALOG # PCDPC001). To ensure their performance, we validated the antibodies using immunohistochemistry (IHC) on IgG4–RD lacrimal gland tissue. This validation process focused on achieving appropriate staining intensity, clear specificity, and an acceptable signal–to–noise ratio. Antibodies that demonstrated satisfactory results under these criteria were selected. Following the manufacturer’s recommended protocols, we proceeded with the conjugation of these validated antibodies. To ensure the quality and specificity of our conjugates, we compared the staining results from the CODEX single staining on IgG4–RD in lacrimal gland tissue with those obtained using the conjugated antibodies. Additionally, a cross–validation was performed using manual IHC techniques. For further validation, we utilized the online database, The Human Protein Atlas (
https://www.proteinatlas.org) (accessed on 15 October 2023). This comprehensive resource provided valuable insights, enhancing the robustness of our validation process.
4.4. Anti–C Reactive Protein Antibody Barcode Conjugation and Purified Antibody Reduction
Anti–C Reactive Protein [Y284]–BSA and Azide free antibody (Abcam, ab271830, Cambridge, UK) was used to create barcode conjugated antibodies for PhenoCyler–Fusion Multiplex–IHC platform (Akoya Biosciences, Marlborough, MA, USA). A total of 50 ug of CRP antibody, which is the required concentration for conjugation, was measured and calculated using IgG settings of Nanodrop (Agilent Technologies, Santa Clara, CA, USA). A 50 kDa MWCO filter was used for the purified antibody reduction process (Millipore, UFC505024, Burlington, MA, USA). Further, 500 μL of Filter Blocking Solution (Akoya Biosciences, #700009) was added to the filter and spun down at 12,000× g for 2 min. The remaining liquid in the filter and flow–throughs were removed. The corresponding volume for 50 ug of anti–CRP antibody was added into the MWCO filter and spun down at 12,000× g for 8 min to concentrate the purified antibody solution. In order to initiate the antibody reduction, Antibody Reduction Master Mix was made by mixing 6.6 μL of Reduction Solution 1 and 275 μL of Reduction Solution 2 (Akoya Biosciences, #700009). Next, 260 μL of prepared Antibody Reduction Master Mix was added to the filter unit and incubated for 25 min at RT. The tubes were spun down at 12,000× g for 8 min and flow–throughs were discarded. The antibody solution was exchanged by adding 450 μL of Conjugation Solution (Akoya Biosciences, #700009) to the column and having spun down at 12,000× g for 8 min.
4.5. Barcode Conjugation
CODEX Barcode–BX002 for CRP antibody was first resuspended with 10 μL of molecular biology grade water. A total of 210 μL of Conjugation Solution was added to the suspended barcode vial. The prepared CODEX Barcode Solution was transferred to the column that contained antibodies and incubated for 2 h at RT. The incubated solution was spun down at 12,000× g for 8 min and flow–through was discarded. Then, 450 μL of Purification Solution (Akoya Biosciences, #700009) was added into the column and spun down at 12,000× g for 8 min. This purification step was repeated a total of 3 times. After the purification, 100 μL of Antibody Storage Solution (Akoya Biosciences, #700009) was added into the column. While the filter contained the conjugated antibody solution, a new empty tube was placed upside down on top of the filter. Next, the filter was inverted and spun down at 3000× g for 2 min. Barcode conjugated antibodies were collected and stored at 4 °C for 2 days then used for staining. Conjugated antibodies were validated with gel electrophoresis following the Akoya Biosciences’ guideline prior to their usage.
4.6. FFPE Tissue Pre–Treatment and Antibody Staining
A IgG4–RD TMA sample slide was first baked in an incubator at 65 °C for 1 h to melt paraffin. Then, tissue deparaffinization and hydration was performed in the following order for 5 min each: Xylene, Xylene, 100% Ethanol, 100% Ethanol, 90% Ethanol, 80% Ethanol, 70% Ethanol, 50% Ethanol, 30% Ethanol, ddH2O, and ddH2O sequentially. Next, the sample slide was fixed with 4% Paraformaldehyde Solution in PBS (T&I, BPP–9004) for 1 h and washed with ddH2O for 5 min each twice prior to proceeding to antigen retrieval. The stock 10× AR9 Solution (Akoya Biosciences, #AR9001KT) was diluted to 1× with ddH2O for the antigen retrieval. Sample slide was then placed in the vessel with 250 mL of 1× AR9 buffer fully covering the slide in the pressure cooker. The cooker was set at high pressure (~11.6 PSI/110 °C) with a cooking duration of 20 min. Once the run was complete, the sample slide was taken out from the cooker and cooled down at RT for 1 h. After cooling by room temperature, the sample slide was washed with ddH2O and incubated for 2 min. Next, the sample slide was incubated with the Hydration Buffer (Akoya Biosciences, #7000017) for 2 min and the cycle was repeated one more time. The sample slide was then incubated with the Staining Buffer (Akoya Biosciences, #7000017) for 20 min to equilibrate the sample.
4.7. FFPE Tissue Staining
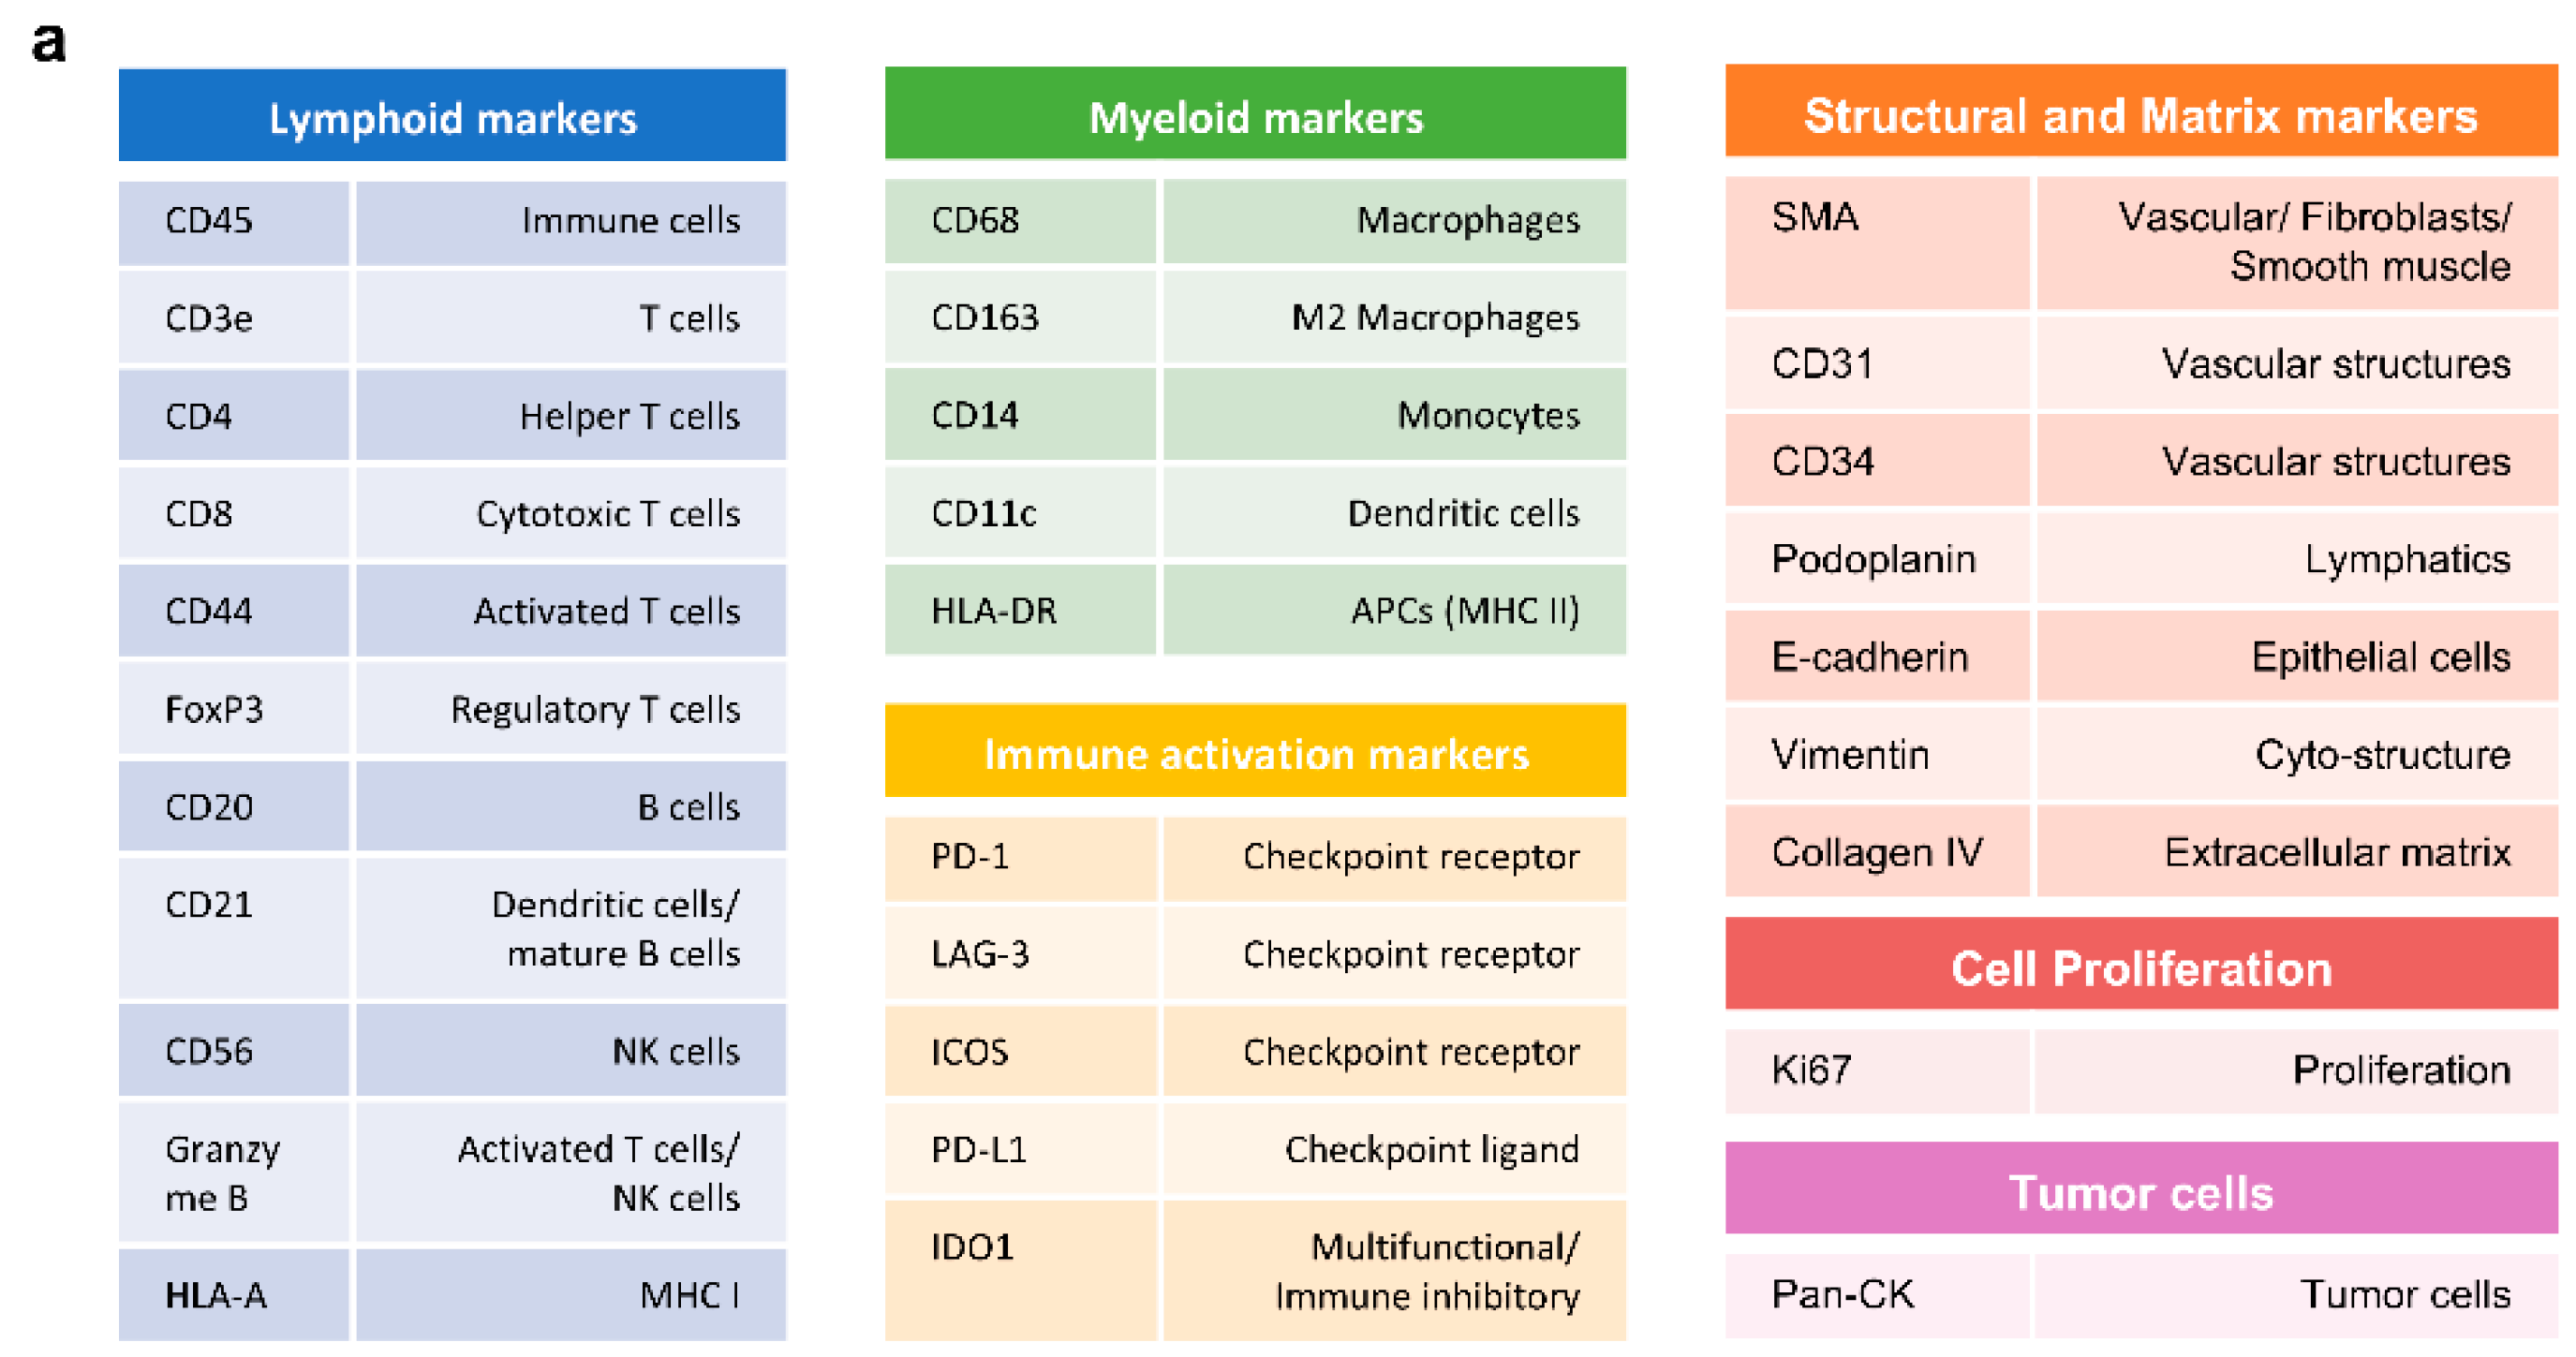
Antibody Cocktail Solution was prepared with 31 antibodies of interest. The following antibody panel was designed to categorize into different cell types: immune, stromal, proliferative cells, immune check–point proteins. The antibody panel consisted of the following inventoried antibodies: CD8–BX026 (Akoya Biosciences, #4250012, Marlborough, MA, USA), E–cadherin–BX014 (Akoya Biosciences, #4250021), CD14–BX037 (Akoya Biosciences, #4450047), Ki67–BX047 (Akoya Biosciences, #4250019), CD45RO–BX017 (Akoya Biosciences, #4250023), CD163–BX069 (Akoya Biosciences, #4250079), Granzyme B–BX041 (Akoya Biosciences, #4250055), CD21–BX032 (Akoya Biosciences, #4450027), CD44–BX005 (Akoya Biosciences, #4450041), CD34–BX025 (Akoya Biosciences, #4250057), Podoplanin–BX023 (Akoya Biosciences, #4250004), PD–L1 (Akoya Biosciences, #4550072), CD68 (Akoya Biosciences, #4550113), CD4 (Akoya Biosciences, #4550112), HLA–DR (Akoya Biosciences, #4550118), FOXP3 (Akoya Biosciences, #4550071), Collagen IV (Akoya Biosciences, #4550122), CD11c (Akoya Biosciences, #4550114), ICOS (Akoya Biosciences, #4550117), CD3e (Akoya Biosciences, #4550119), LAG3 (Akoya Biosciences, #4550058), CD45 (Akoya Biosciences, #4550121), PD–1 (Akoya Biosciences, #4550038), IDO1 (Akoya Biosciences, #4550123), CD20 (Akoya Biosciences, #4450018), CD31 (Akoya Biosciences, #4450017), SMA (Akoya Biosciences, #4450049), Vimentin (Akoya Biosciences, #4450050), HLA–A (Akoya Biosciences, #4450046), Pan–Cytokeratin (Akoya Biosciences, #4450020) and custom conjugated antibodies: CD57–BX029 (BioLegend, #35602, San Diego, CA, USA) (Akoya Biosciences, #5250005). The listed antibodies were kept on ice until use. Antibody Cocktail Stock Solution was brought up to a total of 300 uL by adding the following reagents in a 1.5 mL microcentrifuge tube: Staining Buffer, N–Blocker, G–Blocker, J–Blocker, and S–Blocker (Akoya Biosciences, #7000017). A total of 200 uL of Antibody Cocktail Solution was set apart, and then 57 uL of solution was removed, which is equivalent to the total antibody volume to be added. An appropriate volume of each PhenoCycler Antibody was added to the Antibody Cocktail Solution, bringing the total volume of the final solution to 200 uL (see
Table 3).
The remaining 100 uL of Antibody Cocktail Stock Solution was used for antibodies with 1:500 dilution ratio. A total of 1 uL of the selected antibodies was pipetted out from each vial, then the mixture was diluted with antibody cocktail solution, bringing it up to a total of 5 uL. Next, 2 uL of diluted solution was taken and used for the final staining solution. After all of the antibodies were applied, the tube was gently vortexed. A total if 190 uL of the prepared antibody cocktail staining solution was drawn and quickly dispensed on the sample slide carefully covering the entire tissue. The sample slide was next incubated for 3 h at RT on the rocker set at 30 rpm to ensure even staining. Following the incubation step, the sample slide was additionally fixed with a 1.6% PFA Post–Staining Fixing Solution and PhenoCycler Fixative Reagent (Akoya Biosciences, #7000017), then washed with 1× PBS for use.
4.8. Reporter Plate Design and Preparation
Reporter Stock Solution was first prepared based on the total number of cycles for the experiment in a 15 mL amber tube. Thus, a Reporter Stock Solution required for 16 cycles was prepared with the following reagents: 1× Buffer for PhenoCycler with Buffer Additive (Akoya Biosciences, #700019), Assay Reagent (Akoya Biosciences, #7000002), and Nuclear Stain (Akoya Biosciences, #7000003), adding up to a total volume of 4.8 mL. After reagents were added, the Reporter Stock Solution was gently mixed by inverting the tube several times. Next, a Reporter Master Mix was prepared by aliquoting the Reporter Stock Solution into separate tubes following the number of reporters to be revealed for each corresponding cycle. A total of 5 uL of the Reporter Solution for each antibody was added into the corresponding cycle master mix, with a totaling volume of 250 uL. Once all of the Reporter Master Mix was prepared, 245 uL of the mixed solution for each cycle was transferred into its corresponding well in a 96–well plate (Akoya Biosciences, #7000006). Filled wells were then covered with a foil plate seal (Akoya Biosciences, #7000007).
4.9. Flow Cell Assembly and PCF Run
The sample slide was washed with 1× PBS and cleaned around the tissue to remove excess buffer. The flow cell was attached using the Flow Cell Assembly Device (Akoya Biosciences, #240205). The flow cell attached sample slide was then incubated in 1× PhenoCycler Buffer + Additive for 10 min. Meanwhile, PhenoCycler Designer and Fusion 2.0 corresponding to its experiment plan was set up and all the required reagents and buffer for the PhenoCycler were prepared following the given instructions from Akoya Biosciences. After the incubation, the sample slide was loaded on the PhenoCycler–Fusion to be run for Multiplex–IHC.
4.10. Image Preprocessing and Reprocessing
Raw images of the TMA slide were taken with PhenoCycler–Fusion. We performed preprocessing on the raw data images using Fusion software version 1.0.6. Scan Resolution was set at 0.50 μm (20×) along with the saturation protection only for the DAPI setting. Utilizing the raw and intermediate images of all 15 cycles retrieved through the PhenoImager and the Fusion software, image reprocessing was conducted by calculating the average autofluorescence signal of Atto550, Cy5, AF750 in first and last raw images (1st and 15th cycle), and then they were applied on the final multiplexed image to remove the autofluorescence. As a result, we generated a multichannel Qptiff image for a single TMA slide, devoid of autofluorescence, containing all image layers and metadata.
4.11. Analysis Using Oupath and Cytomap Software
QuPath software (v0.3.2)was utilized for digital pathological analysis. The Qptiff images produced from the TMA slides were analyzed following the procedure outlined in the tutorial [
20]. Briefly, the analysis involved segmentation and phenotyping, followed by the classification of individual cells using the object classifier function. Subsequently, for spatial analysis, measurements such as Centroid X, Centroid Y, Image, Class, and the Cell:Mean of each marker were extracted and utilized as input data for CytoMap. In conducting detailed spatial analysis, we utilized the methods previously described by Stoltzfus et al., performing neighborhood analysis within the 2D regions/volumes of the tissue to find local configurations, thus conducting cell–cell association analysis [
21].
4.12. Statistical Analysis
To investigate the association between diagnostic criteria and clinical symptoms in patients with IgG4–related disease, Fisher’s Exact Test was utilized. This statistical test was chosen due to the categorical nature of both the diagnostic criteria (e.g., high versus low) and the presence or absence of clinical symptoms, which are typically not amenable to analysis by parametric methods. All statistical analyses were performed using the R statistical programming language (Version 4.3.1; r–project.org).


 ,
, 


