
Uncovering Key Genes Associated with the Short-Winged Trait in Faba Bean (Vicia faba L.) Through Re-Sequencing and Genome-Wide Association Studies (GWASs)

 ,
,
Abstract
:1. Introduction
2. Results
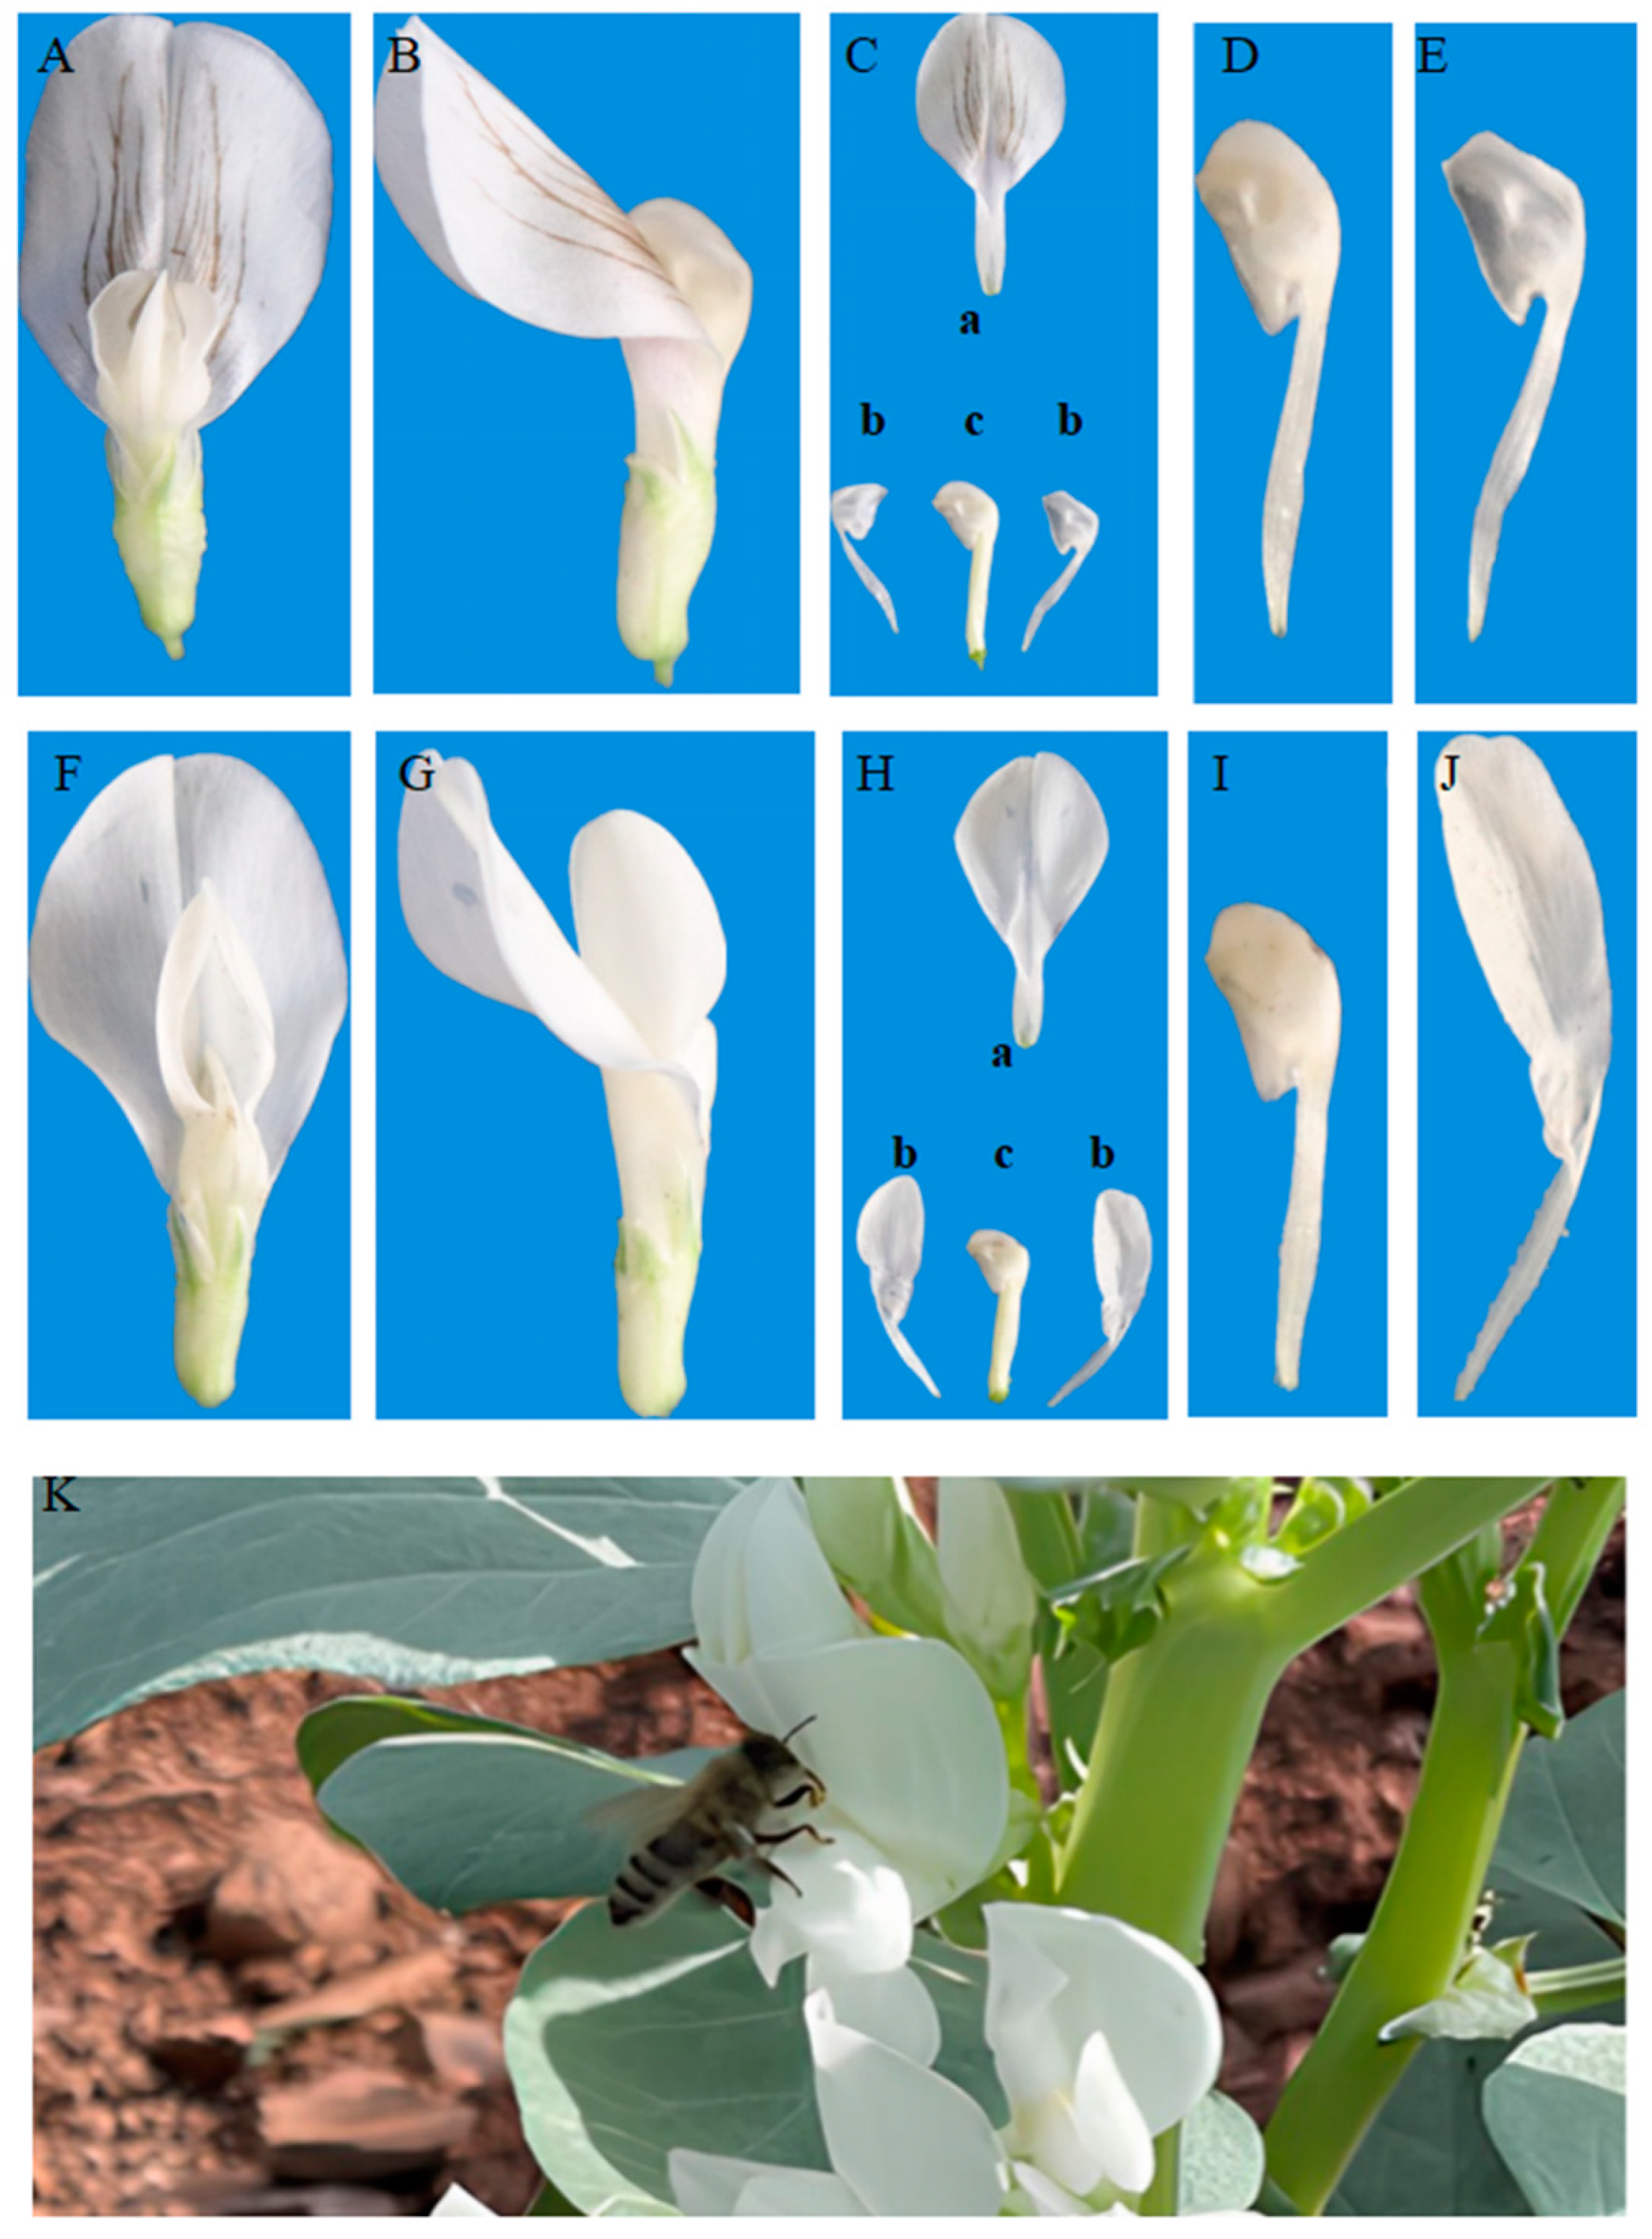
2.1. Analysis of Segregation of the Wing Trait in F2 Populations
2.2. Microscopic and Genetic Basis of the Wing Trait
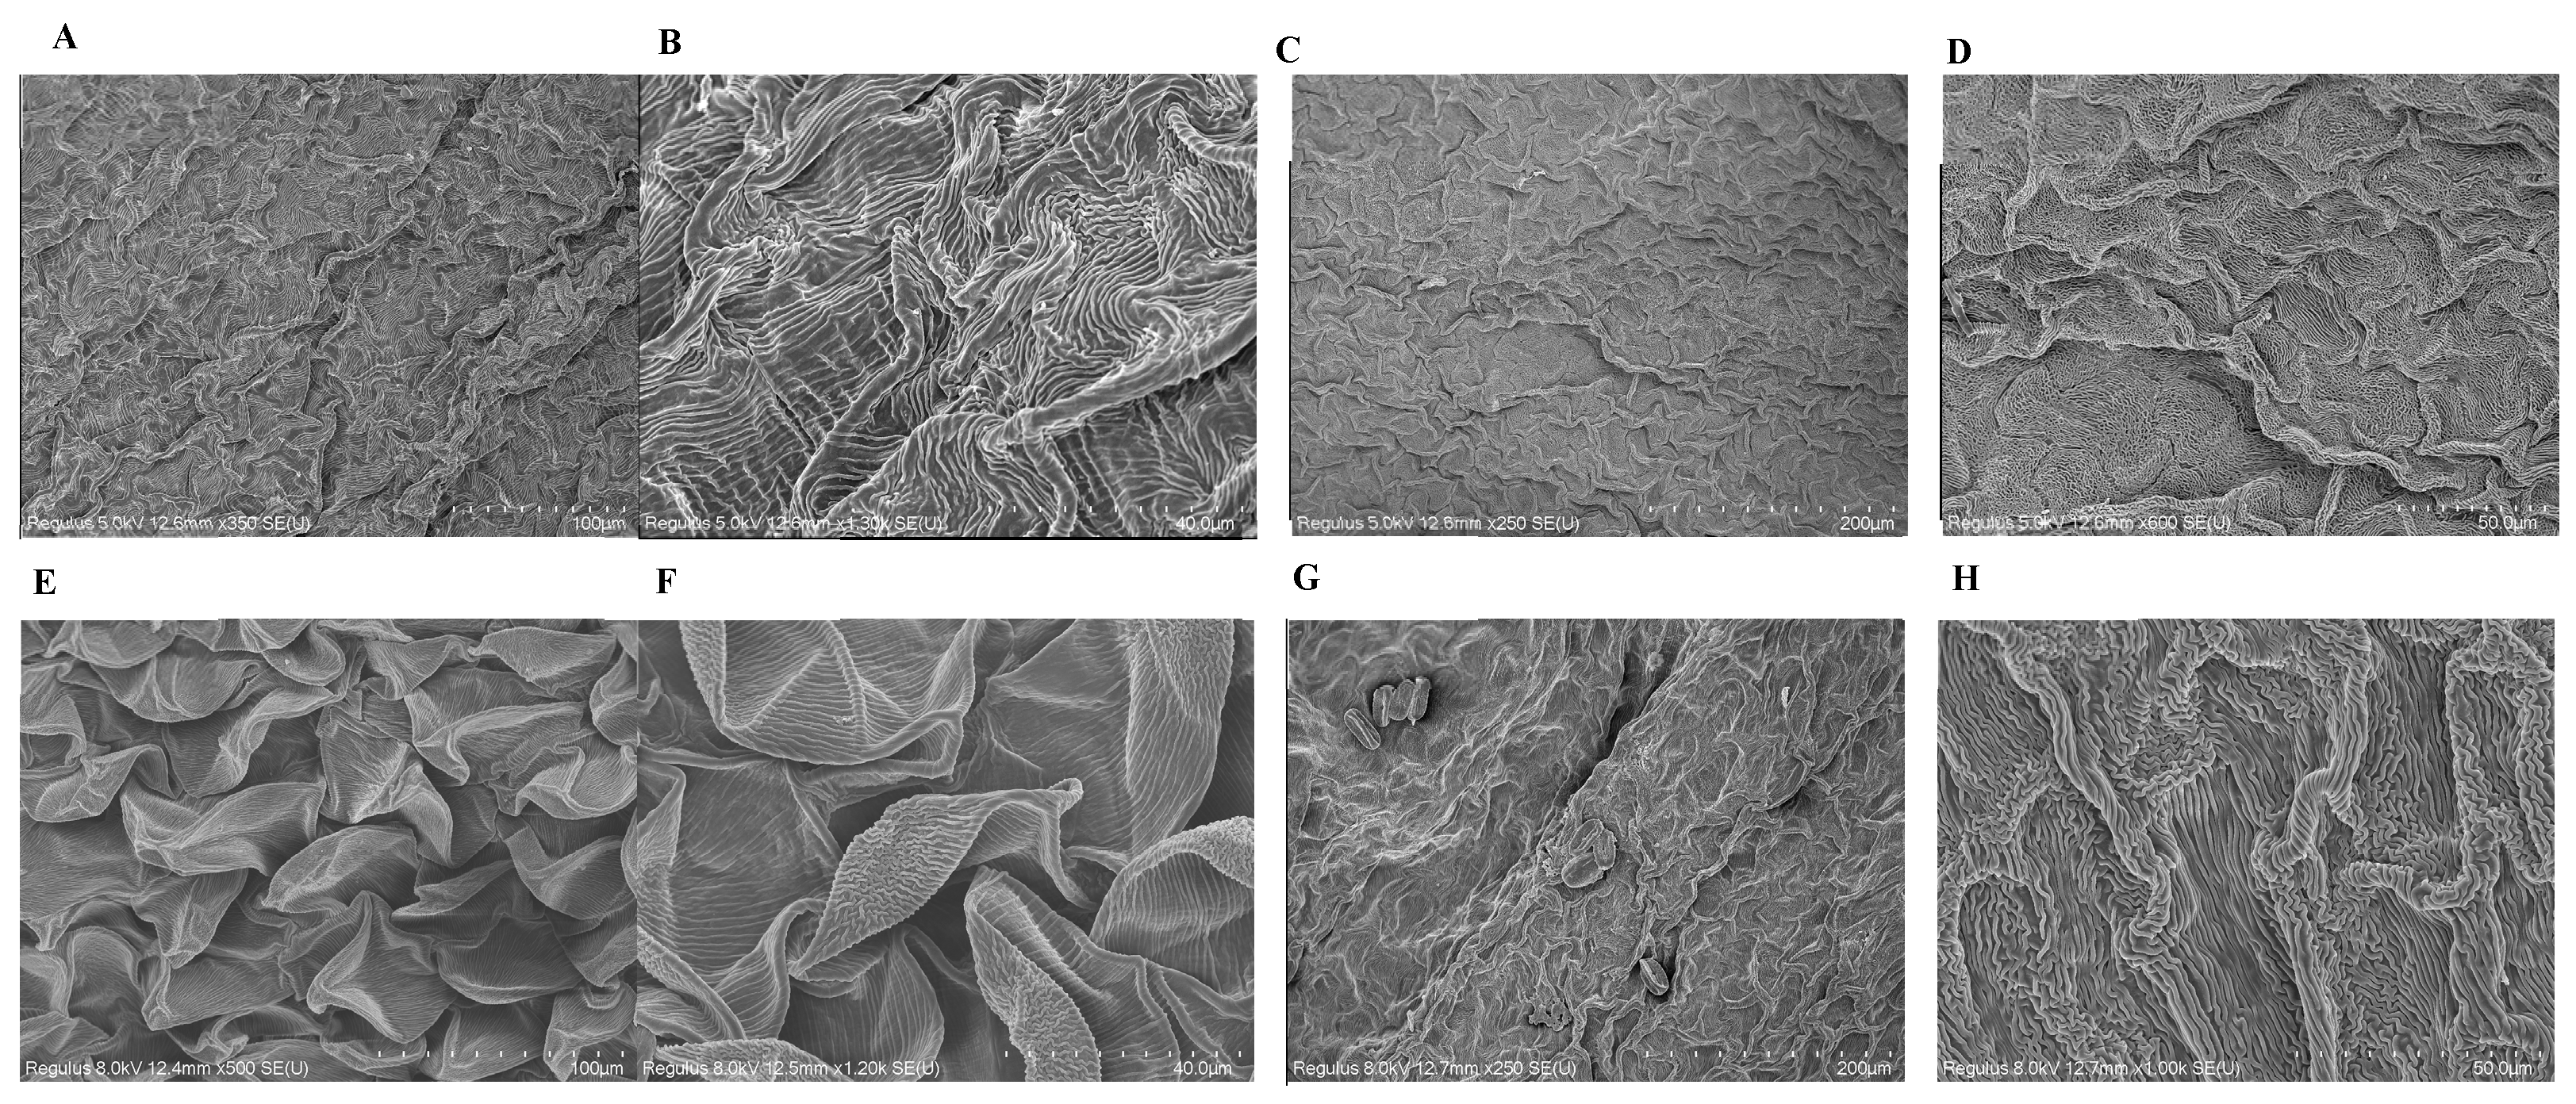
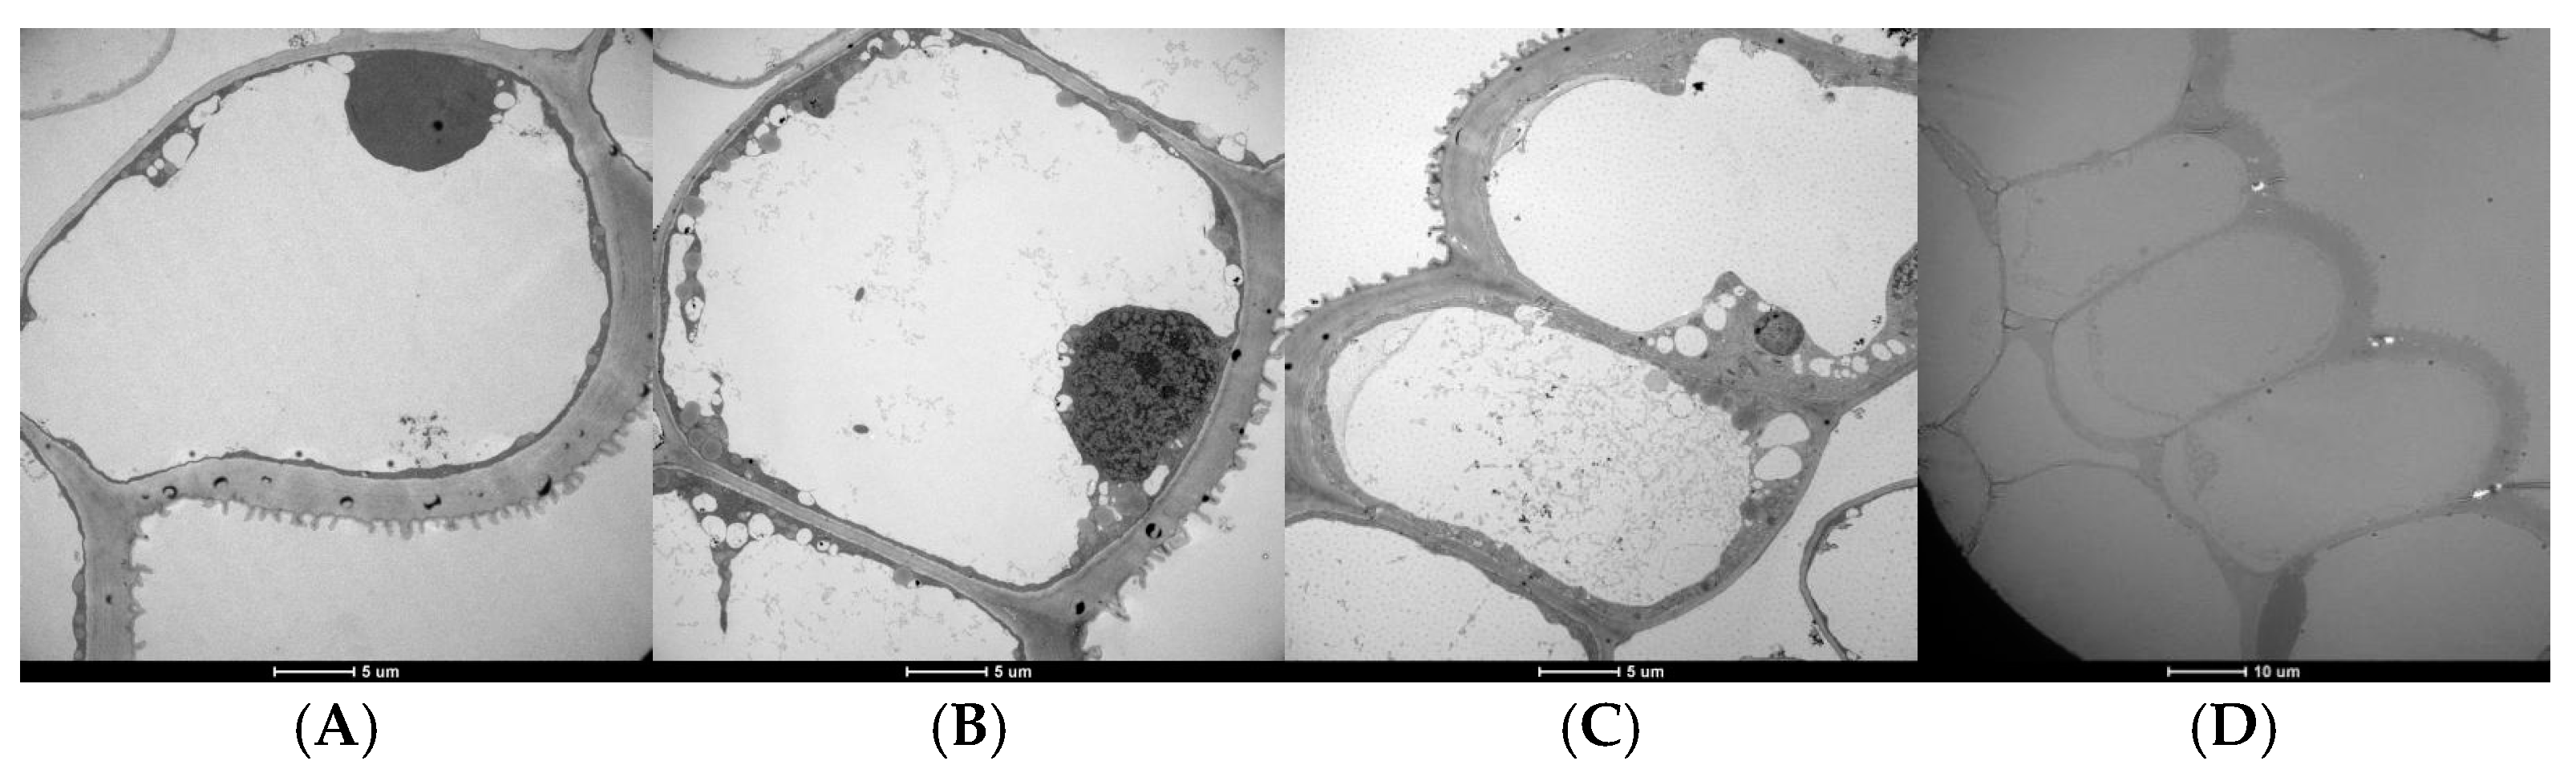
2.2.1. Scanning Electron Microscopy (SEM) and Transmission Electron Microscopy (TEM) of Petal Epidermal Cells
2.2.2. Genome-Wide Association Study on the Wing Trait
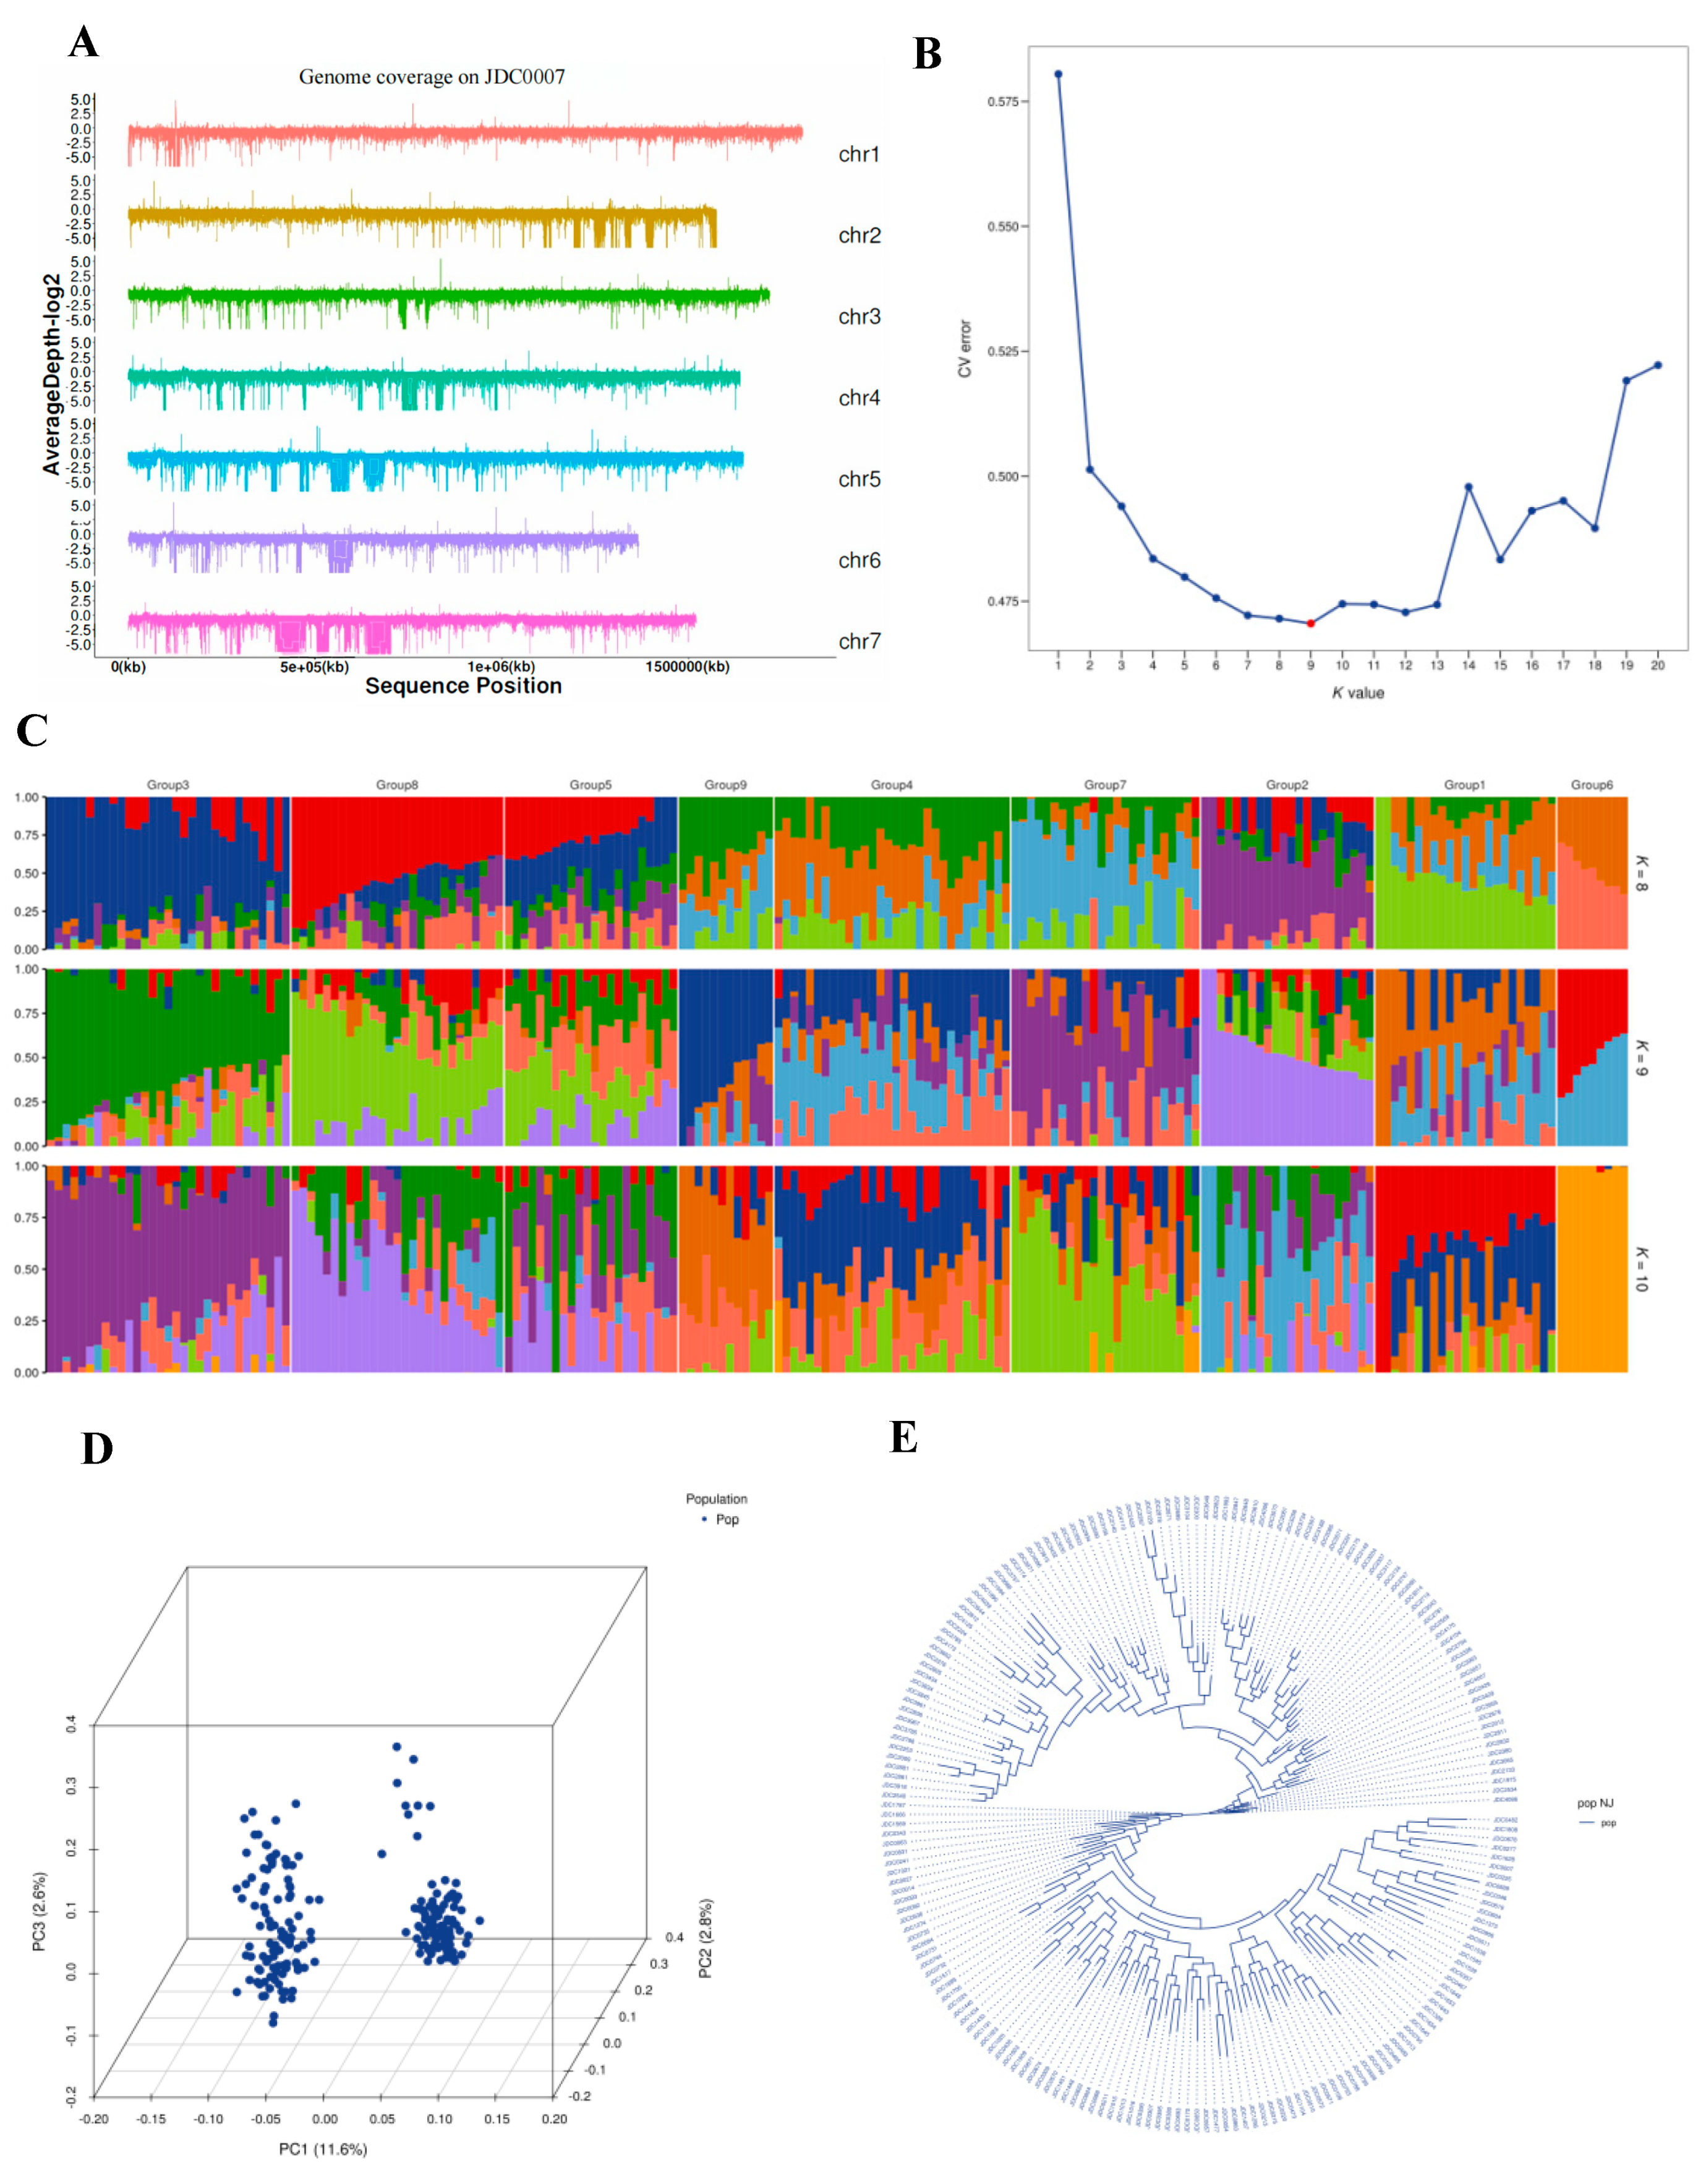
Population Characteristic Analysis and LD Analysis
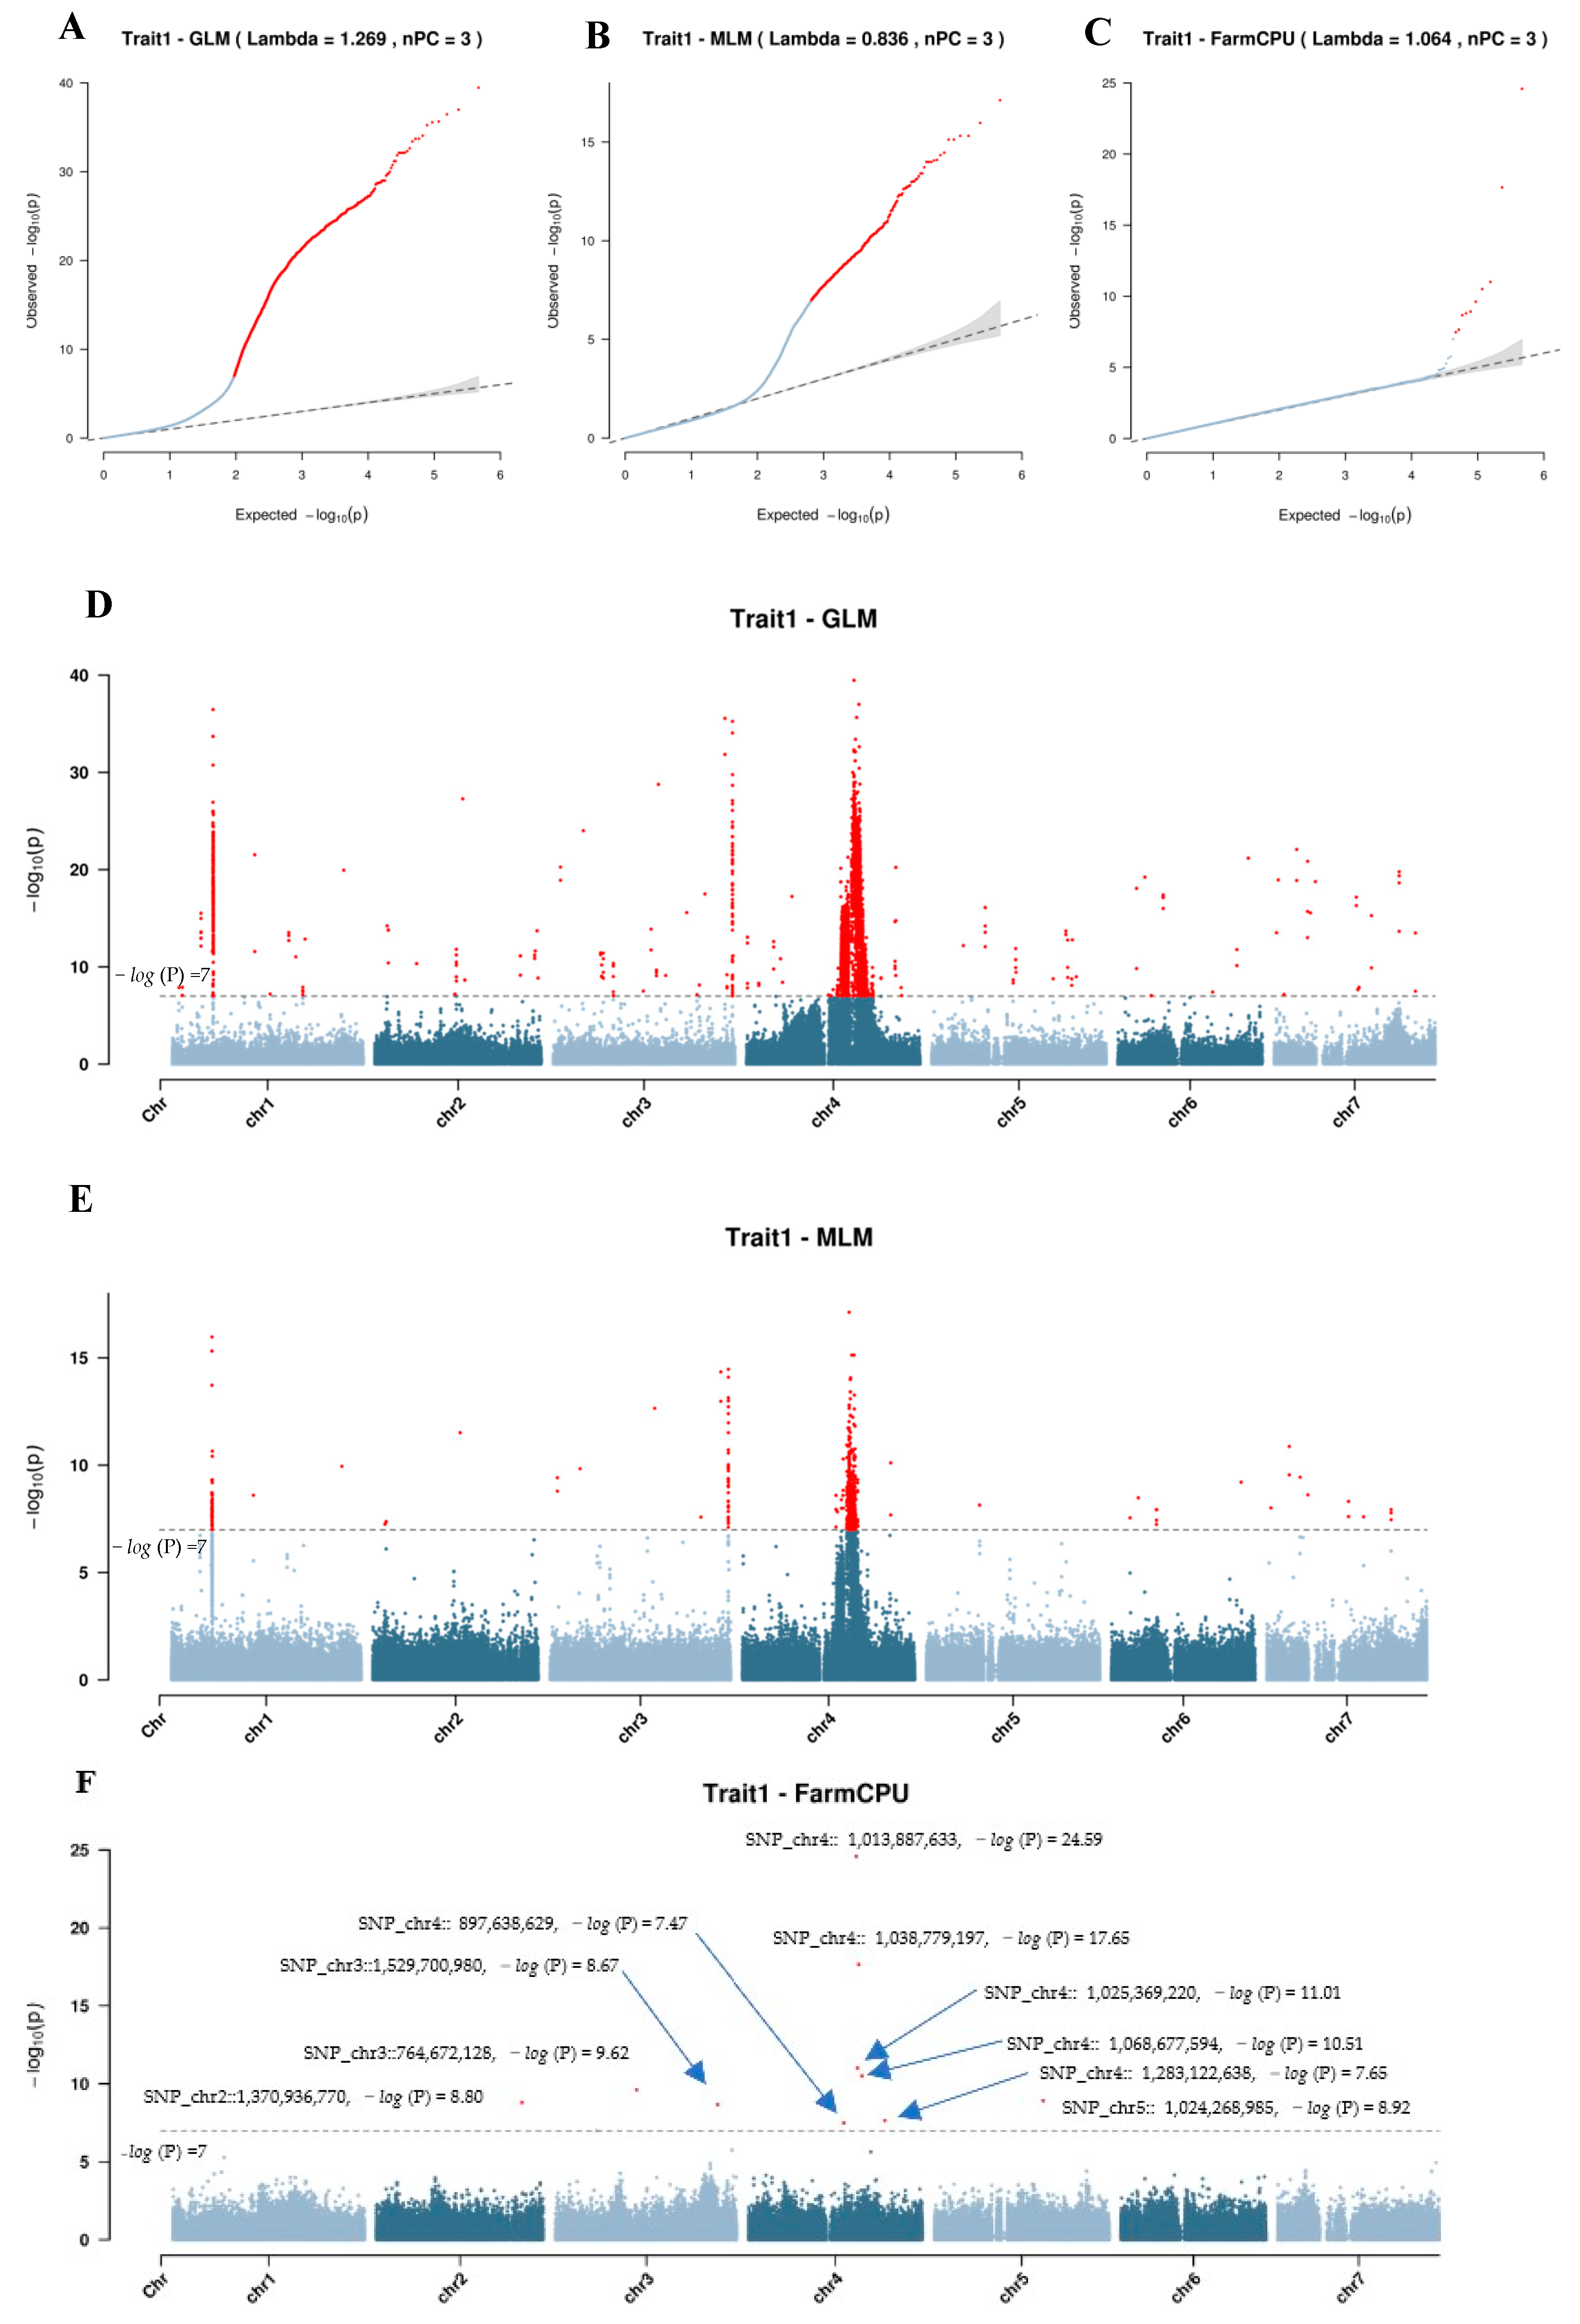
Genome-Wide Association Analysis
- GLM Model
- MLM Model
- FarmCPU Model
Candidate Gene Analysis
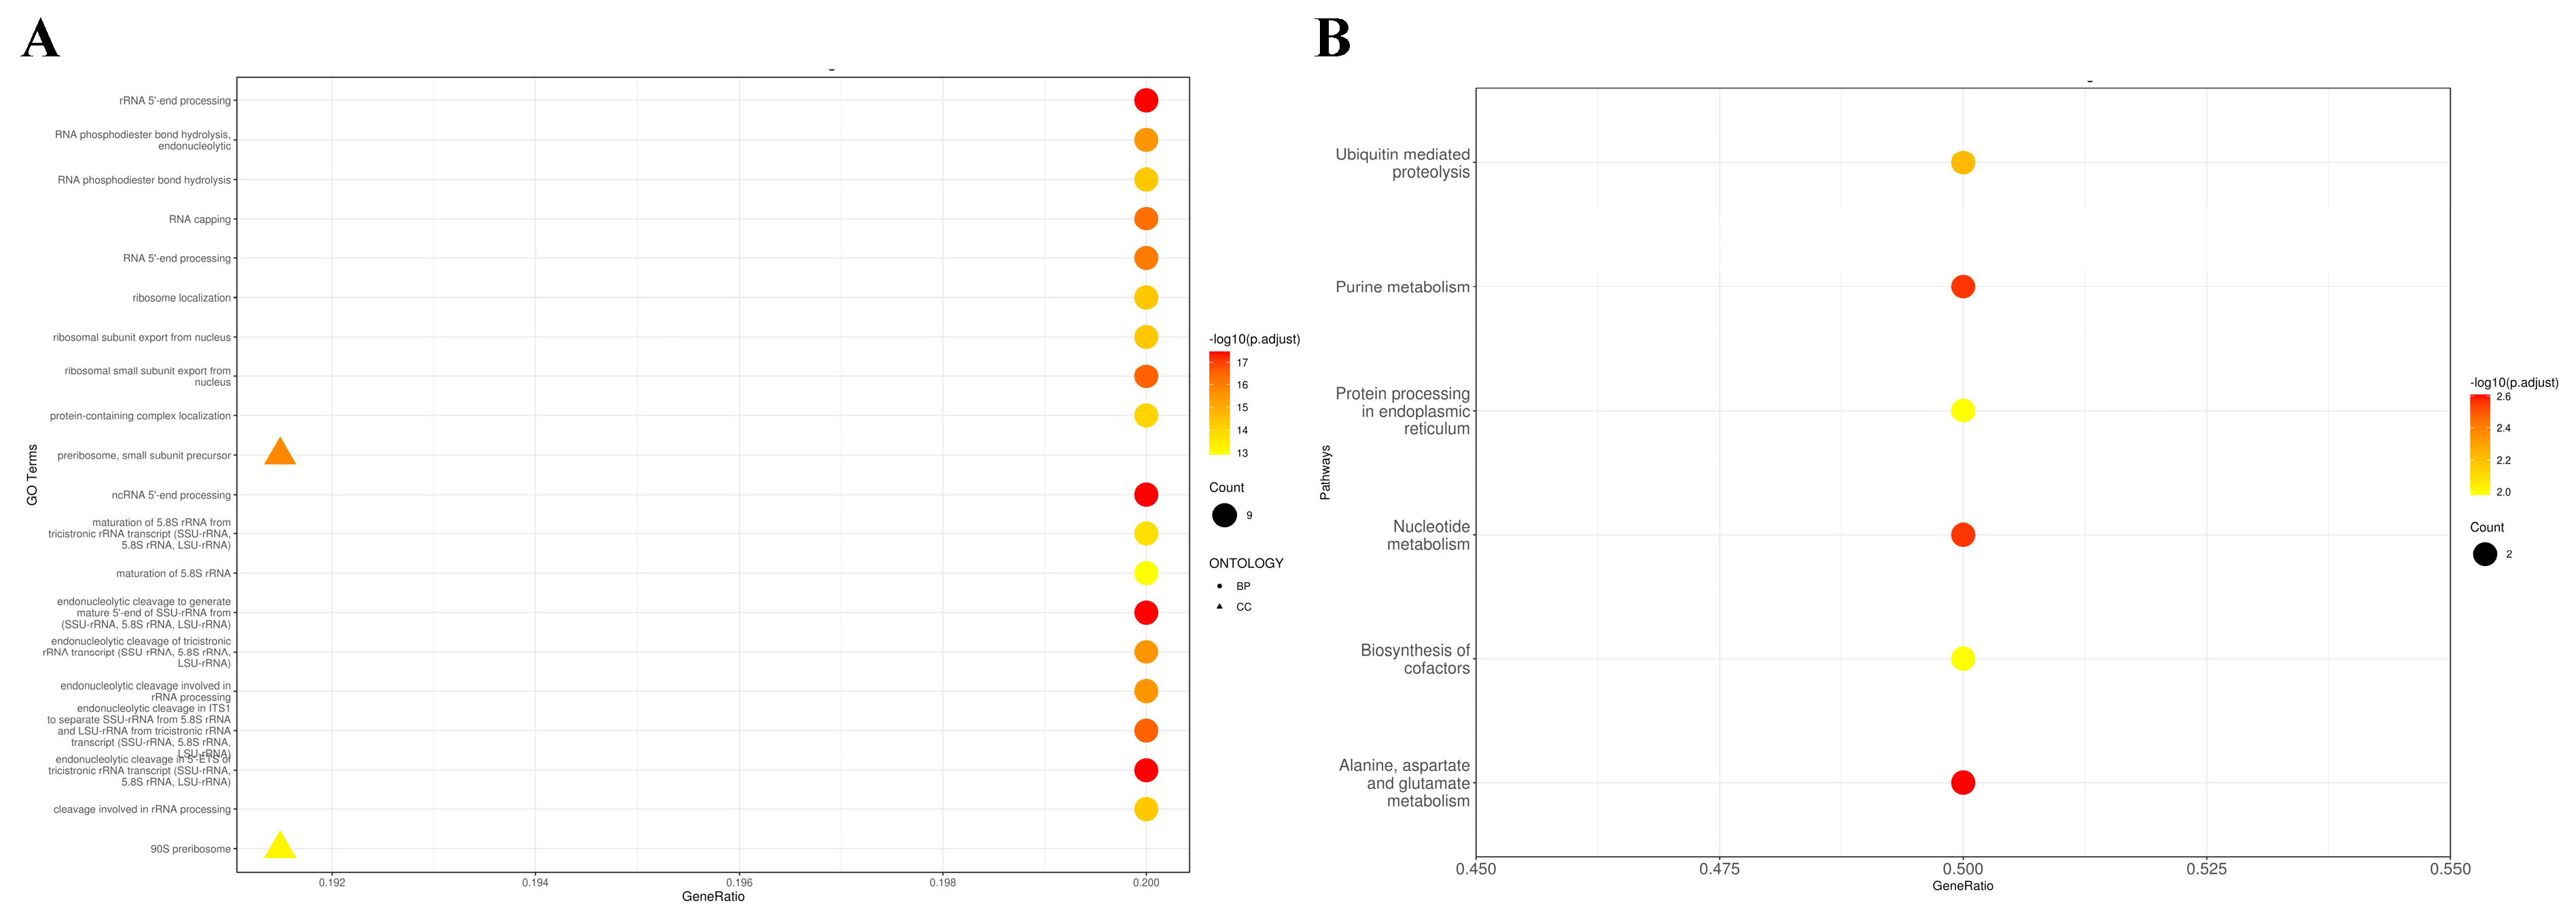
Gene Ontology (GO) Enrichment Analysis
Kyoto Encyclopedia of Genes and Genomes (KEGG) Annotation
3. Discussion
4. Materials and Methods
4.1. Plant Materials and Phenotypic Data Collection
4.2. Scanning Electron Microscopy (SEM) of the Epidermal Cells on Wing and Keel Petals
4.3. Transmission Electron Microscopy (TEM) of the Epidermal Cells on Wing Petal
4.4. Genomic DNA Library Preparation and Sequencing
4.5. Variant Discovery
4.6. Phylogenetic Analyses
4.7. Population Structure Analysis
4.8. Principal Component Analysis (PCA)
4.9. Population Diversity Indexes
4.10. Linkage Disequilibrium (LD) Analysis
4.11. Relatedness Analysis
4.12. Genome-Wide Association Analysis (GWAS)
5. Conclusions
Supplementary Materials
Author Contributions
Funding
Institutional Review Board Statement
Informed Consent Statement
Data Availability Statement
Conflicts of Interest
References
- Jensen, E.S.; Peoples, M.B.; Hauggaard-Nielsen, H. Faba Bean in Cropping Systems. Field Crops Res. 2010, 115, 203–216. [Google Scholar] [CrossRef]
- Köpke, U.; Nemecek, T. Ecological Services of Faba Bean. Field Crops Res. 2010, 115, 217–233. [Google Scholar] [CrossRef]
- Link, W. Autofertility and Rate of Cross-Fertilization: Crucial Characters for Breeding Synthetic Varieties in Faba Beans (Vicia faba L.). Theor. Appl. Genet. 1990, 79, 713–717. [Google Scholar] [CrossRef]
- Yu, H.; Wang, L.; Yang, F.; Lv, M.; Zong, X.; Yang, T. Identification and Utilization of Short Wing Petal Broad Bean (Vicia faba L.) Germplasm. J. Plant Genet. Resour. 2019, 20, 1334–1339. [Google Scholar]
- Cubero, J.I.; Hebblethwaite, P.D. The Faba Bean; CRC Press: Boca Raton, FL, USA, 1983. [Google Scholar]
- Yu, H.; Wang, L.; Lü, L.; Yang, T.; Yang, F.; Liu, R.; He, Y.; Zong, X. Advances on Related Factors and Applied Research of Outcrossing Rate in Faba Bean (Vicia faba L.). Crops 2020, 36, 9–15. [Google Scholar] [CrossRef]
- Musallam, I.W.; Haddad, N.J.; Tawaha, A.-R.M.; Migdadi, O.S. The Importance of Bee-Pollination in Four Genotypes of Faba Bean (Vicia faba L.). Int. J. Agric. Biol. 2004, 6, 9–12. [Google Scholar]
- Bishnoi, S.K.; Hooda, J.S.; Yadav, I.S.; Panchta, R. Advances in Heterosis and Hybrid Breeding in Faba Bean (Vicia faba L.). Forage Res. 2012, 38, 24–27. [Google Scholar]
- Zariman, N.A.; Omar, N.A.; Huda, A.N. Plant Attractants and Rewards for Pollinators: Their Significant to Successful Crop Pollination. Int. J. Life Sci. Biotechnol. 2022, 5, 270–293. [Google Scholar] [CrossRef]
- Irwin, R.E.; Adler, L.S.; Brody, A.K. The Dual Role of Floral Traits: Pollinator Attraction and Plant Defense. Ecology 2004, 85, 1503–1511. [Google Scholar] [CrossRef]
- Specht, C.D.; Howarth, D.G. Adaptation in Flower Form: A Comparative Evodevo Approach. New Phytol. 2015, 206, 74–90. [Google Scholar] [CrossRef]
- Buide, M.L. Pollination Ecology of Silene Acutifolia (Caryophyllaceae): Floral Traits Variation and Pollinator Attraction. Ann. Bot. 2006, 97, 289–297. [Google Scholar] [CrossRef] [PubMed]
- Costa, V.B.S.; Pimentel, R.M.M.; Chagas, M.G.S.; Alves, G.D.; Castro, C.C. Petal Micromorphology and Its Relationship to Pollination. Plant Biol. 2017, 19, 115–122. [Google Scholar] [CrossRef] [PubMed]
- Rands, S.A.; Glover, B.J.; Whitney, H.M. Floral Epidermal Structure and Flower Orientation: Getting to Grips with Awkward Flowers. Arthropod-Plant Interact. 2011, 5, 279–285. [Google Scholar] [CrossRef]
- Bailes, E.J.; Glover, B.J. Intraspecific Variation in the Petal Epidermal Cell Morphology of Vicia faba L. (Fabaceae). Flora 2018, 244–245, 29–36. [Google Scholar] [CrossRef]
- Ahmar, S.; Gill, R.A.; Jung, K.-H.; Faheem, A.; Qasim, M.U.; Mubeen, M.; Zhou, W. Conventional and Molecular Techniques from Simple Breeding to Speed Breeding in Crop Plants: Recent Advances and Future Outlook. Int. J. Mol. Sci. 2020, 21, 2590. [Google Scholar] [CrossRef]
- Pellew, C.; Sverdrup, A. New Observations on the Genetics of Peas (Pisum sativum). J. Genet. 1923, 13, 125–131. [Google Scholar] [CrossRef]
- Wang, Z.; Luo, Y.; Li, X.; Wang, L.; Xu, S.; Yang, J.; Weng, L.; Sato, S.; Tabata, S.; Ambrose, M.; et al. Genetic Control of Floral Zygomorphy in Pea (Pisum sativum L.). Proc. Natl. Acad. Sci. USA 2008, 105, 10414–10419. [Google Scholar] [CrossRef]
- Feng, X.; Zhao, Z.; Tian, Z.; Xu, S.; Luo, Y.; Cai, Z.; Wang, Y.; Yang, J.; Wang, Z.; Weng, L.; et al. Control of Petal Shape and Floral Zygomorphy in Lotus japonicus. Proc. Natl. Acad. Sci. USA 2006, 103, 4970–4975. [Google Scholar] [CrossRef] [PubMed]
- Xu, Z.; Cheng, K.; Li, X.; Yang, J.; Xu, S.; Cao, X.; Hu, X.; Xie, W.; Yuan, L.; Ambrose, M.; et al. Transcriptional and Post-Transcriptional Modulation of SQU and KEW Activities in the Control of Dorsal–Ventral Asymmetric Flower Development in Lotus japonicus. Mol. Plant 2016, 9, 722–736. [Google Scholar] [CrossRef]
- O’Sullivan, D.M.; Angra, D. Advances in Faba Bean Genetics and Genomics. Front. Genet. 2016, 7, 150. [Google Scholar] [CrossRef]
- Jayakodi, M.; Golicz, A.A.; Kreplak, J.; Fechete, L.I.; Angra, D.; Bednář, P.; Bornhofen, E.; Zhang, H.; Boussageon, R.; Kaur, S.; et al. The Giant Diploid Faba Genome Unlocks Variation in a Global Protein Crop. Nature 2023, 615, 652–659. [Google Scholar] [CrossRef]
- Burghardt, L.T.; Young, N.D.; Tiffin, P. A Guide to Genome-Wide Association Mapping in Plants. Curr. Protoc. Plant Biol. 2017, 2, 22–38. [Google Scholar] [CrossRef] [PubMed]
- Cheng, X.; Peng, J.; Ma, J.; Tang, Y.; Chen, R.; Mysore, K.S.; Wen, J. NO APICAL MERISTEM (MtNAM) Regulates Floral Organ Identity and Lateral Organ Separation in Medicago Truncatula. New Phytol. 2012, 195, 71–84. [Google Scholar] [CrossRef] [PubMed]
- Sablowski, R.W.M.; Meyerowitz, E.M. A Homolog of NO APICAL MERISTEM Is an Immediate Target of the Floral Homeotic Genes APETALA3/PISTILLATA. Cell 1998, 92, 93–103. [Google Scholar] [CrossRef] [PubMed]
- Souer, E.; van Houwelingen, A.; Kloos, D.; Mol, J.; Koes, R. The No Apical Meristem Gene of Petunia Is Required for Pattern Formation in Embryos and Flowers and Is Expressed at Meristem and Primordia Boundaries. Cell 1996, 85, 159–170. [Google Scholar] [CrossRef]
- Tanaka, H.; Watanabe, M.; Watanabe, D.; Tanaka, T.; Machida, C.; Machida, Y. ACR4, a Putative Receptor Kinase Gene of Arabidopsis Thaliana, That Is Expressed in the Outer Cell Layers of Embryos and Plants, Is Involved in Proper Embryogenesis. Plant Cell Physiol. 2002, 43, 419–428. [Google Scholar] [CrossRef]
- Holdsworth, M.J.; Vicente, J.; Sharma, G.; Abbas, M.; Zubrycka, A. The Plant N-Degron Pathways of Ubiquitin-Mediated Proteolysis. J. Integr. Plant Biol. 2020, 62, 70–89. [Google Scholar] [CrossRef]
- Lu, D.; Ni, W.; Stanley, B.A.; Ma, H. Proteomics and Transcriptomics Analyses of Arabidopsis Floral Buds Uncover Important Functions of ARABIDOPSIS SKP1-LIKE1. BMC Plant Biol. 2016, 16, 61. [Google Scholar] [CrossRef]
- Li, K.; Wang, P.; Ding, T.; Hou, L.; Li, G.; Zhao, C.; Zhao, S.; Wang, X.; Li, P. Mutation of an Essential 60S Ribosome Assembly Factor MIDASIN 1 Induces Early Flowering in Arabidopsis. Int. J. Mol. Sci. 2022, 23, 6509. [Google Scholar] [CrossRef]
- Zhang, G.; Wei, B.; Ding, Q. Identification of Differentially Expressed miRNAs between Male Sterile and Fertile Floral Buds in Watermelon (Citrullus lanatus L.) via High-Throughput Sequencing. 3 Biotech 2024, 14, 247. [Google Scholar] [CrossRef]
- Courtney, S.E.; Rider, C.C.; Stead, A.D. Changes in Protein Ubiquitination and the Expression of Ubiquitin-Encoding Transcripts in Daylily Petals during Floral Development and Senescence. Physiol. Plant. 1994, 91, 196–204. [Google Scholar] [CrossRef]
- Ingram, G.C.; Doyle, S.; Carpenter, R.; Schultz, E.A.; Simon, R.; Coen, E.S. Dual Role for Fimbriata in Regulating Floral Homeotic Genes and Cell Division in Antirrhinum. EMBO J. 1997, 16, 6521–6534. [Google Scholar] [CrossRef]
- Levin, J.Z.; Meyerowitz, E.M. UFO: An Arabidopsis Gene Involved in Both Floral Meristem and Floral Organ Development. Plant Cell 1995, 7, 529–548. [Google Scholar] [CrossRef]
- Moon, J.; Parry, G.; Estelle, M. The Ubiquitin-Proteasome Pathway and Plant Development. Plant Cell 2004, 16, 3181–3195. [Google Scholar] [CrossRef]
- Samach, A.; Klenz, J.E.; Kohalmi, S.E.; Risseeuw, E.; Haughn, G.W.; Crosby, W.L. The UNUSUAL FLORAL ORGANS Gene of Arabidopsis Thaliana Is an F-Box Protein Required for Normal Patterning and Growth in the Floral Meristem. Plant J. 1999, 20, 433–445. [Google Scholar] [CrossRef]
- Strasser, R. Protein Quality Control in the Endoplasmic Reticulum of Plants. Annu. Rev. Plant Biol. 2018, 69, 147–172. [Google Scholar] [CrossRef]
- Xiao, W.; Li, Z.; Chen, H.; Lv, F. Visualization of Micromorphology of Petal Epidermal Features of Waxy and Velvety Flowers in Phalaenopsis. EBSCOhost. Available online: https://openurl.ebsco.com/contentitem/doi:10.2306%2Fscienceasia1513-1874.2020.080?sid=ebsco:plink:crawler&id=ebsco:doi:10.2306%2Fscienceasia1513-1874.2020.080 (accessed on 17 February 2025).
- Tajuddin, S.; Mat, N.; Yunus, A.G. Anatomical Study of Stem, Petiole, Leaf, Tuber, Root and Flower of Dioscorea hispida Dennst. (Dioscoreaceae) by Using Optical Microscope, SEM and TEM. J. Agrobiotechnol. 2013, 4, 33–42. [Google Scholar]
- Chen, S.; Zhou, Y.; Chen, Y.; Gu, J. Fastp: An Ultra-Fast All-in-One FASTQ Preprocessor. Bioinformatics 2018, 34, i884–i890. [Google Scholar] [CrossRef]
- Jung, Y.; Han, D. BWA-MEME: BWA-MEM Emulated with a Machine Learning Approach. Bioinformatics 2022, 38, 2404–2413. [Google Scholar] [CrossRef]
- McKenna, A.; Hanna, M.; Banks, E.; Sivachenko, A.; Cibulskis, K.; Kernytsky, A.; Garimella, K.; Altshuler, D.; Gabriel, S.; Daly, M.; et al. The Genome Analysis Toolkit: A MapReduce Framework for Analyzing next-Generation DNA Sequencing Data. Genome Res. 2010, 20, 1297–1303. [Google Scholar] [CrossRef]
- Li, H.; Handsaker, B.; Wysoker, A.; Fennell, T.; Ruan, J.; Homer, N.; Marth, G.; Abecasis, G.; Durbin, R. 1000 Genome Project Data Processing Subgroup the Sequence Alignment/Map Format and SAMtools. Bioinformatics 2009, 25, 2078–2079. [Google Scholar] [CrossRef] [PubMed]
- Freed, D.; Aldana, R.; Weber, J.A.; Edwards, J.S. The Sentieon Genomics Tools—A Fast and Accurate Solution to Variant Calling from next-Generation Sequence Data. bioRxiv 2017, 115717. [Google Scholar] [CrossRef]
- Cingolani, P.; Platts, A.; Wang, L.L.; Coon, M.; Nguyen, T.; Wang, L.; Land, S.J.; Lu, X.; Ruden, D.M. A Program for Annotating and Predicting the Effects of Single Nucleotide Polymorphisms, SnpEff. Fly 2012, 6, 80–92. [Google Scholar] [CrossRef] [PubMed]
- Purcell, S.; Neale, B.; Todd-Brown, K.; Thomas, L.; Ferreira, M.A.R.; Bender, D.; Maller, J.; Sklar, P.; de Bakker, P.I.W.; Daly, M.J.; et al. PLINK: A Tool Set for Whole-Genome Association and Population-Based Linkage Analyses. Am. J. Hum. Genet. 2007, 81, 559–575. [Google Scholar] [CrossRef]
- Minh, B.Q.; Schmidt, H.A.; Chernomor, O.; Schrempf, D.; Woodhams, M.D.; von Haeseler, A.; Lanfear, R. IQ-TREE 2: New Models and Efficient Methods for Phylogenetic Inference in the Genomic Era. Mol. Biol. Evol. 2020, 37, 1530–1534. [Google Scholar] [CrossRef]
- Price, M.N.; Dehal, P.S.; Arkin, A.P. FastTree 2—Approximately Maximum-Likelihood Trees for Large Alignments. PLoS ONE 2010, 5, e9490. [Google Scholar] [CrossRef]
- Alexander, D.H.; Novembre, J.; Lange, K. Fast Model-Based Estimation of Ancestry in Unrelated Individuals. Genome Res. 2009, 19, 1655–1664. [Google Scholar] [CrossRef]
- Zhang, C.; Dong, S.-S.; Xu, J.-Y.; He, W.-M.; Yang, T.-L. PopLDdecay: A Fast and Effective Tool for Linkage Disequilibrium Decay Analysis Based on Variant Call Format Files. Bioinformatics 2019, 35, 1786–1788. [Google Scholar] [CrossRef]
- Manichaikul, A.; Mychaleckyj, J.C.; Rich, S.S.; Daly, K.; Sale, M.; Chen, W.-M. Robust Relationship Inference in Genome-Wide Association Studies. Bioinformatics 2010, 26, 2867–2873. [Google Scholar] [CrossRef]
- Yin, L.; Zhang, H.; Tang, Z.; Xu, J.; Yin, D.; Zhang, Z.; Yuan, X.; Zhu, M.; Zhao, S.; Li, X.; et al. rMVP: A Memory-Efficient, Visualization-Enhanced, and Parallel-Accelerated Tool for Genome-Wide Association Study. Genom. Proteom. Bioinform. 2021, 19, 619–628. [Google Scholar] [CrossRef]

| Population | Normal-Winged (N) | Short-Winged (S) | Total | N:S Ratio a | Exp. N b | Exp. S c | Chi-Square d | p-Value e |
|---|---|---|---|---|---|---|---|---|
| ‘Yundoulvxin 1’ (short-winged) × ‘Yundou 1183’ | 1389 | 483 | 1872 | 3N:1S | 1404 | 468 | 0.64 | 0.42 |
| ‘K0692’ (short-winged) × ‘Yundou 1183’ | 1624 | 531 | 2155 | 3N:1S | 1616.25 | 538.75 | 0.15 | 0.70 |
| Total | 3013 | 1014 | 4027 | 3N:1S | 3020.25 | 1006.75 | 0.07 | 0.79 |
| Chromosome | Position | Reference a | Alternation b | SE c | p-Value d | PVE e |
|---|---|---|---|---|---|---|
| chr2 | 1,370,936,770 | T | C | 0.0190 | 1.58 × 10⁻⁹ | 0 |
| chr3 | 764,672,128 | T | A | 0.0203 | 2.40 × 10⁻¹⁰ | 9.3% |
| chr3 | 1,529,700,980 | T | G | 0.0365 | 2.15 × 10⁻⁹ | 6.2% |
| chr4 | 897,638,629 | G | A | 0.0297 | 3.35 × 10⁻⁸ | 5.2% |
| chr4 | 1,013,887,633 | C | T | 0.0163 | 2.57 × 10⁻²⁵ | 22.2% |
| chr4 | 1,025,369,220 | A | G | 0.0324 | 9.77 × 10⁻¹² | 0 |
| chr4 | 1,038,779,197 | C | T | 0.0195 | 2.22 × 10⁻¹⁸ | 17.0% |
| chr4 | 1,068,677,594 | A | C | 0.0101 | 3.11 × 10⁻¹¹ | 7.4% |
| chr4 | 1,283,122,638 | C | A | 0.0206 | 2.25 × 10⁻⁸ | 0 |
| chr5 | 1,024,268,985 | A | G | 0.0896 | 1.20 × 10⁻⁹ | 11.8% |
| Gene ID | Chromosome | Strand | Start | End | Annotation |
|---|---|---|---|---|---|
| gene-VFH_I185160 | chr2 | + | 1,370,573,643 | 1,370,577,612 | E3 ubiquitin-protein ligase DA2 OS |
| gene-VFH_I185200 | chr2 | + | 1,370,577,952 | 1,370,578,250 | -- |
| gene-VFH_I185240 | chr2 | + | 1,370,586,133 | 1,370,595,083 | -- |
| gene-VFH_II126600 | chr3 | + | 764,359,337 | 764,360,410 | Ethylene-responsive transcription factor CRF3 OS |
| gene-VFH_II242640 | chr3 | + | 1,529,265,502 | 1,529,266,471 | -- |
| gene-VFH_II242680 | chr3 | + | 1,529,957,969 | 1,529,968,053 | Sterol 3-beta-glucosyltransferase UGT80A2 OS |
| gene-VFH_II242720 | chr3 | + | 1,530,074,691 | 1,530,075,183 | -- |
| gene-VFH_II242760 | chr3 | + | 1,530,076,062 | 1,530,077,346 | Vesicle-associated membrane protein 722 OS |
| gene-VFH_II242760 | chr3 | + | 1,530,076,062 | 1,530,077,346 | Vesicle-associated membrane protein 721 OS |
| gene-VFH_II242800 | chr3 | + | 1,530,088,252 | 1,530,088,560 | -- |
| gene-VFH_II242840 | chr3 | + | 1,530,088,586 | 1,530,088,906 | -- |
| gene-VFH_II242880 | chr3 | + | 1,530,089,943 | 1,530,090,287 | Uncharacterized mitochondrial protein AtMg00310 OS |
| gene-VFH_II242920 | chr3 | + | 1,530,152,989 | 1,530,153,702 | Zinc-finger homeodomain protein 2 OS |
| gene-VFH_II242960 | chr3 | + | 1,530,183,734 | 1,530,184,447 | Zinc-finger homeodomain protein 2 OS |
| gene-VFH_III128960 | chr4 | + | 897,872,521 | 897,872,763 | -- |
| gene-VFH_III129000 | chr4 | + | 897,910,440 | 897,912,825 | -- |
| gene-VFH_III144960 | chr4 | + | 1,013,856,789 | 1,013,857,154 | -- |
| gene-VFH_III145000 | chr4 | + | 1,013,857,243 | 1,013,861,427 | -- |
| gene-VFH_III145040 | chr4 | + | 1,014,183,855 | 1,014,184,466 | -- |
| gene-VFH_III145080 | chr4 | + | 1,014,260,687 | 1,014,262,444 | -- |
| gene-VFH_III145120 | chr4 | + | 1,014,277,201 | 1,014,278,223 | Glutathione S-transferase T3 OS |
| gene-VFH_III145120 | chr4 | + | 1,014,277,201 | 1,014,277,560 | -- |
| gene-VFH_III145160 | chr4 | + | 1,014,279,008 | 1,014,279,562 | -- |
| gene-VFH_III145200 | chr4 | + | 1,014,289,183 | 1,014,290,059 | Late embryogenesis abundant protein D-34 OS |
| gene-VFH_III147000 | chr4 | + | 1,024,934,626 | 1,024,935,012 | -- |
| gene-VFH_III147040 | chr4 | + | 1,025,114,272 | 1,025,114,726 | -- |
| gene-VFH_III147080 | chr4 | + | 1,025,414,493 | 1,025,417,411 | Vacuole membrane protein KMS1 OS |
| gene-VFH_III147120 | chr4 | + | 1,025,427,305 | 1,025,427,901 | -- |
| gene-VFH_III147160 | chr4 | + | 1,025,428,128 | 1,025,429,181 | Putative ribonuclease H protein At1g65750 OS |
| gene-VFH_III147200 | chr4 | + | 1,025,429,480 | 1,025,430,643 | Glutathione S-transferase T3 OS |
| gene-VFH_III147240 | chr4 | + | 1,025,451,849 | 1,025,452,856 | Cullin-1 OS |
| gene-VFH_III147280 | chr4 | + | 1,025,778,128 | 1,025,778,745 | Adenylosuccinate lyase OS |
| gene-VFH_III149160 | chr4 | + | 1,039,110,258 | 1,039,110,459 | -- |
| gene-VFH_III149200 | chr4 | + | 1,039,111,995 | 1,039,112,210 | Probable inactive receptor kinase At1g48480 OS |
| gene-VFH_III153280 | chr4 | + | 1,068,451,765 | 1,068,460,306 | Protein DWD HYPERSENSITIVE TO UV-B 1 OS |
| gene-VFH_III153320 | chr4 | + | 1,068,460,834 | 1,068,461,079 | -- |
| gene-VFH_III153360 | chr4 | + | 1,068,461,099 | 1,068,461,438 | Snakin-1 OS = Solanum tuberosum OX |
| gene-VFH_III153400 | chr4 | + | 1,068,485,623 | 1,068,487,425 | Thioredoxin domain-containing protein 9 homolog OS |
| gene-VFH_III153440 | chr4 | + | 1,068,772,610 | 1,068,775,302 | Sister chromatid cohesion protein SCC2 OS |
| gene-VFH_III153480 | chr4 | + | 1,068,789,249 | 1,068,792,353 | Serine/threonine-protein kinase EDR1 OS |
| gene-VFH_III153520 | chr4 | + | 1,068,929,535 | 1,068,931,137 | Pumilio homolog 12 OS |
| gene-VFH_III153560 | chr4 | + | 1,068,967,422 | 1,068,969,025 | Pumilio homolog 9 OS |
| gene-VFH_III153560 | chr4 | + | 1,068,967,422 | 1,068,969,025 | Pumilio homolog 12 OS |
| gene-VFH_III153600 | chr4 | + | 1,069,082,272 | 1,069,083,842 | Pumilio homolog 12 OS |
| gene-VFH_III153640 | chr4 | + | 1,069,110,264 | 1,069,111,871 | Pumilio homolog 12 OS |
| gene-VFH_III185880 | chr4 | + | 1,283,109,906 | 1,283,110,265 | -- |
| gene-VFH_III185920 | chr4 | + | 1,283,164,266 | 1,283,168,067 | Protein TIC 40, chloroplastic OS |
| gene-VFH_III185960 | chr4 | + | 1,283,221,585 | 1,283,223,452 | Rust resistance kinase Lr10 OS |
| gene-VFH_IV148120 | chr5 | + | 1,024,025,212 | 1,024,028,413 | Subtilisin-like protease SBT5.4 OS |
| gene-VFH_IV148160 | chr5 | + | 1,024,573,401 | 1,024,592,701 | Subtilisin-like protease SBT5.4 OS |
| gene-VFH_IV148160 | chr5 | + | 1,024,573,401 | 1,024,580,420 | Subtilisin-like protease SBT5.4 OS |
| gene-VFH_IV148200 | chr5 | + | 1,024,680,906 | 1,024,685,005 | Probable inactive purple acid phosphatase 27 OS |
| gene-VFH_IV148240 | chr5 | + | 1,024,689,766 | 1,024,690,207 | -- |
Disclaimer/Publisher’s Note: The statements, opinions and data contained in all publications are solely those of the individual author(s) and contributor(s) and not of MDPI and/or the editor(s). MDPI and/or the editor(s) disclaim responsibility for any injury to people or property resulting from any ideas, methods, instructions or products referred to in the content. |
© 2025 by the authors. Licensee MDPI, Basel, Switzerland. This article is an open access article distributed under the terms and conditions of the Creative Commons Attribution (CC BY) license (https://creativecommons.org/licenses/by/4.0/).
Share and Cite
Yu, H.; Hu, C.; Yang, X.; Li, Q.; Wang, Y.; Dai, Z.; Cun, J.; Zheng, A.; Jiang, Y.; Wang, Q.; et al. Uncovering Key Genes Associated with the Short-Winged Trait in Faba Bean (Vicia faba L.) Through Re-Sequencing and Genome-Wide Association Studies (GWASs). Int. J. Mol. Sci. 2025, 26, 2733. https://doi.org/10.3390/ijms26062733
Yu H, Hu C, Yang X, Li Q, Wang Y, Dai Z, Cun J, Zheng A, Jiang Y, Wang Q, et al. Uncovering Key Genes Associated with the Short-Winged Trait in Faba Bean (Vicia faba L.) Through Re-Sequencing and Genome-Wide Association Studies (GWASs). International Journal of Molecular Sciences. 2025; 26(6):2733. https://doi.org/10.3390/ijms26062733
Chicago/Turabian StyleYu, Haitian, Chaoqin Hu, Xin Yang, Qiong Li, Yubao Wang, Zhengming Dai, Jie Cun, Aiqing Zheng, Yanhua Jiang, Qinfang Wang, and et al. 2025. "Uncovering Key Genes Associated with the Short-Winged Trait in Faba Bean (Vicia faba L.) Through Re-Sequencing and Genome-Wide Association Studies (GWASs)" International Journal of Molecular Sciences 26, no. 6: 2733. https://doi.org/10.3390/ijms26062733
APA StyleYu, H., Hu, C., Yang, X., Li, Q., Wang, Y., Dai, Z., Cun, J., Zheng, A., Jiang, Y., Wang, Q., Lv, M., Yang, F., & He, Y. (2025). Uncovering Key Genes Associated with the Short-Winged Trait in Faba Bean (Vicia faba L.) Through Re-Sequencing and Genome-Wide Association Studies (GWASs). International Journal of Molecular Sciences, 26(6), 2733. https://doi.org/10.3390/ijms26062733