Article

Genetic Polymorphisms in MHC Classes I and II Predict Outcomes in Metastatic Colorectal Cancer †

by
Pooja Mittal
1,2,
Francesca Battaglin
1,
Yan Yang
3,
Shivani Soni
1,
Sebastian Stintzing
4,
Aparna R. Parikh
5,
Karam Ashouri
1,
Sandra Algaze
1,
Priya Jayachandran
1,
Lesly Torres-Gonzalez
1,
Wu Zhang
1,
Chiara Cremolini
6,
Volker Heinemann
7,
Joshua Millstein
3,
Indrakant K. Singh
1,2,8 and
Heinz-Josef Lenz
1,*
1
Division of Medical Oncology, Norris Comprehensive Cancer Center, Keck School of Medicine, University of Southern California, Los Angeles, CA 90089, USA
2
Department of Zoology, Deshbandhu College, University of Delhi, New Delhi 110019, India
3
Department of Population and Public Health Sciences, Keck School of Medicine, University of Southern California, Los Angeles, CA 90032, USA
4
Medical Department, Division of Oncology and Hematology, Charité Universitätsmedizin, 10117 Berlin, Germany
5
Division of Hematology and Oncology, Massachusetts General Hospital, Boston, MA 02114, USA
6
Department of Medical Oncology, University of Pisa, 56126 Pisa, Italy
7
Department of Hematology/Oncology, LMU Klinikum, University of Munich, Comprehensive Cancer Center Munich, 81377 Munich, Germany
8
Delhi School of Public Health, Institute of Eminence, University of Delhi, New Delhi 110007, India
*
Author to whom correspondence should be addressed.
This article is a revised and expanded version of a paper entitled ‘Single nucleotide polymorphisms (SNPs) in MHC class I and II genes to predict outcome in patients (pts) with metastatic colorectal cancer (mCRC): Data from FIRE-3, MAVERICC, and TRIBE trials’, which was presented at the ASCO Annual Meeting 2023, Chicago, IL, USA, 2–6 June 2023.
Int. J. Mol. Sci. 2025, 26(6), 2556; https://doi.org/10.3390/ijms26062556
Submission received: 27 January 2025 / Revised: 7 March 2025 / Accepted: 11 March 2025 / Published: 12 March 2025
(This article belongs to the Special Issue Genetic and Molecular Susceptibility in Human Diseases: 2nd Edition)

Abstract

:
The immune system is alerted for virally infected cells in the body by the antigen presentation pathway, which is in turn mediated by the major histocompatibility complex (MHC) class I and II molecules. Cancer cells overcome immune evasion as a major hallmark by downregulation of the antigen presentation pathway. Therefore, the present study aimed to explore the effect of genetic variants in genes involved in MHC class I and II pathways in patients treated with first-line chemotherapy in combination with targeted antibodies in metastatic colorectal cancer (mCRC) patients. Genomic DNA from the blood samples of 775 patients enrolled in three independent, randomized, first-line trials, namely TRIBE (FOLFIRI-bevacizumab, N = 215), FIRE-3 (FOLFIRI-bevacizumab, N = 107; FOLFIRI-cetuximab, N = 129), and MAVERICC (FOLFIRI-bevacizumab, N = 163; FOLFOX6-bevacizumab, N = 161), was genotyped through OncoArray, a custom array manufactured by Illumina including approximately 530K SNP markers. The impact on the outcome of 40 selected SNPs in 22 genes of MHC class I and II pathways was analyzed. We identified several SNPs in multiple genes associated with targeted treatment benefits across different treatment arms in our study population (p < 0.05). Treatment–SNP interaction analyses confirmed a significant treatment interaction with the targeted agents (bevacizumab vs. cetuximab) and the chemotherapy backbone (FOLFIRI vs. FOLFOX) in certain selected SNPs. Our results highlight a potential role for MHC SNPs as prognostic and predictive biomarkers for first-line treatment in mCRC, with differential effects based on the biologic agent and chemotherapy backbone. These biomarkers, when further validated, may contribute to personalized treatment strategies for mCRC patients.

1. Introduction

Colorectal cancer (CRC) remains a leading cause of cancer-related mortality among both men and women. According to cancer statistics, an estimated 154,270 new CRC cases and 52,900 CRC-related deaths, including both sexes, will emerge in United States in the year 2025. Though CRC is the second-ranking cause of cancer deaths in both sexes combined, improved screening and treatment strategies have led to a sustained reduction in CRC-associated mortality in both men and women [1]. Biomarkers can help in early detection, disease progression, and treatment outcomes in CRC patients [2].
The processing of antigens (antigen processing) and their presentation (antigen presentation) are two important steps of adaptive immune response. The glycoprotein receptors/proteins encoded by the major histocompatibility complex (MHC) are expressed on the surface of the antigen presenting cells (APCs) bound with ligands (processed antigens) and are recognized by T cells, which kill the cancer cells through TCR engagement with the neoantigen. The MHC can be divided into two major classes, MHC class I and II, which present processed and bound antigenic peptides to CD8+ T cells and CD4+ T cells, respectively [3]. MHC molecules are known as the Human Leukocyte Antigens (HLA) in humans, and the HLA genes are located on the short arm of chromosome 6. The HLA class I genes encode for the classical (HLA-A, -B, and -C) present endogenous/exogenous peptides processed by the proteasome to the CD8+ T Cells and non-classical (HLA-E, -F, -G) molecules, while the HLA class II encodes for molecules HLA-DR, -DP, -DQ, -DM, and -DO, which present exogenous peptides processed via lysosomal proteolysis to CD4+ helper T cells [4]. Other than the HLA complex, major genes involved in the antigen processing of MHC class I molecules include endoplasmic reticulum aminopeptidases (ERAP1 and ERAP2), transporters associated with antigen processing (TAP1 and TAP2), tapasin/TAP-binding protein (TAPBP), and beta-2-microglobulin (B2M) [3,5,6]. The CIITA gene encodes for the transcriptional activator that acts as a master switch for antigen presentation and regulates the expression of MHC class II genes [7] (Figure 1). MHC molecules are the major players in the adaptive immune response, and loss or mutations in MHC genes may increase the risk of infectious diseases or malignant/cancerous growths, hence they are among the most frequently mutated genes pan-cancer [3,8]. Cancer cells may express several tumor-specific or tumor-associated antigens and neoantigens, which can be recognized by the T cells and trigger an immune response. However, cancer cells can generally develop mechanisms to escape the host immune system and avoid immune destruction, including loss of function mutations in the genes associated with the antigen processing and presentation machinery (APM), which impairs MHC expression up to 93% in common cancers [9,10,11].
CRC is a heterogeneous disease characterized by genomic instability and immune cell infiltration which has been classified into several molecular subtypes based on gene expression signatures and activated pathways. T-cell-based immune therapies are emerging as promising treatment options for CRC and other malignancies [12]. Despite these advances, the prevalence and impact of SNPs and other mutations in MHC genes in relation to metastatic tumors remains largely elusive [8]. Strategies to activate the APM, including MHC gene expression in cancer, might increase anti-tumor immunity and thus may become an alternative approach for cancer treatment [11]. MHC class I and II genes are also associated with immune infiltration in the tumor microenvironment in metastatic CRC [13]. Studies have shown that the downregulation or loss of MHC class I expression correlates with poor prognosis in CRC, conferred by the avoidance of T-cell-mediated immunity. However, the downregulation of MHC class I expression sensitizes cells to natural killer (NK)-cell-mediated cytotoxicity via the loss of MHC class I inhibitory ligands and the activation of killer cell immunoglobulin-like receptors (KIRs). Interestingly, studies also hint towards the avoidance of this NK-cell-mediated clearance in tumor cells via the temporary and reversible upregulation/modulation of MHC class I expression via (post-) transcriptional modifications [14,15]. Previous studies highlight the association of single nucleotide polymorphisms (SNPs) in the APM and HLA genes with the anti-cancer response to chemotherapy, including non-small cell lung cancer (NSCLC) [16].
In the present study, we hypothesized that common and functional SNPs within MHC class I and II genes would correlate with survival outcomes in cetuximab- or bevacizumab-treated mCRC patients. To test our hypothesis, we used genetic and clinical data from three independent randomized clinical trials, FIRE-3 [17], TRIBE [18], and MAVERICC [19], comparing cetuximab vs. bevacizumab in combination with FOLFIRI/FOLFOX in the first-line treatment of patients with mCRC [20].

2. Results

2.1. Patient Characteristics

A total of 775 patients (enrolled in three independent, randomized, first-line trials) were included in the present study: 215 patients were in the bevacizumab cohort of TRIBE (FOLFIRI-bevacizumab), 107 patients were in the bevacizumab cohort of FIRE-3 (FOLFIRI-bevacizumab), 129 patients were in the cetuximab cohort of FIRE-3 (FOLFIRI-cetuximab), 163 patients were in the bevacizumab cohort (FOLFIRI-bevacizumab) of MAVERICC, and 161 patients were in the bevacizumab cohort (FOLFOX6-bevacizumab) of MAVERICC (Figure 2). The median follow-up time, PFS, and OS were 48.9, 9.7, and 26.2 months in TRIBE; 23.3, 12.5, and 27.4 months in MAVERICC; and 26.7, 11.5, and 31.4 months in the FIRE-3 FOLFIRI-bevacizumab cohort, respectively. The median follow-up time, PFS, and OS were 29.1, 12.8, and 49.8 months in the FOLFIRI-cetuximab cohort of FIRE-3, and 26.8, 10.1, and 24.7 months in FOLFOX6-bevacizumab cohort of MAVERICC, respectively.

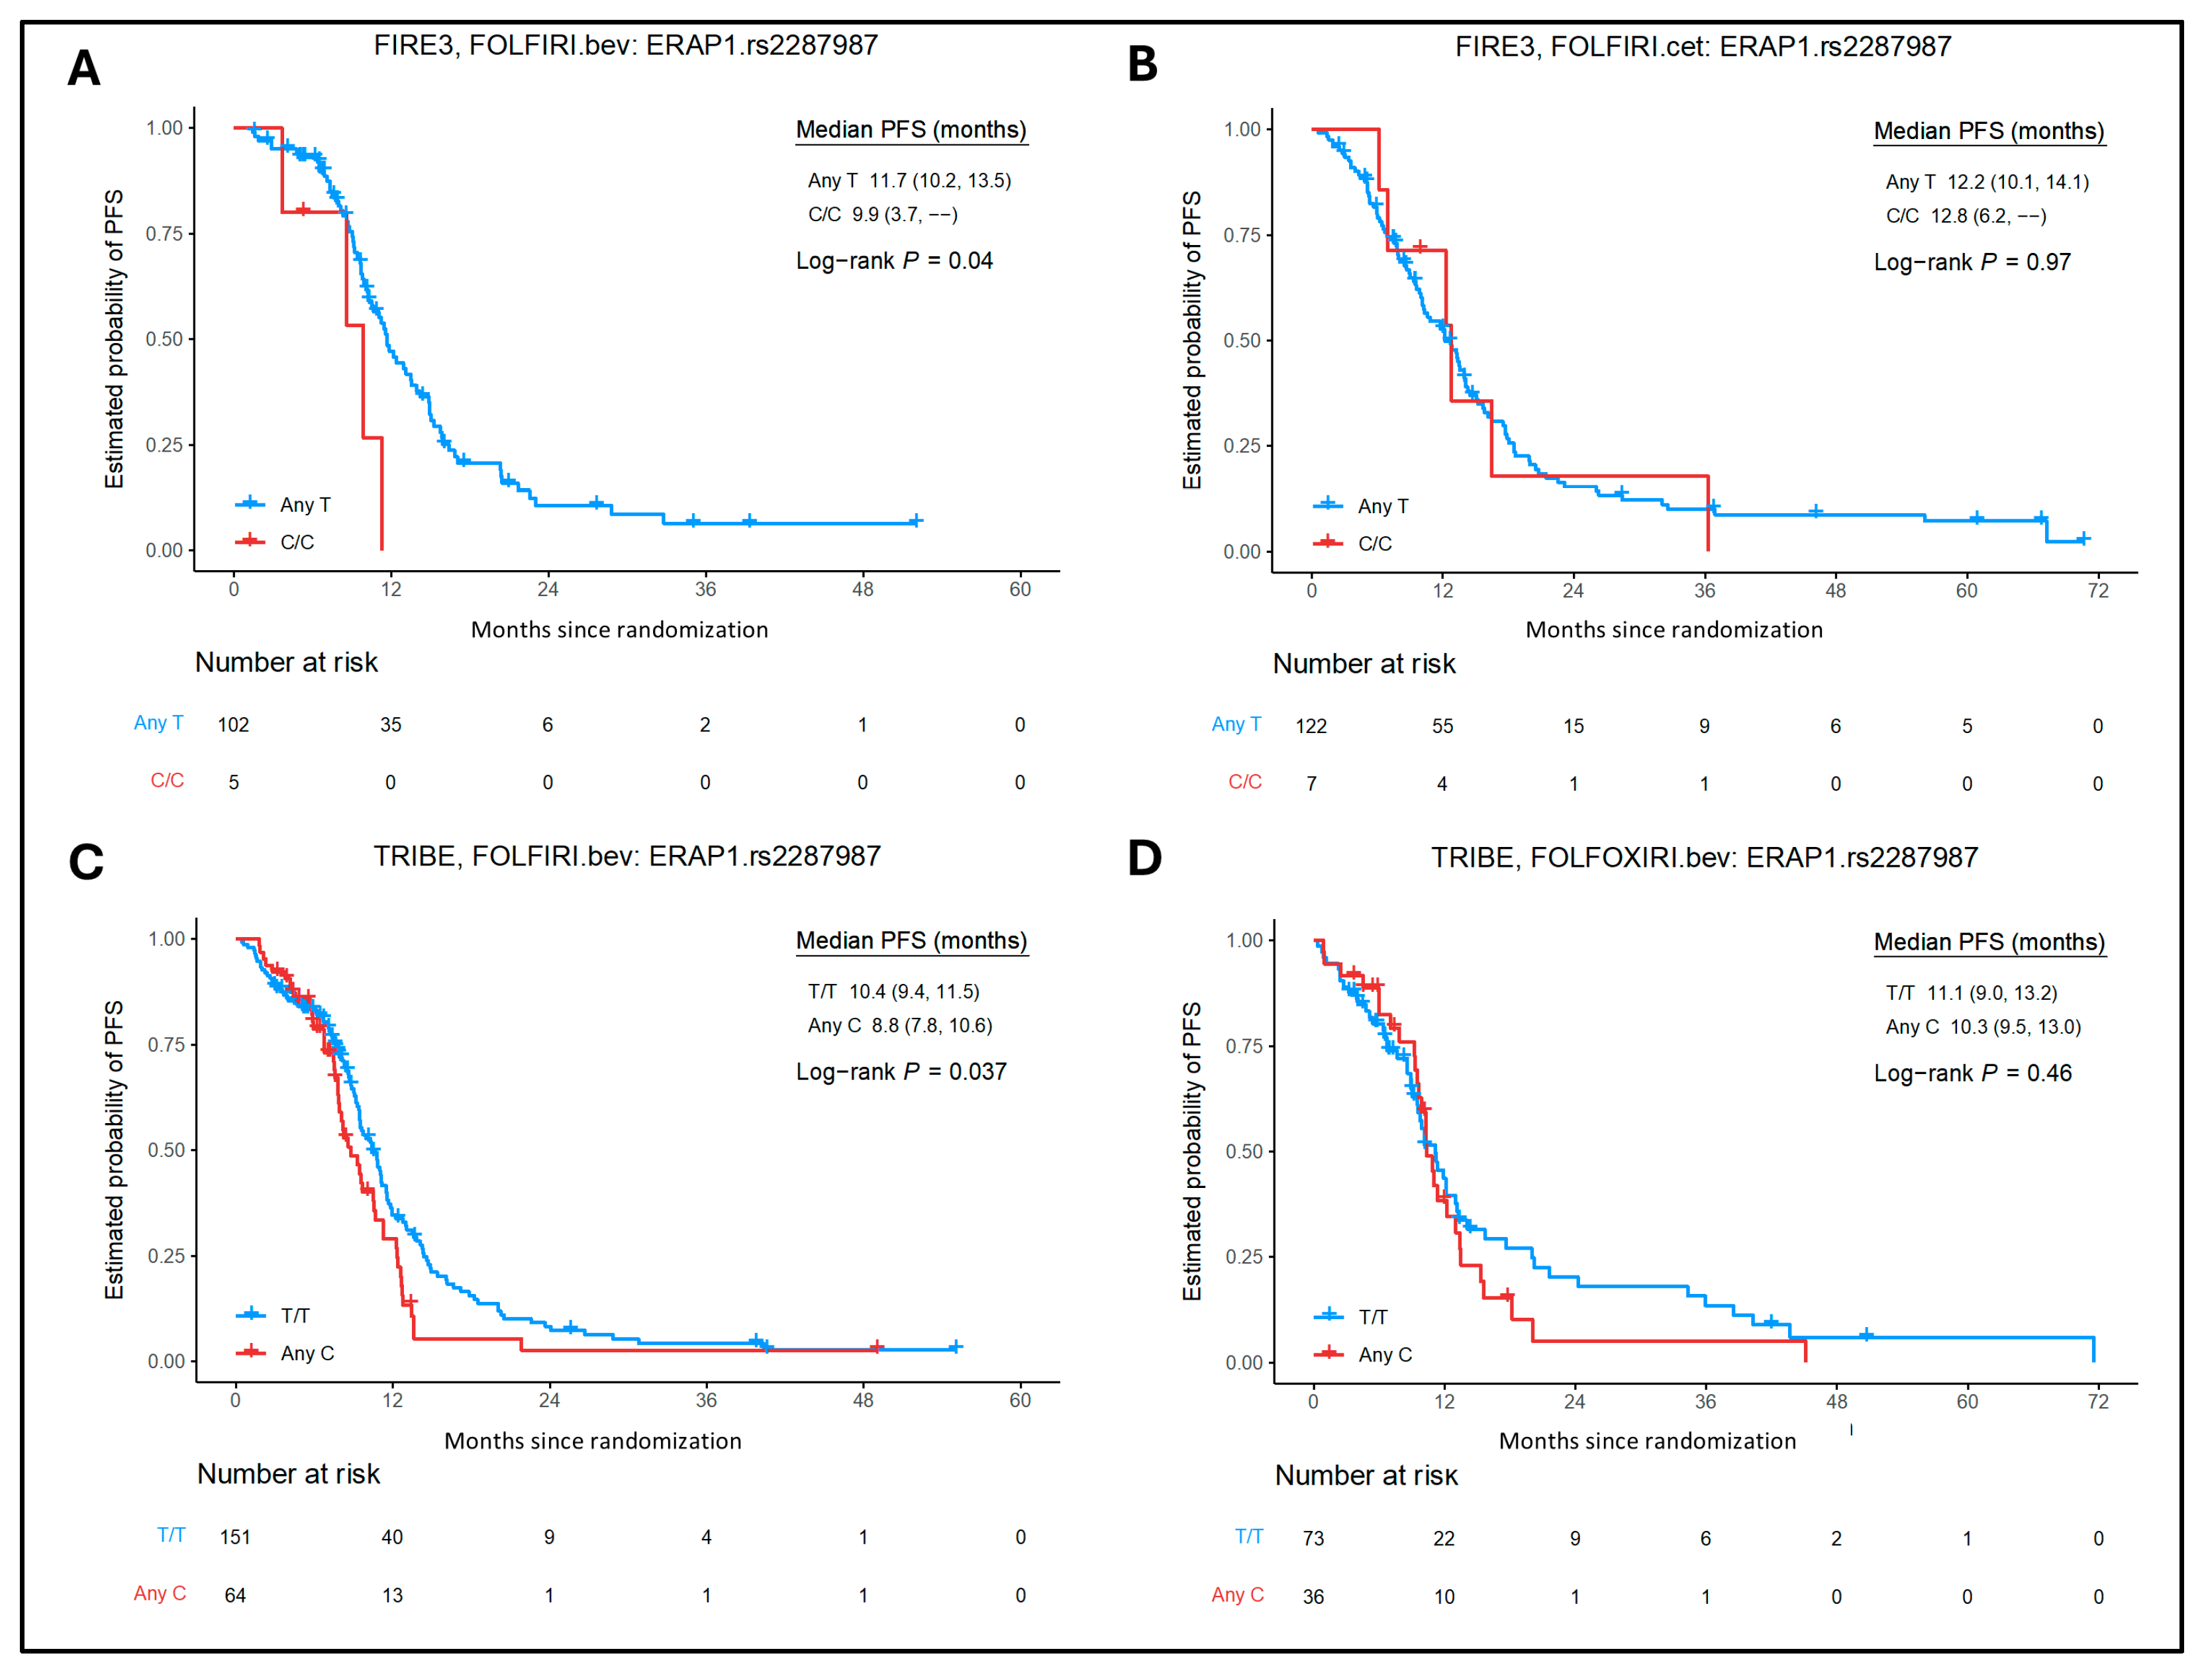
2.2. Association of MHC Class I and II SNPs with Clinical Outcomes in the Cetuximab Cohort

Among the 24 candidate SNPs for MHC class I genes, TAP2 rs241447, TAP2 rs1044043, TAPBP rs3106191, and HLA-B rs2770 showed significant associations with clinical outcomes in both uni- and multivariate analyses of the cetuximab cohort (Table S3). Patients with mCRC and TAP2 rs241447 C/C allele (n = 10) showed significantly shorter OS than any T carriers (n = 119) [28.6 versus 51.9 months, hazard ratio (HR) = 2.91; 95% confidence interval (CI) = 1.11–7.67; p = 0.023] (Figure 3); TAP2 rs1044043 A/A allele (n = 10) showed significantly better PFS than any C carriers (n = 119) [32.1 versus 12.1 months, HR = 0.47; 95% CI = 0.22–1.02; p = 0.045]; TAPBP rs3106191 any A allele (n = 66) showed significantly shorter PFS than C/C carriers (n = 63) [10.3 versus 15.1 months, HR = 1.75; 95% CI = 1.18–2.59); p = 0.0049]; HLA-B rs2770 any G allele (n = 67) showed significantly better OS than A/A carriers (n = 20) [56.1 versus 37.4 months, HR = 0.42; 95% CI = 0.19–0.93); p = 0.027] in univariate analysis. The abovementioned results were confirmed in multivariate analysis: TAP2 rs241447 (C/C allele versus any T, HR = 3.35; 95% CI = 1.24–9.08; p = 0.035); TAP2 rs1044043 (A/A allele versus any C, HR = 0.34; 95% CI = 0.15–0.78; p = 0.0038); TAPBP rs3106191 (any A allele versus C/C, HR = 1.86; 95% CI = 1.24–2.79; p = 0.0026); and HLA-B rs2770 (any G allele versus A/A, HR = 0.38; 95% CI = 0.16–0.86; p = 0.027). Apart from these, SNPs in the following genes showed significance only in univariate analysis: TAP1 rs1135216 any C showed better OS compared with T/T (HR = 0.43; 95% CI = 0.19–0.99; p = 0.042); TAP2 rs1800454 any T showed better OS compared with C/C (HR = 0.42; 95% CI = 0.17–0.99; p = 0.042); and HLA-G rs1610696 any G showed better PFS compared with C/C (HR = 0.67; 95% CI = 0.45–1.00; p = 0.046). TAP2 rs1044043 (dominant model) any A allele showed better PFS compared with C/C carriers (HR = 0.62; 95% CI = 0.40–0.94; p = 0.021) in multivariate analysis.
Among the 16 candidate SNPs for MHC class II genes, HLA-DPB1 rs3097671 and HLA-DRA rs7192 showed significant associations with clinical outcomes in both uni- and multivariate analyses in the cetuximab cohort. Patients with mCRC and HLA-DPB1 rs3097671 any C allele (n = 38) showed significantly shorter PFS than G/G carriers (n = 91) [9.9 versus 13.5 months, HR = 1.69; 95% CI = 1.11–2.58; p = 0.014] and HLA-DRA rs7192 any T allele (n = 82) showed significantly better PFS [13.9 versus 8.7 months, HR = 0.62; 95% CI = 0.42–0.92; p = 0.014] and OS [56.1 versus 40.8 months, HR = 0.53; 95% CI = 0.29–0.98; p = 0.039] than G/G carriers (n = 47). The abovementioned results were confirmed in multivariate analysis, HLA-DPB1 rs3097671 (any C versus G/G, HR = 1.76; 95% CI = 1.14–2.73; p = 0.014), and HLA-DRA rs7192 (any T versus G/G, HR = 0.65; 95% CI = 0.44–0.98; p = 0.043) for PFS and (any T versus G/G, HR = 0.52; 95% CI = 0.28–0.98; p = 0.044) for OS. Apart from these, CIITA rs4774 any C showed better OS compared with G/G (60.6 vs. 42.0 months, HR = 0.50; 95% CI = 0.25–0.98; p = 0.039); HLA-DMB rs10751 any A showed shorter PFS compared with G/G (9.5 vs. 12.9 months, HR = 1.76; 95% CI = 1.08–2.87; p = 0.03) in only multivariate analysis; and HLA-DOB rs11244 A/A showed shorter PFS compared with any G (7.8 vs. 12.8 months, HR = 2.18; 95% CI = 1.00–4.75; p = 0.045) in univariate analysis (Table S4).
Additionally, the multiple hypothesis testing corrections were computed and SNPs with q values < 0.1 were considered as statistically significant. TAP2 rs1044043 and TAPBP rs3106191 both showed a q value < 0.1 for PFS in multivariate analysis in the FIRE-3 FOLFIRI-cetuximab cohort.

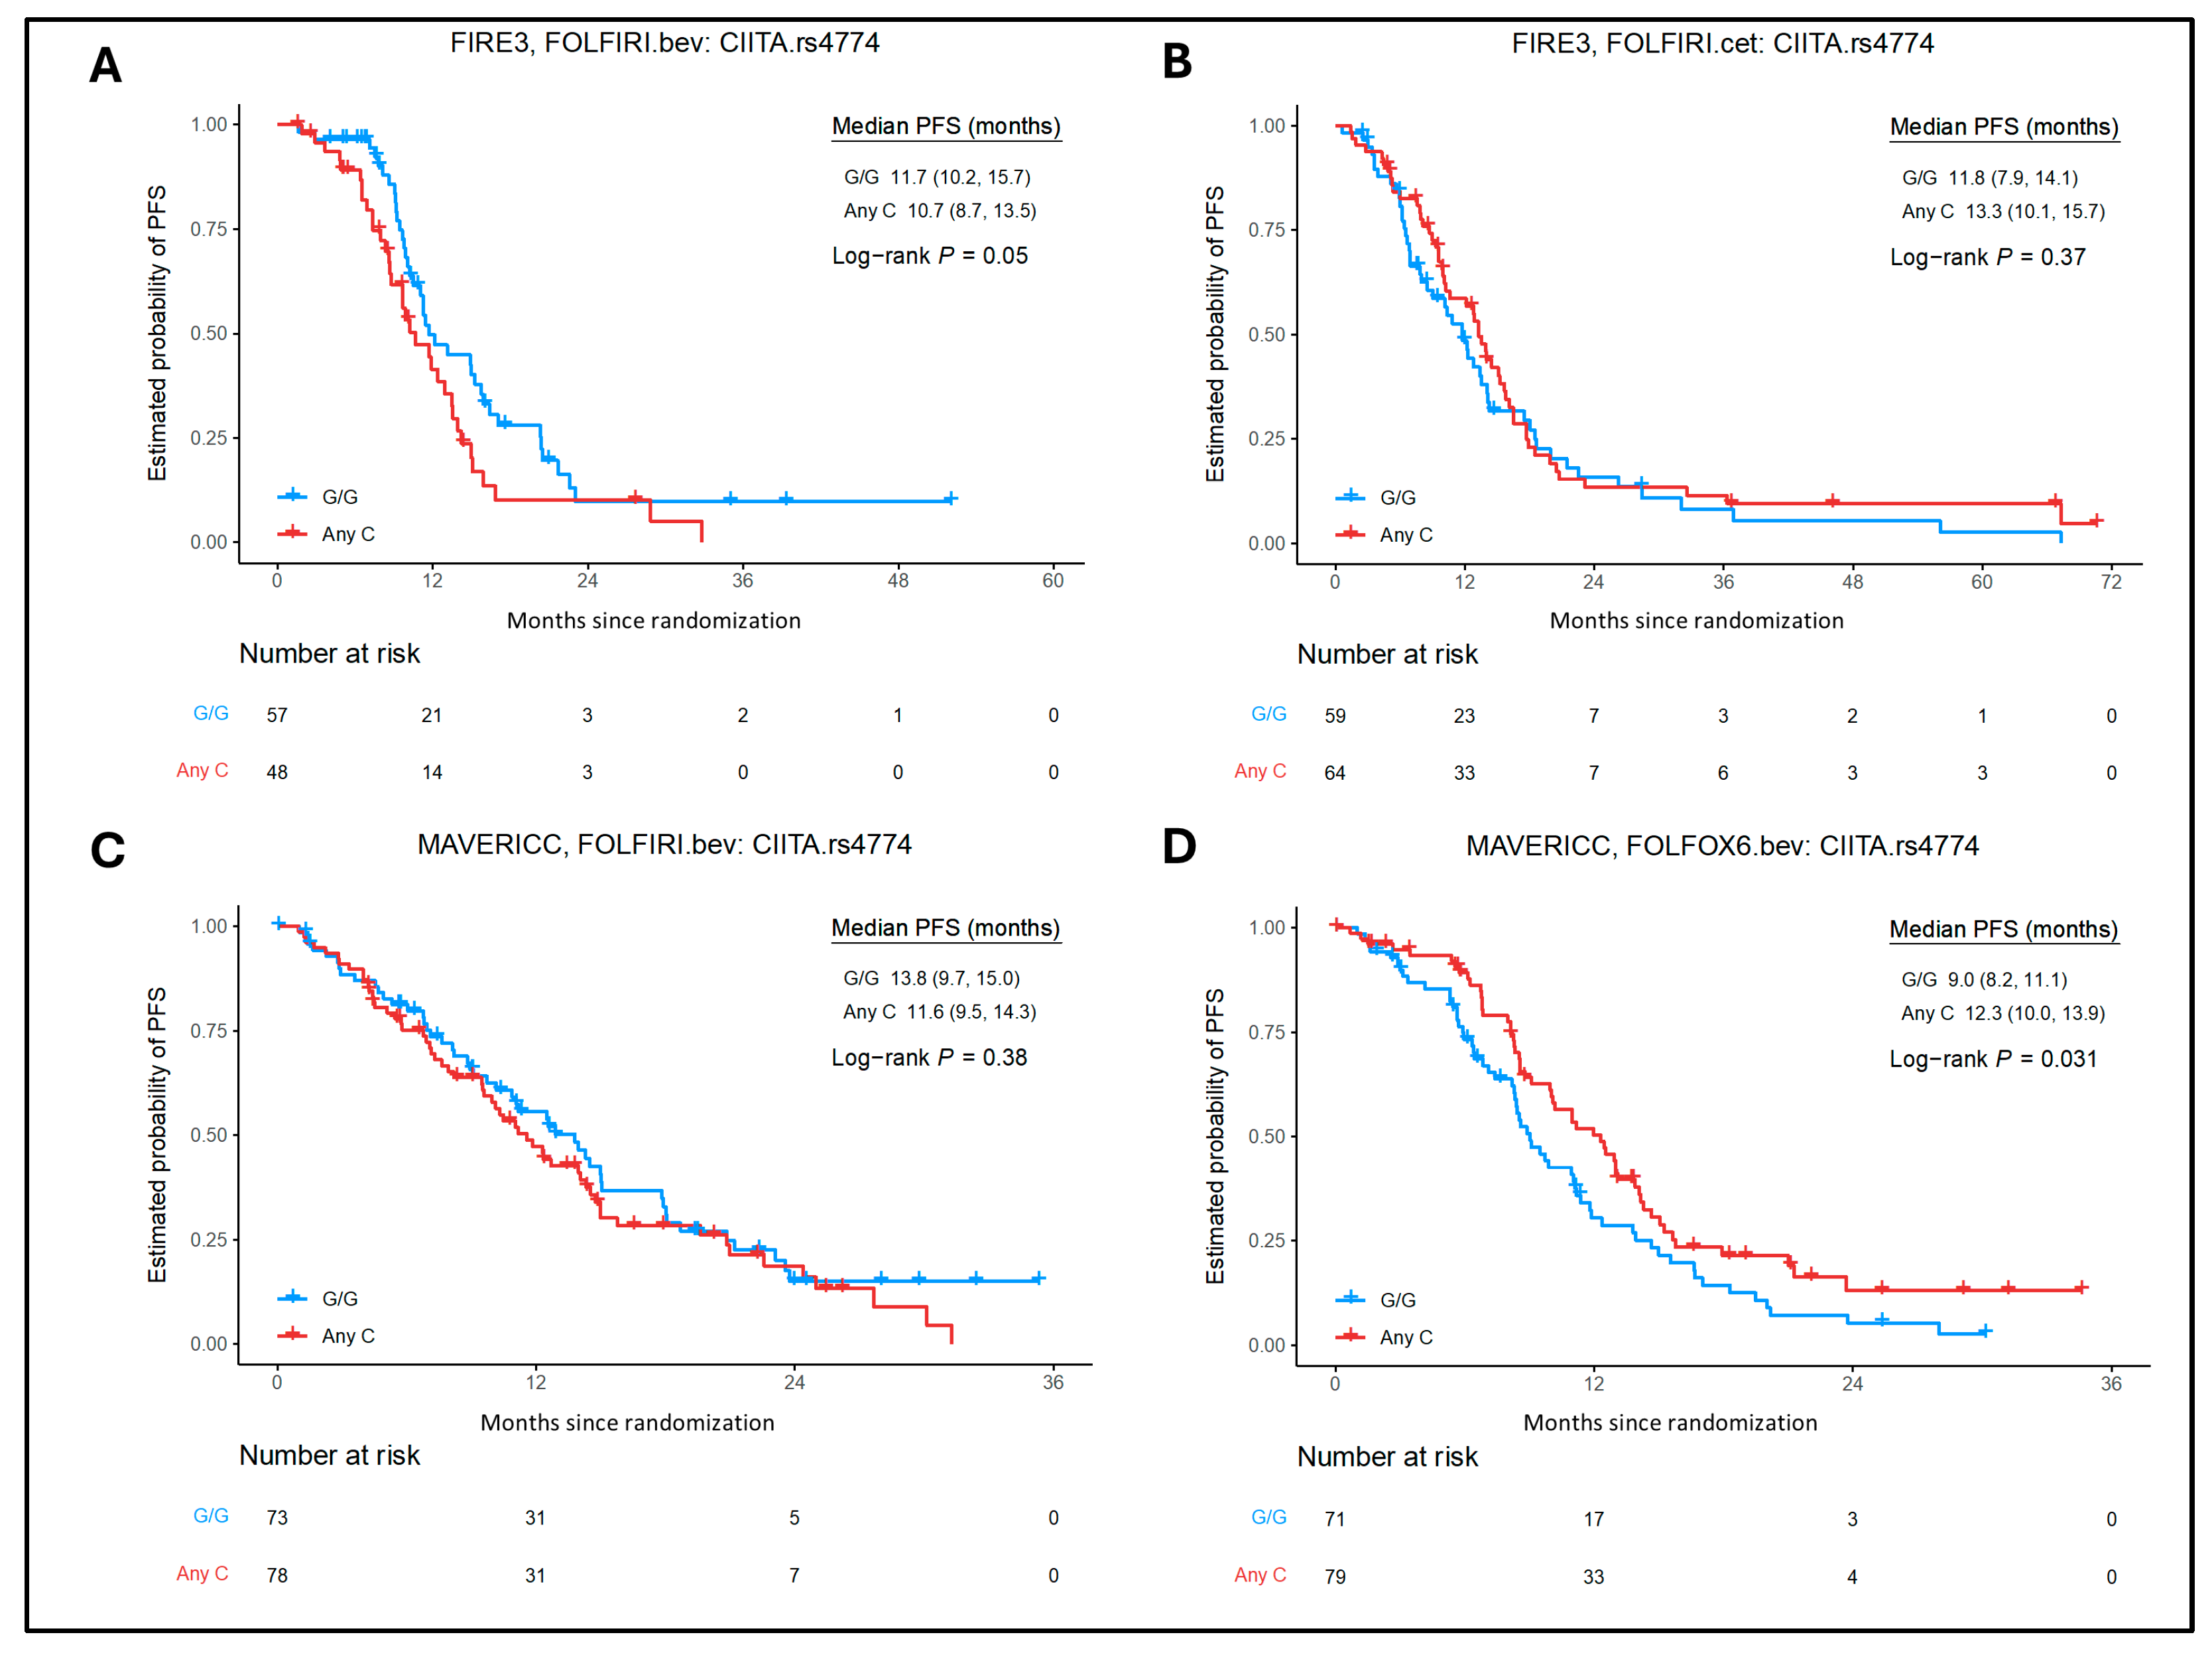
2.3. Association of MHC Class I and II SNPs with Clinical Outcomes in the Bevacizumab Cohorts

In the bevacizumab cohorts (FIRE-3, TRIBE, and MAVERICC), for MHC class I genes SNPs, there were no significant associations between TAP1 rs1135216 and OS, TAP2 rs1800454 and OS, TAP2 rs1044043 and PFS, TAPBP rs3106191 and PFS, HLA-B rs2770 and OS, and HLA-G rs1610696 and PFS, in both univariate and multivariate analyses (Table S3). Similarly, for MHC class II genes SNPs, significant associations between HLA-DMB rs10751 and PFS, HLA-DOB rs11244 and PFS, HLA-DPB1 rs3097671 and PFS, and HLA-DRA rs7192 and both PFS/OS were not found in either univariate or multivariate analyses. Patients carrying TAP2 rs241447 C/C allele (n = 13) showed significantly shorter OS than any T carriers (n = 150) [15.5 versus 27.9 months, HR = 2.40, 95% CI = 1.13–5.09; p = 0.018] in univariate analysis, and the results were confirmed in multivariate analysis (HR = 2.87, 95% CI = 1.30–6.33; p = 0.019). Interestingly, patients carrying CIITA rs4774 had an opposite effect compared with the cetuximab cohort, with C/C allele (n = 10) showing shorter OS compared with any G carriers (n = 95) [20.1 versus 39.9 months, HR = 2.55, 95% CI = 1.13–5.77; p = 0.02] in univariate analysis (but not in multivariate analysis) (Table S4).
Several significant associations between other SNPs and OS/PFS were found in the bevacizumab cohorts (Tables S3 and S4). In the FIRE-3 bevacizumab cohort, patients carrying ERAP1 rs2287987 C/C allele (n = 5) showed worse PFS compared with any T carriers (n = 102) (9.9 versus 11.7 months) in both univariate (HR = 2.81, 95% CI = 1.00–7.89; p = 0.04) and multivariate (HR = 3.46, 95% CI = 1.18–10.12; p = 0.049) analyses (Figure 4), while HLA-DMB rs1042337 G/G carriers (n = 5) showed better PFS compared with any A allele (n = 102) in multivariate analysis [21.7 versus 11.4 months, HR = 0.16, 95% CI = 0.02–1.18; p = 0.015].
In the TRIBE bevacizumab cohort, patients with ERAP1 rs2287987 any C allele (n = 64) showed shorter PFS compared with T/T carriers (n = 151) (8.8 vs. 10.4 months) in both univariate (HR = 1.44, 95% CI = 1.02–2.02; p = 0.037) and multivariate analysis (HR = 1.48, 95% CI = 1.04–2.12; p = 0.035); TAP1 rs1135216 any C (n = 50) showed shorter PFS compared with T/T carriers (n = 165) (HR = 1.55, 95% CI = 1.08–2.23; p = 0.017) in univariate analysis; HLA-E rs1059510 any T allele (n = 99) showed better OS compared with C/C carriers (n = 116) (31.0 vs. 25.1 months) in univariate analysis (HR = 0.72, 95% CI = 0.53–0.98; p = 0.036); HLA-DRA rs3177928 A/A carriers (n = 5) showed shorter OS compared with any G allele (n = 210) (14.1 vs. 26.8 months) in both univariate (HR = 4.20, 95% CI = 1.70–10.39; p = 0.00073) and multivariate (HR = 3.96, 95% CI = 1.50–10.44; p = 0.017) analyses; and HLA-DQB1 rs1063355 any T allele (n = 127) showed shorter PFS compared with G/G carriers (n = 87) (9.5 vs. 10.4 months) in univariate analysis (HR = 1.42, 95% CI = 1.04–1.95; p = 0.029).
In the MAVERICC FOLFIRI/bevacizumab cohort, mCRC patients with ERAP1 rs26653 any C allele (n = 91) showed better PFS compared with G/G carriers (n = 70) (14.5 vs. 10.1 months) in both univariate (HR = 0.57, 95% CI = 0.39–0.83; p = 0.0033) and multivariate (HR = 0.54, 95% CI = 0.35–0.84; p = 0.0062) analyses; TAP2 rs241447 C/C carriers (n = 13) showed shorter OS compared with any T allele (n = 150) in univariate analysis (15.5 vs. 27.9 months, HR = 2.40, 95% CI = 1.13–5.09; p = 0.018); and HLA-DMB rs1042337 G/G carriers (n = 8) showed shorter PFS compared with any A allele (n = 155) (6.1 vs. 12.9 months) in both univariate (HR = 3.77, 95% CI = 1.70–8.33; p = 0.00045) and multivariate (HR = 3.33, 95% CI = 1.48–7.48; p = 0.011) analyses.
For the FOLFIRI/bevacizumab cohorts in all three trials, no SNPs were found to have significant associations after multiple hypothesis testing corrections.

2.4. Association of MHC Class I and II SNPs with Clinical Outcomes in FOLFOX6/Bevacizumab Arm of MAVERICC Trial

For MHC class I SNPs in the FOLFOX6/bevacizumab arm of the MAVERICC trial, in univariate analysis, TAP2 rs1800454 any T allele (n = 53) showed better PFS (12.9 vs. 8.8 months, HR = 0.42; 95% CI = 0.19–0.93; p = 0.027) and OS (28.7 vs. 22.2 months, HR = 0.58; 95% CI = 0.35–0.97; p = 0.036); TAP2 rs1044043 any A allele (n = 52) showed better OS compared with C/C (n = 109) carriers (28.7 vs. 22.5 months, HR = 0.59; 95% CI = 0.36–0.96; p = 0.031); and HLA-B rs2769 any A (n = 32) allele showed shorter OS compared with G/G (n = 126) carriers (19.4 vs. 25.9 months, HR = 1.79; 95% CI = 1.06–3.01; p = 0.026). For TAP2 rs1800454, the association with PFS (any T vs. C/C, HR = 0.59; 95% CI = 0.36–0.96; p = 0.031) and for TAP2 rs1044043 the association with OS (any A vs. C/C, HR = 0.59; 95% CI = 0.36–0.96; p = 0.031) was confirmed in multivariate analysis. For MHC class II SNPs, in the FOLFOX6/bevacizumab arm of the MAVERICC trial, in univariate analysis CIITA rs4774 any C allele (n = 79) showed better PFS compared with G/G (n = 71) carriers (12.3 vs. 11.1 months, HR = 0.67; 95% CI = 0.46–0.97; p = 0.031), and was significant in multivariate analysis (p = 0.0046) as well as adjusted p value (q value) < 0.1 (Figure 5). HLA-DPA1 rs1042190 any C allele (n = 71) showed better PFS compared with T/T (n = 90) carriers (11.6 vs. 8.8 months, HR = 0.58; 95% CI = 0.39–0.86; p = 0.0063) in multivariate analysis and adjusted p value (q value) of <0.1 (Tables S4 and S5).

2.5. Treatment-by-SNP Interaction

In the dominant genetic model, a significant interaction with treatment was found for HLA-G rs1610696 (PFS in FIRE-3), CIITA rs4774 (OS in FIRE-3), ERAP1 rs26653 and CIITA rs4774 (PFS in MAVERICC), and TAP2 rs1044043 (OS in MAVERICC) (Table S5). HLA-G rs1610696 showed treatment interaction with targeted agents, with better PFS in the cetuximab-treated cohort. CIITA rs4774 showed treatment interaction with both targeted agents and the chemotherapy backbone in FIRE-3 and MAVERICC, respectively. ERAP1 rs26653 and TAP2 rs1044043 showed interaction with the chemotherapy backbone.
In the recessive genetic model, a significant interaction with treatment was seen for TAP2 rs241447 and HLA-DPA1 rs1042190 (PFS in FIRE-3), TAP2 rs1044043 and HLA-DRA rs7192 (OS in FIRE-3) for targeted agents, while CIITA rs6498124 and HLA-DMB rs1042337 (PFS in MAVERICC) showed interaction with the chemotherapy backbone (Table S6).

2.6. Associations Between Selected SNPs and Gene Expression Level in Colon Tissue from GTEx Analysis

The GTEx analysis was obtained for 24 of the total 40 SNPs (significant SNPs selected) tested in the present study. Among MHC class I genes, we found nine SNPs significantly affecting the gene expression status (p < 0.05) in normal colon tissue (sigmoid and/or transverse colon): ERAP1 rs2287987, ERAP1 rs26653, TAP2 rs241447, TAP2 rs1044043, TAPBP rs3106191, HLA-B rs2769, HLA-E rs1059510, and HLA-G rs1063320 (Supplementary Figures S1 and S2). Among MHC class II genes, we found five SNPs significantly affecting the gene expression status (p < 0.05) in normal colon tissue (sigmoid and/or transverse colon): CIITA rs4774, HLA-DOA rs3129303, HLA-DPA1 rs1042190, HLA-DPB1 rs3097671, HLA-DQB1 rs1063355, and HLA-DRA rs3177928 (Supplementary Figures S3 and S4).

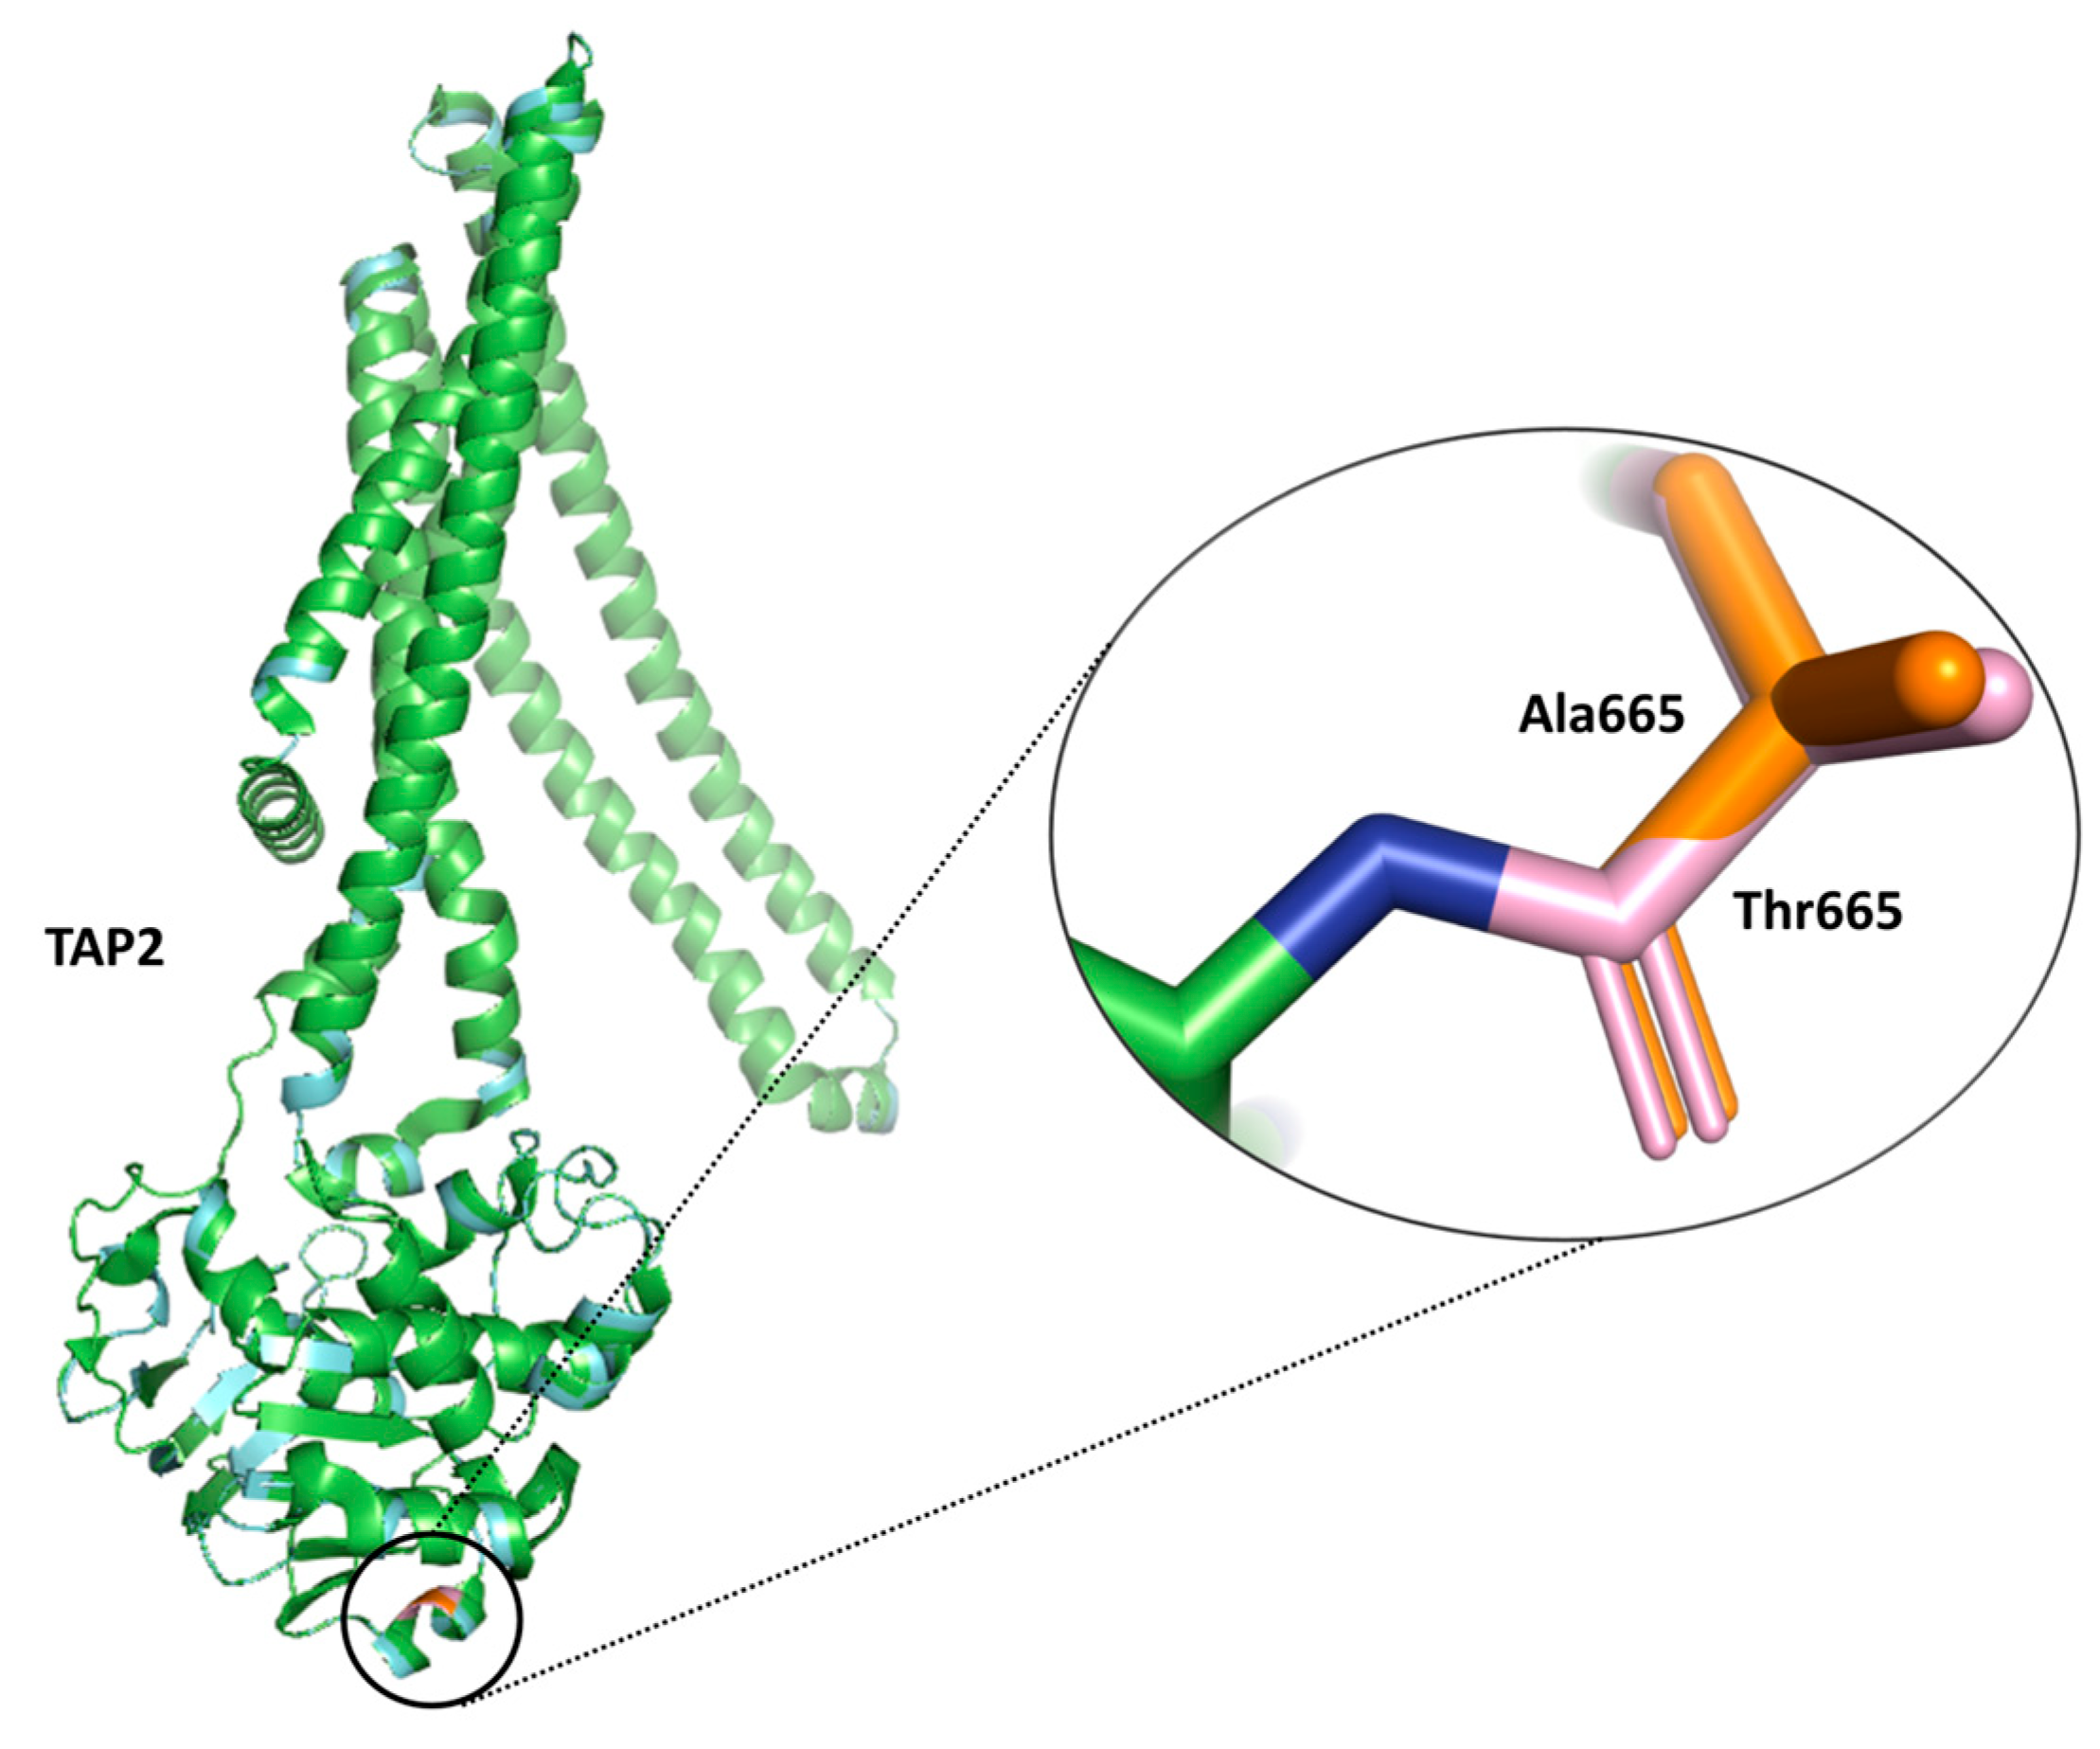
2.7. Impact of Selected SNPs on Protein Function and Stability from SIFT and DUET Analysis

The functional impact on the protein by the SNPs associated with the selected genes from the antigen processing and presentation pathway was assessed using the SIFT server. Out of the 40 SNPs, one SNP rs241447 in TAP2 showed a deleterious effect on the protein function. The rs241447 variant leads to amino acid substitution from threonine to alanine at position 665. The impact of the T665A mutation on TAP2 protein stability was assessed using DUET and DynaMut servers. Both servers predicted a destabilizing effect of the mutation on the TAP2 protein structure (Figure 6).

3. Discussion

Antigen processing and presentation play important roles in adaptive immune response and are mediated by a series of coordinated steps involving multiple proteins. Owing to their important function in normal cells, it has been reported that dysregulation or genetic polymorphisms in the antigen processing and presentation machinery may have implications in several diseases, including sarcoidosis [21], whooping cough [22], cystic fibrosis [23], and NSCLC [24]. The findings in the present study, to the best of our knowledge, reveal for the first time that genetic variations in the antigen processing and presentation pathways are associated with survival outcomes in patients with mCRC, with SNPs showing prognostic and/or predictive association with targeted drugs (cetuximab/bevacizumab) and first-line chemotherapy (irinotecan/oxaliplatin).
The treatment interaction analysis for certain SNPs such as for ERAP1 and CIITA showed interaction with oxaliplatin, which has been shown to cause immunogenic cell death in colorectal cancer cells [25,26] and upregulate MHC class I via the nuclear factor-kappa B (NF-κB) pathway [27]. Our results further support these findings and provide new insights into the association between germline polymorphisms in MHC genes and oxaliplatin efficacy.
Another major finding is the linkage between MHC class I and II SNPs and bevacizumab. Bevacizumab is a recombinant humanized monoclonal IgG1 antibody which targets VEGF-A. Bevacizumab is primarily known to show anti-angiogenic effects; however, reports suggest that it also shows anti-tumor and immune-modulatory effects. VEGF-A inhibits the differentiation and maturation of dendritic cells into their functional form, where they are capable of presenting the tumor antigen on their surface [28,29]. The reports suggested that although VEGF-A inhibits the antigen presentation function of dendritic cells, it did not alter their phenotypic characteristics or induce apoptosis, nor alter the expression of maturation markers including MHC classes I and II [30]. In triple negative breast cancer (TNBC), a VEGF blockade via bevacizumab was shown to increase MHC class I expression and the maturation of memory T cells [31]. However, how the polymorphisms in MHC genes are associated with bevacizumab outcomes in CRC patients remains unknown. Our study showed polymorphisms in MHC genes that were associated with survival outcomes in bevacizumab-treated CRC patients in FIRE-3, TRIBE, and MAVERICC trials, and implicated future studies that could decipher the association between MHC variants and the VEGF-A pathway.
The antigen processing and presentation machinery (APM) play a crucial role in aiding the immune system to recognize and target cancer cells [32]. This particularly raises the potential of utilizing the APM as a therapeutic target for anti-cancer treatment. One such emerging target is ERAP1. ERAPs are responsible for the trimming of antigenic peptides into a size which is suitable for their loading onto HLA (or MHC) class I molecules. The pharmacological inhibition of ERAP1 in the CT26 CRC mouse model using ERAAP (ERAP1 homolog in mice) inhibitor leucinthiol and ERAAP siRNA correlated with tumor regression [33,34]. Greywolf Therapeutics demonstrated their first-in-class ERAP1 inhibitors in combination with anti-PD1 inhibited tumor growth in syngeneic mice tumor models [35]. A previous study reported that any G allele in ERAP1 rs26654 allele might be associated with a lower risk of cervical cancer compared with C/C carriers (p = 0.001) [36]. Additionally, rs26653 is a missense variant and results in P127R amino acid substitution in the ERAP1 protein, which might also have implications on ERAP1 expression and enzymatic activity [37]. Our GTEx analysis revealed that rs26653 variant alleles significantly affect expression of ERAP1 in both the sigmoid and transverse colon, with C/C allele increasing ERAP1 expression. In our analysis, rs26653 C/C carriers had better PFS compared with G/G allele, which might be due to changes in ERAP1 expression, although how the C/C allele affects ERAP1 function in CRC tumors remains unknown. Thus, more functional studies are required to determine the effects of these variants on ERAP1 expression in CRC tumors and their underlying mechanisms.
Epidermal growth factor receptor (EGFR) and vascular endothelial growth factor (VEGF) signaling are the key oncogenic drivers in CRC. EGFR inhibition using cetuximab (monoclonal ligand-blocking antibody) was found to elevate the expression of MHC class I and II molecules in malignant human keratinocytes [38]. Though MHC class I and II gene expression are reportedly linked to the EGFR and VEGF signaling pathways, the clinical implications of genetic alterations in these molecules in mCRC remains largely elusive and unknown.
Apart from the HLA genes which have been extensively studied, other regulatory components of the APM such as those involved in transcriptional regulation (e.g., CIITA) or transport of peptides (e.g., TAP1 and TAP2) are interesting candidates for exploration of their effect on CRC. The antigen peptides, after being processed by the proteasome, enter the endoplasmic reticulum via the heterodimer transporter complex comprising two subunits, TAP1 and TAP2 [39]. TAP expression has been found to be dysregulated in several cancers, including breast and melanoma, and mutations in the TAP genes in small-cell lung cancer have been implicated in the escape from immune recognition in tumor cells [40]. TAP2 rs241447 is a missense variant that leads to the amino acid substitution from threonine to alanine at residue position 665 (T665A) [41]. These structural modifications may lead to the disruption of the peptide transport and thus downstream processing of antigenic peptides. TAP2 rs241447 variants has been recently reported to affect mRNA expression in bladder cancer tissue [42]. GTEx analysis reveals that TAP2 variants rs241447 and rs1044043 are associated with a change in the expression of TAP2 in the sigmoid and/or transverse colon. A reduction in TAP2 expression results in the reduced stability and expression of MHC molecules on the tumor cell surface, in turn leading to immune evasion by tumor cells.
Work by Pollack et al. (2011 and 2012) has demonstrated an interesting mechanism by which EGFR inhibitors could influence adaptive immune response by augmenting MHC class I and II gene expression. It has been reported that the transactivation of EGFR along with IFN-γ leads to the attenuation of CIITA induction, and at the same time EGFR inhibitors lead to an augmentation in the induction of CIITA via IFN-γ [38,43]. CIITA is a transcriptional activator which coordinates the expression of the entire MHC class II gene family. Controlled and forced expression of CIITA in MHC class II-negative hepatocellular cell lines rendered them MHC class II-positive and allowed for better recognition of tumor antigens by CD4+ helper T cells. A combination of existing immunotherapeutic approaches, such as immune-checkpoint inhibitors or oncolytic viruses, with MHC-II expression transcriptionally enhanced by CIITA in cancer cells could potentially increase the recognition of tumor antigen and effector T-cell activation [44]. Treatment interaction in the FIRE-3 cohort showed a significant interaction between CIITA rs4774 and the targeted agents, and based on our results we could hypothesize better OS for mCRC patients with rs4774 C/C variants who were treated with cetuximab compared with bevacizumab. Some studies hint towards the impact of EGFR inhibition on the induction of CIITA expression in non-small cell lung cancer [45]; however, studies are warranted that will validate these findings in CRC and to exploit them for better patient treatment.
Our findings suggest a novel approach of clinical decision making based on the genotype of SNPs in the antigen processing and presentation machinery. Using SNPs MHC I and MCH II may identify patients who would benefit most from combinations including FOLFIRI-bevacizumab, FOLFIRI-cetuximab or FOLFOX6-bevacizumab. An improved understanding of the antigen processing and presentation pathway may allow the development of more effective and less toxic therapies. This study has several limitations. Firstly, this study was performed in a retrospective setting which may introduce selection bias, thus, its prospective validation in clinical trials is warranted/required. Secondly, the prognostic/predictive value of MHC class I and II polymorphisms needs validation in independent cohorts and in vitro/in vivo studies. Thirdly, some statistical limitations need to be mentioned. In certain subgroups, the survival data might appear underpowered and lead to skewed p-values and limited sample size, and this prevented us from including some important molecular characteristics such as MSI that are not well represented in the included studies. Lastly, the GTEx analysis provides expression in normal colon tissue and not tumor tissue, and thus the effect of the allele variants on gene expression in the tumor tissue remains unclear. In conclusion, personalized treatment strategy in the choice of targeted drug or backbone chemotherapy based on the genotype of the SNPs reported in the present analysis need to be further validated in future clinical studies.

4. Materials and Methods

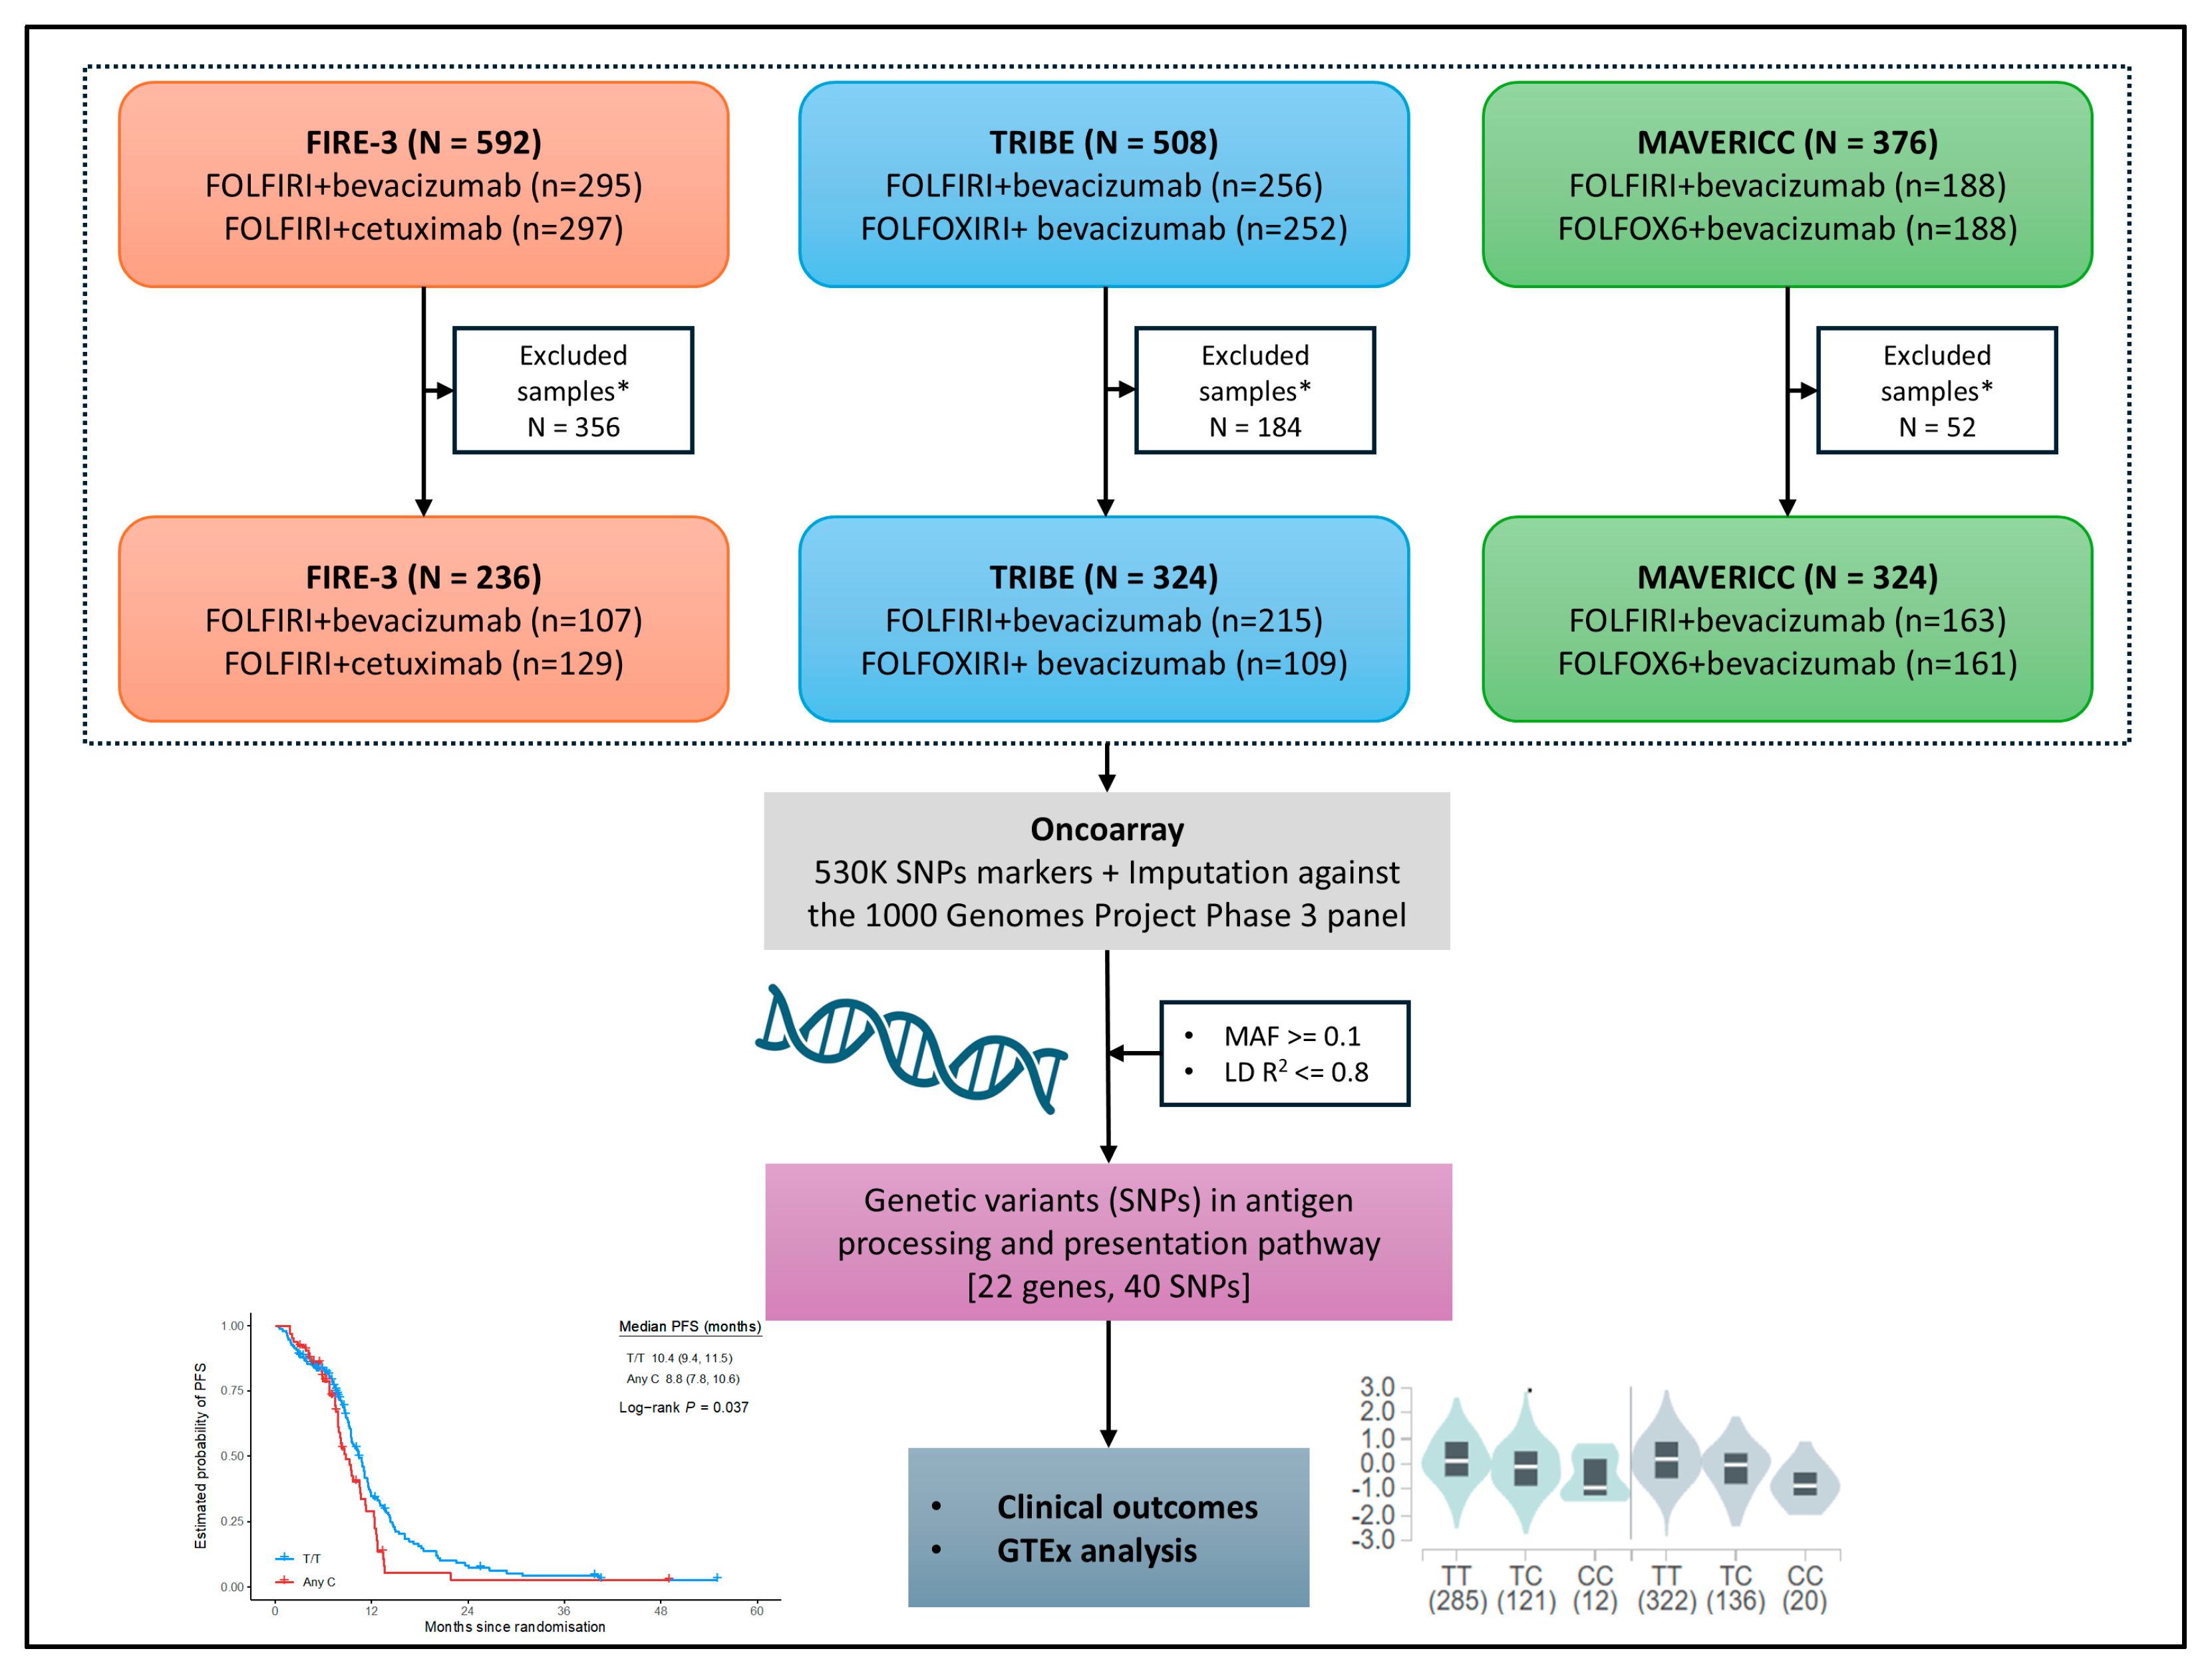
4.1. Patient Samples/Cohorts and Study Design

In the present study, the subjects included were patients with mCRC enrolled in three independent randomized clinical trials, FIRE-3 (NCT00433927) [17], TRIBE (NCT00719797) [18], and MAVERICC [19]. FIRE-3 and TRIBE are Phase III and MAVERICC is a Phase II trial. Patients without sufficient peripheral whole blood samples, SNP data, and/or any other relevant data for analyses were excluded from the study. The FIRE-3 trials included patients randomized to treatment with FOLFIRI plus cetuximab or FOLFIRI plus bevacizumab, the TRIBE trial included patients randomized to treatment with FOLFOXIRI plus bevacizumab or FOLFIRI plus bevacizumab, while the MAVERICC trial included patients with FOLFIRI plus bevacizumab or FOLFOX6 plus bevacizumab. To assess the impact of SNPs associated with MHC class I and II pathway genes on the treatment efficacy, we set the cohorts as follows: cetuximab cohort (FOLFIRI-cetuximab arm of FIRE-3 trial); bevacizumab cohort 1 (FOLFIRI-bevacizumab arm of FIRE-3 trial); bevacizumab cohort 2 (FOLFIRI-bevacizumab arm of TRIBE trial); bevacizumab cohort 3 (FOLFIRI-bevacizumab arm of MAVERICC trial); and bevacizumab cohort 4 (FOLFOX-bevacizumab arm of MAVERICC trial).

4.2. Selection of Polymorphisms and Genotyping

Genomic DNA was isolated from the peripheral whole blood samples collected prior to treatment initiation using the QIAamp DNA Blood Mini Kit (Qiagen, Inc., Valencia, CA, USA) in accordance with the manufacturer’s protocol (www.qiagen.com) in the year 2015. Genotyping was performed using the OncoArray platform from Illumina (Illumina, San Diego, CA, USA) containing 530K SNP markers as previously described in Arai et al. (2020) [46]. Ungenotyped SNPs were imputed against the 1000 Genomes Project Phase 3 panel. We focused on 22 genes encoding members of MHC class I and II pathways (ERAP1, ERAP2, TAP1, TAP2, TAPBP, β2M, HLA-A, HLA-B, HLA-C, HLA-E, HLA-F, HLA-G, CIITA, HLA-DMA, HLA-DMB, HLA-DOA, HLA-DOB, HLA-DPA1, HLA-DPB1, HLA-DQA1, HLA-DQB1, and HLA-DRA). The candidate SNPs for this study were selected from dbSNP variants (http://www.ncbi.nlm.nih.gov) based on fulfilling the following criteria: (1) minor allele frequency in Caucasians (defined as ‘European’ in 1000 Genomes Project phase III) of equal to or greater than 10% based on the Ensembl Genome Browser (https://www.ensembl.org); (2) having potential biological functions, including transcription factor-binding site, splicing site, miRNA-binding site, nonsynonymous coding, stop codon, and drug sensitivity, based on the published literature and/or public databases such as https://snpinfo.niehs.nih.gov and https://www.ncbi.nlm.nih.gov; (3) tag SNPs with an r2 threshold of 0.8 selected from HapMap genotype data (https://snpinfo.niehs.nih.gov). Using the LDlink suite (https://ldlink.nci.nih.gov), SNPs showing a linkage disequilibrium (LD) of R2 > 0.8 were excluded from the study. The above-mentioned databases were accessed from October-November 2022 for the present study. In total, 40 SNPs met the inclusion criteria for this study and were used for further analysis: ERAP1 (rs30187, rs26653, rs2287987, rs13160562), ERAP2 (rs41506651, rs2549782), TAP1 (rs1135216), TAP2 (rs241447, rs1800454, rs1044043), TAPBP (rs2071888, rs3106191), β2M (rs2255235), HLA-A (rs2499, rs2770), HLA-B (rs1058026, rs2769, rs1049853), HLA-C (rs35075694, rs1049281), HLA-E (rs1059510), HLA-F (rs1736924), HLA-G (rs1610696, rs1063320), CIITA (rs4774, rs1139564, rs6498124), HLA-DMA (rs1063478), HLA-DMB (rs1042337, rs10751), HLA-DOA (rs375256, rs9276975, rs3129303), HLA-DOB (rs11244), HLA-DPA1 (rs1042190), HLA-DPB1 (rs3097671), HLA-DQA1 (rs707952), HLA-DQB1 (rs1063355), and HLA-DRA (rs7192, rs3177928). The characteristics of the selected SNPs are represented in Tables S1 and S2.

4.3. Statistical Analysis

The 40 selected SNPs, associated with the 22 genes involved in MHC class I and II pathways, were evaluated for possible associations with tumor response, PFS, and OS based on the three genetic models (additive, dominant, and recessive). PFS was defined as the time from randomization to disease progression or death from any cause. OS was defined as the time from randomization to death from any cause. Patients who did not experience any events were censored at the last follow-up date. Log-rank tests were used to evaluate associations between SNPs and PFS or OS in univariate analyses and likelihood ratio tests were used for multivariable analyses with Cox proportional hazards models. Trial-specific adjustment covariates for FIRE-3 were age, sex, Eastern Cooperative Oncology Group (ECOG), performance status (PS), liver-limited disease, RAS/BRAF status, and tumor sidedness; for TRIBE, they were age, sex, ECOG PS, liver-limited disease, RAS/BRAF status, tumor sidedness, adjuvant chemotherapy, and primary tumor resection; and for MAVERICC, they were age, sex, ECOG, RAS status, ethnicity, primary tumor resection, number of metastatic sites, and tumor sidedness. The first three principal components (PCs) computed from ancestry informative markers (AIMs) included on the OncoArray were included as additional adjustment covariates. p values were adjusted for multiple comparisons by computing the False Discovery Rate (FDR) and represented as q values. Benjamini and Hochberg FDR (BH FDR) was computed separately for each study arm, each outcome, and MHC I vs. MHC II pathways. FDR was computed solely for multivariable likelihood ratio tests, grouping additive, dominant, and recessive models [47]. To formally assess the predictive value of SNPs, treatment-by-SNP interactions were assessed in multivariable Cox models as described above by including an additional product term with the SNP coded additively and a binary indicator for treatment (single degree-of-freedom). The corresponding interaction parameter estimates were evaluated and p-values generated using likelihood ratio tests.
The online server Genotype-Tissue Expression (GTEx) portal v8 (https://www.gtexportal.org/home/) was accessed on 24 February 2025 to assess the effect of the selected SNPs on gene expression in normal colon tissue (sigmoid and transverse colon). The Sort Intolerant from Tolerant (SIFT) algorithm (https://sift.bii.a-star.edu.sg/) was accessed on June-July 2024 to assess the functional impact of the SNP and associated amino acid substitution on the protein function, and DUET (https://biosig.lab.uq.edu.au/duet/stability) and DynaMut (https://biosig.lab.uq.edu.au/dynamut2/) online tools were accessed on June-July 2024 to assess the impact of the selected SNPs on the protein stability.

5. Conclusions

In conclusion, our results provide the first evidence for an important role for MHC SNPs as prognostic and predictive biomarkers for first-line treatment in mCRC, with differential effects based on the biologic agent (cetuximab/bevacizumab) and chemotherapy backbone (irinotecan/oxaliplatin). These biomarkers, when further validated, may contribute to personalized treatment approaches for mCRC patients. These findings may also provide insight into the potential efficacy of emerging ERAP1 inhibitors when combined with targeted drug and immunotherapeutic treatment in mCRC patients. The novel findings reported in our study warrant further preclinical and prospective clinical studies for validation.

Supplementary Materials

The following supporting information can be downloaded at: https://www.mdpi.com/article/10.3390/ijms26062556/s1.

Author Contributions

Conceptualization, P.M. and H.-J.L.; data curation, P.M.; formal analysis, P.M., F.B. and Y.Y.; funding acquisition, H.-J.L.; investigation, P.M., F.B., S.S. (Shivani Soni), S.S. (Sebastian Stintzing), A.R.P., K.A., S.A., P.J., L.T.-G., W.Z., C.C., V.H., I.K.S. and H.-J.L.; methodology, Y.Y. and J.M.; project administration, H.-J.L.; resources, J.M. and H.-J.L.; software, Y.Y. and J.M.; supervision, H.-J.L.; validation, Y.Y.; writing—original draft, P.M.; writing—review and editing, F.B., Y.Y., S.S. (Shivani Soni), S.S. (Sebastian Stintzing), A.R.P., K.A., S.A., P.J., L.T.-G., W.Z., C.C., V.H., J.M., I.K.S. and H.-J.L. All authors have read and agreed to the published version of the manuscript.

Funding

This work was partly supported by the National Cancer Institute of the National Institutes of Health under Award Numbers P30CA014089 [to H-JL], the Gloria Borges WunderGlo Foundation, Dhont Family Foundation, Victoria and Philip Wilson Research Fund, San Pedro Peninsula Cancer Guild, Ming Hsieh Research Award, Daniel Butler Research Fund, and Julia Samwer Research Fund.

Institutional Review Board Statement

Prior to study enrolment, all patients provided written informed consent for molecular research and analysis. The study protocol was approved by the institutional review board of each participating institution and was conducted in accordance with the tenets of the Declaration of Helsinki as well as the Good Clinical Practice and the reporting recommendations for tumor marker prognostic studies (REMARK) guidelines.

Informed Consent Statement

Not applicable.

Data Availability Statement

Data are available upon reasonable request. The study protocol and statistical analysis plan are available in the paper. Other data (including the summary of clinical and genomic data) will be made available upon reasonable request. (pm_344@usc.edu, fbattagl@usc.edu, lenz@usc.edu).

Conflicts of Interest

H.-J. Lenz reports receiving honoraria from consultant/advisory board memberships from Bayer, Genentech, Roche, Merck, Merck KG, Oncocyte, Fulgent, G1 Therapeutics, 3T Biosciences, Jazz Therapeutics, and Protagonist. V. Heinemann reports receiving honoraria for talks and advisory board roles from Merck, Amgen, Roche, Sanofi, Servier, Pfizer, Pierre-Fabre, AstraZeneca, BMS; MSD, Novartis, Boehringer Ingelheim, Celgene, SIRTEX, Terumo, Oncosil, NORDIC, and Seagen, and research funding from Merck, Amgen, Roche, Sanofi, Boehringer-Ingelheim, SIRTEX, and Servier. All other authors declare no competing interests.

Abbreviations

The following abbreviations are used in this manuscript:
AIMAncestry informative markers
APCAntigen presenting cells
APMAntigen processing and presentation machinery
B2MBeta-2-microglobulin
CRCColorectal Cancer
ECOGEastern Cooperative Oncology Group
EGFREpidermal growth factor receptor
ERAP1/2Endoplasmic reticulum aminopeptidases ½
GTExGenotype-Tissue Expression
HLAHuman Leukocyte Antigens
KIRsKiller cell immunoglobulin-like receptors
LDLinkage disequilibrium
MHCMajor Histocompatibility Complex
NF-κBNuclear factor-kappa B
NKNatural killer cells
NSCLCNon-small cell lung cancer
OSOverall Survival
PCPrincipal components
PFSProgression free survival
PSPerformance status
SIFTSort Intolerant from Tolerant
SNPSingle nucleotide polymorphisms
TAP1/2Transporter associated with antigen processing 1/2
TAPBPTapasin/TAP-binding protein
TNBCTriple negative breast cancer
VEGFVascular endothelial growth factor

References

  1. Siegel, R.L.; Kratzer, T.B.; Giaquinto, A.N.; Sung, H.; Jemal, A. Cancer Statistics, 2025. CA Cancer J. Clin. 2025, 75, 10–45. [Google Scholar] [CrossRef]
  2. Ogunwobi, O.O.; Mahmood, F.; Akingboye, A. Biomarkers in Colorectal Cancer: Current Research and Future Prospects. Int. J. Mol. Sci. 2020, 21, 5311. [Google Scholar] [CrossRef]
  3. Pishesha, N.; Harmand, T.J.; Ploegh, H.L. A Guide to Antigen Processing and Presentation. Nat. Rev. Immunol. 2022, 22, 751–764. [Google Scholar] [CrossRef] [PubMed]
  4. Cruz-Tapias, P.; Castiblanco, J.; Anaya, J.M. Major Histocompatibility Complex: Antigen Processing and Presentation. In Autoimmunity: From Bench to Bedside; Anaya, J.M., Shoenfeld, Y., Rojas-Villarraga, A., Al, E., Eds.; El Rosario University Press: Bogota, Colombia, 2013. [Google Scholar]
  5. Evnouchidou, I.; Birtley, J.; Seregin, S.; Papakyriakou, A.; Zervoudi, E.; Samiotaki, M.; Panayotou, G.; Giastas, P.; Petrakis, O.; Georgiadis, D.; et al. A Common Single Nucleotide Polymorphism in Endoplasmic Reticulum Aminopeptidase 2 Induces a Specificity Switch That Leads to Altered Antigen Processing. J. Immunol. 2012, 189, 2383–2392. [Google Scholar] [CrossRef]
  6. Sade-Feldman, M.; Jiao, Y.J.; Chen, J.H.; Rooney, M.S.; Barzily-Rokni, M.; Eliane, J.-P.; Bjorgaard, S.L.; Hammond, M.R.; Vitzthum, H.; Blackmon, S.M.; et al. Resistance to Checkpoint Blockade Therapy through Inactivation of Antigen Presentation. Nat. Commun. 2017, 8, 1136. [Google Scholar] [CrossRef] [PubMed]
  7. Koizumi, K. Single Nucleotide Polymorphisms in the Gene Encoding the Major Histocompatibility Complex Class II Transactivator (CIITA) in Systemic Lupus Erythematosus. Ann. Rheum. Dis. 2005, 64, 947–950. [Google Scholar] [CrossRef] [PubMed]
  8. Mumphrey, M.B.; Hosseini, N.; Parolia, A.; Geng, J.; Zou, W.; Raghavan, M.; Chinnaiyan, A.; Cieslik, M. Distinct Mutational Processes Shape Selection of MHC Class I and Class II Mutations across Primary and Metastatic Tumors. Cell Rep. 2023, 42, 112965. [Google Scholar] [CrossRef]
  9. Hanahan, D.; Weinberg, R.A. Hallmarks of Cancer: The next Generation. Cell 2011, 144, 646–674. [Google Scholar] [CrossRef]
  10. Adolf, I.C.; Almars, A.; Dharsee, N.; Mselle, T.; Akan, G.; Nguma, I.J.; Nateri, A.S.; Atalar, F. HLA-G and Single Nucleotide Polymorphism (SNP) Associations with Cancer in African Populations: Implications in Personal Medicine. Genes Dis. 2022, 9, 1220–1233. [Google Scholar] [CrossRef]
  11. Balasubramanian, A.; John, T.; Asselin-Labat, M.-L. Regulation of the Antigen Presentation Machinery in Cancer and Its Implication for Immune Surveillance. Biochem. Soc. Trans. 2022, 50, 825–837. [Google Scholar] [CrossRef]
  12. Anderson, P.; Aptsiauri, N.; Ruiz-Cabello, F.; Garrido, F. HLA Class I Loss in Colorectal Cancer: Implications for Immune Escape and Immunotherapy. Cell Mol. Immunol. 2021, 18, 556–565. [Google Scholar] [CrossRef]
  13. Griffith, B.D.; Turcotte, S.; Lazarus, J.; Lima, F.; Bell, S.; Delrosario, L.; McGue, J.; Krishnan, S.; Oneka, M.D.; Nathan, H.; et al. MHC Class II Expression Influences the Composition and Distribution of Immune Cells in the Metastatic Colorectal Cancer Microenvironment. Cancers 2022, 14, 4092. [Google Scholar] [CrossRef] [PubMed]
  14. Watson, N.F.S.; Ramage, J.M.; Madjd, Z.; Spendlove, I.; Ellis, I.O.; Scholefield, J.H.; Durrant, L.G. Immunosurveillance Is Active in Colorectal Cancer as Downregulation but Not Complete Loss of MHC Class I Expression Correlates with a Poor Prognosis. Int. J. Cancer 2006, 118, 6–10. [Google Scholar] [CrossRef] [PubMed]
  15. Cornel, A.M.; Mimpen, I.L.; Nierkens, S. MHC Class I Downregulation in Cancer: Underlying Mechanisms and Potential Targets for Cancer Immunotherapy. Cancers 2020, 12, 1760. [Google Scholar] [CrossRef] [PubMed]
  16. Wiśniewski, A.; Sobczyński, M.; Pawełczyk, K.; Porębska, I.; Jasek, M.; Wagner, M.; Niepiekło-Miniewska, W.; Kowal, A.; Dubis, J.; Jędruchniewicz, N.; et al. Polymorphisms of Antigen-Presenting Machinery Genes in Non-Small Cell Lung Cancer: Different Impact on Disease Risk and Clinical Parameters in Smokers and Never-Smokers. Front. Immunol. 2021, 12, 664474. [Google Scholar] [CrossRef]
  17. Stintzing, S.; Modest, D.P.; Rossius, L.; Lerch, M.M.; von Weikersthal, L.F.; Decker, T.; Kiani, A.; Vehling-Kaiser, U.; Al-Batran, S.-E.; Heintges, T.; et al. FOLFIRI plus Cetuximab versus FOLFIRI plus Bevacizumab for Metastatic Colorectal Cancer (FIRE-3): A Post-Hoc Analysis of Tumour Dynamics in the Final RAS Wild-Type Subgroup of This Randomised Open-Label Phase 3 Trial. Lancet Oncol. 2016, 17, 1426–1434. [Google Scholar] [CrossRef]
  18. Loupakis, F.; Cremolini, C.; Masi, G.; Lonardi, S.; Zagonel, V.; Salvatore, L.; Cortesi, E.; Tomasello, G.; Ronzoni, M.; Spadi, R.; et al. Initial Therapy with FOLFOXIRI and Bevacizumab for Metastatic Colorectal Cancer. N. Engl. J. Med. 2014, 371, 1609–1618. [Google Scholar] [CrossRef]
  19. Parikh, A.R.; Lee, F.-C.; Yau, L.; Koh, H.; Knost, J.; Mitchell, E.P.; Bosanac, I.; Choong, N.; Scappaticci, F.; Mancao, C.; et al. MAVERICC, a Randomized, Biomarker-Stratified, Phase II Study of MFOLFOX6-Bevacizumab versus FOLFIRI-Bevacizumab as First-Line Chemotherapy in Metastatic Colorectal Cancer. Clin. Cancer Res. 2019, 25, 2988–2995. [Google Scholar] [CrossRef]
  20. Mittal, P.; Battaglin, F.; Yang, Y.; Millstein, J.; Stintzing, S.; Parikh, A.R.; Soni, S.; Lo, J.H.; Torres-Gonzalez, L.; Algaze, S.; et al. Single Nucleotide Polymorphisms (SNPs) in MHC Class I and II Genes to Predict Outcome in Patients (Pts) with Metastatic Colorectal Cancer (MCRC): Data from FIRE-3, MAVERICC, and TRIBE Trials. J. Clin. Oncol. 2023, 41, 3578. [Google Scholar] [CrossRef]
  21. Wolin, A.; Lahtela, E.L.; Anttila, V.; Petrek, M.; Grunewald, J.; van Moorsel, C.H.M.; Eklund, A.; Grutters, J.C.; Kolek, V.; Mrazek, F.; et al. SNP Variants in Major Histocompatibility Complex Are Associated with Sarcoidosis Susceptibility—A Joint Analysis in Four European Populations. Front. Immunol. 2017, 8, 422. [Google Scholar] [CrossRef]
  22. McMahon, G.; Ring, S.M.; Davey-Smith, G.; Timpson, N.J. Genome-Wide Association Study Identifies SNPs in the MHC Class II Loci That Are Associated with Self-Reported History of Whooping Cough. Hum. Mol. Genet. 2015, 24, 5930–5939. [Google Scholar] [CrossRef] [PubMed]
  23. D’Antonio, M.; Reyna, J.; Jakubosky, D.; Donovan, M.K.; Bonder, M.-J.; Matsui, H.; Stegle, O.; Nariai, N.; D’Antonio-Chronowska, A.; Frazer, K.A. Systematic Genetic Analysis of the MHC Region Reveals Mechanistic Underpinnings of HLA Type Associations with Disease. Elife 2019, 8, e48476. [Google Scholar] [CrossRef]
  24. Thompson, J.C.; Davis, C.; Deshpande, C.; Hwang, W.-T.; Jeffries, S.; Huang, A.; Mitchell, T.C.; Langer, C.J.; Albelda, S.M. Gene Signature of Antigen Processing and Presentation Machinery Predicts Response to Checkpoint Blockade in Non-Small Cell Lung Cancer (NSCLC) and Melanoma. J. Immunother. Cancer 2020, 8, e000974. [Google Scholar] [CrossRef]
  25. Ghiringhelli, F.; Limagne, E.; Thibaudin, M.; Nuttin, L.; Spill, A.; Derangere, V.; Cattan, V.; Peranzoni, E.; Amellal, N. The Combination of Trifluridine/Tipiracil and Oxaliplatin Induces Immunogenic Cell Death in Microsatellite Stable Colorectal Cancer. Ann. Oncol. 2018, 29, viii186. [Google Scholar] [CrossRef]
  26. Fang, Y.; Sun, H.; Xiao, X.; Tang, M.; Tian, Z.; Wei, H.; Sun, R.; Zheng, X. Low-Dose Immunogenic Chemotherapeutics Promotes Immune Checkpoint Blockade in Microsatellite Stability Colon Cancer. Front. Immunol. 2022, 13, 1040256. [Google Scholar] [CrossRef]
  27. Rana, P.S.; Ignatz-Hoover, J.J.; Driscoll, J.J. Targeting Proteasomes and the MHC Class I Antigen Presentation Machinery to Treat Cancer, Infections and Age-Related Diseases. Cancers 2023, 15, 5632. [Google Scholar] [CrossRef] [PubMed]
  28. Elamin, Y.Y.; Rafee, S.; Toomey, S.; Hennessy, B.T. Immune Effects of Bevacizumab: Killing Two Birds with One Stone. Cancer Microenviron. 2015, 8, 15–21. [Google Scholar] [CrossRef]
  29. De Aguiar, R.B.; Moraes, J.Z. de Exploring the Immunological Mechanisms Underlying the Anti-Vascular Endothelial Growth Factor Activity in Tumors. Front. Immunol. 2019, 10, 1023. [Google Scholar] [CrossRef]
  30. Mimura, K.; Kono, K.; Takahashi, A.; Kawaguchi, Y.; Fujii, H. Vascular Endothelial Growth Factor Inhibits the Function of Human Mature Dendritic Cells Mediated by VEGF Receptor-2. Cancer Immunol. Immunother. 2007, 56, 761–770. [Google Scholar] [CrossRef]
  31. Boucher, Y.; Kumar, A.S.; Posada, J.M.; Gjini, E.; Pfaff, K.; Lipschitz, M.; Lako, A.; Duda, D.G.; Rodig, S.J.; Hodi, F.S.; et al. Bevacizumab Improves Tumor Infiltration of Mature Dendritic Cells and Effector T-Cells in Triple-Negative Breast Cancer Patients. NPJ Precis. Oncol. 2021, 5, 62. [Google Scholar] [CrossRef]
  32. Kallingal, A.; Olszewski, M.; Maciejewska, N.; Brankiewicz, W.; Baginski, M. Cancer Immune Escape: The Role of Antigen Presentation Machinery. J. Cancer Res. Clin. Oncol. 2023, 149, 8131–8141. [Google Scholar] [CrossRef]
  33. Bufalieri, F.; Fruci, D.; Di Marcotullio, L. ERAP1 as an Emerging Therapeutic Target for Medulloblastoma. Trends in Cancer 2022, 8, 4–8. [Google Scholar] [CrossRef] [PubMed]
  34. James, E.; Bailey, I.; Sugiyarto, G.; Elliott, T. Induction of Protective Antitumor Immunity through Attenuation of ERAAP Function. J. Immunol. 2013, 190, 5839–5846. [Google Scholar] [CrossRef] [PubMed]
  35. Joyce, P.; Quibell, M.; Shiers, J.; Tong, C.; Clark, K.; Ternette, N.; Anderton, K.; Sette, J.; Paes, W.; Leishman, A. First-in-Class Inhibitors of ERAP1 Alter the Immunopeptidome of Cancer, Driving a Differentiated T Cell Response Leading to Tumor Growth Inhibition. J. Immunother. Cancer 2021, 9, A583. [Google Scholar] [CrossRef]
  36. Li, C.; Li, Y.; Yan, Z.; Dai, S.; Liu, S.; Wang, X.; Wang, J.; Zhang, X.; Shi, L.; Yao, Y. Polymorphisms in Endoplasmic Reticulum Aminopeptidase Genes Are Associated with Cervical Cancer Risk in a Chinese Han Population. BMC Cancer 2020, 20, 341. [Google Scholar] [CrossRef] [PubMed]
  37. Alvarez-Navarro, C.; López de Castro, J.A. ERAP1 Structure, Function and Pathogenetic Role in Ankylosing Spondylitis and Other MHC-Associated Diseases. Mol. Immunol. 2014, 57, 12–21. [Google Scholar] [CrossRef]
  38. Pollack, B.P.; Sapkota, B.; Cartee, T.V. Epidermal Growth Factor Receptor Inhibition Augments the Expression of MHC Class I and II Genes. Clin. Cancer Res. 2011, 17, 4400–4413. [Google Scholar] [CrossRef]
  39. Padariya, M.; Kote, S.; Mayordomo, M.; Dapic, I.; Alfaro, J.; Hupp, T.; Fahraeus, R.; Kalathiya, U. Structural Determinants of Peptide-Dependent TAP1-TAP2 Transit Passage Targeted by Viral Proteins and Altered by Cancer-Associated Mutations. Comput. Struct. Biotechnol. J. 2021, 19, 5072–5091. [Google Scholar] [CrossRef]
  40. Henle, A.M.; Nassar, A.; Puglisi-Knutson, D.; Youssef, B.; Knutson, K.L. Downregulation of TAP1 and TAP2 in Early Stage Breast Cancer. PLoS ONE 2017, 12, e0187323. [Google Scholar] [CrossRef]
  41. Dai, D.; Chen, Y.; Ru, P.; Zhou, X.; Tao, J.; Ye, H.; Hong, Q.; Tang, L.; Pan, G.; Lin, D.; et al. Significant Association between TAP2 Polymorphisms and Rheumatoid Arthritis: A Meta-Analysis. Diagn. Pathol. 2014, 9, 129. [Google Scholar] [CrossRef]
  42. Wieczorek, E.; Jablonowski, Z.; Lesicka, M.; Jablonska, E.; Kutwin, P.; Reszka, E.; Garstka, M.A. Genetic Contributions of MHC Class I Antigen Processing and Presentation Pathway to Bladder Cancer Risk and Recurrence. Neoplasma 2022, 69, 443–455. [Google Scholar] [CrossRef] [PubMed]
  43. Pollack, B.P. EGFR Inhibitors, MHC Expression and Immune Responses: Can EGFR Inhibitors Be Used as Immune Response Modifiers? Oncoimmunology 2012, 1, 71–74. [Google Scholar] [CrossRef] [PubMed]
  44. Forlani, G.; Shallak, M.; Celesti, F.; Accolla, R.S. Unveiling the Hidden Treasury: CIITA-Driven MHC Class II Expression in Tumor Cells to Dig up the Relevant Repertoire of Tumor Antigens for Optimal Stimulation of Tumor Specific CD4+ T Helper Cells. Cancers 2020, 12, 3181. [Google Scholar] [CrossRef]
  45. Watanabe, S.; Hayashi, H.; Haratani, K.; Shimizu, S.; Tanizaki, J.; Sakai, K.; Kawakami, H.; Yonesaka, K.; Tsurutani, J.; Togashi, Y.; et al. Mutational Activation of the Epidermal Growth Factor Receptor Down-regulates Major Histocompatibility Complex Class I Expression via the Extracellular Signal-regulated Kinase in Non–Small Cell Lung Cancer. Cancer Sci. 2019, 110, 52–60. [Google Scholar] [CrossRef] [PubMed]
  46. Arai, H.; Xiao, Y.; Loupakis, F.; Kawanishi, N.; Wang, J.; Battaglin, F.; Soni, S.; Zhang, W.; Mancao, C.; Salhia, B.; et al. Immunogenic Cell Death Pathway Polymorphisms for Predicting Oxaliplatin Efficacy in Metastatic Colorectal Cancer. J. ImmunoTher. Cancer 2020, 8, e001714. [Google Scholar] [CrossRef]
  47. Benjamini, Y.; Hochberg, Y. Controlling the False Discovery Rate: A Practical and Powerful Approach to Multiple Testing. J. R. Stat. Soc. Ser. B Stat. Methodol. 1995, 57, 289–300. [Google Scholar] [CrossRef]
Figure 1. Schematic representation of the antigen processing and presentation pathway (MHC classes I and II).
Ijms 26 02556 g001
Figure 2. Consort diagram and workflow of the study. * Patients without sufficient peripheral whole blood samples, SNP data, and/or any oth-er relevant data for analyses were excluded from the study.
Ijms 26 02556 g002
Figure 3. Association between TAP2 rs241447 expression and patient outcomes in the FIRE-3 and MAVERICC trials. Kaplan–Meier curves show OS stratified by TAP2 rs241447 alleles any T and C/C tumor expression according to different treatments of the FIRE-3 and MAVERICC trials. (A) FIRE-3 bev/FOLFIRI OS, (B) FIRE-3 cet/FOLFIRI OS, (C) MAVERICC bev/FOLFIRI OS, (D) MAVERICC bev/FOLFOX6 OS. Bev, bevacizumab; cet, cetuximab; OS, overall survival.
Ijms 26 02556 g003
Figure 4. Association between ERAP1 rs2287987 expression and patient outcomes in the FIRE-3 and TRIBE trials. Kaplan–Meier curves show PFS stratified by ERAP1 rs2287987 alleles any T and C/C tumor expression according to different treatments of the FIRE-3 and TRIBE trials. (A) FIRE-3 bev/FOLFIRI PFS, (B) FIRE-3 cet/FOLFIRI PFS, (C) TRIBE bev/FOLFIRI PFS, (D) TRIBE bev/FOLFOXIRI PFS. Bev, bevacizumab; cet, cetuximab; PFS, progression-free survival.
Ijms 26 02556 g004
Figure 5. Association between CIITA rs4774 expression and patient outcomes in the FIRE-3 and MAVERICC trials. Kaplan–Meier curves show PFS stratified by CIITA rs4774 alleles G/G and any C tumor expression according to different treatments of the FIRE-3 and MAVERICC trials. (A) FIRE-3 bev/FOLFIRI PFS, (B) FIRE-3 cet/FOLFIRI PFS, (C) MAVERICC bev/FOLFIRI PFS, (D) MAVERICC bev/FOLFOX6 PFS. Bev, bevacizumab; cet, cetuximab; PFS, progression-free survival.
Ijms 26 02556 g005
Figure 6. Amino acid substitution of threonine (Thr) to alanine (Ala) at residue number 665 by TAP2 variant rs241447. TAP2 protein structure downloaded from Protein Data Bank (PDB code: 8T46) and visualized in PyMol. Color representation for Thr665 is pink and for Ala665 is orange.
Ijms 26 02556 g006
Disclaimer/Publisher’s Note: The statements, opinions and data contained in all publications are solely those of the individual author(s) and contributor(s) and not of MDPI and/or the editor(s). MDPI and/or the editor(s) disclaim responsibility for any injury to people or property resulting from any ideas, methods, instructions or products referred to in the content.

