Article

Hypertrophic Cardiomyopathy-Associated CRYABR123W Activates Calcineurin, Reduces Calcium Sequestration, and Alters the CRYAB Interactome and the Proteomic Response to Pathological Hypertrophy

by
Andres Thorkelsson
1,
Chun Chou
1,
Audrey Tripp
2,
Samia A. Ali
3,
Jonas Galper
2 and
Michael T. Chin
1,2,3,*
1
MD Program, Tufts University School of Medicine, Boston, MA 02111, USA
2
Molecular Cardiology Research Institute, Tufts Medical Center, Boston, MA 02111, USA
3
Genetics, Molecular and Cellular Biology Program, Tufts Graduate School of Biomedical Sciences, Boston, MA 02111, USA
*
Author to whom correspondence should be addressed.
Int. J. Mol. Sci. 2025, 26(6), 2383; https://doi.org/10.3390/ijms26062383
Submission received: 18 February 2025 / Revised: 4 March 2025 / Accepted: 5 March 2025 / Published: 7 March 2025

Abstract

Hypertrophic cardiomyopathy (HCM) is the most common inherited cardiovascular condition in the world, affecting around 1 in 500 people. HCM is characterized by ventricular wall thickening, decreased ventricular chamber volume, and diastolic dysfunction. Inherited HCM is most commonly caused by sarcomere gene mutations; however, approximately 50% of patients do not present with a known mutation, highlighting the need for further research into additional pathological mutations. The alpha-B crystallin (CRYAB) mutation CRYABR123W was previously identified as a novel sarcomere-independent mutation causing HCM associated with pathological NFAT signaling in the setting of pressure overload. We generated stable H9C2 cell lines expressing FLAG-tagged wild-type and mutant CRYAB, which demonstrated that CRYABR123W increases calcineurin activity. Using AlphaFold to predict structural and interaction changes, we generated a model where CRYABR123W uniquely binds to the autoinhibitory domain of calcineurin. Co-immunoprecipitation using the CRYAB FLAG tag followed by mass spectrometry showed novel and distinct changes in the protein interaction patterns of CRYABR123W. Finally, mouse heart extracts from our wild-type CRYAB and CRYABR123W models with and without pressure overload caused by transverse aortic constriction (TAC) were used in global proteomic and phosphoproteomic mass spectrometry analysis, which showed dysregulation in cytoskeletal, metabolomic, cardiac, and immune function. Our data illustrate how CRYABR123W drives calcineurin activation and exhibits distinct changes in protein interaction and cellular pathways during the development of HCM and pathological cardiac hypertrophy.

1. Introduction

Hypertrophic cardiomyopathy is a pathological condition defined by the thickening of the ventricular wall, decreased ventricular chamber volume, and diastolic dysfunction in the absence of predisposing factors and is the most common inherited cardiovascular condition affecting around 1 in 500 individuals worldwide [1]. It is inherited in an autosomal dominant pattern with a penetrance of around 50–60% [2,3]. Linkage analyses of large families with HCM have identified mutations in multiple cardiac sarcomere genes, including β-myosin heavy chain (MYH7 OMIM# 160760), myosin binding protein C3 (MYBPC3 OMIM# 600958), and cardiac troponin T (TNNT2 OMIM# 191045) [4,5,6,7,8,9]. Although the most common mutations involved in HCM are in the cardiac sarcomere genes, they only account for around 30% of mutations found in patients, while a staggering 40% of patients do not carry any known HCM mutation [10,11]. Therefore, identifying and studying additional elusive causative genes outside the sarcomere is essential to fully understand the pathogenic mechanisms behind hypertrophic cardiomyopathy [12].
Mutant CRYAB was first implicated in cardiomyopathy decades ago in a genetic linkage study by a group of French researchers [13]. CRYAB is a member of the small heat shock protein family, which are molecular chaperones that are involved in a wide range of cellular functions, including the regulation of calcium signaling [14], protein folding and aggregation [15,16,17], autophagy [18,19], and apoptosis [20,21]. Under normal physiological conditions, CRYAB forms dimers and oligomers, which mask the N- and C-terminal unstructured regions of CRYAB and thereby inhibit its function [22,23]. Following cellular stress, CRYAB de-oligomerizes, exposing its N- and C-terminal domains, which leads to phosphorylation at different serine residues and its activation as a molecular chaperone [24,25]. CRYAB oligomers are stabilized by ionic bridges at aspartic acid residue 109 (D109) and arginine residue 120 (R120) between interacting CRYAB proteins [22,23]. Proper maintenance of CRYAB oligomers is vital for the normal functioning of the protein and prevention of aberrant protein interactions as mutations at D109 and R120 have been implicated in various familial cardiomyopathies [26]. Several mutations have been noted at D109, but the most well studied is CRYABD109G, which causes restrictive cardiomyopathy secondary to abnormal desmin aggregation [27]. Similarly, disruptive mutations at R120 have been implicated in desmin-related cardiomyopathy, with the most common mutation being CRYABR120G [28]. CRYABR120G acts in a dominant negative manner, disrupting the normal functioning of wild-type CRYAB, and promotes protein aggregation, as was noted in cryoelectron microscopy of CRYABR120G mutant cells with quaternary CRYABR120G structures that were double the size of those in wild-type CRYAB cells [29,30]. A recently discovered novel mutation, CRYABR123W, was found to cause concordant development of HCM in monozygotic twins, suggesting its pathogenic nature [31]. Mouse studies of CryabR123W have demonstrated a spontaneous development of diastolic dysfunction with aging and pathological hypertrophy with systolic dysfunction secondary to TAC-induced pressure overload [32]. CRYAB has also been shown to bind to calcineurin in co-immunoprecipitation experiments, and CRYABR123W has been implicated in pathological calcium signaling [32]. Abnormal CRYAB structure secondary to the R123W mutation has been shown to have an increased B-sheet content and large structural changes adjacent to its mini-chaperone peptide sequence, which is implicated in reduced chaperone activity, while simultaneously increasing the propensity of the mutant protein to form aggregates [33].
In this study, we demonstrate that CRYABR123W leads to increased calcineurin activity in H9C2 cells and impaired calcium uptake in mutant mouse cardiomyocytes. Structural analysis of CRYAB interaction with calcineurin using AlphaFold v2.2.0 suggests that CRYABR123W binds to the autoinhibitory domain of calcineurin, supporting a possible mechanism of autoinhibition release for the increased calcineurin activity. Co-immunoprecipitation and global proteomic and phosphoproteomic mass spectrometry analysis revealed differential protein binding and regulation secondary to CRYABR123W, indicating distinctive cellular changes compared to other studied CRYAB mutations.

2. Results

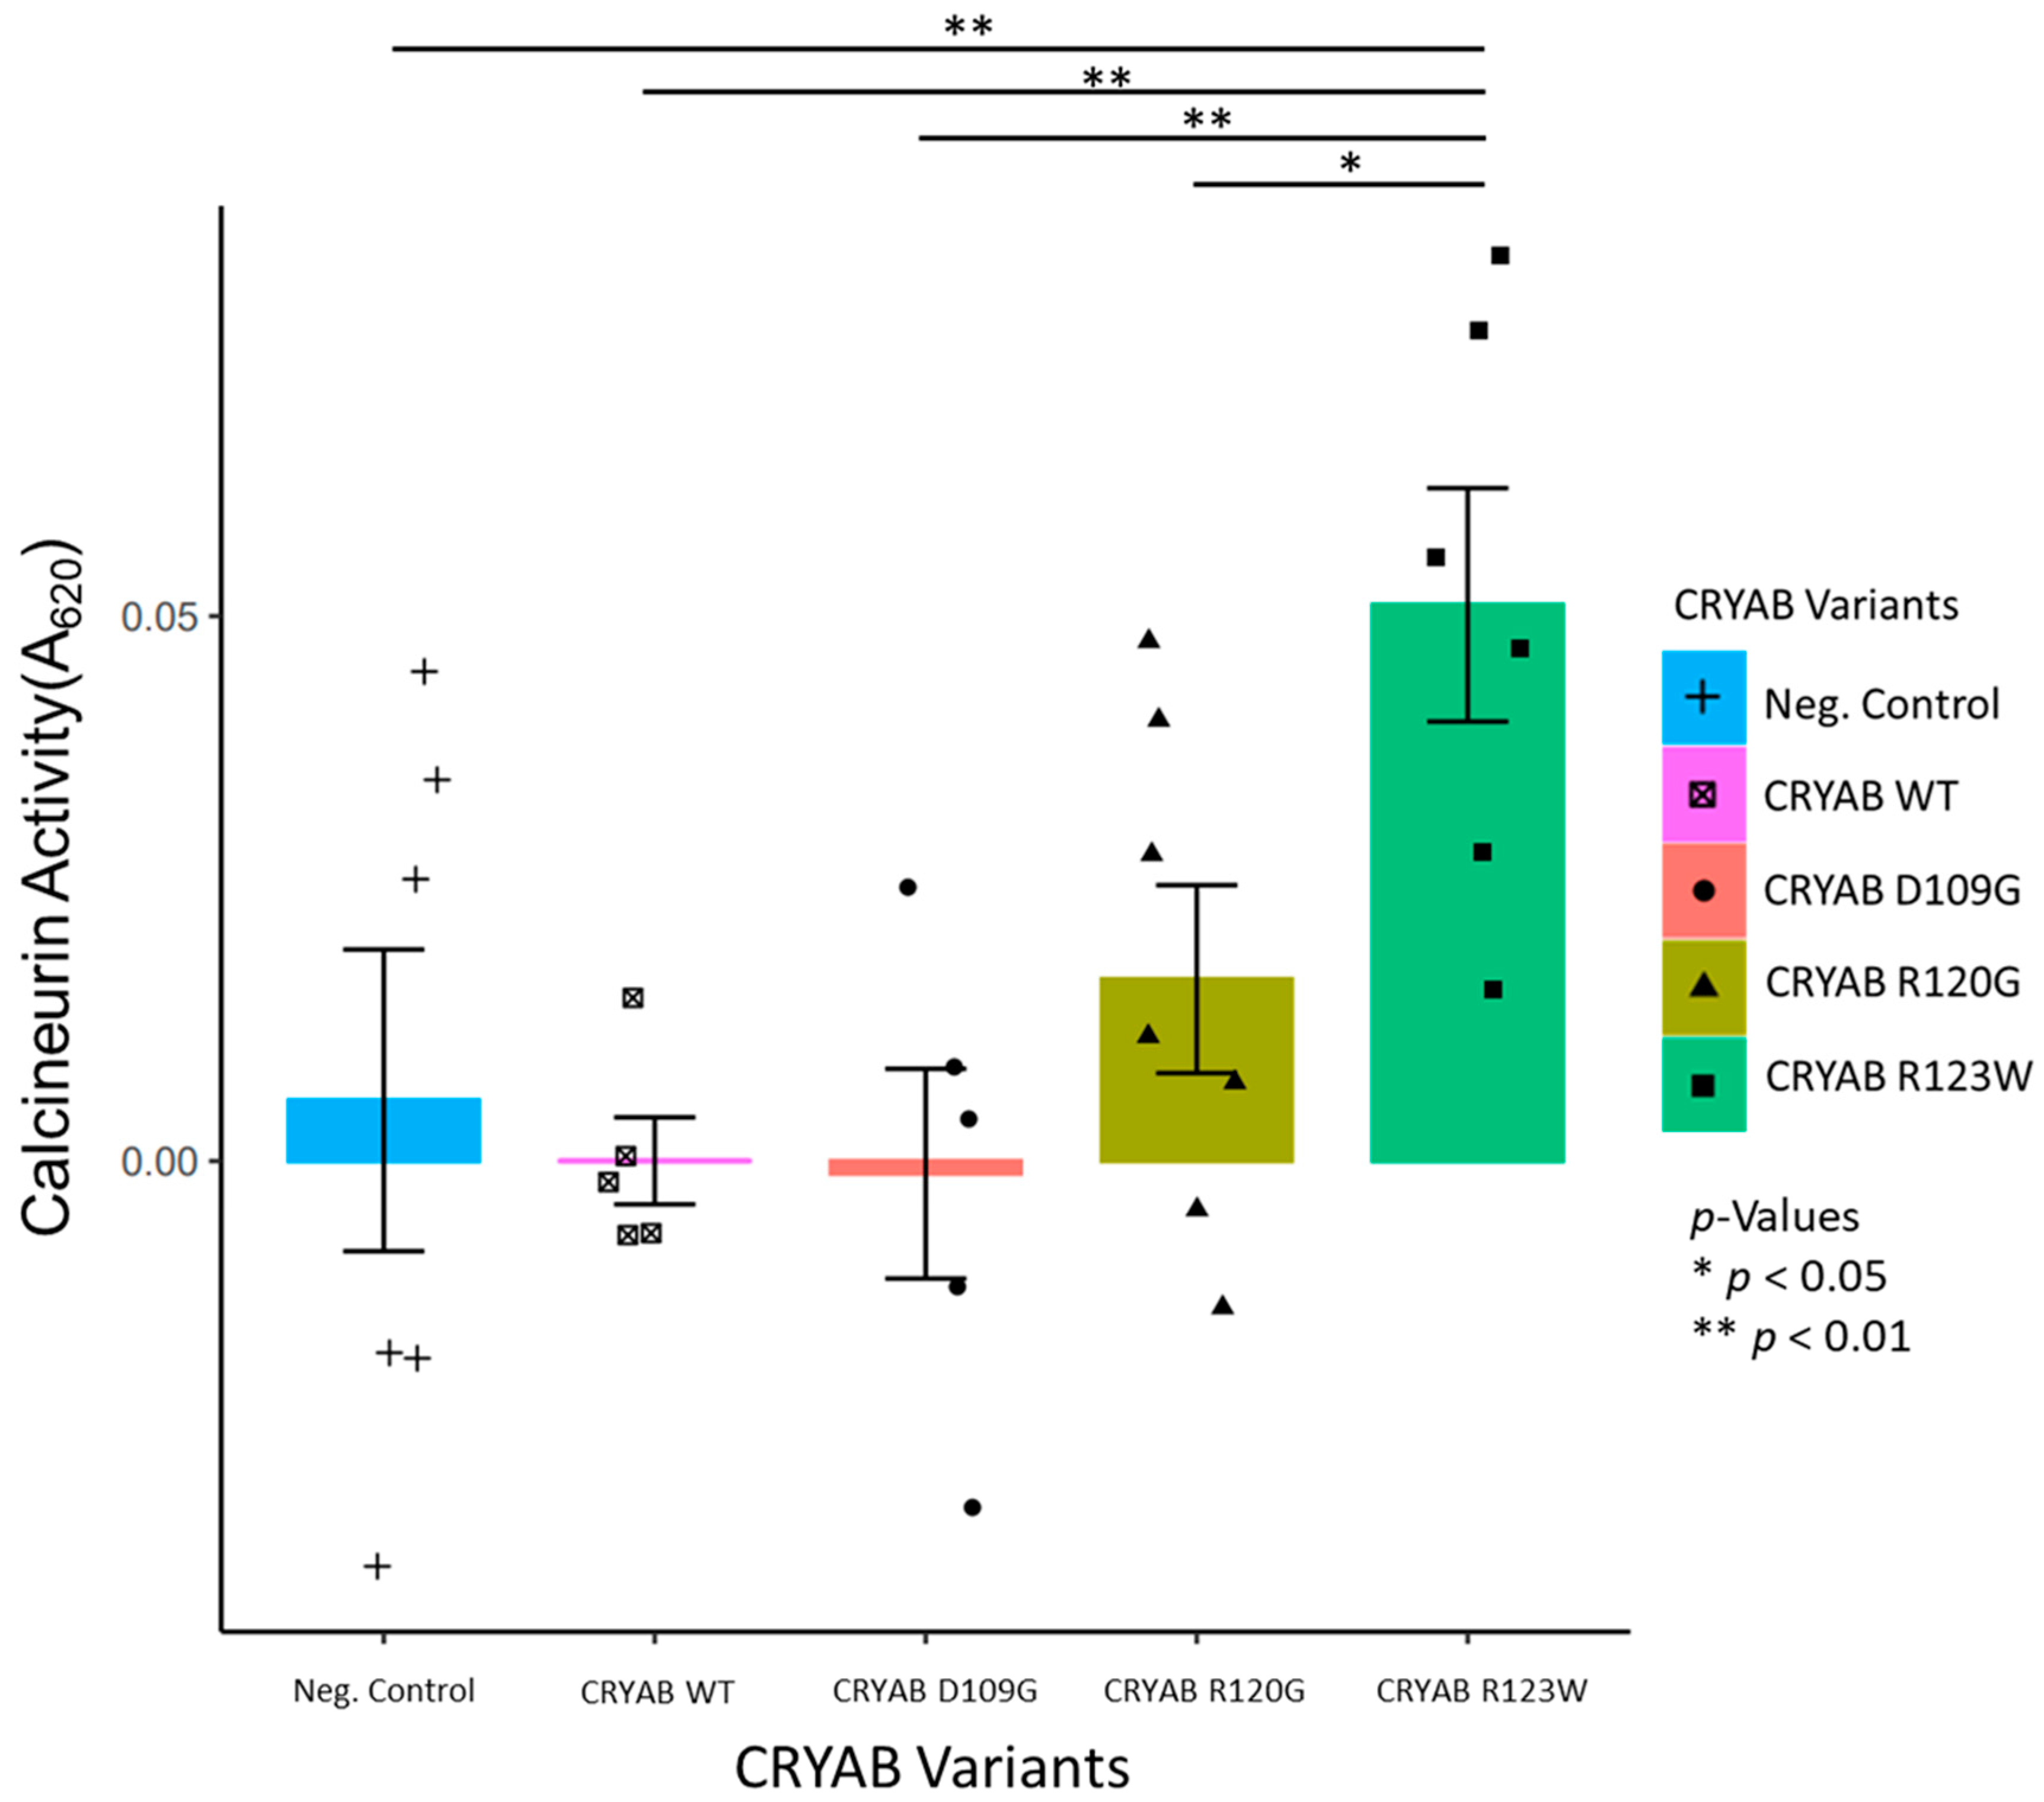
2.1. CRYABR123W Increases Calcineurin Activity

To investigate the impact that CRYAB protein mutations have on calcineurin activity, we generated stable H9C2 cell lines overexpressing FLAG-tagged wild-type CRYAB, CRYABD109G, CRYABR120G, and CRYABR123W via lentivirus transduction. We measured calcineurin activity directly in cell lysates generated from these cell lines and an H9C2 negative control expressing normal levels of wild-type CRYAB using a colorimetric calcineurin activity assay. We found a significant increase in calcineurin activity in cells overexpressing CRYABR123W compared to those expressing the other two mutant proteins or wild-type protein (Figure 1). The overexpression of CRYAB, CRYABD109G, or CRYABR120G did not promote an increase in calcineurin activity when compared to the negative control. These results indicate that the R123W variant of CRYAB is uniquely able to activate calcineurin when compared to the wild type or the D109G or R120G variants.

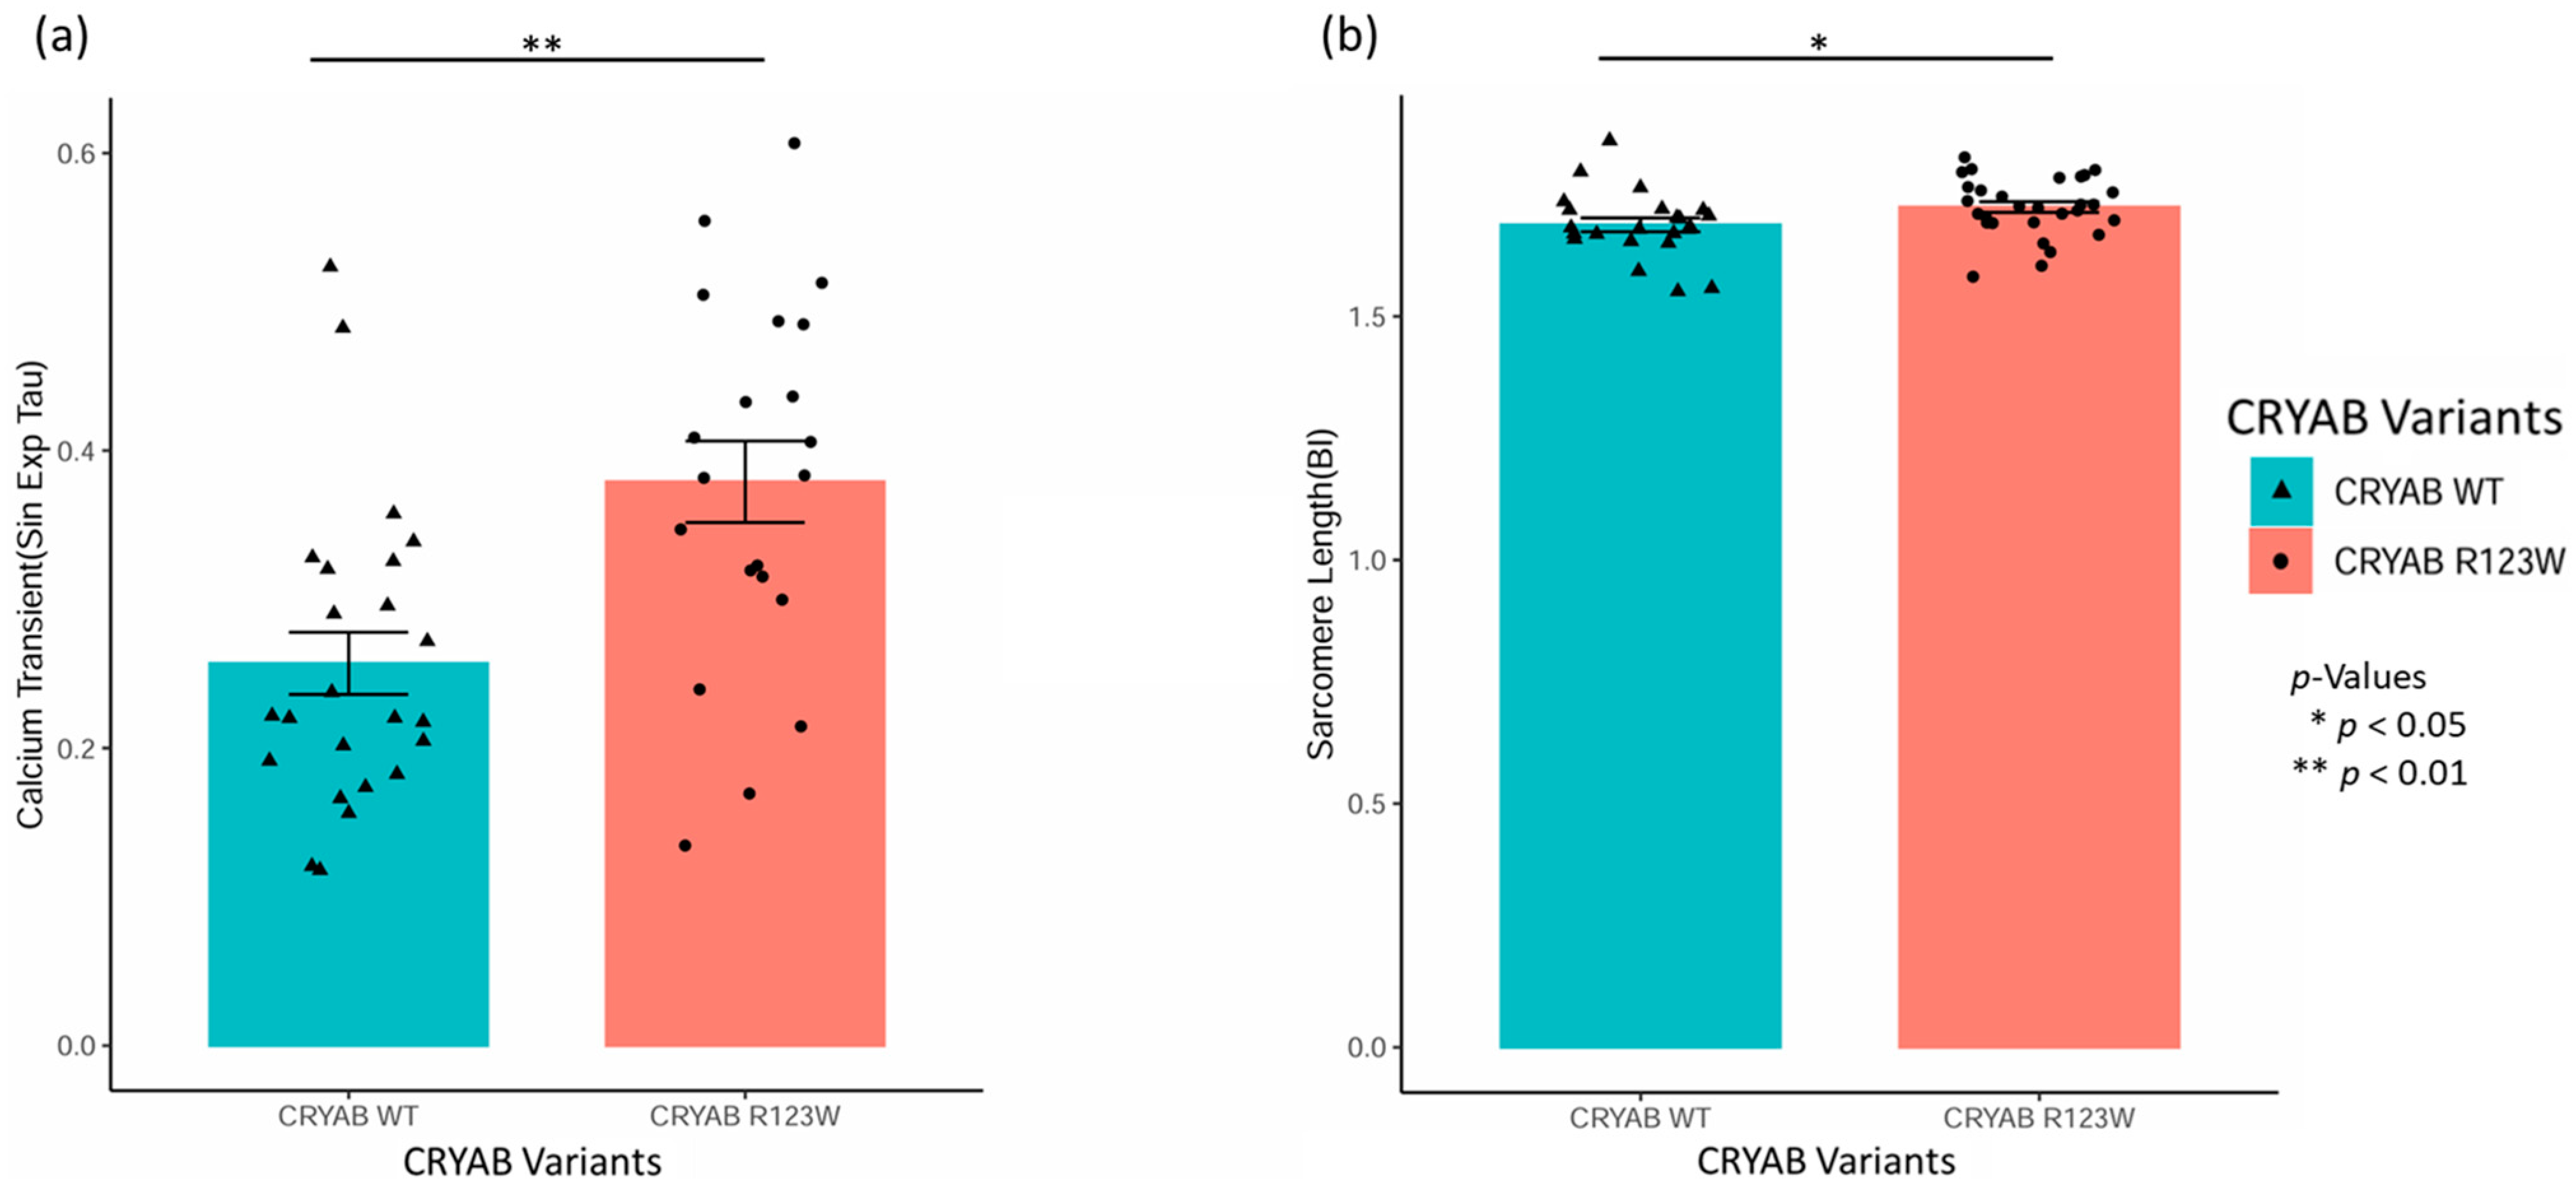
2.2. CRYABR123W Causes Impaired Calcium Reuptake and Myocyte Relaxation

To examine changes in cardiomyocyte contraction and calcium handling, we isolated wild-type CRYAB and CRYABR123W myocyte cells from mouse hearts and then performed an IonOptix-based assessment and analysis. No significant differences were seen in the fractional shortening. We found that compared to wild-type myocytes, CRYABR123W myocytes had significantly impaired calcium reuptake and myocyte relaxation compared to wild-type CRYAB, as measured by the elevation in single exponential tau (Figure 2a). Interestingly, we also saw that, overall, CRYABR123W myocytes have a small but significant increase in sarcomere length compared to their wild-type counterparts (Figure 2b). This provides evidence that the CRYAB R123W promotes dysregulation of calcium handling in mouse myocytes, which is consistent with the activation of calcineurin activity, NFAT reporter activity, and diastolic dysfunction, as shown in this study and reported previously [32].

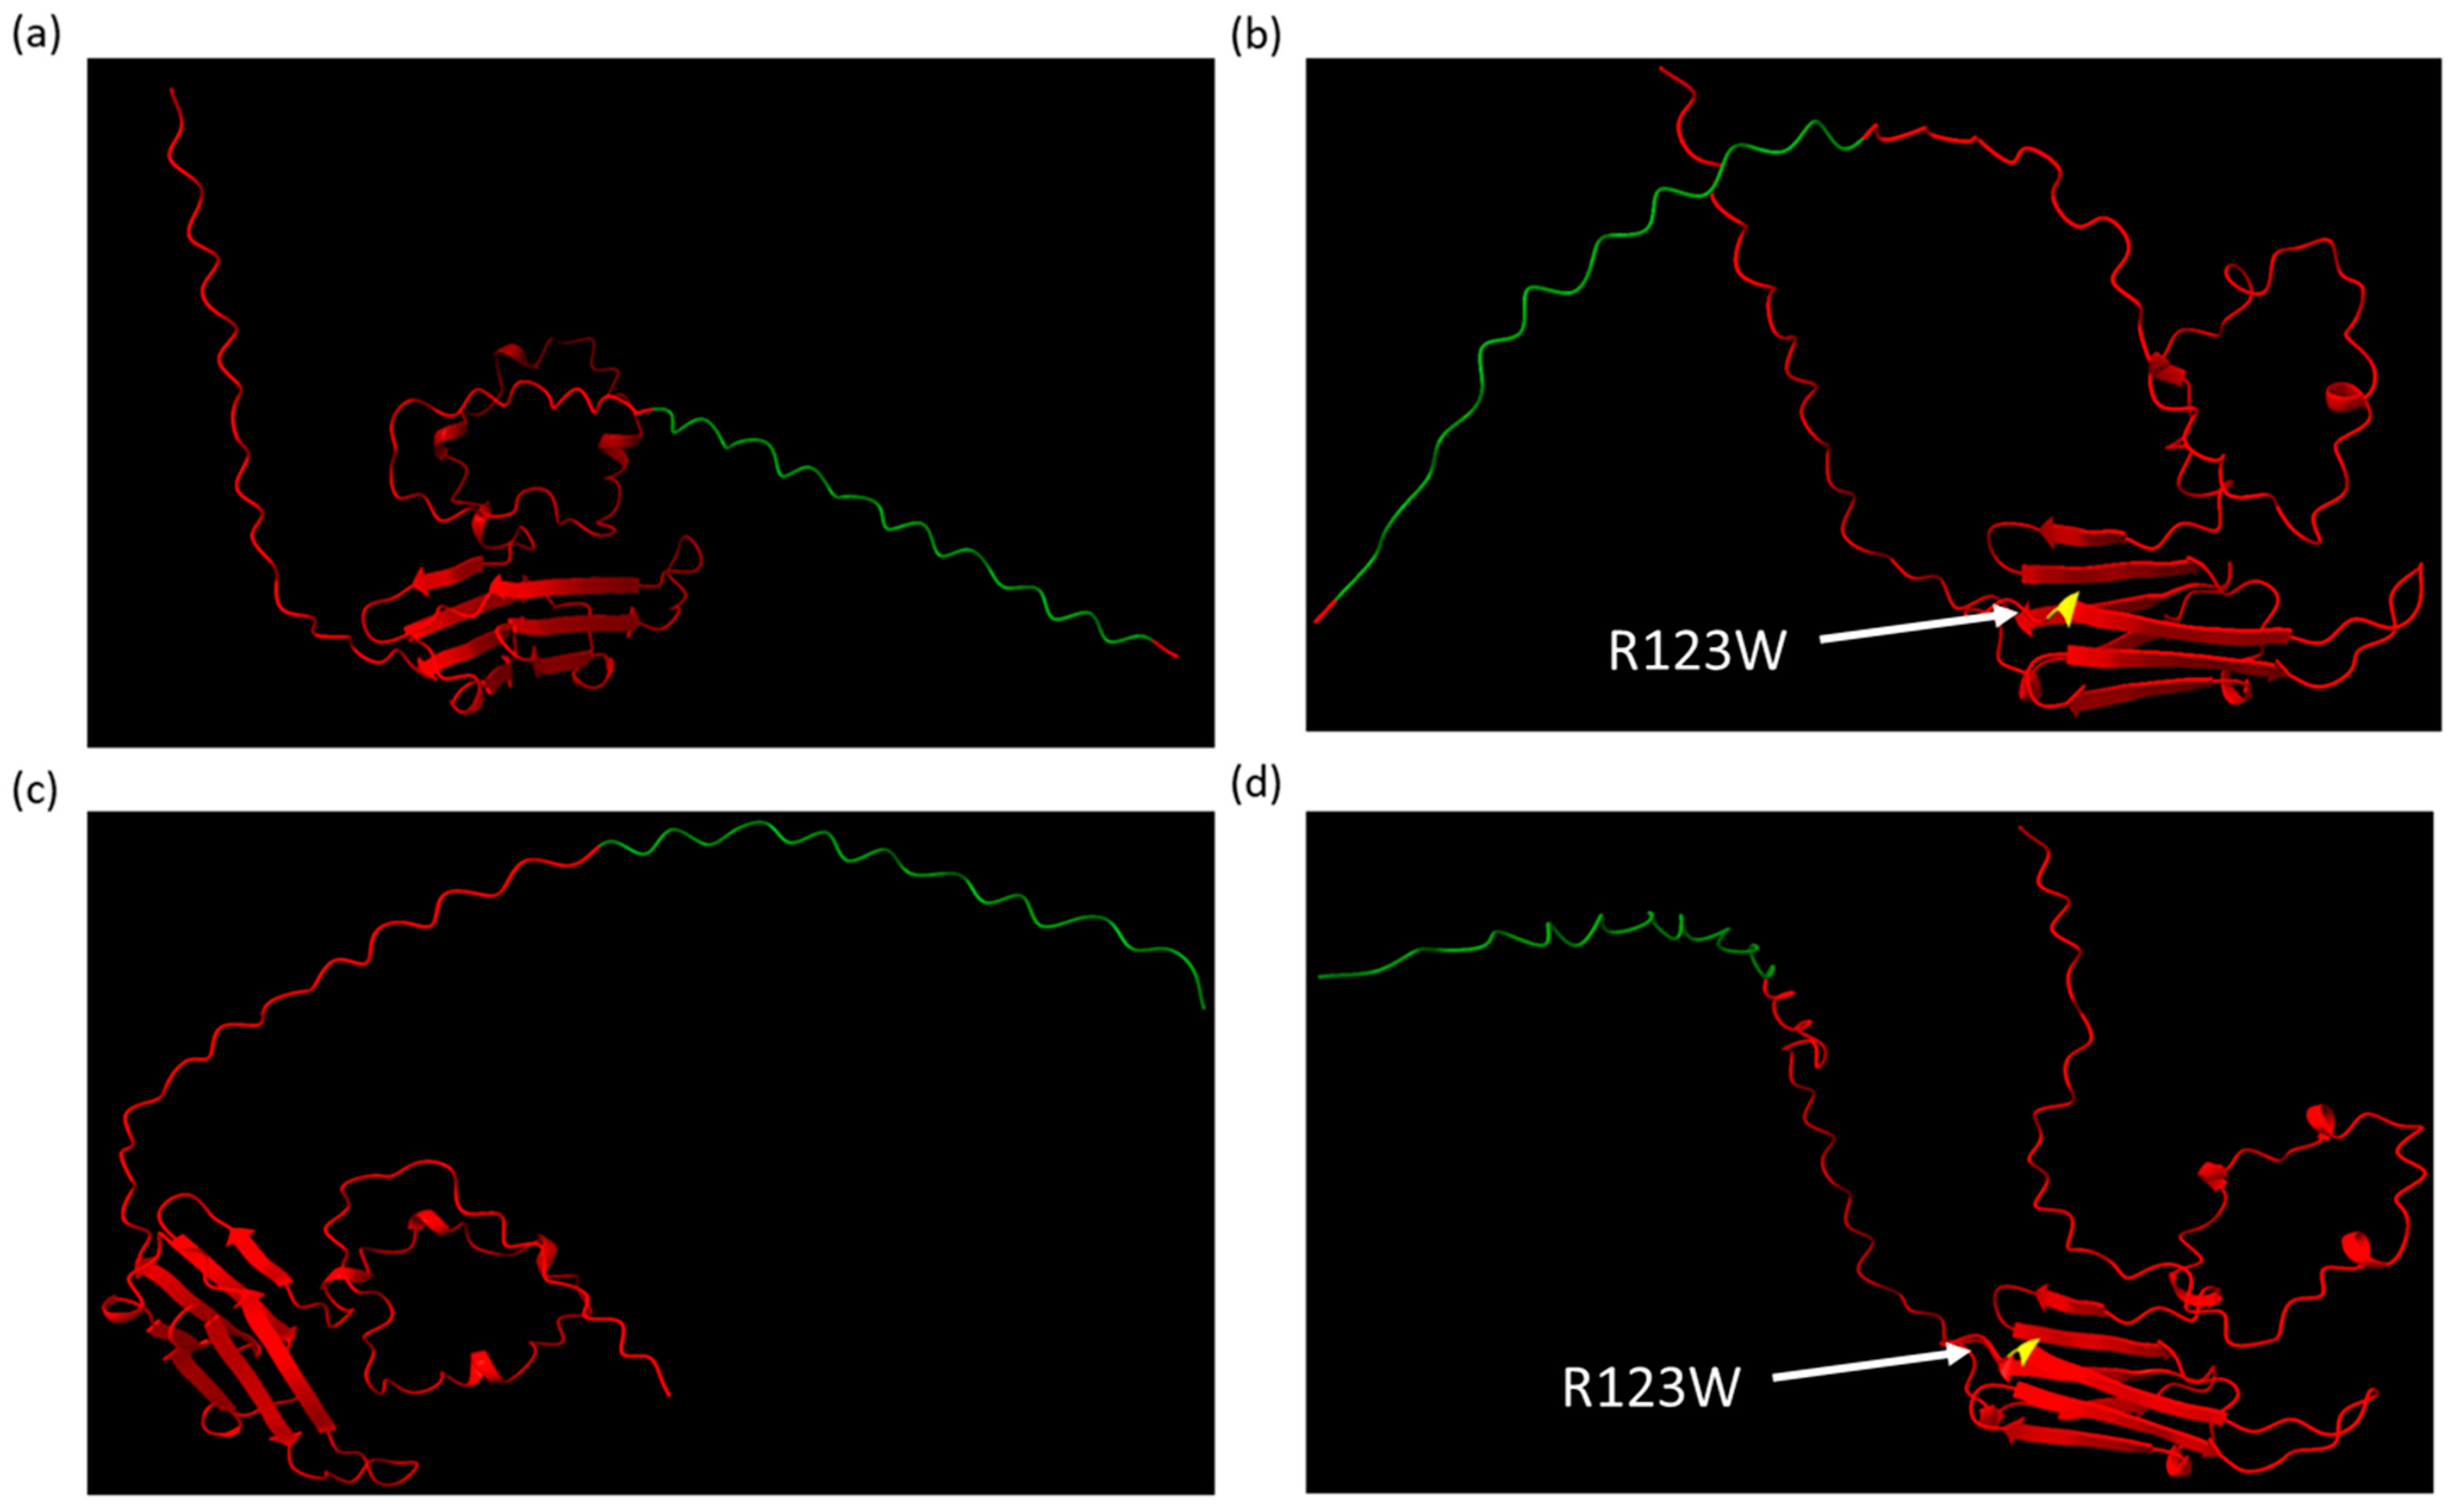
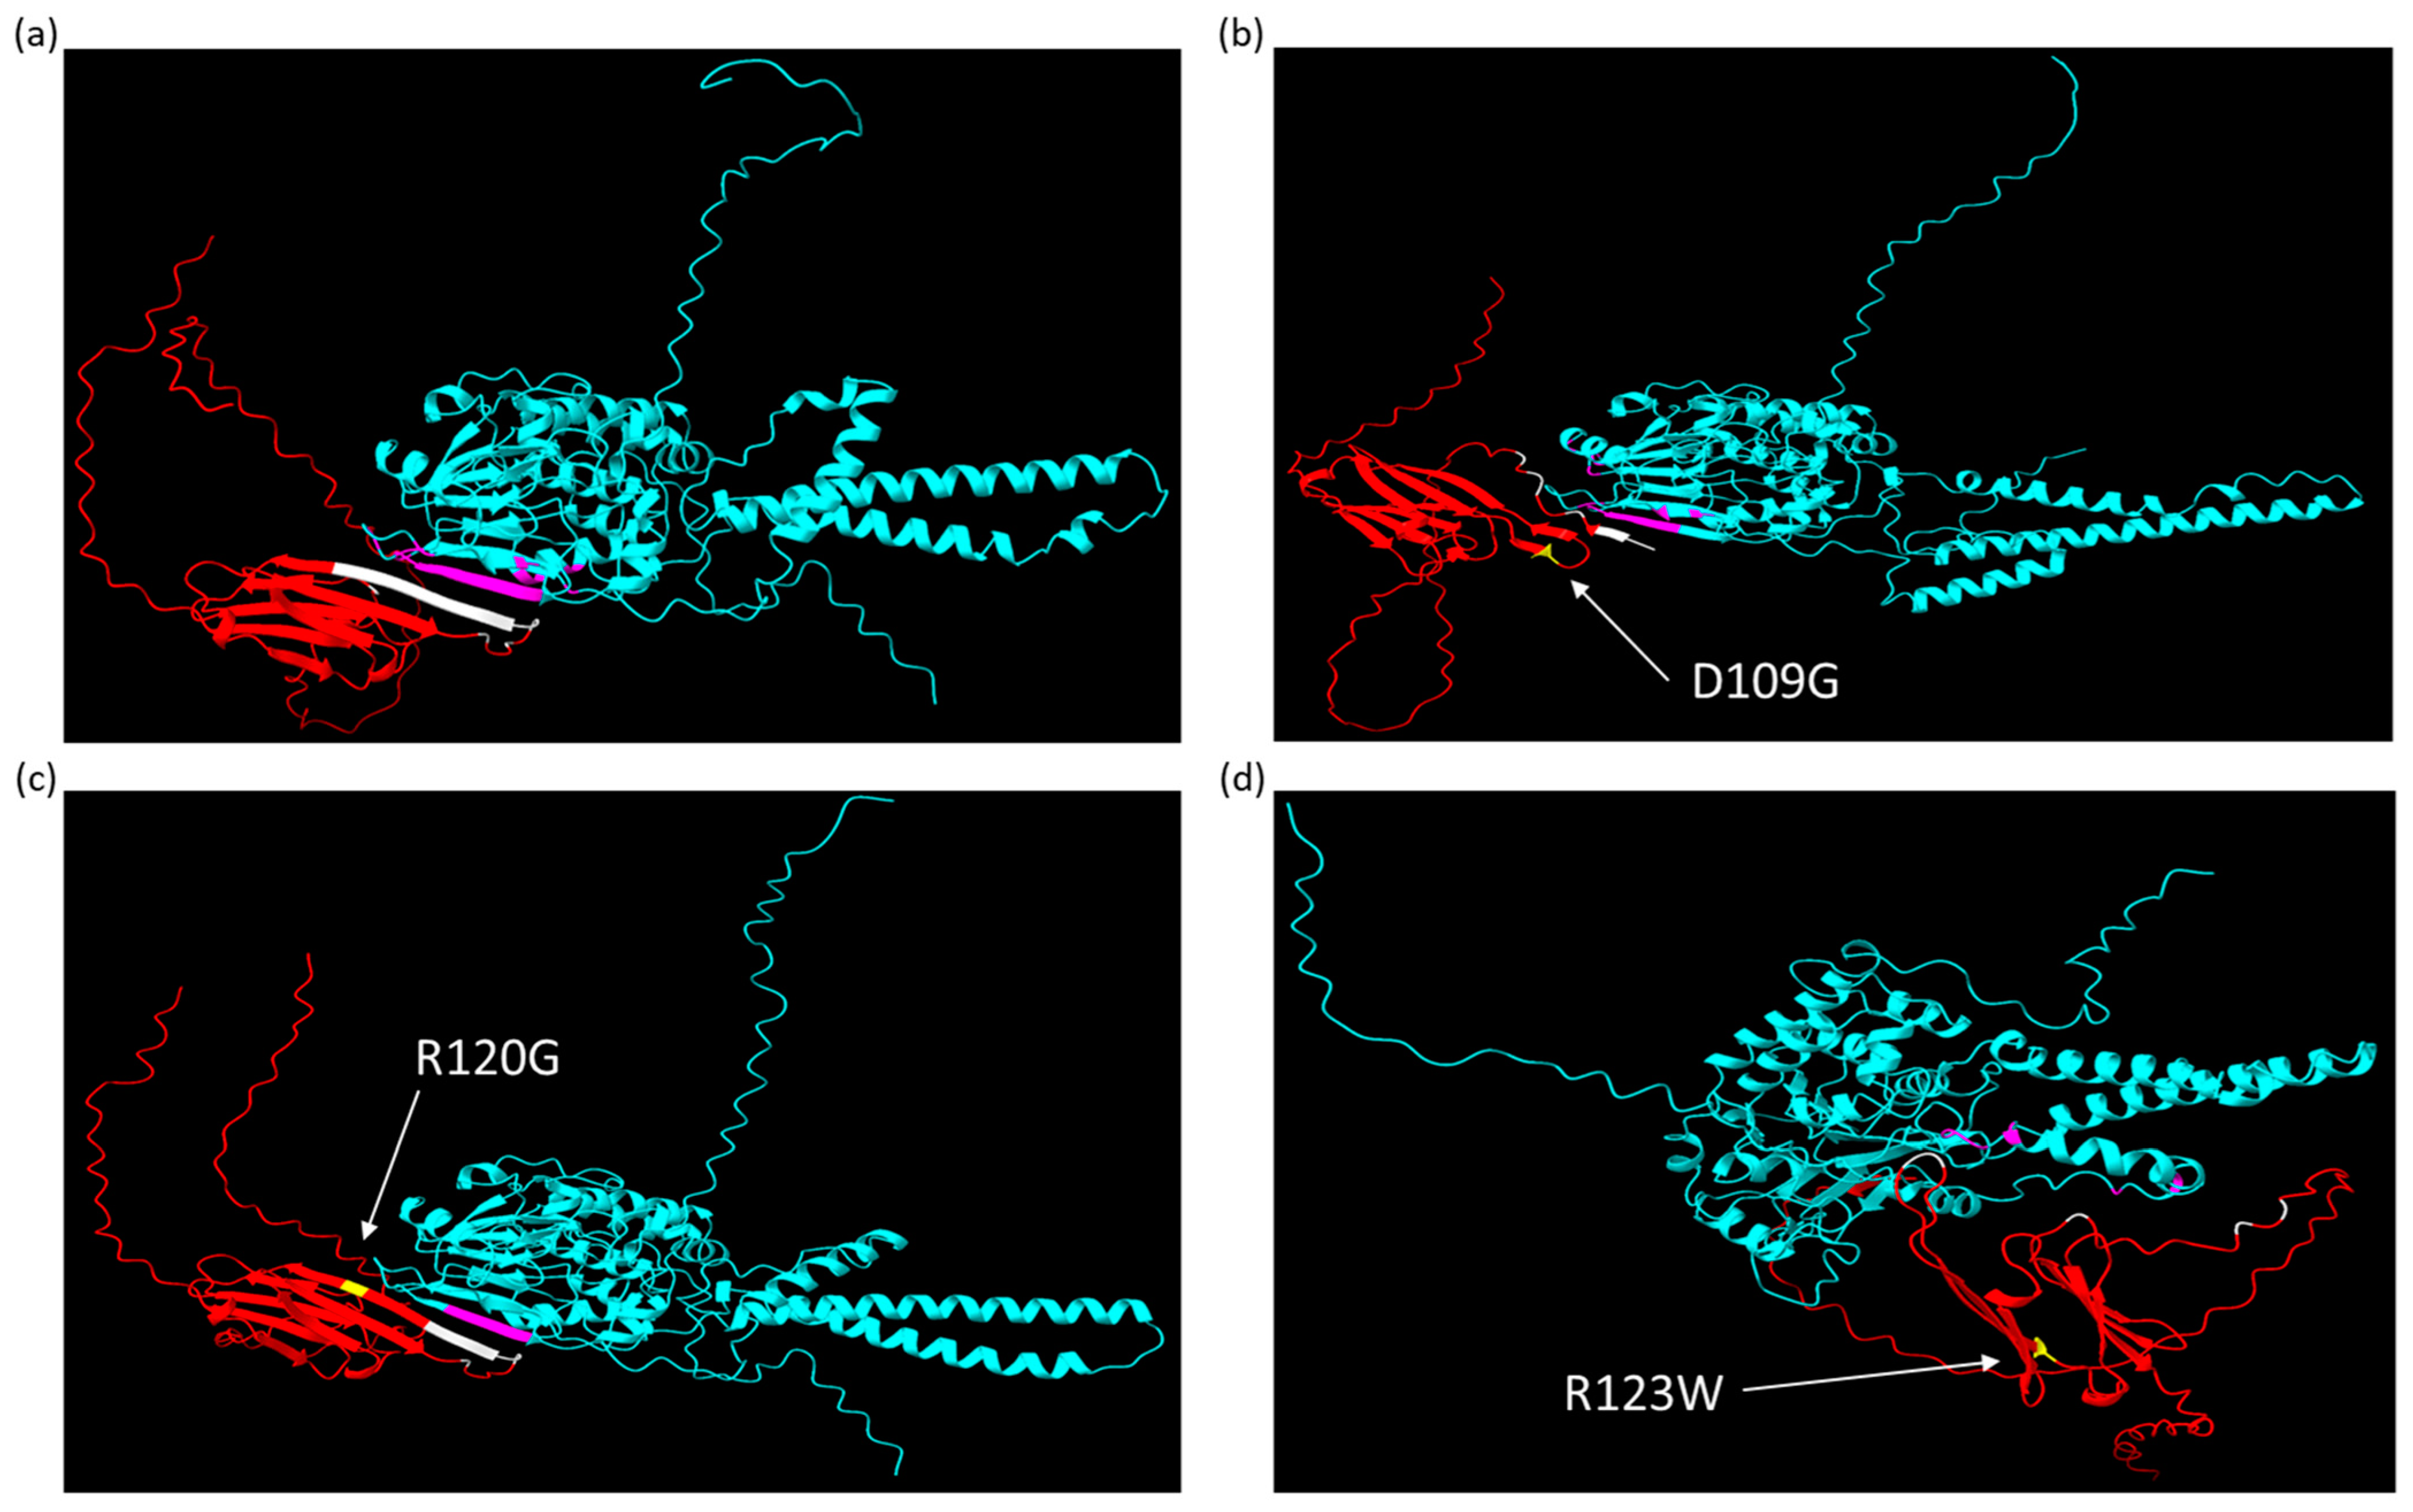
2.3. AlphaFold Predicts That CRYABR123W Binds to the Autoinhibitory Domain of Calcineurin

To attempt to gain a better understanding of the protein structure of the CRYAB variants and their possible interaction with calcineurin, we used the AlphaFold v2.2.0 structural prediction software [34,35]. The sequences for calcineurin and wild-type CRYAB were collected from the AlphaFold Protein database and altered with the selected mutations [36,37]. First, we wanted to ensure that the addition of a triple FLAG tag to the structure was not predicted to have significant alterations in protein structure. A triple FLAG tag sequence was added at the N- and C-terminals of the wild type and CRYABR123W mutant sequences in AlphaFold v2.2.0, which were then visualized and compared in ChimeraX v1.9 [38], with minimal alterations in the protein structure following FLAG tag addition (Figure 3a–d). Second, we modeled the interaction of wild-type CRYAB, CRYABD109G, CRYABR120G, and CRYABR123W with calcineurin (Figure 4a–d). As has been previously published, wild-type CRYAB binds at the NFAT binding site of calcineurin, blocking NFAT from binding to calcineurin [39] (Figure 4a). Both CRYABD109G and CRYABR120G are predicted to interact with the NFAT binding site but to a lesser extent compared to the wild type (Figure 4b,c), consistent with a loss of competition for the NFAT binding model for promoting NFAT activation and cardiac hypertrophy. CRYABR123W, unlike the other proteins, was not predicted to bind at the NFAT binding site and thus would have complete loss of competition for NFAT binding; it was also uniquely predicted to bind at the autoinhibitory domain of calcineurin (Figure 4d). This suggests that unlike the other variants, CRYABR123W might have both a loss of competition for NFAT binding to calcineurin and an additional activating function by relieving the intrinsic autoinhibitory function of calcineurin to promote NFAT activation and cardiac hypertrophy. This offers a likely explanation for the significant increase in calcineurin activity seen in CRYABR123W compared to the other mutants.

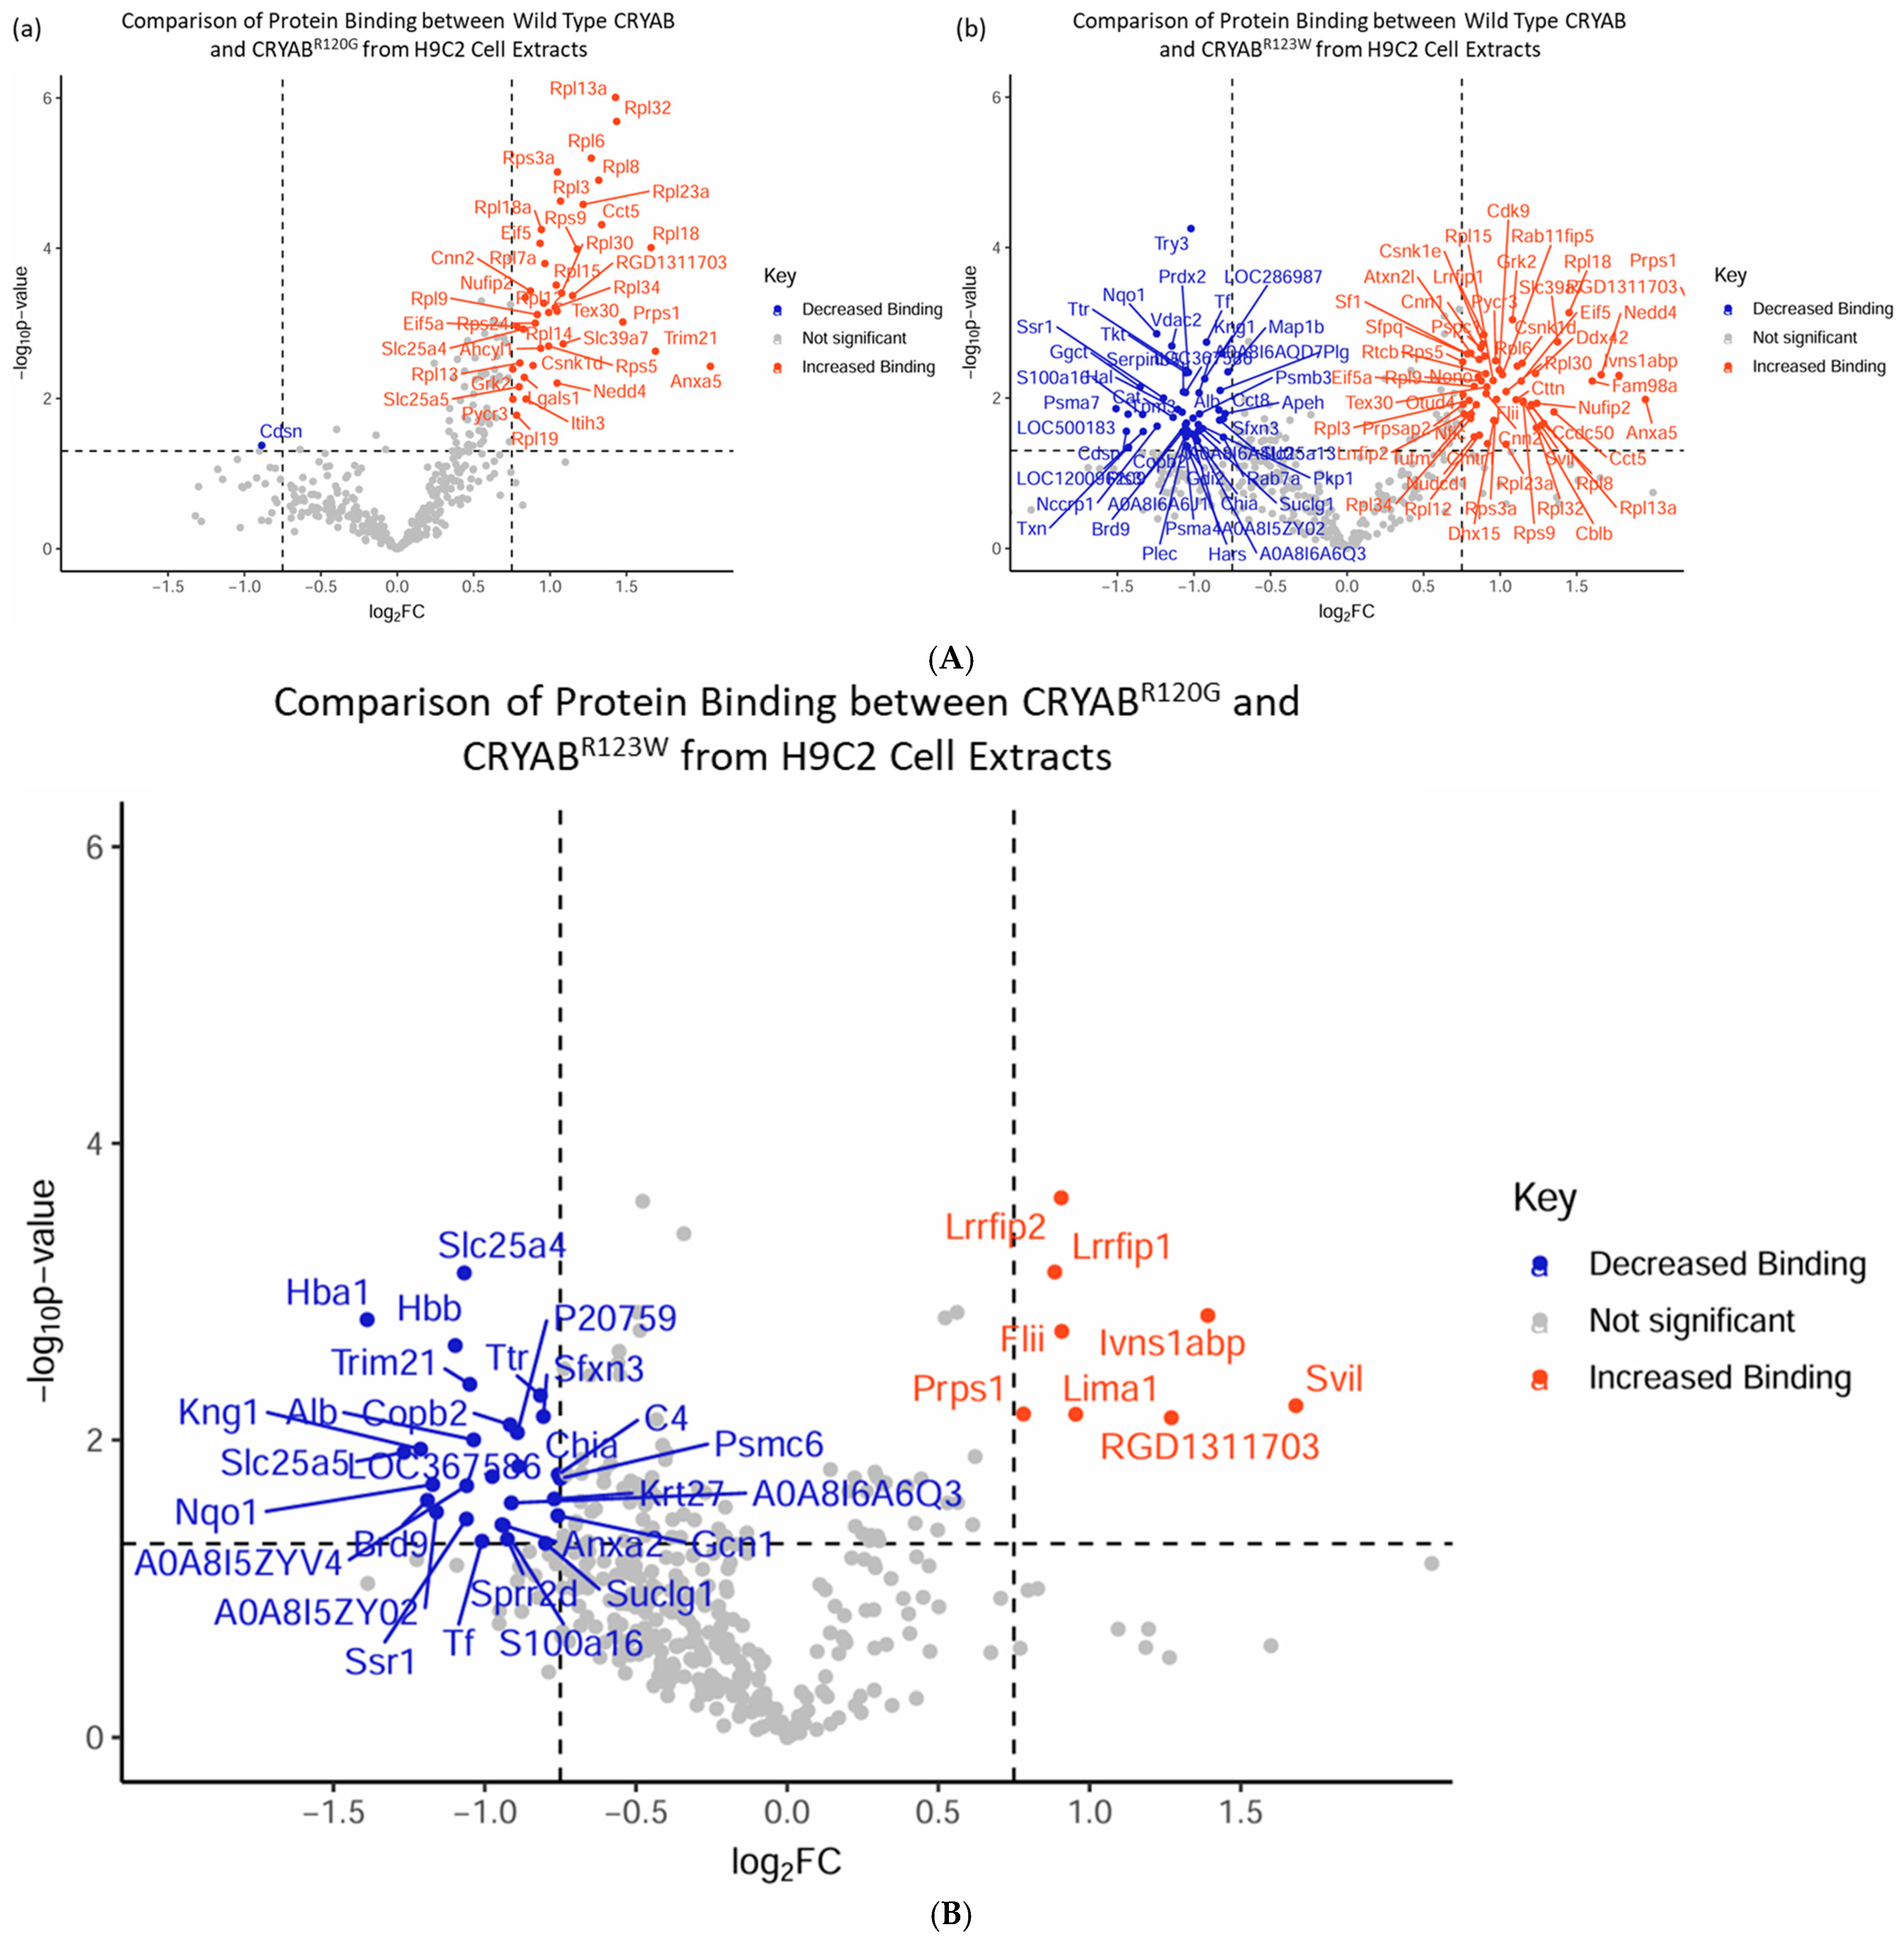
2.4. CRYABR123W Protein Interactome Diverges from CRYAB and CRYABR120G

To examine the impact that CRYAB mutations have on cellular protein interactions, we analyzed FLAG antibody-based co-immunoprecipitation data from H9C2 cellular extracts of FLAG-tagged wild-type CRYAB compared to FLAG-tagged CRYABR120G and CRYABR123W with unbiased LC-MS proteomics. We found that despite their relative closeness in structure and mutation location, CRYABR120G and CRYABR123W mutations have distinct patterns of changes in protein binding. When compared to wild-type CRYAB, CRYABR120G seems to mostly have increased binding to proteins, consistent with its documented propensity to form protein aggregates (Figure 5A(a)) [29,30]. While CRYABR123W has both increased and decreased binding to proteins, which is consistent with a documented loss of chaperone activity, it has increased aggregation (Figure 5A(b)) [33]. When comparing CRYABR120G and CRYABR123W, we saw that the changes in protein binding between the two CRYAB mutants were distinct (Figure 5B). CRYABR123W seems to have higher binding with cytoskeletal proteins, particularly proteins involved in actin binding, such as Svil [40] and Lima1/EPLIN [41] (Figure 5B). However, CRYABR123W seems to have decreased binding to proteins involved in transcription, including Brd9 [42] and Gcn1 [43], protein degradation, such as Trim21 [44] and Nqo1 [45], and the calcium binding ion channel Anxa2 [46] (Figure 5B). Differential protein binding seen with CRYABR123W could be a driving force behind cellular pathway changes involved in the development of the HCM in contrast to the DCM phenotype seen with CRYABR120G or the restrictive CM phenotype seen with CRYABD109G.

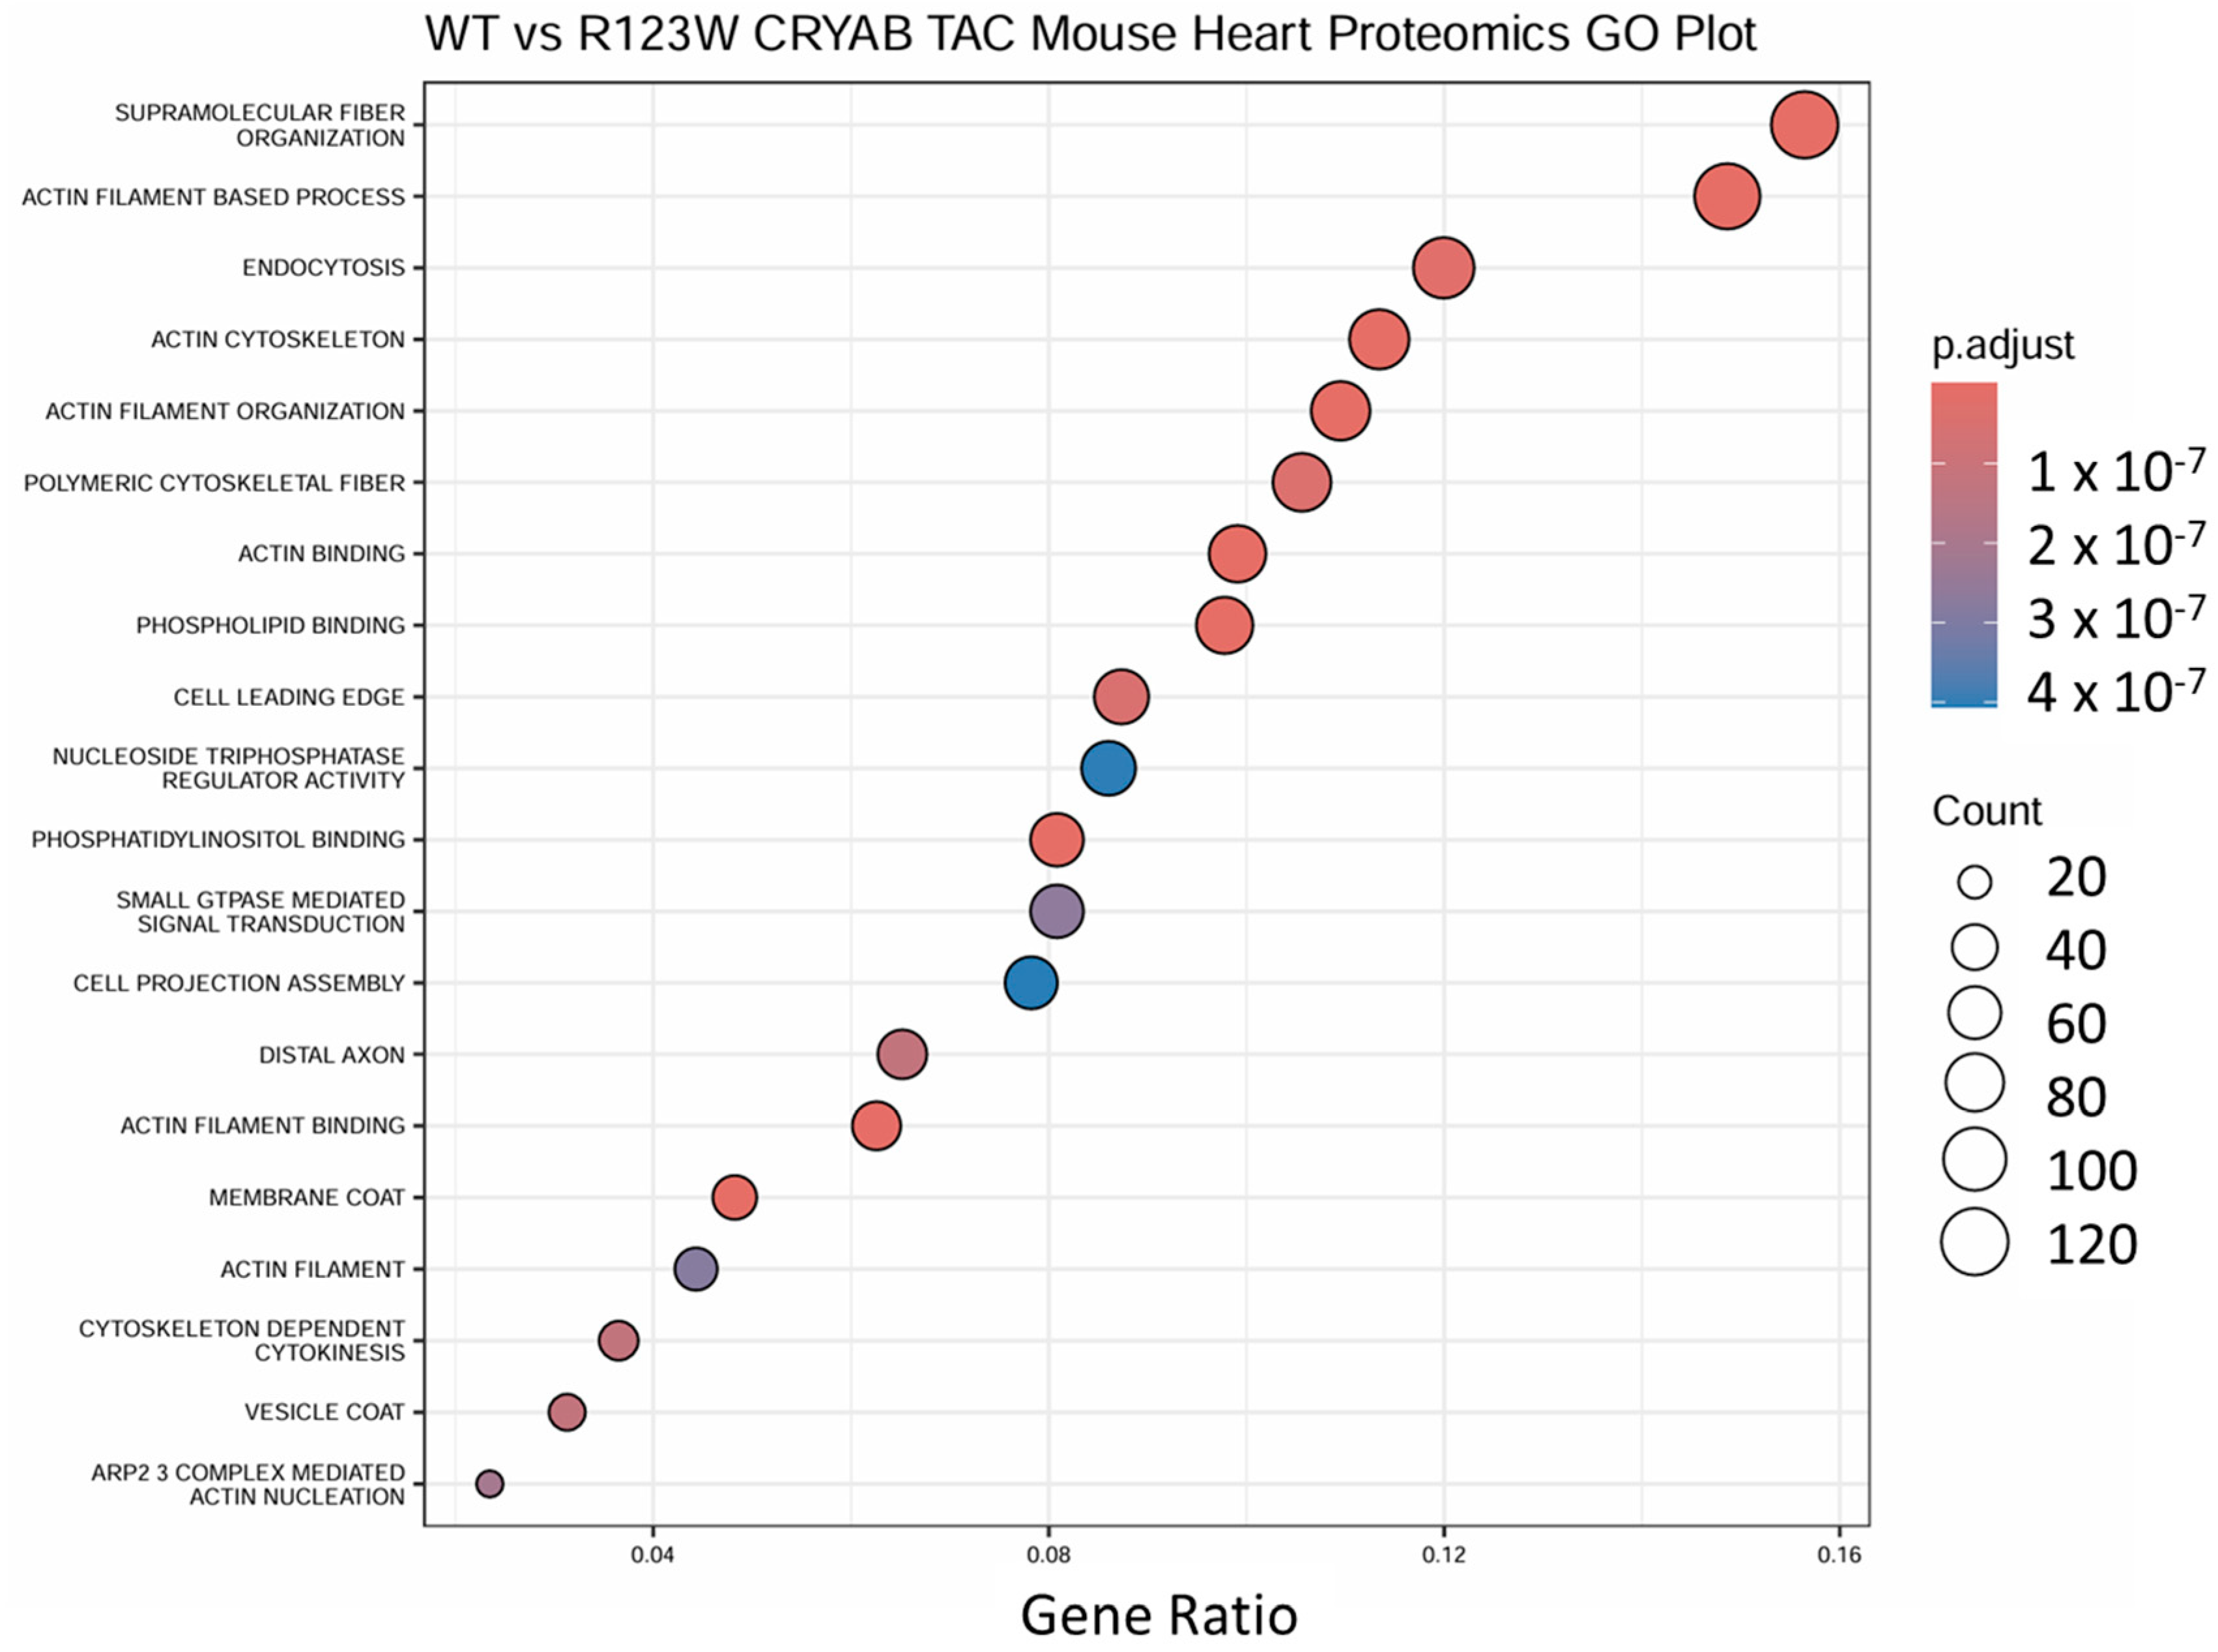
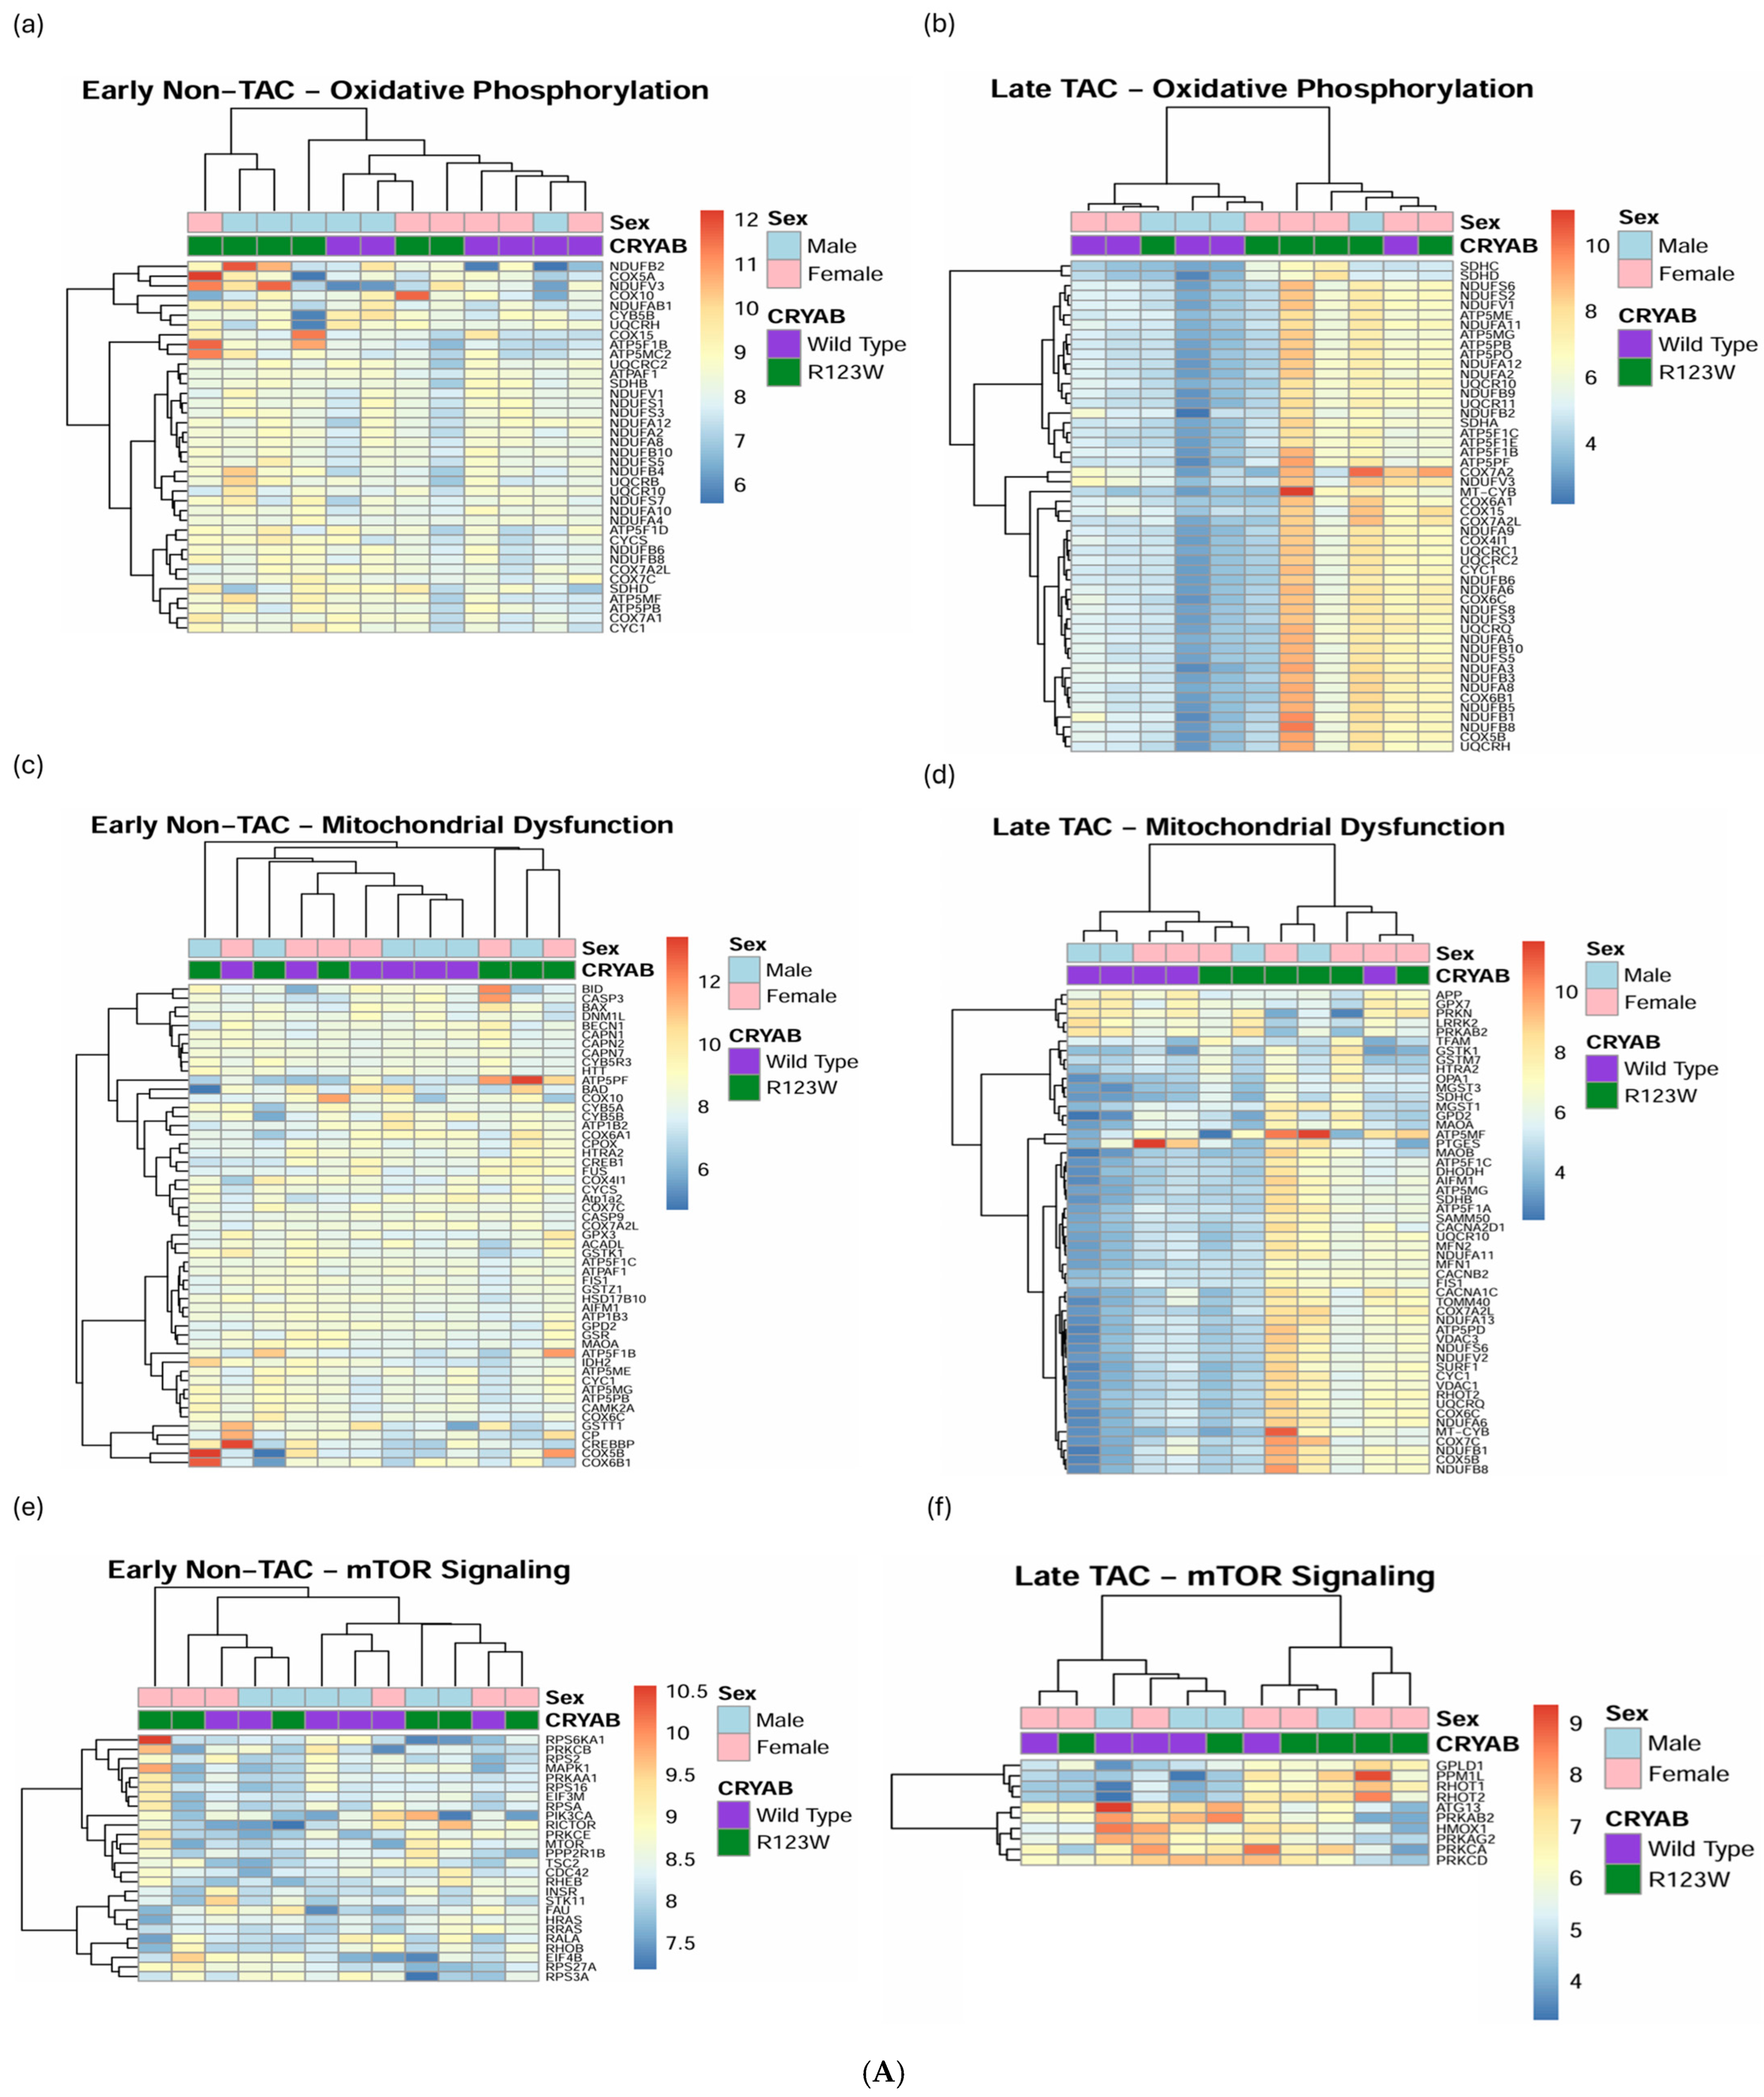
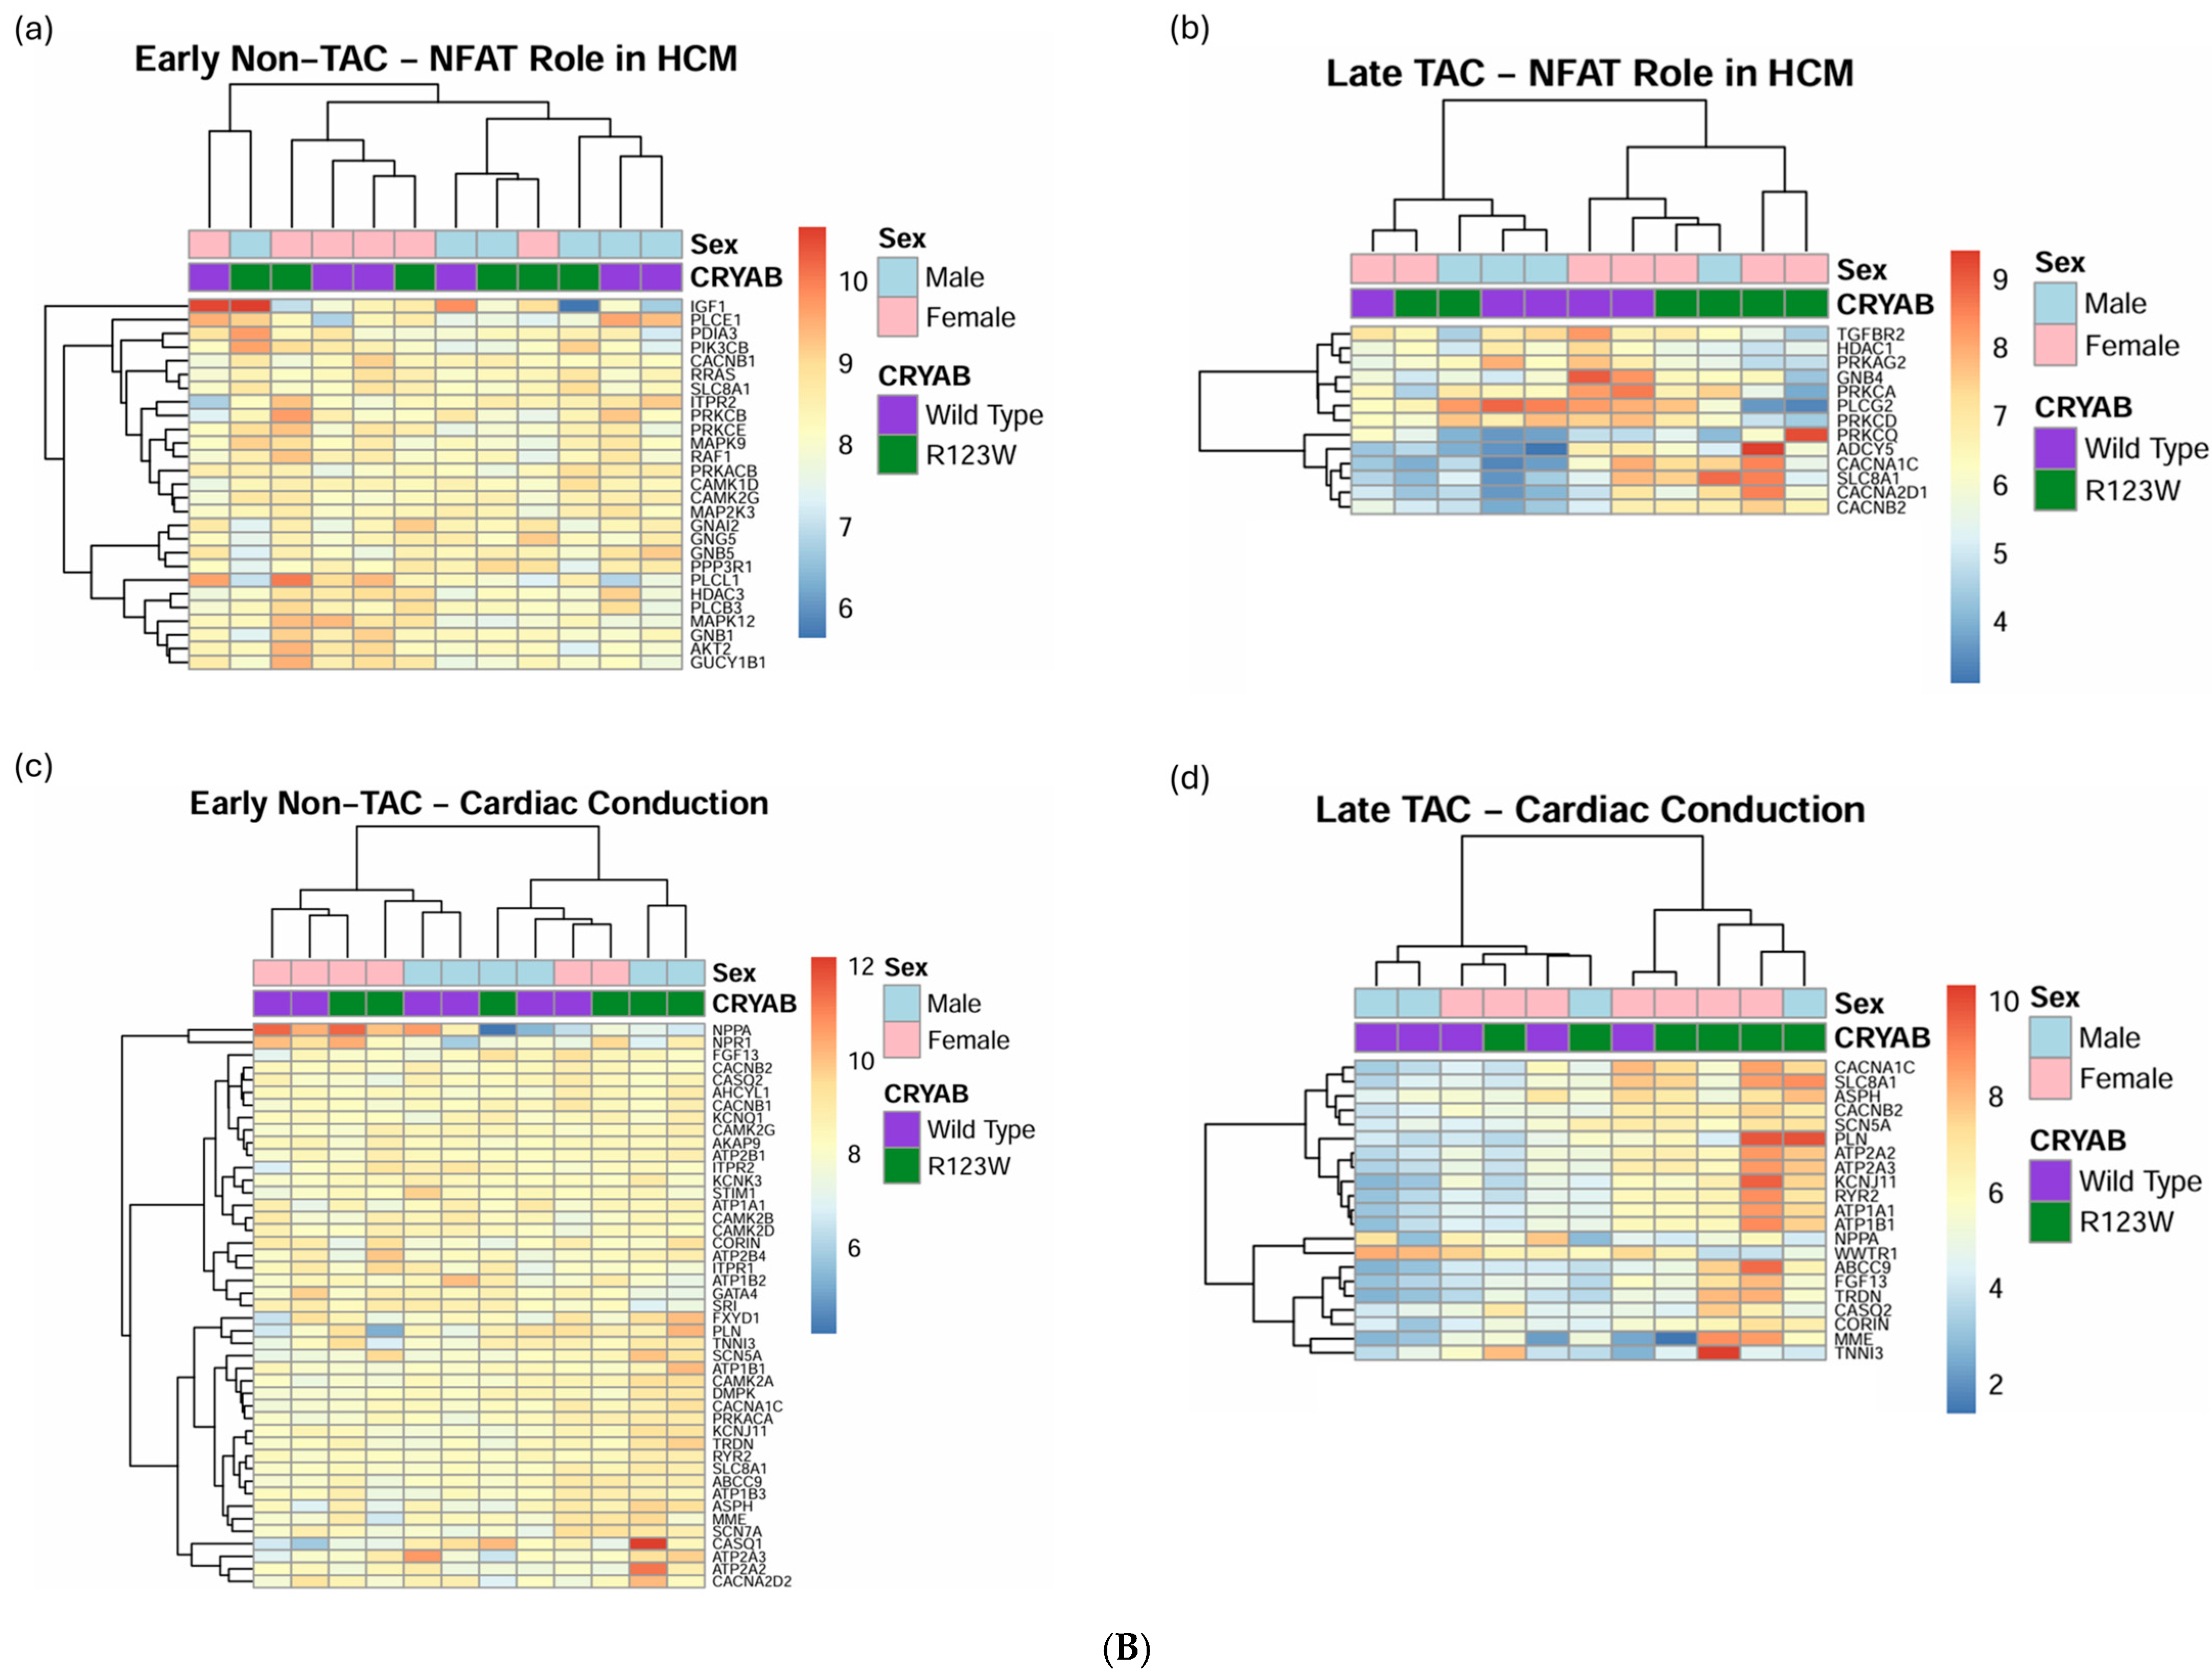
2.5. Global Proteomics and Phosphoproteomics Reveal Cytoskeletal, Metabolic, Immune, and Cardiac Dysfunction in CRYABR123W Mouse Hearts

To investigate the changes in cellular protein composition and pathways, we compared wild-type CRYAB and CRYABR123W global mouse heart extracts with and without pressure overload in the form of TAC. For the mice without TAC, we found 6971 unique proteins, 983 unique phosphorylated proteins, and 1726 proteins common to both (Figure 6a). For mice with TAC, we found 4432 unique proteins, 422 unique phosphorylated proteins, and 1620 proteins common to both (Figure 6d). Without additional pressure overload, the CRYABR123W mutation does not induce an HCM phenotype in our mouse model [32], a common condition of HCM mouse models [47] as few develop spontaneous HCM [48,49,50,51]. Unsurprisingly, without TAC, we observed few significant changes in protein expression or phosphorylation (Figure 6b,c). However, following TAC and the emergence of a pathological hypertrophic phenotype, we observed a significant change in expression of proteins and phosphorylated proteins (Figure 6e,f), notably a downregulation of Grp39, Lgals3, and Sytl3(P), while Anax6, Ppp1r1b, Slc25a15, Hrc(P), and Atxn2l(P) were upregulated (Figure 6e,f). Given that the HCM phenotype does not develop unless there is additional stress on the heart, we designated the pathology of mouse hearts that have not undergone TAC as models of early-stage disease (Figure 6a–c) and those with TAC as models of late-stage disease (Figure 6d–f). As previously described by our lab group, the CRYABR123W mouse model developed systolic dysfunction following TAC [32], a poor prognostic factor of patients with HCM [52,53], illustrating how our mouse model mimics late and severe stages of HCM pathology.
Pathway analysis of the mass spectrometry proteins using GO term analysis in R [54] showed significant associations with cytoskeletal structure and actin filament pathways (Figure 7). However, to determine if there are other possible pathways involved, we analyzed the mass spectrometry data using QIAGEN Ingenuity Pathway Analysis v127006219 (QIAGEN Inc., Hilden, Germany, https://digitalinsights.qiagen.com/IPA, accessed on 1 November 2023) (IPA) [55] software to compare the early-stage-disease and late-stage-disease mouse hearts via heatmaps. IPA revealed significant changes in pathways involved in metabolism, cardiovascular function, and immune regulation, with more congruent clustering using heatmap analysis of the global mass spectrometry data. The most significant pathways that showed increased clustering when comparing early and late stages of the condition included oxidative phosphorylation (Figure 8A(a,b)), mitochondrial dysfunction (Figure 8A(c,d)), and mTOR signaling (Figure 8A(e,f)) for metabolic pathways, NFAT involvement in HCM (Figure 8B(a,b)) and cardiac conduction (Figure 8B(c,d)) for cardiovascular pathways, and granzyme signaling (Figure 8C(a,b)) and neutrophil trapping (Figure 8C(c,d)) for immune pathways. Finally, we used IPA to analyze upstream regulators predicted to be involved in the changes seen in the protein expression of the late-stage disease mass spectrometry data, which showed significant involvement of enzymes, kinases, G protein-coupled receptors (GPCR), phosphatases, and ion channels (Table 1). Our analysis demonstrates how the stress of pressure overload reveals pathological hypertrophy pathways secondary to CRYABR123W mutation. Specifically, there are distinct changes secondary to CRYABR123W-induced pathological hypertrophy in the cytoskeletal, metabolic, cardiac, and immune pathways. Finally, distinct upstream regulators are predicted to be involved in the changes seen with pathological hypertrophy secondary to CRYABR123W following pressure overload by TAC, which could be targets for future therapeutic intervention.

3. Discussion

In this study, we used both cell lines and mouse models to examine the cellular effects of mutations in the CRYAB protein. For our comparative mutations, we chose CRYABD109G and CRYABR120G as they are the most extensively studied CRYAB mutations causing cardiomyopathy, allowing us to perform an in-depth comparative analysis. In addition to being the most studied, both of these mutations are located within the same critical B-sheet domain as CRYABR123W; therefore, we were interested in understanding their functional difference and pathophysiology. Previous studies have demonstrated that wild-type CRYAB is a protein interactor of calcineurin and suppresses the activity of calcineurin in the setting of pressure overload, but they did not explain how heterozygosity for CRYABR123W conferred susceptibility to pathological hypertrophy [32]. In a simple competition for the NFAT binding model, wild-type CRYAB present in CRYABR123W heterozygotes would still inhibit the interaction of NFAT with calcineurin and therefore limit calcineurin dephosphorylation of NFAT and the activation of hypertrophic signaling. Our results show that calcineurin activity was significantly elevated in cells overexpressing mutant CRYABR123W, despite the continued presence of wild-type CRYAB, indicating a unique link between the mutation and aberrant calcineurin activity, which is not observed with CRYABD109G or CRYABR120G. Our structural prediction using AlphaFold v2.2.0 indicates a possible interaction between CRYABR123W and the autoinhibitory domain of calcineurin, a key intrinsic regulatory motif [56]. This predicted interaction likely provides the mechanism behind the observed significant and unique increase in calcineurin activity. Our structural prediction, however, has limitations, such as the inability to model the effect of post-translation modifications and assess several known phosphorylation sites of CRYAB [24,25]. Our analysis also does not model the interaction between CRYAB and calcineurin using different constraints on the interaction, such as specific interacting configurations or amino acids, which could further illustrate the nature of their interaction.
Hypertrophic cardiomyopathy has been characterized by dysregulated fibrosis, immune regulation, inflammation, and metabolism [57]. Our global proteomics analysis demonstrates that HCM secondary to the expression of mutant CRYABR123W leads to dysregulated oxidative phosphorylation and mitochondrial function pathways. Additionally, hearts from mice carrying the CRYABR123W mutation exhibit a significant dysregulation of immune function and cytoskeletal pathways that are likely secondary to the impaired chaperone activity of CRYABR123W [33]. Wild-type CRYAB is significantly expressed in cardiac tissue [58] and has been shown to readily bind to various protein interactors [59,60], including proinflammatory proteins [61], thus having an anti-inflammatory effect [62,63,64]. Therefore, it is not surprising that mutant CRYAB proteins are involved in dysregulated inflammatory and immune responses. The role of immune and inflammatory dysregulation on the pathogenesis of HCM secondary to CRYABR123W raises the question of whether there is a role for anti-inflammatory therapeutics in the treatment of HCM.
HCM pathology has been characterized by enhanced calcium signaling regardless of the underlying pathological mutation or cause [65,66]. Wild-type CRYAB plays a crucial role in the regulation of pathological calcium signaling in the setting of pressure overload through the modulation of NFAT and calcineurin activity [32,67]. We observed a significantly impaired calcium reuptake in CRYABR123W mutant myocytes, indicating that the mutant has a role in the dysregulation of cellular calcium handling and an altered calcineurin interaction. Further investigation into the role that calcineurin and calcium play in the development of HCM in general and in the setting of CRYABR123W, as well as the viability of calcineurin inhibitors as a therapeutic intervention for HCM patients, is required. Our work supports the notion that precision intracellular targeting could be crucial for the development of a treatment for HCM patients.
CRYAB has been well documented as a molecular chaperone in a variety of different tissues across the body. Previously documented mutations in CRYAB have been linked to the development of various cardiomyopathies via the disruption of ionic bridges critically involved in the molecular chaperone function of CRYAB [22,23]. CRYABR123W, however, is unique in its development of HCM [31,32]. Our comparative analysis of CRYABR120G and CRYABR123W co-immunoprecipitation data suggests a distinct mechanism behind the cellular changes seen with CRYABR123W; further research could illuminate novel mechanisms for the development of HCM. Recent structural studies on CRYABR123W demonstrated reduced chaperone activity and increased aggregation to cytoskeletal proteins [33]. Similarly, our co-immunoprecipitation experiments showed significant overall loss of protein binding with CRYABR123W as well as increased binding to cytoskeletal proteins and greater involvement in cytoskeletal pathways. Of note, our Co-IP cell models did not show specific binding changes to desmin for CRYABR123W, which is consistent with previous publications regarding the protein [32]. Additionally, we did not see desmin binding with both the wild-type CRYAB and CRYABR120G cell models, which might be because the interaction with desmin is not stable during immunoprecipitation. Further validation of changes in interaction partners secondary to the CRYABR123W mutation could illuminate possible targets for therapeutic intervention. As a molecular chaperone, CRYAB is responsible for preventing aberrant protein folding and interactions; as such, it is likely the abnormal function of the binding partners of CRYAB that lead to the development of HCM. The identification of key CRYAB interactors affected by mutations in the protein could be targets for small molecular therapies that might also be applicable to non-CRYAB based HCM.

4. Materials and Methods

AlphaFold Protein Structure Modeling—Native amino acid sequences for CRYAB and calcineurin were downloaded from their respective AlphaFold Protein Structure Database entries [36,37]. CRYAB sequences were edited into their mutated form by replacing the corresponding amino acids: D109G, R120G, and R123W. All sequences (individual and multiple) were run in AlphaFold v2.2.0 using the multimer setting [34,35]. Structures with the highest fidelity, which were predicted using AlphaFold v2.2.0 ranked analysis, were considered. Images of structures were viewed and labeled using ChimeraX v1.9 developed by UCSF [38].
CRYAB DNA Insert and Plasmid Preparation—The plasmid backbone was based on the pLJM1-Empty plasmid construct (Addgene, Watertown, MA, USA; Addgene plasmid #91980; http://n2t.net/addgene:91980, accessed on 1 September 2023; RRID:Addgene_91980) [68]. CRYAB gene inserts were created using IDT gene block fragment technology (IDT Inc., Coralville IA, USA; https://www.idtdna.com/page, accessed on 1 September 2023). Gene insert sequences were created with a 40 BP Gibson homology sequence from the pLJM1 plasmid at the 5′ and 3′ ends and then internally flanked by restriction enzyme sites for NheI at the 5′ end and EcoRI at the 3′ end. Between the 5′ and 3′ ends, the main sequences consisted of a Kozak site, start codon, triple FLAG sequence, CRYAB or CRYAB sequences, triple FLAG sequence for both N- and C-terminal labeling, and a stop codon. Wild-type, D109G, R120G, and R123W CRYAB DNA sequences were used for the inserts and were retrieved from Uniprot (https://www.uniprot.org/, accessed on 1 September 2023). Linearized pLJM1-Empty plasmid was prepared using FastDigest Green Buffer (ThermoFisher Scientific, Waltham, MA, USA; ThermoFisher #B72) and NheI (ThermoFisher Scientific, Waltham, MA, USA; ThermoFisher #ER0971) and EcoRI (ThermoFisher Scientific, Waltham, MA, USA; ThermoFisher #ER0271) restriction enzymes. The solution was then incubated at 37 °C for 30 min and then at 80 °C for 5 min to inactivate the restriction enzymes. CRYAB gene inserts were incorporated into the linearized pLJM1 plasmid using Gibson assembly according to the manufacturer’s protocol (ThermoFisher Scientific, Waltham, MA, USA; ThermoFisher #A46633) [69].
Bacterial Transformation—Stable competent E. coli cells (New England Biolabs, Inc., Ipswich, MA, USA; NEB #C3040) were transformed using the heat shock method, as previously described, using 100 ng of the Gibson reaction solution [70]. Transformed E. coli cells were then grown on LB plates with ampicillin selection for 12 h before individual colonies were selected and cultured in LB media with ampicillin selection prior to plasmid isolation.
Plasmid Isolation and Sequencing—Stable E. coli cultures were pelleted, and plasmids were isolated using QIAGEN miniprep (QIAGEN Inc., Hilden, Germany, QIAGEN #27104) or Takarabio Midiprep (Takara # 740422.50) according to the manufacturer’s protocol. Prior to further usage, plasmids were sequenced using Sanger sequencing to confirm proper insert sequences at the Tufts University Sequencing Core.
Cell Lines—H9C2 cells purchased from ATCC (American Type Culture Collection, Manassas, VA, USA; CRL-1446) were maintained on DMEM media supplemented with 10% fetal bovine serum. H9C2 cell lines expressing triple FLAG-tagged wild-type human CRYAB, D109G, R120G, or R123W variants were generated using DNA sequences encoding the variants that were inserted to a pLenti-puro vector (Addgene, Watertown, MA, USA; #39481, Addgene). H9c2 cells were transduced with 3rd generation CRYAB-expressing lentivirus, packaged as previously described [71]. Transduced cells were selected and maintained on 10 µg/mL puromycin.
Stable CRYAB H9C2 Cell Line Preparation—Using autoclaved forceps and sterile filter paper dipped in trypsin, individual colonies of transfected H9C2 cells were selected and grown in DMEM media supplemented with 10% fetal bovine serum and puromycin to make stable cell lines. Stable H9C2 CRYAB cell lines were checked for CRYAB expression using Western blotting with a primary monoclonal mouse anti-FLAG antibody (MerckMillipore, Dramstadt, Germany; MerckMillipore #F1804) and secondary immunofluorescent AlexaFluor488 goat anti-mouse light chain-specific antibody (Jackson ImmunoResearch, West Grove, PA, USA; Jackson ImmunoResearch #115-545-174). Wild-type and mutant CRYAB cell lines with approximately equal expression were selected for use in future experiments and maintained in DMEM media supplemented with 10% fetal bovine serum and puromycin.
Calcineurin Activity Assay—CRYAB wild-type and mutant H9C2 stable cells were grown to 75% confluence on 10 cm plates before being harvested and lysed with 1 mL of ice-cold lysis buffer (50 mM HEPES buffer, 150 mM NaCl, 0.1% NP-40, Halt protease, and phosphatase inhibitors (ThermoFisher Scientific, Waltham, MA, USA; ThermoFisher # 78442)). Plates with lysis buffer were left on ice for 5 min before cells were detached with a cell scraper and collected in an Eppendorf tube. Cells were centrifuged at 12,000× g for 10 min at 4 °C, and then, the lysate supernatant was collected. Protein concentration was determined by BCA assay, and equal protein amounts were used between samples (approximately 1 mg/mL concentration). Calcineurin activity was measured using a colorimetric calcineurin assay kit (MerckMillipore, Dramstadt, Germany; MerckMillipore #207007), with each sample being prepared in triplicate and as specified by the manufacturer. Samples were read at 620 nm absorbance, and calcineurin activity was calculated based on the following equation: (Total − Background) − (EGTA − Background).
Co-immunoprecipitation (Co-IP)—CRYAB wild-type and mutant H9C2 stable cells were grown to 75% confluence on 10 cm plates before being harvested and lysed with 1 mL of ice-cold lysis buffer (50 mM HEPES buffer, 150 mM NaCl, 0.1% NP-40, Halt protease, and phosphatase inhibitors (ThermoFisher Scientific, Waltham, MA, USA; ThermoFisher # 78442)). Plates with lysis buffer were left on ice for 5 min before cells were detached with a cell scraper and collected in an Eppendorf tube. Cells were centrifuged at 12,000× g for 10 min at 4 °C, and then, the lysate supernatant was collected. Bradford assays were performed on all lysate samples, and 1 mg of each lysate was incubated with 2 µg monoclonal mouse anti-FLAG antibody (MerckMillipore, Dramstadt, Germany; MerckMillipore #F1804) and incubated on a rotator at 4 °C for 2 h. Then, 30 µL of 50% Protein G Sepharose 4 Fast Flow beads (MerckMillipore, Dramstadt, Germany; MerckMillipore #GE17-0618) were added to the lysate and rotated at 4 °C for an additional 45 min. After incubation, the tubes were centrifuged at 10,000× g for 30 s at 4 °C and the supernatant was removed. The remaining beads were washed with 200 µL of cold PBS and centrifuged at 10,000× g for 30 s 3 times. Co-immunoprecipitation samples were eluted off the beads using a 5% Formic acid solution and then centrifuged at 12,000× g for 30 s. The supernatant was collected and stored in Eppendorf tubes. Co-immunoprecipitation samples were lyophilized prior to shipment to the Harvard Mass Spectrometry Core for preparation as per their protocols, described below.
CRYAB Mouse Model Procedures and Global Proteomics Sample Preparation—CRYAB mouse models for both wild-type CRYAB and CRYABR123W were based on the model previously established in our lab [32]. All mice underwent echocardiography once between 10 and 12 weeks of age and then 5 weeks later as per the protocol previously described [32]. Then, 10–12-week-old wild-type CRYAB and CRYABR123W mice were respectively split into two groups, one without intervention and one to undergo severe (27G needle) transverse aortic constriction to induce pressure overload, as previously described [72]. Following the procedure, the mice were allowed to recover for 5 weeks. After the second echocardiography, all mice were anesthetized with isoflurane before being euthanized with cervical dislocation. The chest was cleaned with alcohol before being cut open, and the heart was harvested by transecting the great vessels just above their exit from the heart. The hearts were washed and chambers were emptied using ice-cold PBS before being placed in an Eppendorf tube and flash-frozen in liquid nitrogen. The hearts were stored at −80 °C until all the requisite hearts were ready for mass spectrometry preparation. Prior to mass spectrometry analysis, the hearts were homogenized in a lysis buffer (50 mM HEPES buffer, 150 mM NaCl, 0.1% NP-40, Halt protease, and phosphatase inhibitors (ThermoFisher Scientific, Waltham, MA, USA; ThermoFisher # 78442)) using an ultrasonic cell disrupter and centrifuged; then, the lysate supernatant was collected. Heart lysate samples were lyophilized prior to shipment to the Harvard Mass Spectrometry Core for preparation as per their protocols, described below. All mice were handled in accordance with the US National Institutes of Health standards, and all procedures were approved by the Tufts University Institutional Animal Care and Use Committee.
Co-IP Mass Spectrometry Sample Preparation—Dried IP elutions were solubilized in a buffer of 200 mM EPPS (pH 8.5), 8M urea, and protease inhibitors. A buffer exchange was carried out using a modified SP3 protocol [73]. Briefly, ~250 µg of Cytiva SpeedBead Magnetic Carboxylate Modified Particles (65152105050250 and 4515210505250), mixed at a 1:1 ratio, were added to each sample. Then, 100% ethanol was added to each sample to achieve a final ethanol concentration of at least 50%. The samples were incubated with gentle shaking for 15 min and washed three times with 80% ethanol. Protein was eluted from SP3 beads using 200 mM EPPS (pH 8.5) containing Lys-C (Wako Chemicals, Richmond, VA, USA; Wako #129-02541). The samples were digested overnight at room temperature with vigorous shaking. The next morning, trypsin was added to each sample and further incubated for 6 h at 37 °C. Acetonitrile was added to each sample to achieve a final concentration of ~33%. Each sample was labeled with ~62.5 µg of TMTPro reagents (ThermoFisher Scientific, Waltham, MA, USA) in the presence of SP3 beads. Following the confirmation of satisfactory labeling (>97%), excess TMT was quenched by the addition of hydroxylamine to a final concentration of 0.3%. The full volume of each sample was pooled, and the acetonitrile was removed by vacuum centrifugation. The samples were acidified with formic acid and de-salted by StageTip eluted into autosampler inserts (ThermoFisher Scientific, Waltham, MA, USA), dried in a speedvac, and reconstituted with 5% acetonitrile and 5% formic acid for LC-MS/MS analysis.
Co-IP Liquid Chromatography and Tandem Mass Spectrometry—Mass spectrometry data were collected on an Orbitrap Eclipse mass spectrometer coupled to a Proxeon NanoLC-1000 UHPLC (ThermoFisher Scientific, Waltham, MA, USA). The 100 µm capillary column was packed in-house with 35 cm of Accucore 150 resin (2.6 μm, 150 Å; ThermoFisher Scientific, Waltham, MA, USA). Data were acquired for 180 min per run. A FAIMS device was enabled during data collection, and compensation voltages were set to −40 V, −60 V, and −80 V [74]. MS1 scans were collected in the Orbitrap (resolution—60,000; scan range—400–1600 Th; automatic gain control (AGC)—standard; and maximum ion injection time—automatic). MS2 scans were collected in the Orbitrap following higher-energy collision dissociation (HCD) (resolution—50,000; AGC—250%; normalized collision energy—36; isolation window—0.5 Th; and maximum ion injection time—100 ms).
Co-IP Mass Spectrometry Data Analysis—Database searching included all entries from the rat UniProt Database (downloaded in June 2022). The database was concatenated with one composed of all protein sequences for that database in the reverse order [75]. Raw files were converted to mzXML, and monoisotopic peaks were re-assigned using Monocle [76]. Searches were performed with Comet [77] using a 50 ppm precursor ion tolerance and fragment bin tolerance of 0.02. TMTPro labels on lysine residues and peptide N-termini (+304.207 Da), as well as carbamidomethylation of cysteine residues (+57.021 Da), were set as static modifications, while the oxidation of methionine residues (+15.995 Da) was set as a variable modification. Peptide-spectrum matches (PSMs) were adjusted to a 1% false discovery rate (FDR) using a linear discriminant, after which proteins were assembled further to a final protein-level FDR of 1% [78]. TMT reporter ion intensities were measured using a 0.003 Da window around the theoretical m/z for each reporter ion. Proteins were quantified by summing reporter ion counts across all matching PSMs. More specifically, reporter ion intensities were adjusted to correct for the isotopic impurities of the different TMTPro reagents according to the manufacturer’s specifications. Peptides were filtered to exclude those with a summed signal-to-noise (SN) value < 180 across all TMT channels and <0.5 precursor isolation specificity. The signal-to-noise (S/N) measurements of peptides assigned to each protein were summed (for a given protein). Data analysis based on the CRYAB Co-IP raw spectrum file can be found in the MassIVE database with the accession number MSV000097115.
Global Sample Preparation for Mass Spectrometry—CRYAB mouse heart samples for protein analysis were prepared as previously described [79,80]. Proteomes were extracted using a buffer containing 200 mM EPPS (pH 8.5), 8 M urea, 0.1% SDS, and protease inhibitors. Following lysis, 150 µg of each proteome was reduced with 5 mM TCEP. Cysteine residues were alkylated using 10 mM iodoacetamide for 20 min at RT in the dark. Excess iodoacetamide was quenched with 10 mM DTT. A buffer exchange was carried out using a modified SP3 protocol [73]. Briefly, ~1500 µg of Cytiva SpeedBead Magnetic Carboxylate Modified Particles (65152105050250 and 4515210505250), mixed at a 1:1 ratio, were added to each sample. Then, 100% ethanol was added to each sample to achieve a final ethanol concentration of at least 50%. The samples were incubated with gentle shaking for 15 min and washed three times with 80% ethanol. Protein was eluted from SP3 beads using 200 mM EPPS (pH 8.5) containing Lys-C (Wako, 129-02541). The samples were digested overnight at room temperature with vigorous shaking. The next morning, trypsin (ThermoFisher Scientific) was added to each sample and further incubated for 6 h at 37 °C. Following digestion, an equal volume of each sample was pooled to generate a pooled sample to be used as a bridge between two TMTPro 16-plex experiments. Acetonitrile was added to each sample to achieve a final concentration of ~33%. Each sample was labeled with ~300 µg of TMTPro reagents (ThermoFisher Scientific, Waltham, MA, USA) in the presence of SP3 beads. Following the confirmation of satisfactory labeling (>97%), excess TMT was quenched by the addition of hydroxylamine to a final concentration of 0.3%. The full volume of each sample was pooled, and the acetonitrile was removed by vacuum centrifugation for 1 h. The pooled sample was acidified, and peptides were de-salted using a Sep-Pak 50 mg tC18 cartridge (Waters, Milford, MA, USA). Peptides were eluted in 70% acetonitrile and 1% formic acid and dried by vacuum centrifugation.
Global Sample Phosphopeptide Enrichment—A phosphopeptide enrichment was performed using a High-Select Fe-NTA Phosphopeptide Enrichment Kit (ThermoFisher Scientific, Waltham, MA, USA). Dried phosphopeptides were de-salted using StageTips and re-dissolved in 5% formic acid/5% acetonitrile for LC-MS/MS. The flow-through from the phosphopeptide enrichment was used for total proteome profiling.
Global Sample Basic pH Reversed-phase Separation (BPRP)—TMT-labeled peptides were solubilized in 5% acetonitrile/10 mM ammonium bicarbonate (pH 8.0), and ~300 µg of TMT-labeled peptides were separated by an Agilent 300 Extend C18 column (3.5 μm particles: 4.6 mm ID and 250 mm in length). An Agilent 1260 binary pump coupled with a photodiode array (PDA) detector (ThermoFisher Scientific, Waltham, MA, USA) was used to separate the peptides. A 45 min linear gradient from 10% to 40% acetonitrile in 10 mM ammonium bicarbonate (pH 8.0) (flow rate of 0.6 mL/min) separated the peptide mixtures into a total of 96 fractions (36 s), which were consolidated into 24 samples in a checkerboard fashion and vacuum-dried to completion. Each sample was de-salted via StageTips and re-dissolved in 5% formic acid/5% acetonitrile for LC-MS3 analysis.
Global Sample Liquid Chromatography Separation and Tandem Mass Spectrometry (LC-MS2) for Proteomics—Proteome data were collected on an Orbitrap Fusion Lumos or Orbitrap Eclipse mass spectrometer (ThermoFisher Scientific, Waltham, MA, USA) coupled to a Proxeon EASY-nLC 1000 LC pump (ThermoFisher Scientific, Waltham, MA, USA). Fractionated peptides were separated using a 120 min gradient at 525–650 nL/min on a 35 cm column (i.d. of 100 μm, Accucore of 2.6 μm, and 150 Å) packed in-house. MS1 data were collected in the Orbitrap (ThermoFisher Scientific, Waltham, MA, USA; Fusion Lumos: 120,000 resolution, maximum injection time—50 ms, and AGC—6 × 10⁵; Eclipse: 60,000 resolution, maximum injection time—50 ms, and AGC—4 × 10⁵). Charge states between 2 and 6 (Fusion Lumos) or 2 and 5 (Eclipse) were required for MS2 analysis, and a 120 s dynamic exclusion window was used. The top 10 MS2 scans were performed in the ion trap with CID fragmentation (Fusion Lumos: isolation window 0.5 Da, Rapid, NCE—35%, maximum injection time—50 ms, and AGC—1.5 × 10⁴; Eclipse: isolation window 0.5 Da, Turbo, NCE—35%, maximum injection time—50 ms, and AGC—1 × 10⁴). For data collected on the Fusion Lumos, an online real-time search algorithm (Orbiter) was used to trigger MS3 scans for quantification [81]. MS3 scans were collected in the Orbitrap using a resolution of 50,000, NCE of 55%, maximum injection time of 200 ms, and AGC of 3.0 × 10⁵. The closeout was set to two peptides per protein per fraction [81]. For data collected on the Eclipse, a real-time search was used to trigger MS3 scans for quantification [81]. MS3 scans were collected in the Orbitrap using a resolution of 50,000, NCE of 55%, maximum injection time of 250 ms, and AGC of 1.25 × 10⁵. The closeout was set to two peptides per protein per fraction [81].
Global Sample Liquid Chromatography Separation and Tandem Mass Spectrometry (LC-MS2) for Phosphoproteomics—Phosphorylation data were collected on an Orbitrap Eclipse mass spectrometer (ThermoFisher Scientific) coupled to a Proxeon EASY-nLC 1000 LC pump (ThermoFisher Scientific). Fractionated peptides were separated using a 120 min gradient at 525 nL/min on a 35 cm column (i.d. of 100 μm, Accucore of 2.6 μm, and 150 Å) packed in-house. A FAIMS device was enabled during data acquisition, with compensation voltages set to −40, −60, and −80 V for the first shot and −45 and −65 V for the second shot [74]. MS1 data were collected in the Orbitrap (120,000 resolution; maximum injection time set to auto; and AGC of 4 × 10⁵). Charge states between 2 and 5 were required for MS2 analysis, and a 120 s dynamic exclusion window was used. The cycle time was set to 1 s. MS2 scans were performed in the Orbitrap with HCD fragmentation (isolation window 0.5 Da; 50,000 resolution; NCE of 36%; maximum injection time of 300 ms; and AGC of 2 × 10⁵).
Global Sample Data Analysis—Raw files were converted to mzXML, and monoisotopic peaks were re-assigned using Monocle [76]. Searches were performed using the Comet search algorithm against a mouse database downloaded from Uniprot in May 2021. We used a 50 ppm precursor ion tolerance, 1.0005 fragment ion tolerance, and 0.4 fragment bin offset for MS2 scans collected in the ion trap, with 0.02 fragment ion tolerance and 0.00 fragment bin offset for MS2 scans collected in the Orbitrap. TMTPro on lysine residues and peptide N-termini (+304.2071 Da) and carbamidomethylation of cysteine residues (+57.0215 Da) were set as static modifications, while the oxidation of methionine residues (+15.9949 Da) was set as a variable modification. For phosphorylated peptide analysis, +79.9663 Da was set as a variable modification on serine, threonine, and tyrosine residues. Each run was filtered separately to 1% FDR on the peptide-spectrum match (PSM) level. Then, proteins were filtered to the target 1% FDR level across the entire combined dataset. Phosphorylation site localization was determined using the AScorePro algorithm [82]. For reporter ion quantification, a 0.003 Da window around the theoretical m/z of each reporter ion was scanned, and the most intense m/z was used. Reporter ion intensities were adjusted to correct for isotopic impurities of the different TMTPro reagents according to the manufacturer’s specifications. Peptides were filtered to include only those with a summed signal-to-noise (SN) value ≥ 170 or 180 across all TMT channels. An extra filter of an isolation specificity (“isolation purity”) of at least 0.5 in the MS1 isolation window was applied for the phosphorylated peptide analysis. For each protein or phosphorylation site, the filtered peptide TMTPro SN values were summed to generate protein or phosphorylation site quantification values. The signal-to-noise (S/N) measurements of peptides assigned to each protein were summed (for a given protein). These values were normalized so that the sum of the signal for all proteins in each channel was equivalent, thereby accounting for equal protein loading. The resulting normalization factors were used to normalize the phosphorylation sites, again accounting for equal protein loading. Data analysis was based on the CRYAB Non-TAC Proteome 1–12 and Phospho 1–2 raw spectrum files, and the CRYAB TAC Proteome 1–12 and Phospho 1–3 raw spectrum files can be found in the MassIVE database with the accession number MSV000097115.
Cardiomyocyte Isolation and IonOptix—Wild-type Cryab and CryabR123W mouse hearts were extracted, and single ventricular cardiomyocytes were isolated using the O’Connell and Simpson modification method and apparatus as previously described [83,84,85,86]. Single cardiomyocyte calcium transient and contraction dynamics were captured and analyzed using IonOptix equipment and software as previously described [85].
Data and Statistical Analysis—All bar plots, volcano plots, GO term plots, and heat maps were prepared in R v4.4.0 [54] using the following packages: ggplot2, dplyr, reshape2, ggpubr, tidyverse, RColorBrewer, ggrepel, clusterProfiler, DOSE, org.Mm.eg.db, enrichplot, ggupset, and pheatmap [87,88,89,90,91,92,93,94,95,96,97,98,99]. Global proteomic and phosphoproteomic data were analyzed using QIAGEN Ingenuity Pathway Analysis software (IPA) [55]. All statistical measurements are shown as mean ± standard deviation. All p-values were calculated using Student’s t-test for comparisons between 2 groups and two-way ANOVA for multi-group comparisons.

Author Contributions

Conceptualization, M.T.C., A.T. (Andres Thorkelsson) and C.C.; methodology, A.T. (Andres Thorkelsson), C.C. and A.T. (Audrey Tripp); software, A.T. (Andres Thorkelsson) and A.T. (Audrey Tripp); validation, A.T. (Andres Thorkelsson); formal analysis, A.T. (Andres Thorkelsson) and A.T. (Audrey Tripp); investigation, A.T. (Andres Thorkelsson), S.A.A., A.T. (Audrey Tripp) and C.C.; resources, M.T.C.; data curation, A.T. (Andres Thorkelsson); writing—original draft preparation, A.T. (Andres Thorkelsson); writing—review and editing, A.T. (Andres Thorkelsson) and M.T.C.; visualization, A.T. (Andres Thorkelsson); supervision, M.T.C. and J.G.; project administration, M.T.C.; funding acquisition, M.T.C. All authors have read and agreed to the published version of the manuscript.

Funding

This research received no external funding.

Institutional Review Board Statement

The animal study protocol was approved by the Institutional Animal Care and Use Committee of Tufts University (protocol code: B2023-10; approval date: 9 March 2023).

Informed Consent Statement

Not applicable.

Data Availability Statement

All proteomic data have been deposited in MassIVE under accession number MSV000097115.

Acknowledgments

We would like to acknowledge the Harvard ThermoFisher Scientific Center for assistance with Multiplexed Proteomics in our mass spectrometry experiments.

Conflicts of Interest

The authors declare no conflicts of interest. The funders had no role in the design of this study, the collection, analyses, or interpretation of the data, the writing of the manuscript, or the decision to publish the results.

References

  1. Maron, B.J. Hypertrophic cardiomyopathy: A systematic review. JAMA 2002, 287, 1308–1320. [Google Scholar] [CrossRef] [PubMed]
  2. Marian, A.J.; Roberts, R. The molecular genetic basis for hypertrophic cardiomyopathy. J. Mol. Cell. Cardiol. 2001, 33, 655–670. [Google Scholar] [CrossRef] [PubMed] [PubMed Central]
  3. Marian, A.J. Modifier genes for hypertrophic cardiomyopathy. Curr. Opin. Cardiol. 2002, 17, 242–252. [Google Scholar] [CrossRef] [PubMed] [PubMed Central]
  4. Geisterfer-Lowrance, A.A.; Kass, S.; Tanigawa, G.; Vosberg, H.P.; McKenna, W.; Seidman, C.E.; Seidman, J.G. A molecular basis for familial hypertrophic cardiomyopathy: A beta cardiac myosin heavy chain gene missense mutation. Cell 1990, 62, 999–1006. [Google Scholar] [CrossRef] [PubMed]
  5. Watkins, H.; MacRae, C.; Thierfelder, L.; Chou, Y.H.; Frenneaux, M.; McKenna, W.; Seidman, J.G.; Seidman, C.E. A disease locus for familial hypertrophic cardiomyopathy maps to chromosome 1q3. Nat. Genet. 1993, 3, 333–337. [Google Scholar] [CrossRef] [PubMed]
  6. Thierfelder, L.; Watkins, H.; MacRae, C.; Lamas, R.; McKenna, W.; Vosberg, H.P.; Seidman, J.G.; Seidman, C.E. Alpha-tropomyosin and cardiac troponin T mutations cause familial hypertrophic cardiomyopathy: A disease of the sarcomere. Cell 1994, 77, 701–712. [Google Scholar] [CrossRef] [PubMed]
  7. Seidman, C.E.; Seidman, J.G. Identifying sarcomere gene mutations in hypertrophic cardiomyopathy: A personal history. Circ. Res. 2011, 108, 743–750. [Google Scholar] [CrossRef] [PubMed] [PubMed Central]
  8. Watkins, H.; Ashrafian, H.; Redwood, C. Inherited cardiomyopathies. N. Engl. J. Med. 2011, 364, 1643–1656. [Google Scholar] [CrossRef] [PubMed]
  9. Maron, B.J.; Maron, M.S. Hypertrophic cardiomyopathy. Lancet 2013, 381, 242–255. [Google Scholar] [CrossRef] [PubMed]
  10. Maron, B.J.; Maron, M.S.; Maron, B.A.; Loscalzo, J. Moving Beyond the Sarcomere to Explain Heterogeneity in Hypertrophic Cardiomyopathy: JACC Review Topic of the Week. J. Am. Coll. Cardiol. 2019, 73, 1978–1986. [Google Scholar] [CrossRef] [PubMed] [PubMed Central]
  11. Ingles, J.; Burns, C.; Bagnall, R.D.; Lam, L.; Yeates, L.; Sarina, T.; Puranik, R.; Briffa, T.; Atherton, J.J.; Driscoll, T.; et al. Nonfamilial Hypertrophic Cardiomyopathy: Prevalence, Natural History, and Clinical Implications. Circ. Cardiovasc. Genet. 2017, 10, e001620. [Google Scholar] [CrossRef] [PubMed]
  12. Gerull, B.; Klaassen, S.; Brodehl, A. The genetic landscape of cardiomyopathies. Genet. Causes Card. Dis. 2019, 7, 45–91. [Google Scholar] [CrossRef]
  13. Vicart, P.; Caron, A.; Guicheney, P.; Li, Z.; Prévost, M.C.; Faure, A.; Chateau, D.; Chapon, F.; Tomé, F.; Dupret, J.M.; et al. A missense mutation in the alphaB-crystallin chaperone gene causes a desmin-related myopathy. Nat. Genet. 1998, 20, 92–95. [Google Scholar] [CrossRef] [PubMed]
  14. Kumarapeli, A.R.; Su, H.; Huang, W.; Tang, M.; Zheng, H.; Horak, K.M.; Li, M.; Wang, X. Alpha B-crystallin suppresses pressure overload cardiac hypertrophy. Circ. Res. 2008, 103, 1473–1482. [Google Scholar] [CrossRef] [PubMed] [PubMed Central]
  15. Bennardini, F.; Wrzosek, A.; Chiesi, M. Alpha B-crystallin in cardiac tissue. Assoc. Actin Desmin. Filaments. Circ. Res. 1992, 71, 288–294. [Google Scholar] [CrossRef] [PubMed]
  16. Nicholl, I.D.; Quinlan, R.A. Chaperone activity of alpha-crystallins modulates intermediate filament assembly. EMBO J. 1994, 13, 945–953. [Google Scholar] [CrossRef] [PubMed] [PubMed Central]
  17. Wang, K.; Spector, A. alpha-crystallin stabilizes actin filaments and prevents cytochalasin-induced depolymerization in a phosphorylation-dependent manner. Eur. J. Biochem. 1996, 242, 56–66. [Google Scholar] [CrossRef] [PubMed]
  18. Tannous, P.; Zhu, H.; Johnstone, J.L.; Shelton, J.M.; Rajasekaran, N.S.; Benjamin, I.J.; Nguyen, L.; Gerard, R.D.; Levine, B.; Rothermel, B.A.; et al. Autophagy is an adaptive response in desmin-related cardiomyopathy. Proc. Natl. Acad. Sci. USA 2008, 105, 9745–9750. [Google Scholar] [CrossRef] [PubMed] [PubMed Central]
  19. Bhuiyan, M.S.; Pattison, J.S.; Osinska, H.; James, J.; Gulick, J.; McLendon, P.M.; Hill, J.A.; Sadoshima, J.; Robbins, J. Enhanced autophagy ameliorates cardiac proteinopathy. J. Clin. Investig. 2013, 123, 5284–5297. [Google Scholar] [CrossRef] [PubMed] [PubMed Central]
  20. Mitra, A.; Basak, T.; Datta, K.; Naskar, S.; Sengupta, S.; Sarkar, S. Role of α-crystallin B as a regulatory switch in modulating cardiomyocyte apoptosis by mitochondria or endoplasmic reticulum during cardiac hypertrophy and myocardial infarction. Cell Death Dis. 2013, 4, e582. [Google Scholar] [CrossRef] [PubMed] [PubMed Central]
  21. Chis, R.; Sharma, P.; Bousette, N.; Miyake, T.; Wilson, A.; Backx, P.H.; Gramolini, A.O. α-Crystallin B prevents apoptosis after H2O2 exposure in mouse neonatal cardiomyocytes. Am. J. Physiol. Heart Circ. Physiol. 2012, 303, H967–H978. [Google Scholar] [CrossRef] [PubMed] [PubMed Central]
  22. Bagnéris, C.; Bateman, O.A.; Naylor, C.E.; Cronin, N.; Boelens, W.C.; Keep, N.H.; Slingsby, C. Crystal structures of alpha-crystallin domain dimers of alphaB-crystallin and Hsp20. J. Mol. Biol. 2009, 392, 1242–1252. [Google Scholar] [CrossRef] [PubMed]
  23. Laganowsky, A.; Benesch, J.L.; Landau, M.; Ding, L.; Sawaya, M.R.; Cascio, D.; Huang, Q.; Robinson, C.V.; Horwitz, J.; Eisenberg, D. Crystal structures of truncated alphaA and alphaB crystallins reveal structural mechanisms of polydispersity important for eye lens function. Protein Sci. 2010, 19, 1031–1043. [Google Scholar] [CrossRef] [PubMed] [PubMed Central]
  24. Mchaourab, H.S.; Godar, J.A.; Stewart, P.L. Structure and mechanism of protein stability sensors: Chaperone activity of small heat shock proteins. Biochemistry 2009, 48, 3828–3837. [Google Scholar] [CrossRef] [PubMed]
  25. Ito, H.; Okamoto, K.; Nakayama, H.; Isobe, T.; Kato, K. Phosphorylation of alphaB-crystallin in response to various types of stress. J. Biol. Chem. 1997, 272, 29934–29941. [Google Scholar] [CrossRef] [PubMed]
  26. Sacconi, S.; Féasson, L.; Antoine, J.C.; Pécheux, C.; Bernard, R.; Cobo, A.M.; Casarin, A.; Salviati, L.; Desnuelle, C.; Urtizberea, A. A novel CRYAB mutation resulting in multisystemic disease. Neuromuscul. Disord. 2012, 22, 66–72. [Google Scholar] [CrossRef] [PubMed]
  27. Brodehl, A.; Gaertner-Rommel, A.; Klauke, B.; Grewe, S.A.; Schirmer, I.; Peterschröder, A.; Faber, L.; Vorgerd, M.; Gummert, J.; Anselmetti, D.; et al. The novel αB-crystallin (CRYAB) mutation p.D109G causes restrictive cardiomyopathy. Hum. Mutat. 2017, 38, 947–952. [Google Scholar] [CrossRef] [PubMed]
  28. Van Spaendonck-Zwarts, K.Y.; van Hessem, L.; Jongbloed, J.D.; de Walle, H.E.; Capetanaki, Y.; van der Kooi, A.J.; van Langen, I.M.; van den Berg, M.P.; van Tintelen, J.P. Desmin-related myopathy. Clin. Genet. 2011, 80, 354–366. [Google Scholar] [CrossRef] [PubMed]
  29. Wang, X.; Osinska, H.; Klevitsky, R.; Gerdes, A.M.; Nieman, M.; Lorenz, J.; Hewett, T.; Robbins, J. Expression of R120G-alphaB-crystallin causes aberrant desmin and alphaB-crystallin aggregation and cardiomyopathy in mice. Circ. Res. 2001, 89, 84–91. [Google Scholar] [CrossRef] [PubMed]
  30. Bova, M.P.; Yaron, O.; Huang, Q.; Ding, L.; Haley, D.A.; Stewart, P.L.; Horwitz, J. Mutation R120G in alphaB-crystallin, which is linked to a desmin-related myopathy, results in an irregular structure and defective chaperone-like function. Proc. Natl. Acad. Sci. USA 1999, 96, 6137–6142. [Google Scholar] [CrossRef] [PubMed] [PubMed Central]
  31. Maron, B.J.; Rowin, E.J.; Arkun, K.; Rastegar, H.; Larson, A.M.; Maron, M.S.; Chin, M.T. Adult Monozygotic Twins With Hypertrophic Cardiomyopathy and Identical Disease Expression and Clinical Course. Am. J. Cardiol. 2020, 127, 135–138. [Google Scholar] [CrossRef] [PubMed]
  32. Chou, C.; Martin, G.L.; Perera, G.; Awata, J.; Larson, A.; Blanton, R.; Chin, M.T. A novel αB-crystallin R123W variant drives hypertrophic cardiomyopathy by promoting maladaptive calcium-dependent signal transduction. Front. Cardiovasc. Med. 2023, 10, 1223244. [Google Scholar] [CrossRef] [PubMed] [PubMed Central]
  33. Somee, L.R.; Barati, A.; Shahsavani, M.B.; Hoshino, M.; Hong, J.; Kumar, A.; Moosavi-Movahedi, A.A.; Amanlou, M.; Yousefi, R. Understanding the structural and functional changes and biochemical pathomechanism of the cardiomyopathy-associated p.R123W mutation in human αB-crystallin. Biochim. Biophys Acta Gen. Subj. 2024, 1868, 130579. [Google Scholar] [CrossRef] [PubMed]
  34. Jumper, J.; Evans, R.; Pritzel, A.; Green, T.; Figurnov, M.; Ronneberger, O.; Tunyasuvunakool, K.; Bates, R.; Žídek, A.; Potapenko, A.; et al. Highly accurate protein structure prediction with AlphaFold. Nature 2021, 596, 583–589. [Google Scholar] [CrossRef] [PubMed] [PubMed Central]
  35. Evans, R.; O’Neill, M.; Pritzel, A.; Antropova, N.; Senior, A.; Green, T.; Žídek, A.; Bates, R.; Blackwell, S.; Yim, J.; et al. Protein complex prediction with AlphaFold-Multimer. bioRxiv 2021. [Google Scholar] [CrossRef]
  36. Varadi, M.; Bertoni, D.; Magana, P.; Paramval, U.; Pidruchna, I.; Radhakrishnan, M.; Tsenkov, M.; Nair, S.; Mirdita, M.; Yeo, J.; et al. AlphaFold Protein Structure Database in 2024: Providing structure coverage for over 214 million protein sequences. Nucleic Acids Res. 2024, 52, D368–D375. [Google Scholar] [CrossRef] [PubMed] [PubMed Central]
  37. Varadi, M.; Anyango, S.; Deshpande, M.; Nair, S.; Natassia, C.; Yordanova, G.; Yuan, D.; Stroe, O.; Wood, G.; Laydon, A.; et al. AlphaFold Protein Structure Database: Massively expanding the structural coverage of protein-sequence space with high-accuracy models. Nucleic Acids Res. 2022, 50, D439–D444. [Google Scholar] [CrossRef] [PubMed] [PubMed Central]
  38. Meng, E.C.; Goddard, T.D.; Pettersen, E.F.; Couch, G.S.; Pearson, Z.J.; Morris, J.H.; Ferrin, T.E. UCSF ChimeraX: Tools for structure building and analysis. Protein Sci. 2023, 32, e4792. [Google Scholar] [CrossRef] [PubMed] [PubMed Central]
  39. Thorkelsson, A.; Chin, M.T. Role of the Alpha-B-Crystallin Protein in Cardiomyopathic Disease. Int. J. Mol. Sci. 2024, 25, 2826. [Google Scholar] [CrossRef] [PubMed] [PubMed Central]
  40. Pope, R.K.; Pestonjamasp, K.N.; Smith, K.P.; Wulfkuhle, J.D.; Strassel, C.P.; Lawrence, J.B.; Luna, E.J. Cloning, characterization, and chromosomal localization of human superillin (SVIL). Genomics 1998, 52, 342–351. [Google Scholar] [CrossRef] [PubMed]
  41. Maul, R.S.; Song, Y.; Amann, K.J.; Gerbin, S.C.; Pollard, T.D.; Chang, D.D. EPLIN regulates actin dynamics by cross-linking and stabilizing filaments. J. Cell Biol. 2003, 160, 399–407. [Google Scholar] [CrossRef] [PubMed] [PubMed Central]
  42. Filippakopoulos, P.; Picaud, S.; Mangos, M.; Keates, T.; Lambert, J.P.; Barsyte-Lovejoy, D.; Felletar, I.; Volkmer, R.; Müller, S.; Pawson, T.; et al. Histone recognition and large-scale structural analysis of the human bromodomain family. Cell 2012, 149, 214–231. [Google Scholar] [CrossRef] [PubMed] [PubMed Central]
  43. Oltion, K.; Carelli, J.D.; Yang, T.; See, S.K.; Wang, H.Y.; Kampmann, M.; Taunton, J. An E3 ligase network engages GCN1 to promote the degradation of translation factors on stalled ribosomes. Cell 2023, 186, 346–362.e17. [Google Scholar] [CrossRef] [PubMed] [PubMed Central]
  44. Li, X.; Yang, L.; Chen, S.; Zheng, J.; Zhang, H.; Ren, L. Multiple Roles of TRIM21 in Virus Infection. Int. J. Mol. Sci. 2023, 24, 1683. [Google Scholar] [CrossRef] [PubMed] [PubMed Central]
  45. Asher, G.; Tsvetkov, P.; Kahana, C.; Shaul, Y. A mechanism of ubiquitin-independent proteasomal degradation of the tumor suppressors p53 and p73. Genes Dev. 2005, 19, 316–321. [Google Scholar] [CrossRef] [PubMed] [PubMed Central]
  46. Burger, A.; Berendes, R.; Liemann, S.; Benz, J.; Hofmann, A.; Göttig, P.; Huber, R.; Gerke, V.; Thiel, C.; Römisch, J.; et al. The crystal structure and ion channel activity of human annexin II, a peripheral membrane protein. J. Mol. Biol. 1996, 257, 839–847. [Google Scholar] [CrossRef] [PubMed]
  47. Barefield, D.; Kumar, M.; Gorham, J.; Seidman, J.G.; Seidman, C.E.; de Tombe, P.P.; Sadayappan, S. Haploinsufficiency of MYBPC3 exacerbates the development of hypertrophic cardiomyopathy in heterozygous mice. J. Mol. Cell. Cardiol. 2015, 79, 234–243. [Google Scholar] [CrossRef] [PubMed] [PubMed Central]
  48. Vikstrom, K.L.; Factor, S.M.; Leinwand, L.A. Mice expressing mutant myosin heavy chains are a model for familial hypertrophic cardiomyopathy. Mol. Med. 1996, 2, 556–567. [Google Scholar] [CrossRef] [PubMed] [PubMed Central]
  49. Ertz-Berger, B.R.; He, H.; Dowell, C.; Factor, S.M.; Haim, T.E.; Nunez, S.; Schwartz, S.D.; Ingwall, J.S.; Tardiff, J.C. Changes in the chemical and dynamic properties of cardiac troponin T cause discrete cardiomyopathies in transgenic mice. Proc. Natl. Acad. Sci. USA 2005, 102, 18219–18224. [Google Scholar] [CrossRef] [PubMed] [PubMed Central]
  50. Lowey, S.; Lesko, L.M.; Rovner, A.S.; Hodges, A.R.; White, S.L.; Low, R.B.; Rincon, M.; Gulick, J.; Robbins, J. Functional effects of the hypertrophic cardiomyopathy R403Q mutation are different in an alpha- or beta-myosin heavy chain backbone. J. Biol. Chem. 2008, 283, 20579–20589. [Google Scholar] [CrossRef] [PubMed] [PubMed Central]
  51. Vakrou, S.; Fukunaga, R.; Foster, D.B.; Sorensen, L.; Liu, Y.; Guan, Y.; Woldemichael, K.; Pineda-Reyes, R.; Liu, T.; Tardiff, J.C.; et al. Allele-specific differences in transcriptome, miRNome, and mitochondrial function in two hypertrophic cardiomyopathy mouse models. JCI Insight 2018, 3, e94493. [Google Scholar] [CrossRef] [PubMed] [PubMed Central]
  52. Marstrand, P.; Han, L.; Day, S.M.; Olivotto, I.; Ashley, E.A.; Michels, M.; Pereira, A.C.; Wittekind, S.G.; Helms, A.; Saberi, S.; et al. Hypertrophic Cardiomyopathy with Left Ventricular Systolic Dysfunction: Insights From the SHaRe Registry. Circulation 2020, 141, 1371–1383. [Google Scholar] [CrossRef] [PubMed] [PubMed Central]
  53. Beltrami, M.; Bartolini, S.; Pastore, M.C.; Milli, M.; Cameli, M. Relationship between measures of left ventricular systolic and diastolic dysfunction and clinical and biomarker status in patients with hypertrophic cardiomyopathy. Arch. Cardiovasc. Dis. 2022, 115, 598–609. [Google Scholar] [CrossRef] [PubMed]
  54. R Core Team. R: A Language and Environment for Statistical Computing; R Foundation for Statistical Computing: Vienna, Austria, 2024; Available online: https://www.R-project.org/ (accessed on 1 December 2023).
  55. Krämer, A.; Green, J.; Pollard, J., Jr.; Tugendreich, S. Causal analysis approaches in Ingenuity Pathway Analysis. Bioinformatics 2014, 30, 523–530. [Google Scholar] [CrossRef] [PubMed] [PubMed Central]
  56. Perrino, B.A. Regulation of calcineurin phosphatase activity by its autoinhibitory domain. Arch. Biochem. Biophys. 1999, 372, 159–165. [Google Scholar] [CrossRef] [PubMed]
  57. Chou, C.; Chin, M.T. Pathogenic Mechanisms of Hypertrophic Cardiomyopathy beyond Sarcomere Dysfunction. Int. J. Mol. Sci. 2021, 22, 8933. [Google Scholar] [CrossRef] [PubMed] [PubMed Central]
  58. Golenhofen, N.; Ness, W.; Koob, R.; Htun, P.; Schaper, W.; Drenckhahn, D. Ischemia-induced phosphorylation and translocation of stress protein alpha B-crystallin to Z lines of myocardium. Am. J. Physiol. 1998, 274, H1457–H1464. [Google Scholar] [CrossRef] [PubMed]
  59. Maksimiuk, M.; Sobiborowicz, A.; Tuzimek, A.; Deptała, A.; Czerw, A.; Badowska-Kozakiewicz, A.M. αB-crystallin as a promising target in pathological conditions—A review. Ann. Agric. Environ. Med. 2020, 27, 326–334. [Google Scholar] [CrossRef] [PubMed]
  60. Head, M.W.; Hurwitz, L.; Kegel, K.; Goldman, J.E. AlphaB-crystallin regulates intermediate filament organization in situ. Neuroreport 2000, 11, 361–365. [Google Scholar] [CrossRef] [PubMed]
  61. Rothbard, J.B.; Kurnellas, M.P.; Brownell, S.; Adams, C.M.; Su, L.; Axtell, R.C.; Chen, R.; Fathman, C.G.; Robinson, W.H.; Steinman, L. Therapeutic effects of systemic administration of chaperone αB-crystallin associated with binding proinflammatory plasma proteins. J. Biol. Chem. 2012, 287, 9708–9721. [Google Scholar] [CrossRef] [PubMed] [PubMed Central]
  62. Xu, W.; Guo, Y.; Huang, Z.; Zhao, H.; Zhou, M.; Huang, Y.; Wen, D.; Song, J.; Zhu, Z.; Sun, M.; et al. Small heat shock protein CRYAB inhibits intestinal mucosal inflammatory responses and protects barrier integrity through suppressing IKKβ activity. Mucosal. Immunol. 2019, 12, 1291–1303. [Google Scholar] [CrossRef] [PubMed]
  63. Arac, A.; Brownell, S.E.; Rothbard, J.B.; Chen, C.; Ko, R.M.; Pereira, M.P.; Albers, G.W.; Steinman, L.; Steinberg, G.K. Systemic augmentation of alphaB-crystallin provides therapeutic benefit twelve hours post-stroke onset via immune modulation. Proc. Natl. Acad. Sci. USA 2011, 108, 13287–13292. [Google Scholar] [CrossRef] [PubMed] [PubMed Central]
  64. Velotta, J.B.; Kimura, N.; Chang, S.H.; Chung, J.; Itoh, S.; Rothbard, J.; Yang, P.C.; Steinman, L.; Robbins, R.C.; Fischbein, M.P. αB-crystallin improves murine cardiac function and attenuates apoptosis in human endothelial cells exposed to ischemia-reperfusion. Ann. Thorac. Surg. 2011, 91, 1907–1913. [Google Scholar] [CrossRef] [PubMed]
  65. Helms, A.S.; Alvarado, F.J.; Yob, J.; Tang, V.T.; Pagani, F.; Russell, M.W.; Valdivia, H.H.; Day, S.M. Genotype-Dependent and -Independent Calcium Signaling Dysregulation in Human Hypertrophic Cardiomyopathy. Circulation 2016, 134, 1738–1748. [Google Scholar] [CrossRef] [PubMed] [PubMed Central]
  66. Coppini, R.; Ferrantini, C.; Mugelli, A.; Poggesi, C.; Cerbai, E. Altered Ca2+ and Na+ Homeostasis in Human Hypertrophic Cardiomyopathy: Implications for Arrhythmogenesis. Front. Physiol. 2018, 9, 1391. [Google Scholar] [CrossRef] [PubMed] [PubMed Central]
  67. Wilkins, B.J.; Dai, Y.S.; Bueno, O.F.; Parsons, S.A.; Xu, J.; Plank, D.M.; Jones, F.; Kimball, T.R.; Molkentin, J.D. Calcineurin/NFAT coupling participates in pathological, but not physiological, cardiac hypertrophy. Circ. Res. 2004, 94, 110–118. [Google Scholar] [CrossRef] [PubMed]
  68. Golden, R.J.; Chen, B.; Li, T.; Braun, J.; Manjunath, H.; Chen, X.; Wu, J.; Schmid, V.; Chang, T.C.; Kopp, F.; et al. An Argonaute phosphorylation cycle promotes microRNA-mediated silencing. Nature 2017, 542, 197–202. [Google Scholar] [CrossRef] [PubMed] [PubMed Central]
  69. Gibson, D.G.; Young, L.; Chuang, R.Y.; Venter, J.C.; Hutchison, C.A., 3rd; Smith, H.O. Enzymatic assembly of DNA molecules up to several hundred kilobases. Nat. Methods 2009, 6, 343–345. [Google Scholar] [CrossRef] [PubMed]
  70. Froger, A.; Hall, J.E. Transformation of plasmid DNA into E. coli using the heat shock method. J. Vis. Exp. 2007, 6, 253. [Google Scholar] [CrossRef] [PubMed] [PubMed Central]
  71. Dull, T.; Zufferey, R.; Kelly, M.; Mandel, R.J.; Nguyen, M.; Trono, D.; Naldini, L. A third-generation lentivirus vector with a conditional packaging system. J. Virol. 1998, 72, 8463–8471. [Google Scholar] [CrossRef]
  72. Richards, D.A.; Aronovitz, M.J.; Calamaras, T.D.; Tam, K.; Martin, G.L.; Liu, P.; Bowditch, H.K.; Zhang, P.; Huggins, G.S.; Blanton, R.M. Distinct Phenotypes Induced by Three Degrees of Transverse Aortic Constriction in Mice. Sci. Rep. 2019, 9, 5844. [Google Scholar] [CrossRef] [PubMed] [PubMed Central]
  73. Hughes, C.S.; Moggridge, S.; Müller, T.; Sorensen, P.H.; Morin, G.B.; Krijgsveld, J. Single-pot, solid-phase-enhanced sample preparation for proteomics experiments. Nat. Protoc. 2019, 14, 68–85. [Google Scholar] [CrossRef] [PubMed]
  74. Schweppe, D.K.; Prasad, S.; Belford, M.W.; Navarrete-Perea, J.; Bailey, D.J.; Huguet, R.; Jedrychowski, M.P.; Rad, R.; McAlister, G.; Abbatiello, S.E.; et al. Characterization and Optimization of Multiplexed Quantitative Analyses Using High-Field Asymmetric-Waveform Ion Mobility Mass Spectrometry. Anal. Chem. 2019, 91, 4010–4016. [Google Scholar] [CrossRef] [PubMed] [PubMed Central]
  75. Elias, J.E.; Gygi, S.P. Target-decoy search strategy for increased confidence in large-scale protein identifications by mass spectrometry. Nat. Methods 2007, 4, 207–214. [Google Scholar] [CrossRef] [PubMed]
  76. Rad, R.; Li, J.; Mintseris, J.; O’Connell, J.; Gygi, S.P.; Schweppe, D.K. Improved Monoisotopic Mass Estimation for Deeper Proteome Coverage. J. Proteome Res. 2021, 20, 591–598. [Google Scholar] [CrossRef] [PubMed]
  77. Eng, J.K.; Jahan, T.A.; Hoopmann, M.R. Comet: An open-source MS/MS sequence database search tool. Proteomics 2013, 13, 22–24. [Google Scholar] [CrossRef] [PubMed]
  78. Huttlin, E.L.; Jedrychowski, M.P.; Elias, J.E.; Goswami, T.; Rad, R.; Beausoleil, S.A.; Villén, J.; Haas, W.; Sowa, M.E.; Gygi, S.P. A tissue-specific atlas of mouse protein phosphorylation and expression. Cell 2010, 143, 1174–1189. [Google Scholar] [CrossRef] [PubMed] [PubMed Central]
  79. Navarrete-Perea, J.; Yu, Q.; Gygi, S.P.; Paulo, J.A. Streamlined Tandem Mass Tag (SL-TMT) Protocol: An Efficient Strategy for Quantitative (Phospho)proteome Profiling Using Tandem Mass Tag-Synchronous Precursor Selection-MS3. J. Proteome Res. 2018, 17, 2226–2236. [Google Scholar] [CrossRef] [PubMed] [PubMed Central]
  80. Li, J.; Cai, Z.; Bomgarden, R.D.; Pike, I.; Kuhn, K.; Rogers, J.C.; Roberts, T.M.; Gygi, S.P.; Paulo, J.A. TMTpro-18plex: The Expanded and Complete Set of TMTpro Reagents for Sample Multiplexing. J. Proteome Res. 2021, 20, 2964–2972. [Google Scholar] [CrossRef] [PubMed] [PubMed Central]
  81. Schweppe, D.K.; Eng, J.K.; Yu, Q.; Bailey, D.; Rad, R.; Navarrete-Perea, J.; Huttlin, E.L.; Erickson, B.K.; Paulo, J.A.; Gygi, S.P. Full-Featured, Real-Time Database Searching Platform Enables Fast and Accurate Multiplexed Quantitative Proteomics. J. Proteome Res. 2020, 19, 2026–2034. [Google Scholar] [CrossRef] [PubMed] [PubMed Central]
  82. Gassaway, B.M.; Li, J.; Rad, R.; Mintseris, J.; Mohler, K.; Levy, T.; Aguiar, M.; Beausoleil, S.A.; Paulo, J.A.; Rinehart, J.; et al. A multi-purpose, regenerable, proteome-scale, human phosphoserine resource for phosphoproteomics. Nat. Methods 2022, 19, 1371–1375. [Google Scholar] [CrossRef] [PubMed] [PubMed Central]
  83. Sambrano, G.R.; Fraser, I.; Han, H.; Ni, Y.; O’Connell, T.; Yan, Z.; Stull, J.T. Navigating the signalling network in mouse cardiac myocytes. Nature 2002, 420, 712–714. [Google Scholar] [CrossRef]
  84. Xiang, F.; Sakata, Y.; Cui, L.; Youngblood, J.M.; Nakagami, H.; Liao, J.K.; Liao, R.; Chin, M.T. Transcription factor CHF1/Hey2 suppresses cardiac hypertrophy through an inhibitory interaction with GATA4. Am. J. Physiol. Heart Circ. Physiol. 2006, 290, H1997–H2006. [Google Scholar] [CrossRef]
  85. Liu, Y.; Korte, F.S.; Moussavi-Harami, F.; Yu, M.; Razumova, M.; Regnier, M.; Chin, M.T. Transcription factor CHF1/Hey2 regulates EC coupling and heart failure in mice through regulation of FKBP12.6. Am. J. Physiol. Heart Circ. Physiol. 2012, 302, H1860–H1870. [Google Scholar] [CrossRef] [PubMed]
  86. O’Connell, T.D.; Rodrigo, M.C.; Simpson, P.C. Isolation and culture of adult mouse cardiac myocytes. Methods Mol. Biol. 2007, 357, 271–296. [Google Scholar] [CrossRef] [PubMed]
  87. Hadley, W. Ggplot2: Elegant Graphics for Data Analysis; Springer: New York, NY, USA, 2016. [Google Scholar]
  88. Wickham, H.; François, R.; Henry, L.; Müller, K.; Vaughan, D. Dplyr: A Grammar of Data Manipulation. R package Version 1.1.4. 2023. Available online: https://CRAN.R-project.org/package=dplyr (accessed on 1 December 2023).
  89. Hadley, W. Reshaping Data with the reshape Package. J. Stat. Softw. 2007, 21, 1–20. [Google Scholar]
  90. Kassambara, A. Ggpubr: ‘Ggplot2’ Based Publication Ready Plots. R Package Version 0.6.0. 2023. Available online: https://CRAN.R-project.org/package=ggpubr (accessed on 1 December 2023).
  91. Wickham, H.; Averick, M.; Bryan, J.; Chang, W.; McGowan, L.D.A.; François, R.; Grolemund, G.; Hayes, A.; Henry, L.; Hester, J.; et al. Welcome to the tidyverse. J. Open Source Softw. 2019, 4, 1686. [Google Scholar] [CrossRef]
  92. Neuwirth, E. _RColorBrewer: ColorBrewer Palettes. R Package Version 1.1-3. 2022. Available online: https://CRAN.R-project.org/package=RColorBrewer (accessed on 1 December 2023).
  93. Slowikowski, K. Ggrepel: Automatically Position Non-Overlapping Text Labels with ‘ggplot2’. R Package Version 0.9.6. 2024. Available online: https://CRAN.R-project.org/package=ggrepel (accessed on 1 December 2023).
  94. Xu, S.; Hu, E.; Cai, Y.; Xie, Z.; Luo, X.; Zhan, L.; Tang, W.; Wang, Q.; Liu, B.; Wang, R.; et al. Using clusterProfiler to characterize multiomics data. Nat. Protoc. 2024, 19, 3292–3320. [Google Scholar] [CrossRef] [PubMed]
  95. Yu, G.; Wang, L.G.; Yan, G.R.; He, Q.Y. DOSE: An R/Bioconductor package for disease ontology semantic and enrichment analysis. Bioinformatics 2015, 31, 608–609. [Google Scholar] [CrossRef] [PubMed]
  96. Carlson, M. org.Mm.eg.db: Genome Wide Annotation for Mouse. R Package Version 3.19.1. 2024. Available online: https://bioconductor.org/packages/release/data/annotation/html/org.Mm.eg.db.html (accessed on 1 December 2023).
  97. Yu, G. Enrichplot: Visualization of Functional Enrichment Result. R Package Version 1.24.4. 2024. Available online: https://yulab-smu.top/biomedical-knowledge-mining-book/ (accessed on 1 December 2023).
  98. Ahlmann-Eltze, C. Ggupset: Combination Matrix Axis for ‘ggplot2’ to Create ‘UpSet’ Plots. R Package Version 0.4.0. 2024. Available online: https://CRAN.R-project.org/package=ggupset (accessed on 1 December 2023).
  99. Kolde, R. Pheatmap: Pretty Heatmaps. R Package Version 1.0.12. 2019. Available online: https://CRAN.R-project.org/package=pheatmap (accessed on 1 December 2023).
Figure 1. Calcineurin activity based on the calculated absorbance, representing the phosphate released by calcineurin for negative control (blue) H9C2 cells and H9C2 cells expressing FLAG-tagged wild-type (pink), D109G (red), R120G (yellow), and R123W CRYAB (green). CRYABR123W shows a significant increase in calcineurin activity compared to the other CRYAB variants.
Ijms 26 02383 g001
Figure 2. Bar plots of IonOptix analysis of isolated cardiomyocytes from our wild-type CRYAB (blue) and CRYABR123W (red) mouse models. (a) IonOptix Sin Exp Tau, a measure of calcium reuptake, for wild-type CRYAB and CRYABR123W is shown, with a significantly increased value in CRYABR123W, which suggests impaired calcium reuptake and myocyte relaxation. (b) IonOptix baseline sarcomere length, demonstrating that CRYABR123W myocytes have significantly increased baseline sarcomere length compared to the wild type. * p < 0.05, ** p < 0.01.
Ijms 26 02383 g002
Figure 3. AlphaFold structures visualized in ChimeraX of CRYAB proteins (red) tagged with a triple FLAG tag (green) and mutated residues (yellow with white label): (a) wild-type CRYAB with N-terminal FLAG tag; (b) CRYABR123W with N-terminal FLAG tag; (c) wild-type CRYAB with C-terminal FLAG tag; and (d) CRYABR123W with C-terminal FLAG tag.
Ijms 26 02383 g003
Figure 4. AlphaFold structures visualized in ChimeraX of CRYAB proteins (red) interacting with calcineurin (blue), with labeling of the predicted interacting amino acids of CRYAB (white) and calcineurin (pink) and the mutated CRYAB residue (yellow with white label): (a) wild-type CRYAB binding well at the NFAT binding site of calcineurin; (b) CRYABD109G binding poorly at the NFAT binding site of calcineurin; (c) CRYABR120G binding poorly at the NFAT binding site of calcineurin; and (d) CRYABR123W binding well at the autoinhibitory domain of calcineurin.
Ijms 26 02383 g004
Figure 5. (A) Volcano plots depicting mass spectrometry data from co-immunoprecipitation of lysate from H9C2 cells expressing FLAG-tagged wild-type CRYAB, CRYABR120G, and CRYABR123W. Data are labeled with the corresponding protein and as having decreased binding (blue), no significant change (grey), or increased binding (red). (a) Volcano plot comparing wild-type CRYAB to CRYABR120G, showing significant increase in binding with minimal decrease. (b) Volcano plot comparing wild-type CRYAB to CRYABR123W, showing significant decreases and increases in protein binding, comparatively. (B) Volcano plot depicting mass spectrometry data from co-immunoprecipitation of lysate from H9C2 cells expressing FLAG-tagged CRYABR120G and CRYABR123W. Data are labeled with the corresponding protein and as having decreased binding (blue), no significant change (grey), or increased binding (red). The comparison between CRYABR120G and CRYABR123W shows that CRYABR123W has distinct changes in protein–protein interactions. For all analyses, significance was based on a protein having both a p-value less than 0.05 and fold change greater than 2 graphed as horizontal −log10(p-value) and vertical log2(FC) dotted lines respectively.
Ijms 26 02383 g005
Figure 6. Mass spectrometry data from wild-type CRYAB and CRYABR123W mouse heart extracts without (Early Non-TAC) or with (Late TAC) transverse aortic constriction. (a) Venn diagram depicting the protein (blue) and phosphoprotein (green) breakdown in mice without transverse aortic constriction. (b) Volcano plot showing a lack of significant changes in protein expression in mice without transverse aortic constriction. (c) Volcano plot showing only two significant changes in phosphoprotein expression in mice without transverse aortic constriction. (d) Venn diagram depicting protein (blue) and phosphoprotein (green) breakdown in mice with transverse aortic constriction. (e) Volcano plot showing significant changes in protein expression in mice with transverse aortic constriction. (f) Volcano plot showing significant changes in phosphoprotein expression in mice with transverse aortic constriction. For all analyses, significance was based on a protein having both a p-value less than 0.05 and fold change greater than 2 graphed as horizontal −log10(p-value) and vertical log2(FC) dotted lines respectively.
Ijms 26 02383 g006
Figure 7. GO term analysis comparing mass spectrometry data from wild-type CRYAB and CRYABR123W mouse heart extracts following transverse aortic constriction. GO term analysis showed significant association with cytoskeletal pathways.
Ijms 26 02383 g007
Figure 8. (A) Heatmaps based on genes from oxidative phosphorylation (a,b), mitochondrial dysfunction (c,d), and mTOR signaling (e,f) pathways identified by IPA using mass spectrometry data from wild-type CRYAB (purple) and CRYABR123W (green) mouse heart extracts with or without transverse aortic constriction. (a,c,e) Heatmaps showing results from early-stage disease in mice without transverse aortic constriction with poor clustering and gene expression differentiation. (b,d,f) Heatmaps showing results from late-stage disease in mice with transverse aortic constriction with improved clustering and gene expression differentiation. (B) Heatmaps based on genes from the role of NFAT in hypertrophic cardiomyopathy (a,b) and cardiac conduction (c,d) pathways identified by IPA using mass spectrometry data from wild-type CRYAB (purple) and CRYABR123W (green) mouse heart extracts with or without transverse aortic constriction. (a,c) Heatmaps showing results from early-stage disease in mice without transverse aortic constriction with poor clustering and gene expression differentiation. (b,d) Heatmaps showing results from late-stage disease in mice with transverse aortic constriction with improved clustering and gene expression differentiation. (C) Heatmaps based on genes from granzyme signaling (a,b) and neutrophil trap (c,d) pathways identified by IPA using mass spectrometry data from wild-type CRYAB (purple) and CRYABR123W (green) mouse heart extracts with or without transaortic constriction. (a,c) Heatmaps showing results from early-stage disease in mice without transverse aortic constriction with poor clustering and gene expression differentiation. (b,d) Heatmaps showing results from late-stage disease in mice with transverse aortic constriction with improved clustering and gene expression differentiation.
Ijms 26 02383 g008aIjms 26 02383 g008bIjms 26 02383 g008c
Table 1. Common upstream regulators between co-immunoprecipitation and global proteomics predicted to be involved in the changes in protein expression, based on our mass spectrometry data, for wild-type CRYAB compared to CRYABR123W with and without transverse aortic constriction.
EnzymesKinasesG Protein-Coupled ReceptorsPhosphatasesIon Channels
DDX3X
DHX36
EEF2K
EGFR
ADORA2A
ADRB1
PPP3CA
PTP4A1
KCNJ2
MCOLN1
FAAHEIF2AK4AGTR2 SCN1B
HRASFLT1CX3CR1
KRASINSRGPR174
POLGIPMKMC5R
MAP2K6
MAP3K12
MAPK14
MKNK1
MOS
PRKAG3
PRKCZ
PTK2
RAF1
RET
ROCK1
ROCK2
TGFBR2
TK1
TTN
Disclaimer/Publisher’s Note: The statements, opinions and data contained in all publications are solely those of the individual author(s) and contributor(s) and not of MDPI and/or the editor(s). MDPI and/or the editor(s) disclaim responsibility for any injury to people or property resulting from any ideas, methods, instructions or products referred to in the content.

