
A Comparison of Single- and Multiparametric MRI Models for Differentiation of Recurrent Glioblastoma from Treatment-Related Change

 ,
,  , ,
, ,
Abstract
:1. Introduction
2. Materials and Methods
2.1. Patients
2.2. Acquisition and Postprocessing
2.2.1. MRI
2.2.2. Imaging Protocol and Sequence Details
2.2.3. Postprocessing
2.3. Statistical Analysis
3. Results
3.1. Patients
3.2. ADC Results
3.3. CBV Results
3.4. Multiparametric Assessment
3.5. Testing the Multiparametric Model
4. Discussion
5. Conclusions
Author Contributions
Funding
Institutional Review Board Statement
Informed Consent Statement
Data Availability Statement
Conflicts of Interest
References
- Alexander, B.M.; Cloughesy, T.F. Adult Glioblastoma. J. Clin. Oncol. 2017, 35, 2402–2409. [Google Scholar] [CrossRef] [PubMed]
- Ohgaki, H.; Kleihues, P. The definition of primary and secondary glioblastoma. Clin. Cancer Res. 2013, 19, 764–772. [Google Scholar] [CrossRef] [PubMed] [Green Version]
- Ostrom, Q.T.; Gittleman, H.; Fulop, J.; Liu, M.; Blanda, R.; Kromer, C.; Wolinsky, Y.; Kruchko, C.; Barnholtz-Sloan, J.S. CBTRUS Statistical Report: Primary Brain and Central Nervous System Tumors Diagnosed in the United States in 2008–2012. Neuro Oncol. 2015, 17 (Suppl. 4), iv1–iv62. [Google Scholar] [CrossRef] [PubMed]
- Lukas, R.V.; Wainwright, D.A.; Ladomersky, E.; Sachdev, S.; Sonabend, A.M.; Stupp, R. Newly Diagnosed Glioblastoma: A Review on Clinical Management. Oncology 2019, 33, 91–100. [Google Scholar] [PubMed]
- Hofmann, S.; Schmidt, M.A.; Weissmann, T.; Eyüpoglu, I.; Strnad, A.; Semrau, S.; Fietkau, R.; Putz, F.; Lettmaier, S. Evidence for improved survival with bevacizumab treatment in recurrent high-grade gliomas: A retrospective study with (“pseudo-randomized”) treatment allocation by the health insurance provider. J. Neuro-Oncol. 2020, 148, 373–379. [Google Scholar] [CrossRef] [PubMed]
- Stupp, R.; Mason, W.P.; van den Bent, M.J.; Weller, M.; Fisher, B.; Taphoorn, M.J.; Belanger, K.; Brandes, A.A.; Marosi, C.; Bogdahn, U.; et al. Radiotherapy plus concomitant and adjuvant temozolomide for glioblastoma. N. Engl. J. Med. 2005, 352, 987–996. [Google Scholar] [CrossRef]
- Davis, M.E. Glioblastoma: Overview of Disease and Treatment. Clin. J. Oncol. Nurs. 2016, 20, S2–S8. [Google Scholar] [CrossRef] [Green Version]
- Della Pepa, G.M.; Ius, T.; Menna, G.; La Rocca, G.; Battistella, C.; Rapisarda, A.; Mazzucchi, E.; Pignotti, F.; Alexandre, A.; Marchese, E.; et al. “Dark corridors” in 5-ALA resection of high-grade gliomas: Combining fluorescence-guided surgery and contrast-enhanced ultrasonography to better explore the surgical field. J. Neurosurg. Sci. 2019, 63, 688–696. [Google Scholar] [CrossRef] [PubMed]
- Stylli, S.S. Novel Treatment Strategies for Glioblastoma. Cancers 2020, 12, 2883. [Google Scholar] [CrossRef] [PubMed]
- Rajaratnam, V.; Islam, M.M.; Yang, M.; Slaby, R.; Ramirez, H.M.; Mirza, S.P. Glioblastoma: Pathogenesis and Current Status of Chemotherapy and Other Novel Treatments. Cancers 2020, 12, 937. [Google Scholar] [CrossRef] [PubMed] [Green Version]
- Liao, W.; Fan, S.; Zheng, Y.; Liao, S.; Xiong, Y.; Li, Y.; Liu, J. Recent Advances on Glioblastoma Multiforme and Nano-drug Carriers: A Review. Curr. Med. Chem. 2019, 26, 5862–5874. [Google Scholar] [CrossRef] [PubMed]
- Bagley, S.J.; Desai, A.S.; Linette, G.P.; June, C.H.; O’Rourke, D.M. CAR T-cell therapy for glioblastoma: Recent clinical advances and future challenges. Neuro Oncol. 2018, 20, 1429–1438. [Google Scholar] [CrossRef] [Green Version]
- Dhermain, F. Radiotherapy of high-grade gliomas: Current standards and new concepts, innovations in imaging and radiotherapy, and new therapeutic approaches. Chin. J. Cancer 2014, 33, 16–24. [Google Scholar] [CrossRef] [PubMed]
- Tan, A.C.; Ashley, D.M.; López, G.Y.; Malinzak, M.; Friedman, H.S.; Khasraw, M. Management of glioblastoma: State of the art and future directions. CA Cancer J. Clin. 2020, 70, 299–312. [Google Scholar] [CrossRef]
- Martínez-Garcia, M.; Álvarez-Linera, J.; Carrato, C.; Ley, L.; Luque, R.; Maldonado, X.; Martínez-Aguillo, M.; Navarro, L.M.; Vaz-Salgado, M.A.; Gil-Gil, M. SEOM clinical guidelines for diagnosis and treatment of glioblastoma (2017). Clin. Transl. Oncol. 2018, 20, 22–28. [Google Scholar] [CrossRef] [Green Version]
- Salama, G.R.; Heier, L.A.; Patel, P.; Ramakrishna, R.; Magge, R.; Tsiouris, A.J. Diffusion Weighted/Tensor Imaging, Functional MRI and Perfusion Weighted Imaging in Glioblastoma-Foundations and Future. Front Neurol. 2017, 8, 660. [Google Scholar] [CrossRef] [Green Version]
- Metz, M.C.; Molina-Romero, M.; Lipkova, J.; Gempt, J.; Liesche-Starnecker, F.; Eichinger, P.; Grundl, L.; Menze, B.; Combs, S.E.; Zimmer, C.; et al. Predicting Glioblastoma Recurrence from Preoperative MR Scans Using Fractional-Anisotropy Maps with Free-Water Suppression. Cancers 2020, 12, 728. [Google Scholar] [CrossRef] [Green Version]
- Jin, Y.; Randall, J.W.; Elhalawani, H.; Feghali, K.A.A.; Elliott, A.M.; Anderson, B.M.; Lacerda, L.; Tran, B.L.; Mohamed, A.S.; Brock, K.K.; et al. Detection of Glioblastoma Subclinical Recurrence Using Serial Diffusion Tensor Imaging. Cancers 2020, 12, 568. [Google Scholar] [CrossRef] [Green Version]
- Zikou, A.; Sioka, C.; Alexiou, G.A.; Fotopoulos, A.; Voulgaris, S.; Argyropoulou, M.I. Radiation Necrosis, Pseudoprogression, Pseudoresponse, and Tumor Recurrence: Imaging Challenges for the Evaluation of Treated Gliomas. Contrast Media Mol. Imaging 2018, 2018, 6828396. [Google Scholar] [CrossRef]
- van Dijken, B.R.J.; van Laar, P.J.; Holtman, G.A.; van der Hoorn, A. Diagnostic accuracy of magnetic resonance imaging techniques for treatment response evaluation in patients with high-grade glioma, a systematic review and meta-analysis. Eur. Radiol. 2017, 27, 4129–4144. [Google Scholar] [CrossRef] [Green Version]
- Patel, P.; Baradaran, H.; Delgado, D.; Askin, G.; Christos, P.; John Tsiouris, A.; Gupta, A. MR perfusion-weighted imaging in the evaluation of high-grade gliomas after treatment: A systematic review and meta-analysis. Neuro Oncol. 2017, 19, 118–127. [Google Scholar] [CrossRef] [Green Version]
- Akbari, H.; Rathore, S.; Bakas, S.; Nasrallah, M.P.; Shukla, G.; Mamourian, E.; Rozycki, M.; Bagley, S.J.; Rudie, J.D.; Flanders, A.E.; et al. Histopathology-validated machine learning radiographic biomarker for noninvasive discrimination between true progression and pseudo-progression in glioblastoma. Cancer 2020, 126, 2625–2636. [Google Scholar] [CrossRef] [PubMed]
- Parvez, K.; Parvez, A.; Zadeh, G. The diagnosis and treatment of pseudoprogression, radiation necrosis and brain tumor recurrence. Int. J. Mol. Sci. 2014, 15, 11832–11846. [Google Scholar] [CrossRef] [Green Version]
- Wang, S.; Martinez-Lage, M.; Sakai, Y.; Chawla, S.; Kim, S.G.; Alonso-Basanta, M.; Lustig, R.A.; Brem, S.; Mohan, S.; Wolf, R.L.; et al. Differentiating Tumor Progression from Pseudoprogression in Patients with Glioblastomas Using Diffusion Tensor Imaging and Dynamic Susceptibility Contrast MRI. AJNR Am. J. Neuroradiol. 2016, 37, 28–36. [Google Scholar] [CrossRef] [Green Version]
- Alifieris, C.; Trafalis, D.T. Glioblastoma multiforme: Pathogenesis and treatment. Pharmacol. Ther. 2015, 152, 63–82. [Google Scholar] [CrossRef]
- Siu, A.; Wind, J.J.; Iorgulescu, J.B.; Chan, T.A.; Yamada, Y.; Sherman, J.H. Radiation necrosis following treatment of high grade glioma—A review of the literature and current understanding. Acta Neurochir. 2012, 154, 191–201. [Google Scholar] [CrossRef] [PubMed]
- Shukla, G.; Alexander, G.S.; Bakas, S.; Nikam, R.; Talekar, K.; Palmer, J.D.; Shi, W. Advanced magnetic resonance imaging in glioblastoma: A review. Chin. Clin. Oncol. 2017, 6, 40. [Google Scholar] [CrossRef] [PubMed] [Green Version]
- Lundy, P.; Domino, J.; Ryken, T.; Fouke, S.; McCracken, D.J.; Ormond, D.R.; Olson, J.J. The role of imaging for the management of newly diagnosed glioblastoma in adults: A systematic review and evidence-based clinical practice guideline update. J. Neuro-Oncol. 2020, 150, 95–120. [Google Scholar] [CrossRef] [PubMed]
- Strauss, S.B.; Meng, A.; Ebani, E.J.; Chiang, G.C. Imaging Glioblastoma Posttreatment: Progression, Pseudoprogression, Pseudoresponse, Radiation Necrosis. Radiol. Clin. N. Am. 2019, 57, 1199–1216. [Google Scholar] [CrossRef]
- Ellingson, B.M.; Chung, C.; Pope, W.B.; Boxerman, J.L.; Kaufmann, T.J. Pseudoprogression, radionecrosis, inflammation or true tumor progression? challenges associated with glioblastoma response assessment in an evolving therapeutic landscape. J. Neuro-Oncol. 2017, 134, 495–504. [Google Scholar] [CrossRef] [Green Version]
- Louis, D.N.; Perry, A.; Reifenberger, G.; von Deimling, A.; Figarella-Branger, D.; Cavenee, W.K.; Ohgaki, H.; Wiestler, O.D.; Kleihues, P.; Ellison, D.W. The 2016 World Health Organization Classification of Tumors of the Central Nervous System: A summary. Acta Neuropathol. 2016, 131, 803–820. [Google Scholar] [CrossRef] [Green Version]
- Okada, H.; Weller, M.; Huang, R.; Finocchiaro, G.; Gilbert, M.R.; Wick, W.; Ellingson, B.M.; Hashimoto, N.; Pollack, I.F.; Brandes, A.A.; et al. Immunotherapy response assessment in neuro-oncology: A report of the RANO working group. Lancet Oncol. 2015, 16, e534–e542. [Google Scholar] [CrossRef] [Green Version]
- Thust, S.C.; Heiland, S.; Falini, A.; Jäger, H.R.; Waldman, A.D.; Sundgren, P.C.; Godi, C.; Katsaros, V.K.; Ramos, A.; Bargallo, N.; et al. Glioma imaging in Europe: A survey of 220 centres and recommendations for best clinical practice. Eur. Radiol. 2018, 28, 3306–3317. [Google Scholar] [CrossRef] [PubMed] [Green Version]
- Cha, J.; Kim, S.T.; Kim, H.J.; Kim, B.J.; Kim, Y.K.; Lee, J.Y.; Jeon, P.; Kim, K.H.; Kong, D.S.; Nam, D.H. Differentiation of tumor progression from pseudoprogression in patients with posttreatment glioblastoma using multiparametric histogram analysis. AJNR Am. J. Neuroradiol. 2014, 35, 1309–1317. [Google Scholar] [CrossRef] [PubMed] [Green Version]
- Di Costanzo, A.; Scarabino, T.; Trojsi, F.; Popolizio, T.; Bonavita, S.; de Cristofaro, M.; Conforti, R.; Cristofano, A.; Colonnese, C.; Salvolini, U.; et al. Recurrent glioblastoma multiforme versus radiation injury: A multiparametric 3-T MR approach. La Radiol. Med. 2014, 119, 616–624. [Google Scholar] [CrossRef] [PubMed]
- Kong, D.S.; Kim, S.T.; Kim, E.H.; Lim, D.H.; Kim, W.S.; Suh, Y.L.; Lee, J.I.; Park, K.; Kim, J.H.; Nam, D.H. Diagnostic dilemma of pseudoprogression in the treatment of newly diagnosed glioblastomas: The role of assessing relative cerebral blood flow volume and oxygen-6-methylguanine-DNA methyltransferase promoter methylation status. AJNR Am. J. Neuroradiol. 2011, 32, 382–387. [Google Scholar] [CrossRef] [PubMed] [Green Version]
- Hygino da Cruz, L.C., Jr.; Rodriguez, I.; Domingues, R.C.; Gasparetto, E.L.; Sorensen, A.G. Pseudoprogression and pseudoresponse: Imaging challenges in the assessment of posttreatment glioma. AJNR Am. J. Neuroradiol. 2011, 32, 1978–1985. [Google Scholar] [CrossRef] [PubMed] [Green Version]
- Song, Y.S.; Choi, S.H.; Park, C.-K.; Yi, K.S.; Lee, W.J.; Yun, T.J.; Kim, T.M.; Lee, S.-H.; Kim, J.-H.; Sohn, C.-H.; et al. True progression versus pseudoprogression in the treatment of glioblastomas: A comparison study of normalized cerebral blood volume and apparent diffusion coefficient by histogram analysis. Korean J. Radiol. 2013, 14, 662–672. [Google Scholar] [CrossRef] [Green Version]
- Prager, A.J.; Martinez, N.; Beal, K.; Omuro, A.; Zhang, Z.; Young, R.J. Diffusion and perfusion MRI to differentiate treatment-related changes including pseudoprogression from recurrent tumors in high-grade gliomas with histopathologic evidence. AJNR Am. J. Neuroradiol. 2015, 36, 877–885. [Google Scholar] [CrossRef] [PubMed]
- Kim, J.Y.; Park, J.E.; Jo, Y.; Shim, W.H.; Nam, S.J.; Kim, J.H.; Yoo, R.-E.; Choi, S.H.; Kim, H.S. Incorporating diffusion- and perfusion-weighted MRI into a radiomics model improves diagnostic performance for pseudoprogression in glioblastoma patients. Neuro Oncol. 2019, 21, 404–414. [Google Scholar] [CrossRef]
- Elshafeey, N.; Kotrotsou, A.; Hassan, A.; Elshafei, N.; Hassan, I.; Ahmed, S.; Abrol, S.; Agarwal, A.; El Salek, K.; Bergamaschi, S.; et al. Multicenter study demonstrates radiomic features derived from magnetic resonance perfusion images identify pseudoprogression in glioblastoma. Nat. Commun. 2019, 10, 3170. [Google Scholar] [CrossRef] [PubMed] [Green Version]
- Ismail, M.; Hill, V.; Statsevych, V.; Huang, R.; Prasanna, P.; Correa, R.; Singh, G.; Bera, K.; Beig, N.; Thawani, R.; et al. Shape Features of the Lesion Habitat to Differentiate Brain Tumor Progression from Pseudoprogression on Routine Multiparametric MRI: A Multisite Study. AJNR Am. J. Neuroradiol. 2018, 39, 2187–2193. [Google Scholar] [CrossRef] [PubMed] [Green Version]
- Brown, T.J.; Brennan, M.C.; Li, M.; Church, E.W.; Brandmeir, N.J.; Rakszawski, K.L.; Patel, A.S.; Rizk, E.B.; Suki, D.; Sawaya, R.; et al. Association of the Extent of Resection With Survival in Glioblastoma: A Systematic Review and Meta-analysis. JAMA Oncol. 2016, 2, 1460–1469. [Google Scholar] [CrossRef] [PubMed] [Green Version]
- Vollmann-Zwerenz, A.; Leidgens, V.; Feliciello, G.; Klein, C.A.; Hau, P. Tumor Cell Invasion in Glioblastoma. Int. J. Mol. Sci. 2020, 21, 1932. [Google Scholar] [CrossRef] [PubMed] [Green Version]
- Earnest, F.t.; Kelly, P.J.; Scheithauer, B.W.; Kall, B.A.; Cascino, T.L.; Ehman, R.L.; Forbes, G.S.; Axley, P.L. Cerebral astrocytomas: Histopathologic correlation of MR and CT contrast enhancement with stereotactic biopsy. Radiology 1988, 166, 823–827. [Google Scholar] [CrossRef] [PubMed]


| 1.5 T | Contrast-Enhanced T1 MP-RAGE | DWI | DSC Perfusion with Leakage Correction |
|---|---|---|---|
| TR (ms) | 2200 | 7600 | 2010 |
| TE (ms) | 2.67 | 86 | 30 |
| flip angle (°) | 8 | - | 90 |
| FOV (mm2) | 250 | 230 | 230 |
| matrix (pixel) | 256 × 256 | 324 × 372 | 128 × 128 |
| voxel size (mm) | 1.0 × 1.0 × 1.0 | 1.2 × 1.2 × 5 | 1.8 × 1.8 × 3 |
| acquisition time (min) | 4:59 | 1:25 | 1:48 |
| 3 T | |||
| TR (ms) | 1900 | 6600 | 1840 |
| TE (ms) | 3.16 | 95 | 32 |
| flip angle (°) | 9 | - | 90 |
| FOV (mm2) | 270 | 230 | 230 |
| matrix (pixel) | 320 × 320 | 180 × 180 | 128 × 128 |
| voxel size (mm) | 0.8 × 0.8 × 0.8 | 1.3 × 1.3 × 3 | 1.8 × 1.8 × 3 |
| acquisition time (min) | 4:09 | 1:41 | 1:39 |
| No. | Age | Gender | Tumor Resection (Month/Year) | Resection Status | IDH1 Mutation | MGMT Promotor Methylation | Radiotherapy (Month/Year) | Occurrence of New Contrast-Enhancing Lesion | Period from Radiotherapy to Occurrence of New Contrast-Enhancing Lesion (months) |
|---|---|---|---|---|---|---|---|---|---|
| glioblastoma | |||||||||
| 1 | 40 | male | 01/2015 | R0 | unknown | methylation | 02/2015–03/2015 | 10/2015 | 7 |
| 2 | 46 | male | 11/2012 | R0 | unknown | unknown | 12/2012–02/2013 | 01/2014 | 11 |
| 3 | 55 | male | 09/2013 | R0 | no | unknown | 11/2013–12/2013 | 06/2016 | 30 |
| 4 | 57 | male | 07/2016 | R0 | no | no methylation | 08/2016–09/2016 | 09/2017 | 12 |
| 5 | 57 | male | 03/2017 | R0 | no | unknown | 04/2017–06/2017 | 10/2017 | 4 |
| 6 | 59 | male | 02/2018 | R0 | no | no methylation | 03/2018–05/2018 | 11/2018 | 6 |
| 7 | 60 | male | 03/2014 | R0 | no | unknown | 11/2014–12/2014 | 05/2018 | 41 |
| 8 | 60 | male | 02/2014 | R0 | no | unknown | 03/2014–05/2014 | 01/2019 | 56 |
| 9 | 61 | female | 11/2015 | R2 | no | unknown | 11/2015–01/2016 | 12/2016 | 11 |
| 10 | 61 | female | 02/2013 | R0 | no | methylation | 03/2013–04/2013 | 05/2016 | 37 |
| 11 | 64 | male | 01/2015 | R2 | no | unknown | 02/2015–03/2015 | 06/2016 | 15 |
| 12 | 67 | male | 08/2018 | R0 | no | methylation | 08/2018–09/2018 | 10/2018 | 1 |
| 13 | 69 | female | 01/2014 | R0 | unknown | unknown | 03/2014–04/2014 | 01/2015 | 9 |
| 14 | 73 | male | 12/2016 | R0 | no | unknown | 01/2017–02/2017 | 08/2017 | 6 |
| 15 | 73 | male | 10/2015 | R0 | no | unknown | 11/2015–12/2015 | 06/2017 | 18 |
| 16 | 74 | male | 07/2018 | R0 | no | no methylation | 07/2018–09/2018 | 04/2019 | 7 |
| 17 | 80 | male | 12/2013 | R0 | no | unknown | 02/2014–03/2014 | 10/2015 | 19 |
| treatment-related changes | |||||||||
| 1 | 39 | female | 05/2015 | R0 | unknown | unknown | 06/2015–07/2015 | 01/2018 | 30 |
| 2 | 40 | male | 06/2016 | R0 | mutation | unknown | 07/2016–08/2016 | 03/2018 | 19 |
| 3 | 43 | male | 07/2010 | R0 | mutation | methylation | 07/2010–09/2010; 11/2014 | 05/2016 | 18 |
| 4 | 45 | male | 03/2007 | R0 | mutation | unknown | 04/2007–06/2007; 09/2015 | 07/2016 | 10 |
| 5 | 53 | male | 11/2011 | R2 | mutation | unknown | 06/2015–08/2015 | 10/2015 | 2 |
| 6 | 53 | male | 09/2012 | R0 | unknown | unknown | 10/2012–11/2012 | 04/2017 | 53 |
| 7 | 57 | female | 09/2012 | R0 | unknown | unknown | 10/2012–11/2012 | 12/2012 | 1 |
| 8 | 63 | female | 05/2017 | R0 | no | unknown | 06/2017–07/2017 | 02/2018 | 7 |
| 9 | 64 | female | 10/2006 | R2 | unknown | unknown | 11/2006–12/2006 | 10/2018 | 142 |
| 10 | 65 | male | 03/2018 | R0 | no | unknown | 04/2018–05/2018 | 07/2018 | 2 |
| 11 | 66 | male | 06/2017 | R0 | no | unknown | 07/2017–08/2017 | 12/2018 | 16 |
| 12 | 68 | female | 08/2014 | R0 | no | unknown | 09/2014–11/2014 | 03/2017 | 28 |
| 13 | 76 | male | 05/2018 | R0 | no | unknown | 07/2018–08/2018 | 10/2018 | 2 |
| 14 | 80 | male | 12/2016 | R0 | no | methylation | 01/2017–02/2017 | 06/2017 | 4 |
| 15 | 82 | female | 10/2017 | R0 | no | no methylation | 11/2017–12/2017 | 05/2018 | 5 |
| 16 | 85 | male | 05/2016 | R0 | no | methylation | 06/2016–07/2016 | 09/2016 | 2 |
| 17 | 87 | female | 10/2013 | R0 | unknown | unknown | 11/2013–12/2013 | 01/2015 | 13 |
| IDH1 = isocitrate dehydrogenase 1; MGMT = O6-methylguanine-DNA methyltransferase | |||||||||
| GBM | TRC | p-Value | AUC | |
|---|---|---|---|---|
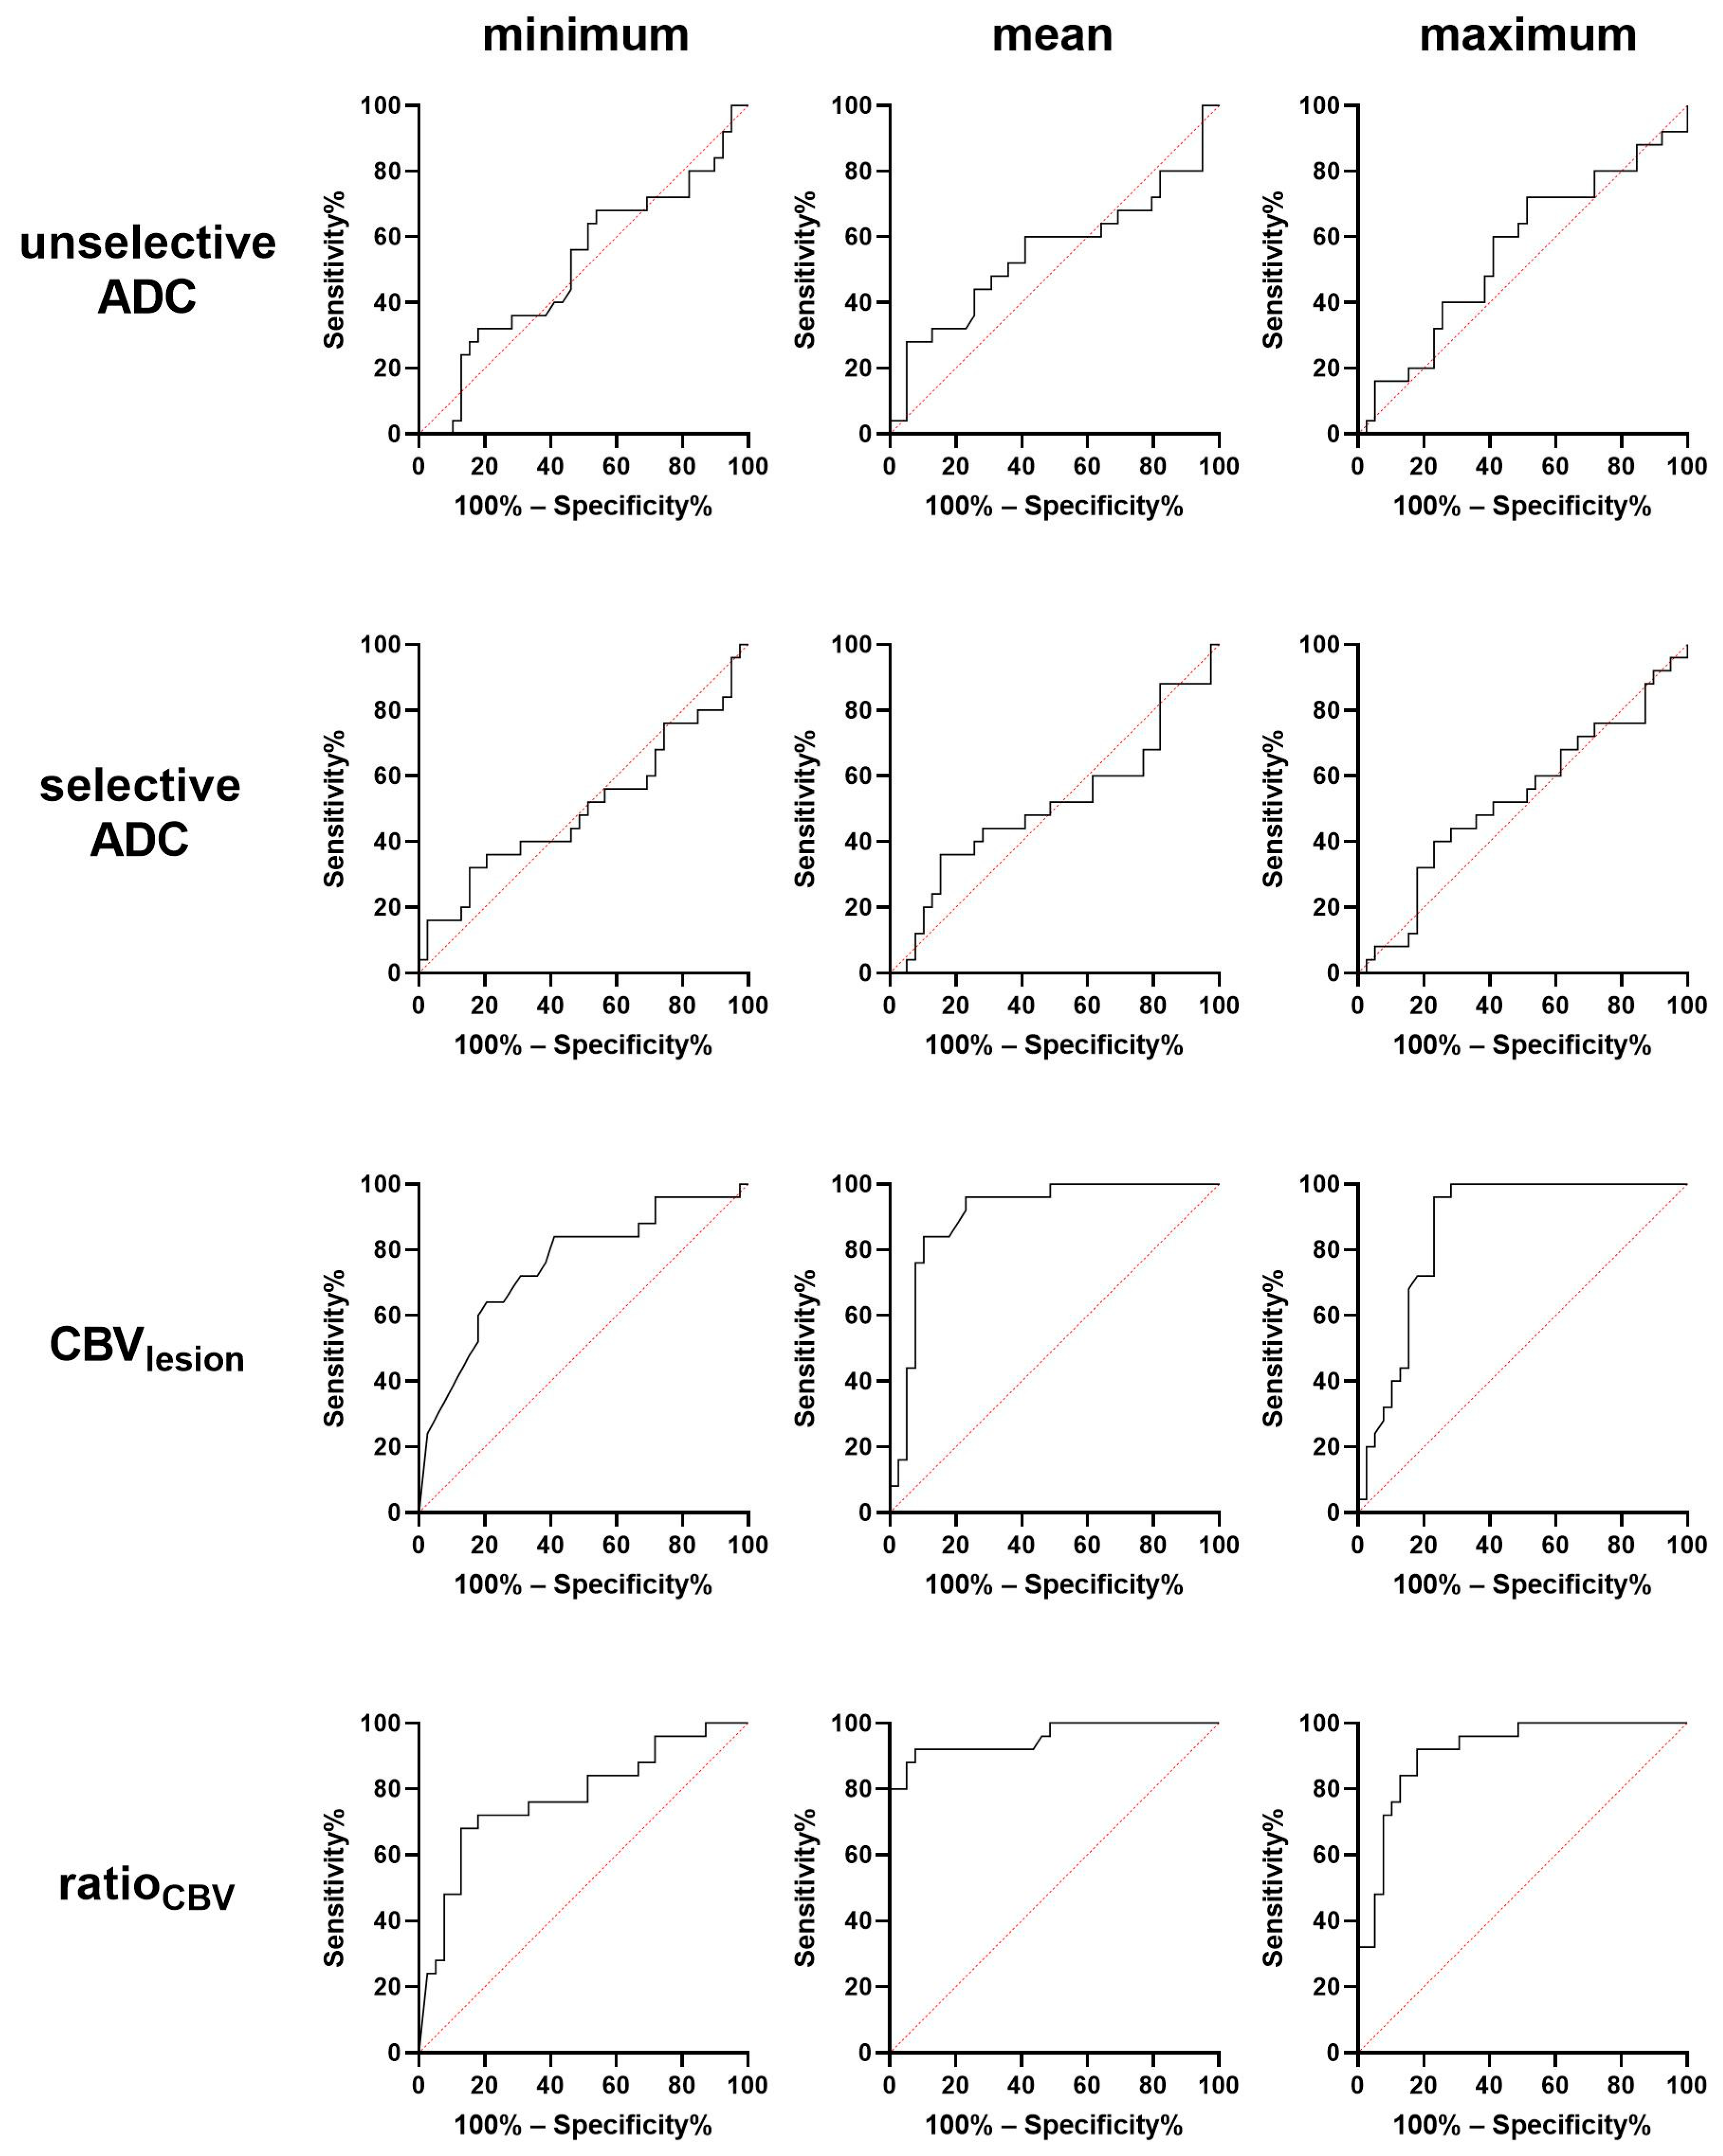
| selective minimum ADC | 955.0 ± 57.6 | 997.5 ± 75.8 | 0.5861 | 0.557 |
| selective maximum ADC | 1620 ± 84.9 | 1546 ± 93.8 | 0.5644 | 0.554 |
| selective mean ADC | 1254 ± 42 | 1261 ± 73.7 | 0.9326 | 0.512 |
| unselective minimum ADC | 696.7 ± 75.8 | 820.9 ± 63.1 | 0.2167 | 0.614 |
| unselective maximum ADC | 2257 ± 94.2 | 2072 ± 133.5 | 0.2054 | 0.630 |
| unselective mean ADC | 1335 ± 39.9 | 1355 ± 76.6 | 0.8205 | 0.523 |
| GBM | TRC | p-Value | AUC | |
|---|---|---|---|---|
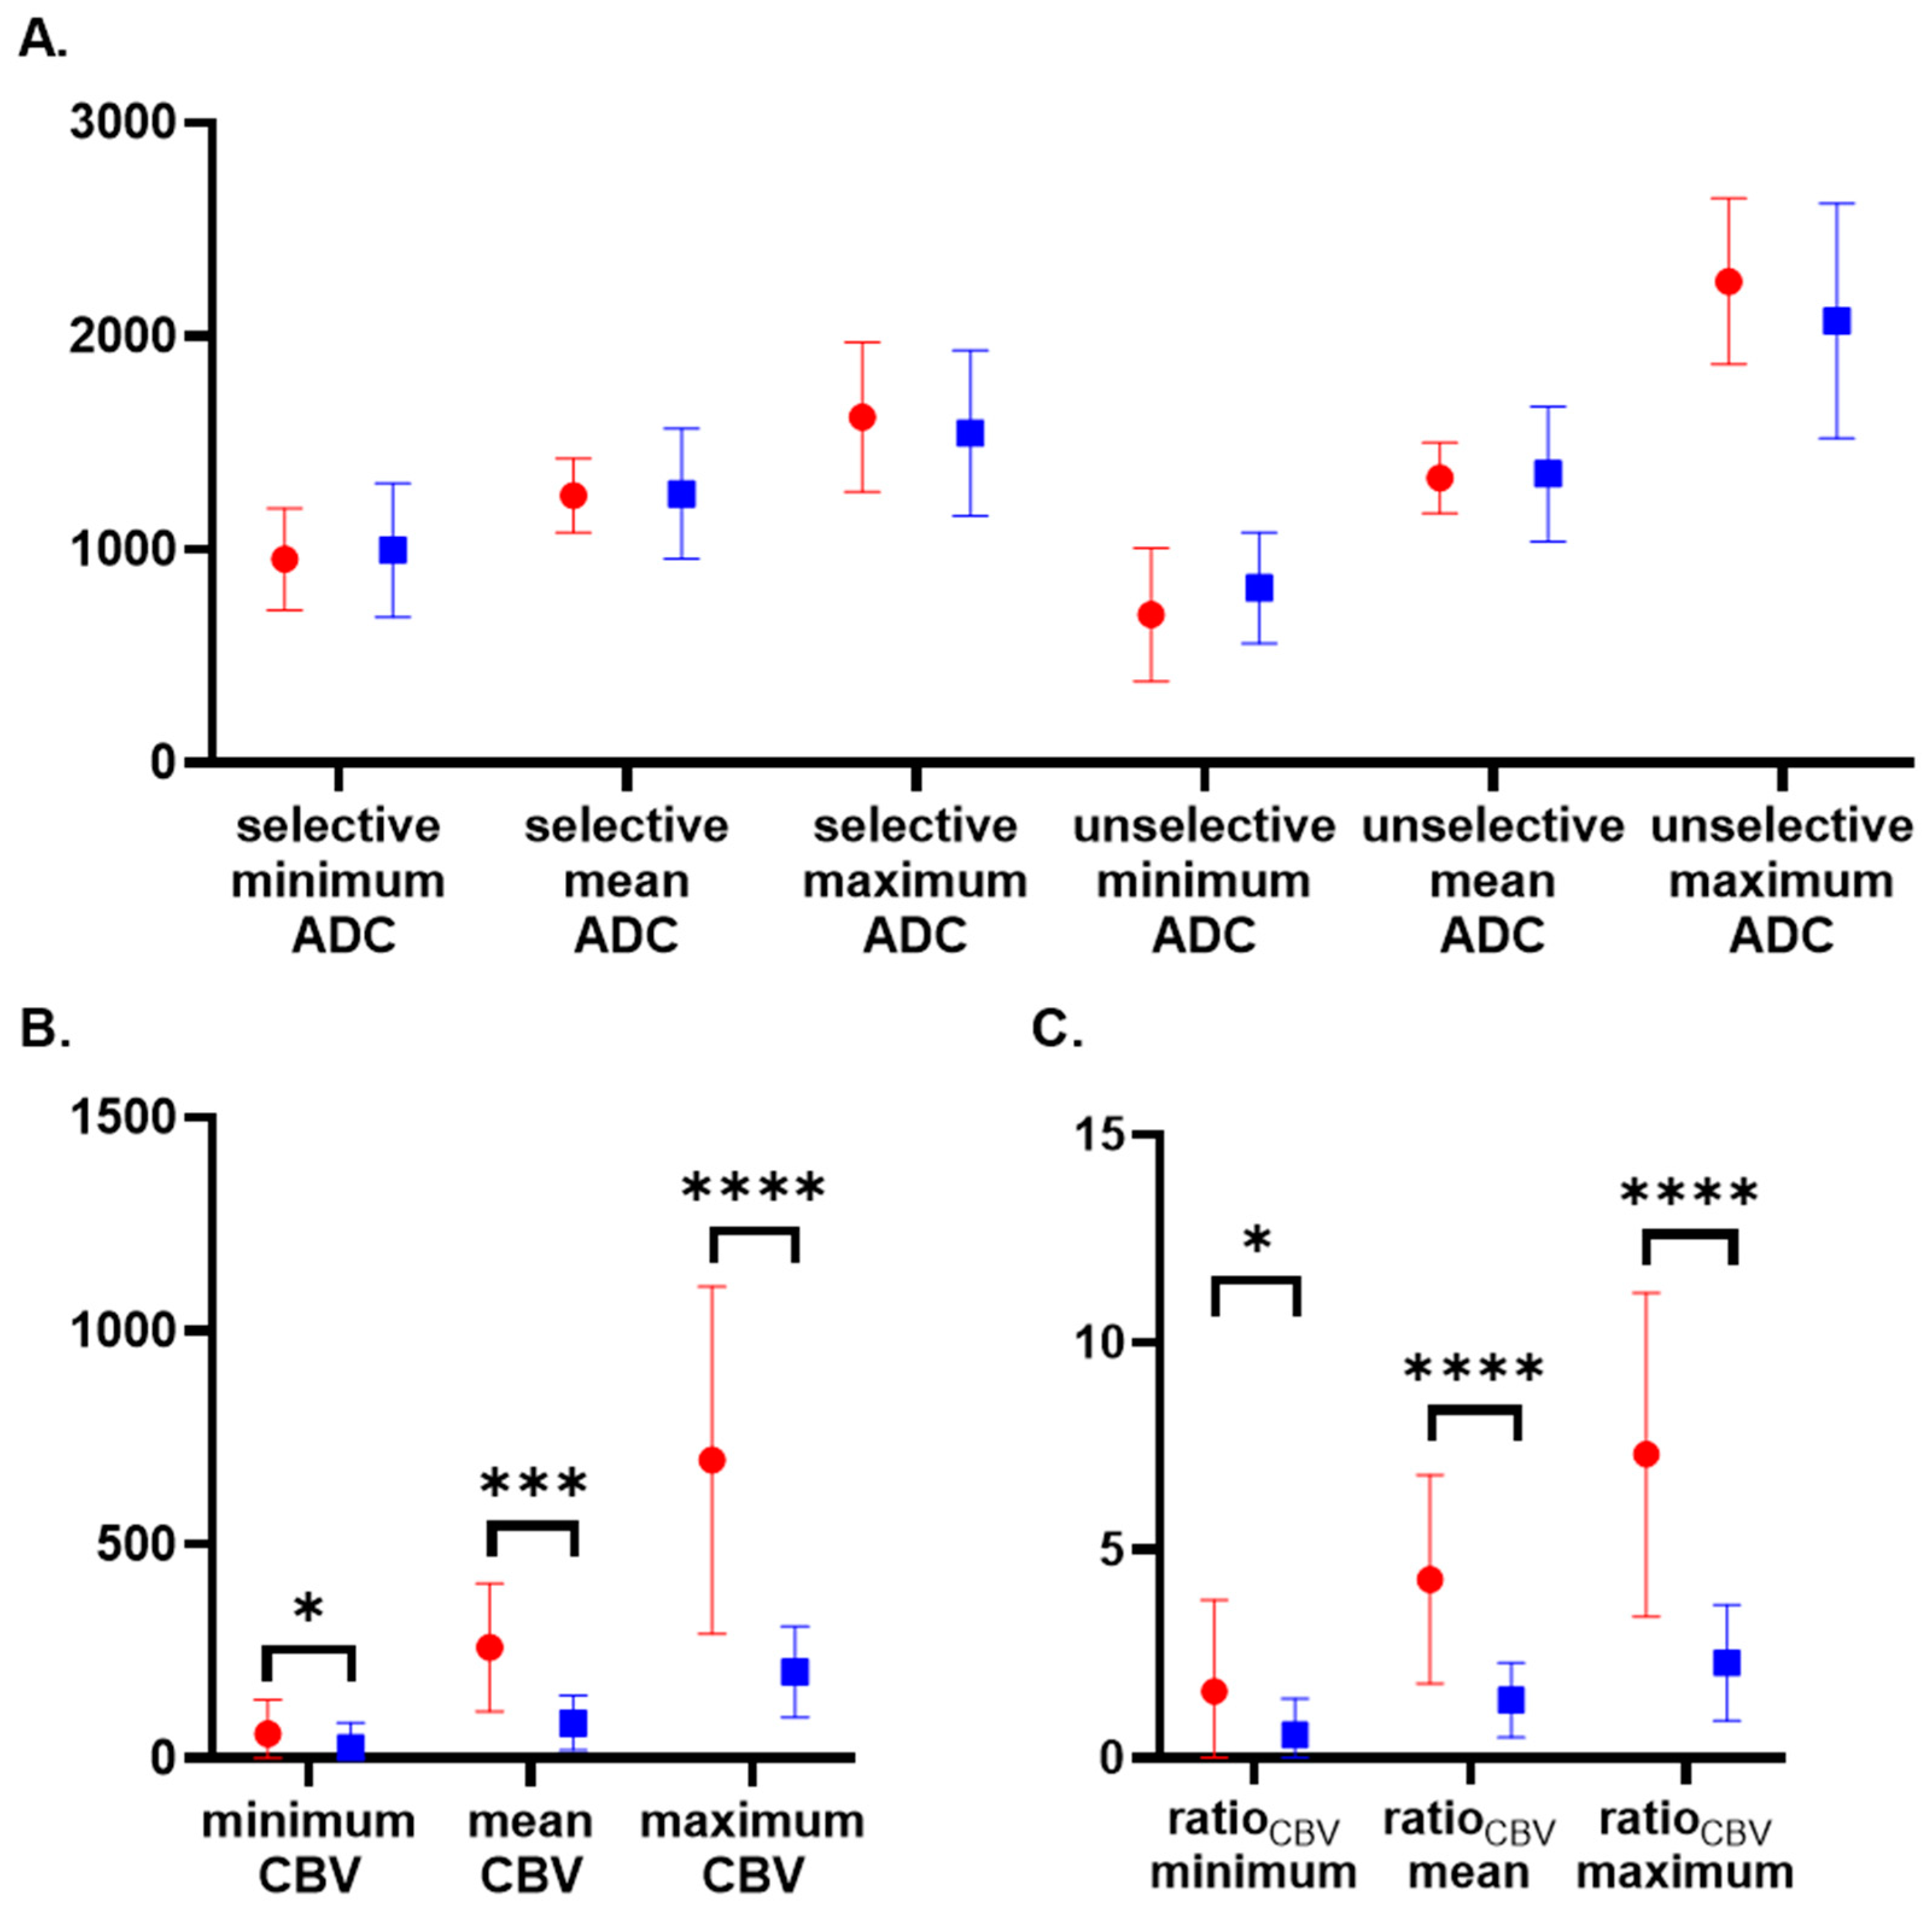
| minimum CBVlesion | 57.7 ± 80.6 | 25.3 ± 59.5 | 0.0391 (*) | 0.706 |
| mean CBVlesion | 260.6 ± 150 | 83.5 ± 64 | 0.0003 (***) | 0.851 |
| maximum CBVlesion | 698 ± 406.5 | 202.9 ± 105.9 | <0.0001 (****) | 0.8737 |
| ratioCBV minimum | 1.6 ± 2.2 | 0.55 ± 0.88 | 0.0169 (*) | 0.737 |
| ratioCBV mean | 4.3 ± 2.6 | 1.4 ± 0.9 | <0.0001 (****) | 0.917 |
| ratioCBV maximum | 7.3 ± 3.9 | 2.3 ± 1.4 | <0.0001 (****) | 0.917 |
| minimum CBVunaffected | 36.7 ± 26.9 | 44.1 ± 49.4 | 0.8717 | 0.517 |
| mean CBVunaffected | 62.9 ± 7.6 | 72.2 ± 14.3 | 0.7660 | 0.531 |
| maximum CBVunaffected | 94.9 ± 40.1 | 108.6 ± 76.5 | 0.9927 | 0.502 |
| Cut-off | Correctly Classified (%) | Identified Recurrent GBM (%) | Identified TRC (%) | |
|---|---|---|---|---|
| CBVminimum | 8.5 | 68 | 12 of 17 (71%) | 11 of 17 (65%) |
| CBVmean | 116.5 | 82 | 14 of 17 (82%) | 14 of 17 (82%) |
| CBVmaximum | 327 | 85 | 14 of 17 (82%) | 15 of 17 (88%) |
| ratioCBV minimum | 0.17 | 74 | 15 of 17 (88%) | 10 of 17 (59%) |
| ratioCBV mean | 2.26 | 85 | 15 of 17 (88%) | 14 of 17 (82%) |
| ratioCBV maximum | 3.82 | 88 | 15 of 17 (88%) | 15 of 17 (88%) |
| multiparametric model | - | 88 | 16 of 17 (94%) | 14 of 17 (82%) |
Publisher’s Note: MDPI stays neutral with regard to jurisdictional claims in published maps and institutional affiliations. |
© 2021 by the authors. Licensee MDPI, Basel, Switzerland. This article is an open access article distributed under the terms and conditions of the Creative Commons Attribution (CC BY) license (https://creativecommons.org/licenses/by/4.0/).
Share and Cite
Eisenhut, F.; Engelhorn, T.; Arinrad, S.; Brandner, S.; Coras, R.; Putz, F.; Fietkau, R.; Doerfler, A.; Schmidt, M.A. A Comparison of Single- and Multiparametric MRI Models for Differentiation of Recurrent Glioblastoma from Treatment-Related Change. Diagnostics 2021, 11, 2281. https://doi.org/10.3390/diagnostics11122281
Eisenhut F, Engelhorn T, Arinrad S, Brandner S, Coras R, Putz F, Fietkau R, Doerfler A, Schmidt MA. A Comparison of Single- and Multiparametric MRI Models for Differentiation of Recurrent Glioblastoma from Treatment-Related Change. Diagnostics. 2021; 11(12):2281. https://doi.org/10.3390/diagnostics11122281
Chicago/Turabian StyleEisenhut, Felix, Tobias Engelhorn, Soheil Arinrad, Sebastian Brandner, Roland Coras, Florian Putz, Rainer Fietkau, Arnd Doerfler, and Manuel A. Schmidt. 2021. "A Comparison of Single- and Multiparametric MRI Models for Differentiation of Recurrent Glioblastoma from Treatment-Related Change" Diagnostics 11, no. 12: 2281. https://doi.org/10.3390/diagnostics11122281
APA StyleEisenhut, F., Engelhorn, T., Arinrad, S., Brandner, S., Coras, R., Putz, F., Fietkau, R., Doerfler, A., & Schmidt, M. A. (2021). A Comparison of Single- and Multiparametric MRI Models for Differentiation of Recurrent Glioblastoma from Treatment-Related Change. Diagnostics, 11(12), 2281. https://doi.org/10.3390/diagnostics11122281